Air Quality in Christchurch Airshed since 2021
Ingrid Mesman made this Official Information request to Canterbury Regional Council
The request was partially successful.
From: Ingrid Mesman
Dear Canterbury Regional Council,
The "Air Quality in the Canterbury Region" science snapshot updated 2021, states that "there were no exceedances of the NESAQ by motor vehicles in the 2017 to 2021 period.
I am requesting the following:-
a. The number of NESAQ exceedances by motor vehicles of NO2 in the Christchurch airshed for the years 2022 and 2023..
b. What are the daily averages of NO2 and CO2 levels in the Christchurch airshed and how do they compare with WHO guidelines for 2022 and 2023.
b. What are the number of days of high Pm10 and PM 2.5 from 2022 and 2023 from the Christchurch Airshed.
c. What are the BaP concentrations for 2022, and 2023 at the Christchurch airshed.
Yours faithfully,
Ingrid Mesman
From: Teresa Aberkane
Canterbury Regional Council
 Picture Device Independent Bitmap 1.jpg
52K
Download
 Picture Device Independent Bitmap 2.jpg
12K
Download
 Picture Device Independent Bitmap 3.jpg
12K
Download
 Picture Device Independent Bitmap 4.jpg
11K
Download
 Picture Device Independent Bitmap 5.jpg
38K
Download
 Picture Device Independent Bitmap 6.jpg
29K
Download
 Picture Device Independent Bitmap 7.jpg
36K
Download
 Picture Device Independent Bitmap 8.jpg
21K
Download
![]() Christchurch airshed 2022.pdf
Christchurch airshed 2022.pdf
860K
Download
View as HTML
Kia ora Ingrid
Thank you for reading the "Air Quality in the Canterbury Region" science
snapshot updated 2021.
The 2022 version will be available online in the next week or two, so I’ve
attached the Christchurch airshed pages from that report for you.
All the data we collect are available online. I’ll include the links to
various webpages so you can find more data whenever you need it.
In Christchurch we measure nitrogen dioxide (NO[2]) at two air monitoring
sites, one in a residential area ([1]St Albans EP) and the other beside a
busy road ([2]Riccarton Road).
We measure particles (PM[10] and PM[2.5]) at these same air monitoring
sites, as well as another in an industrial area in [3]Woolston.
Carbon monoxide (CO) is measured at the [4]Riccarton Road air monitoring
site only.
We don’t measure BaP continuously, and I’m not sure there is an instrument
that can do that. We have collected filter samples of particles over a
year. These were analysed at a laboratory to provide us with an annual
average concentration of BaP, along with 15 other polycyclic aromatic
hydrocarbons (PAH). In Christchurch this PAH study was last carried out in
2008 and there are currently no plans to repeat this.
Some specific answers to your questions follow:
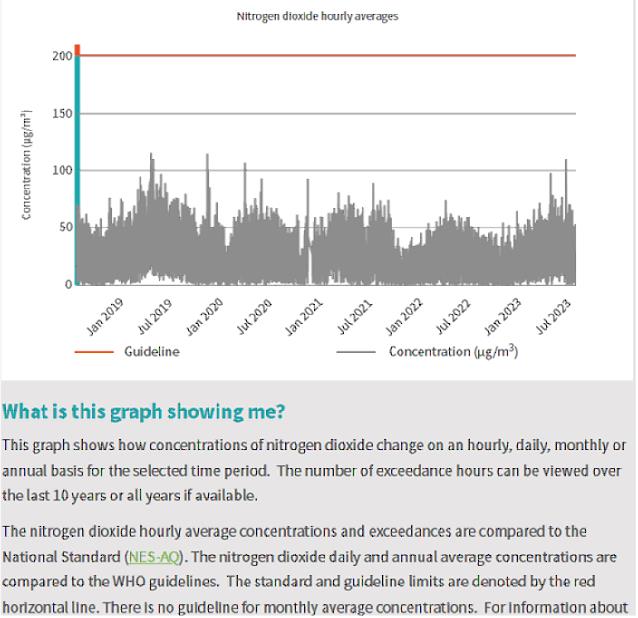
a. The number of NESAQ exceedances by motor vehicles of NO2 in the
Christchurch airshed for the years 2022 and 2023.
This is best answered by showing the concentrations of NO[2] measured at
the roadside site [5]Riccarton Road where there have been no exceedances
of the NESAQ for hour averages, as in this image below from LAWA.
b. What are the daily averages of NO2 and CO2 levels in the Christchurch
airshed and how do they compare with WHO guidelines for 2022 and 2023.
I’m assuming you mean carbon monoxide (CO) here, rather than CO[2]. There
is a NESAQ for eight hour average CO and a WHO guideline for 24 hour
average CO.
Daily averages of both NO[2] and CO are reported on LAWA from the roadside
site [6]Riccarton Road.
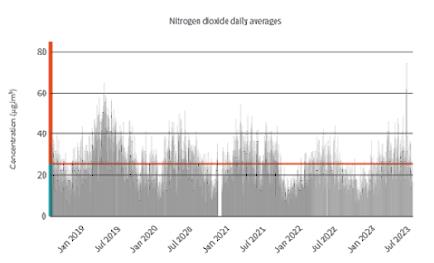
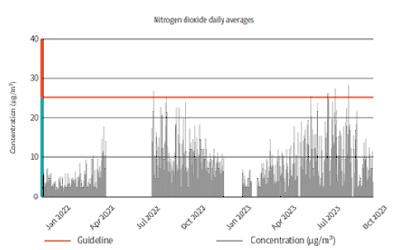
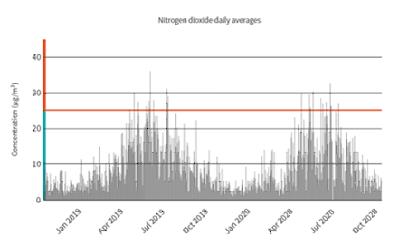
There have been many exceedances of the WHO daily guideline for NO[2] at
the Riccarton Road site, shown in the first graph below, and only a few at
the [7]St Albans EP air monitoring site, where monitoring started in 2022,
and the previous [8]St Albans site, shown with data in 2019 and 2020.
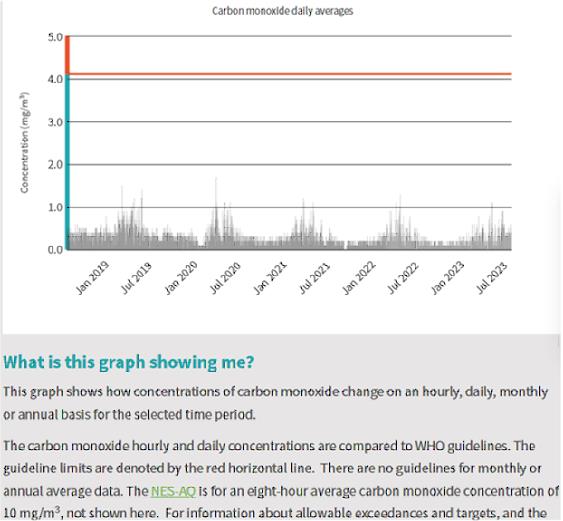
Carbon monoxide concentrations at the Riccarton Road air monitoring site
are shown in the next image, along with the WHO guideline of 4 mg/m^3.
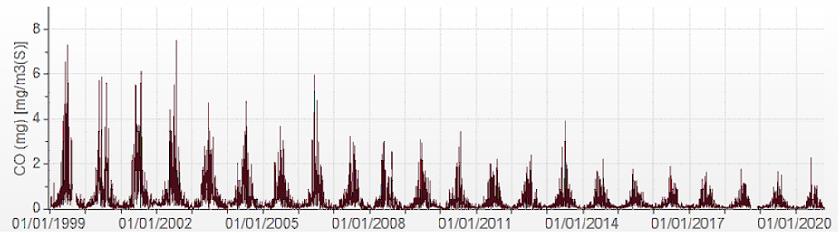
CO concentrations used to be higher in the past, with the graph below
showing 20 years of daily averages measured at the St Albans Coles Place
air monitoring station. This site was redeveloped and the monitoring
station was moved to [9]St Albans EP in 2022, but we no longer measure CO
in St Albans.
c. What are the number of days of high PM10 and PM2.5 from 2022 and 2023
from the Christchurch Airshed.
The number of days PM[10]>50 and PM[2.5] >15 can be found on LAWA ([10]St
Albans EP and [11]Woolston).
This [12]link has a table updated daily with yesterday’s PM concentration
and a running total of the number of days PM[10]>50 and PM[2.5] >25 for
the current calendar year.
This [13]link shows all the PM[10] exceedances in the last five years.
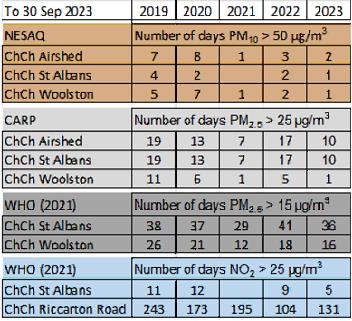
The table below summarises the number of daily averages exceeding various
standards and guidelines, including the National Environmental Standard
for Air Quality for PM[10], the Canterbury Air Regional Plan for PM[2.5],
and the PM[2.5] and NO[2] World Health Organisation air quality guidelines
that were updated in 2021.
There may be further exceedances of NO[2] at Riccarton Road over the next
few months, but there is unlikely to be an increase to the other
Christchurch 2023 numbers.
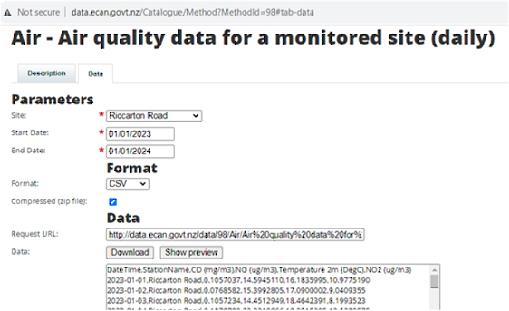
You can download data in the new year [14]here if you want an update on
NO[2] measured at the Riccarton Road site. An example of the form to
access data is shown in the image below.
d. What are the BaP concentrations for 2022, and 2023 at the Christchurch
airshed.
Not measured.
Please let me know if you require further information.
Ngâ mihi,
Teresa
Teresa Aberkane
Senior Science Analyst - Air Quality [15][IMG]
Environment Canterbury
Christchurch Office
PO Box 345, Christchurch 8140
+64 27 742 7280 Customer Services: 0800 324 636
[16][email address] 24 Hours: 0800 76 55 88
[17]ecan.govt.nz
[18][IMG] [19][IMG] [20][IMG]
[21][IMG]
show quoted sections
Things to do with this request
- Add an annotation (to help the requester or others)
- Download a zip file of all correspondence (note: this contains the same information already available above).

Offensive? Unsuitable?
Requests for personal information and vexatious requests are not considered valid requests for Official Information (read more).
If you believe this request is not suitable, you can report it for attention by the site administrators
Report this request