

DRAFT REPORT
Old Mangere Bridge Superstructure and
Pier Crosshead Beam Capacity Peer Review
0DUFK 2016

Contents
Purpose and Scope ....................................................................................................................................................... 4
Background ................................................................................................................................................................... 4
Assumptions on Condition and Loading ........................................................................................................................ 4
Assessment Methodology ............................................................................................................................................. 7
Longitudinal Girder Analysis Methodology.......................................................................................................................................... 7
Longitudinal Girder Capacity Checks ................................................................................................................................................... 8
Deck Load Transfer .............................................................................................................................................................................. 8
Pier Crosshead Beam Checks ............................................................................................................................................................... 9
Assessment Results ...................................................................................................................................................... 9
Longitudinal External Girder .............................................................................................................................................................. 10
Longitudinal Internal Girders ............................................................................................................................................................. 11
Longitudinal Central Internal Girder .................................................................................................................................................. 13
Pier Crosshead Beam ......................................................................................................................................................................... 13
Assessment Summary and Conclusions....................................................................................................................... 14
Recommendations ...................................................................................................................................................... 17
Revision #
Page 3 of 17

Purpose and Scope
The purpose of this report is to document the independent Peer Review of the numerical assessment of the
capacity of the Old Mangere Bridge. This assessment is limited to a review of the capacity of the
superstructure and pier crosshead beam only and is based on the information provided in the Old Mangere
Numerical Capacity Review Report produced by the AMA in January 2016. The assessment has been
performed generally in accordance with the requirements of the 3rd edition of the NZTA Bridge Manual.
Background
The Old Mangere Bridge has been in a deteriorated condition for a number of years and has been restricted
to pedestrian use since 1985. Strengthening works were undertaken between 2005 and 2011 with the
stated objective to provide adequate capacity for a 2.25kN/m2 live load. The bridge has since been subject
to regular inspections by the AMA in order to monitor its condition.
Recently visual inspections have observed a noticeable deterioration in condition of the Old Mangere
Bridge. The management strategy for the structure is therefore being reviewed and a full tactile principal
inspection was carried out by the AMA in December 2015 to catalogue the main structural defects. In
January 2016 the AMA performed a numerical assessment of the bridge superstructure in order to help
quantify the current load carrying capacity.
As an AMA NOP Beca has been requested to perform an independent Peer Review of the numerical
assessment of the bridge superstructure and pier crosshead beam. The review is based on the condition of
the structure as detailed in the Principal Inspection Report produced by the AMA in December 2015
together with further assessed information on reinforcement corrosion loss and loading provided by AMA.
This report documents the assumptions made about the condition of the structure, the assessment
methodology adopted and the results and conclusions of the assessment.
Assumptions on Condition and Loading
A number of assumptions have been made about the existing condition of the structure during the
numerical assessment. These assumptions are based on the original construction drawings for the structure
as supplied by the AMA and the condition described in the AMA report for the Principal Inspection carried
out in December 2015. In addition assumptions about material properties were made in accordance with
the 3rd Edition of the NZTA Bridge Manual. These assumptions are summarised below:
General Assumptions:
Concrete compressive strength from the original construction assumed to be 14MPa as per Section
7 of the NZTA Bridge Manual for structures built prior to 1932.
The concrete compressive strength of the retrofitted concrete slabs assumed to be 40MPa as per
the construction drawings for the retrofit.
Characteristic yield strength of reinforcing steel in the original construction assumed to be 210MPa
as per Section 7 of the NZTA Bridge Manual for structures built prior to 1932.
The characteristic yield strength of the reinforcing steel in the retrofitted concrete slabs assumed to
be 500MPa as per the construction drawings for the retrofit.
Bridge dead load is based on a unit weight of reinforced concrete of 24 kN/m3.
A 50mm surfacing layer was assumed to be present over the width between the two strips of
retrofitted concrete deck. The surfacing was assumed to have a unit weight of 24 kN/m3. No other
Revision #
Page 4 of 17

surfacing was assumed to be present on the structure.
Live load has been assumed as 3kPa as set out in the AMA numerical assessment report. This value
has not been further reviewed in this peer review.
Edge Girder Assumptions:
Edge girders were assumed to have a uniform width of 405mm (16”).
The depth was assumed to vary between 1830mm at the pier and 915mm at span quarter points.
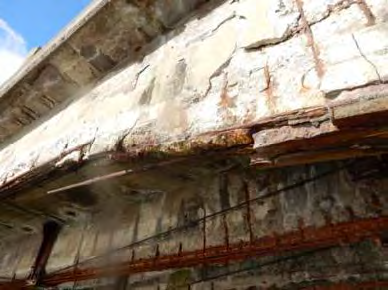
The full girder cross section was assumed to contribute to the girder dead load. 40mm cover from
each side face and 100mm from the bottom face was assumed to have spalled when calculating
girder capacity. This assumption was based on the photos from the Principal Inspection report such
as that in Figure 1 which shows extensive edge girder spalling.
The longitudinal reinforcement at the bottom of the haunched section of the beam was assumed to
be ineffective due to extensive corrosion and complete loss of bond to the concrete.
The three 1½” (38mm) straight longitudinal bars at the bottom of the unhaunched section continue
through the haunched region of the beam and were assumed to be fully effective through this
region but to have lost 50% of their section due to corrosion over the unhaunched region. (Based on
AMA’s rough assessment of 40-50% corrosion loss in the worst girders.)
The three 1½” (38mm) longitudinal bars at the top of the girder were assumed to be ineffective for
negative flexure due to short lap lengths over the piers.
The vertical reinforcement was assumed to be ineffective for shear capacity due to 100% corrosion
of the bottom of the bars.
One quarter (3.5DH25) of the longitudinal reinforcement in each of the retrofit deck strips was
assumed to resist hogging flexure from the adjacent edge girder. This assumption was checked as
detailed in the assessment methodology and results section.
Figure 1: Photo from principal inspection report showing extensive edge girder spalling.
Internal Girder Assumptions:
Internal girders were assumed to have uniform section size of 1220mmx305mm.
Revision #
Page 5 of 17

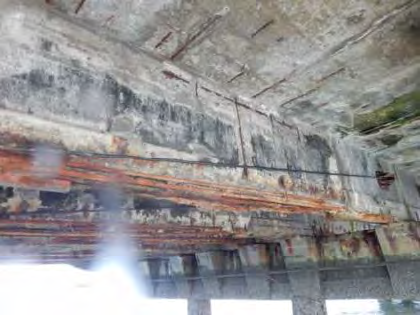
The full girder cross section was assumed to contribute to the girder dead load. 40mm cover from
each side face and 100mm from the bottom face was assumed to have spalled when calculating
girder capacity. This assumption was based on the photos from the Principal Inspection report such
as that in Figure 2 which shows extensive internal girder spalling.
The lower bottom layer of three 1½” (38mm) longitudinal bars was assumed to be ineffective due to
extensive corrosion and complete loss of bond to the concrete.
The upper bottom layer of three 1¼” (32mm) longitudinal bars was assumed to have lost 30% of
their section due to corrosion. (Based on AMA’s rough assessment of 20-30% corrosion loss in the
worst girders).
The three 1½” (38mm) longitudinal bars at the top of the girder were assumed to be ineffective for
negative flexure due to short lap lengths over the piers.
The vertical reinforcement was assumed to be ineffective for shear capacity due to 100% corrosion
of the bottom of the bars.
One quarter (3.5DH25) of the longitudinal reinforcement in each retrofit deck strip was assumed to
resist hogging flexure from each of six internal girders. For the two central internal girders only
1.75DH25 was considered to be effective. This assumption was checked as detailed in the
assessment methodology and results section.
The retrofitted external post-tensioning system was assumed to consist of two 15.2mm strands (one
each side of girder) with an ultimate tensile strength (UTS) of 250kN. The strands were assumed to
have a current force of 0.6UTS or 150kN/strand.
Figure 2: Photo from principal inspection report showing extensive spalling of internal girder.
Deck Section Assumptions:
The full deck cross section was considered to contribute to the dead load and to be effective in
terms of capacity.
Deck Transverse Reinforcement Assumptions:
Revision #
Page 6 of 17

These assumptions are based on a “best guess” of the original drawings.
Between the edge girder and the first internal girder it was assumed that two layers of ½” (12.7mm)
bars at 150mm spacing were effective for transferring longitudinal deck shear.
Between the central internal girder and the adjacent internal girder it was assumed that one layer of
½” (12.7mm) bars at 150mm spacing was effective for transferring longitudinal deck shear.
Deck Longitudinal Reinforcement Assumptions:
The original drawings appear to show some longitudinal reinforcement on the elevation but not on
the detailed cross section.
It is believed that some longitudinal reinforcement is present but no details are available and it has
not been included in this assessment.
Pier Crosshead Beam Assumptions:
Crosshead beams were assumed to have a uniform section size of 1220mmx560mm.
The full crosshead cross section was assumed to contribute to the crosshead beam dead load.
40mm cover from each side face and the bottom was assumed to have spalled when calculating
crosshead capacity. This assumption was based on evidence of spalling and delamination in the
Principal Inspection report.
Longitudinal reinforcement in the crosshead beam was assumed to consist of three 1 ½” (38mm)
bars at both the top and bottom of the section. These were assumed to be plain bars terminated
without hooks 100mm from each end face of the crosshead beam.
Vertical reinforcement in the crosshead beam was assumed to consist of three ¾” (19mm) half
round bars at 150mm centres along the beam. These bars were assumed be plain bars with no
anchorage to the longitudinal reinforcement and to rely on bond for development.
All reinforcement in the crosshead beam was assumed to have lost 20% of its cross section due to
corrosion.
Assessment Methodology
This assessment was carried out in accordance with the 3rd edition of the NZTA Bridge Manual. The
methodology adopted for the analysis and the capacity calculations is outlined in the following sections.
Longitudinal Girder Analysis Methodology
Loads for each girder were calculated on a contributory area basis. These loads were then applied to simple
two dimensional stick models of the individual girders.
The construction sequence involved placing the precast girders simply supported between the piers before
pouring a stitch between the girder ends and a concrete deck, making the structure continuous. This
sequence means that the girder dead load was applied to the simply supported structure while all loads
applied after the deck was completed were applied to the continuous structure. It is likely that the deck
dead load would have been applied to the structure while it was simply supported. Over time the demands
from the dead loads that were applied to the simply supported structure will have crept towards the
demands for a continuous structure. However for the superstructure to act as a continuous structure
sufficient continuity reinforcement is required. We understand that the structure has in fact performed in
this way and that cracking over the piers on the upper surface has not been evidenced. Therefore the
structure appears to be behaving as a continuous structure. We have made this assumption in our modelling
and it needs to be confirmed.
Because some of the loads were applied to a continuous structure while some were applied to a simply
Revision #
Page 7 of 17

supported structure two analysis models were created for each girder. The first model consisted of a single
15m long simply supported span while the second model consisted of a girder continuous over five 15m long
spans to approximate the fully continuous structure. The demands due to the superimposed dead load
(from balustrades and surfacing) and live load were taken from the continuous model only. Demands due to
the retrofit of the structure were also generated from the continuous models only. This included the dead
load from the concrete deck strips that were added as well as loads from the external post-tensioning. The
demands due to girder and deck dead load were calculated using both the simply supported and continuous
models. Demands were then calculated for two cases, one based on the dead load demands from the simply
supported model and one based on ‘50% creep’ so that the dead load demands were half way between
those from the simply supported and continuous models. It is likely that the demands are closer to the ‘50%
creep’ demands case.
This analysis methodology ignores any load sharing between the girders. To investigate the accuracy of this
assumption a comparison between the stiffness of the edge girder and the internal girders was performed.
This was done by applying a midspan point load to each model and comparing the deflections. This analysis
showed that the edge girder was 10% stiffer than the internal girders for a continuous model and 35% less
stiff for a simply supported girder model. This suggests that provided the girders behave continuously there
would be little load transfer between them. It was thus considered unnecessary to develop a more detailed
grillage model of the structure as the uncertainty in the material and member properties and condition
would limit the accuracy of such a model.
Longitudinal Girder Capacity Checks
Capacity checks were performed by applying a load factor of 1.0 to DL + LL and comparing against a
dependable capacity.
The girder capacity in flexure was calculated in accordance with NZS3101 for reinforced concrete beams.
Where the girder demands exceeded the capacity of the girder moment redistribution was considered. The
moment redistribution required in some of the assessed cases is significantly higher than the limit of 30%
redistribution in NZS 3101. This is further discussed below.
The girder capacity in shear was originally calculated in accordance with NZS3101 and found to be
inadequate. Therefore, as allowed by clause 7.4.2 of the NZTA Bridge Manual the shear capacity was
recalculated using the less conservative modified compression field theory. The requirements of the
AASHTO LRFD Bridge Design Specifications were adopted as this code is similar to the Canadian Code
specified in the NZTA Bridge Manual. When calculating the shear capacity to the AASHTO requirements the
contribution of the shear reinforcement was ignored as this steel was completely corroded at the bottom of
the girder and therefore was not adequately anchored below the longitudinal reinforcement. However,
because the reinforcement provided was twice the minimum shear reinforcement limit it was considered
adequate to limit the spacing of shear cracks and therefore contributed to the concrete shear capacity. An
additional shear capacity check was performed using BD44/15 which is a code specifically for analysis of
existing structures but which does not incorporate modified compression field theory.
Deck Load Transfer
When the structure was retrofitted two new strips of deck concrete were added that are continuous along
the full length of the bridge. The longitudinal reinforcement in these retrofitted strips was considered to
provide the tension reinforcement for hogging of all of the girders at the ultimate limit state. Only four
girders are located directly beneath the retrofitted width of deck. Therefore the capacity of the original deck
to transfer the demand from the other four girders to the reinforcement needed to be checked. This check
was performed using a strut and tie analysis to transfer the demands transversely through the deck. This is
Revision #
Page 8 of 17

essentially equivalent to performing a shear friction check on the deck for µ equal to 1.0. The required
reinforcement per metre was quantified based on the proportion of the total flexure developed in the metre
adjacent to the pier centreline.
The retrofit drawings show a significant amount of steel crossing the interface between the retrofitted strips
of deck and the original deck. The capacity of this interface was therefore assumed to be non-critical and has
not been assessed.
Pier Crosshead Beam Checks
Loads for each girder were calculated on a contributory area basis as for the girder checks. The girder end
shears were then applied to a two dimensional stick model of the crosshead beam as point loads. The
crosshead beam was modelled as a 13,700mm long beam continuous over four equally spaced piles. From
this model shear and flexural demands in the crosshead beam based on conventional beam theory were
calculated.
The capacity of the beam in flexure was calculated in accordance with NZS3101. As the longitudinal
reinforcement terminates at the ends of the beam an allowance was made for this by checking the flexural
capacity in this zone based on the peak demand within a distance of d + development length.
The capacity of the beam in shear was calculated in accordance with NZS3101. Due to the depth to span
ratio of the crosshead beam it is appropriate to model load transfer to the pile locations using a strut and tie
model in accordance with NZS3101 rather than conventional beam theory. The demand distribution for the
strut and tie models was based on the shear forces calculated using conventional beam theory.
NZS3101 does not provide explicit guidance on the development lengths of plain straight bars. Development
lengths were therefore based on the bond stress limits provided in BD44/15. For comparison a bond stress
was also derived using that implied by NZS3101 using a development length of twice that for a deformed
bar.
The part of the crosshead between the first internal girder and the outside girder is particularly vulnerable
as the bottom bars in the crosshead have only a short anchorage length into the supports. For this area
shear was assessed by a number of different methods including strut and tie modelling, shear friction at the
support face, and compression field theory using AASHTO. We also carried out a “pseudo” conventional
shear analysis to NZS3101. . As the shear reinforcement consisted of plain half round bars anchored by a
straight development length the shear capacity was assessed based on a member depth of the actual depth
(d) minus one development length of the shear reinforcement. This assessment relies on the tension and
compression forces “drifting” up through the beam to provide the complimentary forces for the shear truss
mechanism. To achieve this a tension is required in the concrete, and while such an assessment does not
comply with NZS3101 it gives some indication of the effect of the potential effect of the shear reinforcement
(which has been otherwise ignored due to the lack of anchorage).
Assessment Results
Results of the assessment on the Old Mangere Bridge girders and the crosshead beam are presented in the
subsequent sections. The results for the external girders, internal girders and central internal girders are
each presented separately due to differences in section geometry, loading and reinforcement configuration.
The results for the shear assessment are based on the capacity reduction factor of 0.75 from NZS3101. Note
that for shear AASHTO has a capacity reduction factor of 0.9 (and the effective capacity reduction factor for
BD44 is similar to NZS3101 depending on assumptions made).
Revision #
Page 9 of 17

Longitudinal External Girder
Based on the deck capacity check it was found that the deck should have adequate capacity in shear to allow
3.5DH25 longitudinal bars from the deck retrofit to contribute to the hogging capacity of the edge girder.
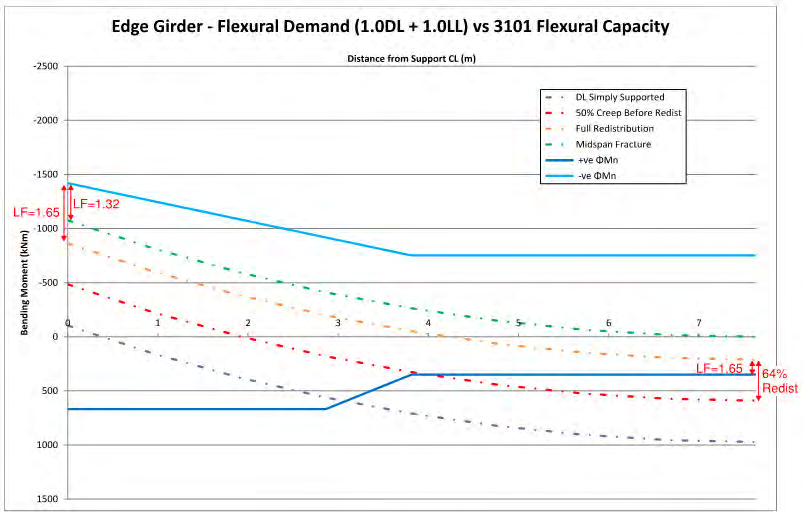
The external girder was checked for flexural capacity to NZS3101. A comparison between the flexural
demand and flexural capacity along half the span of the girder is shown in Figure 3. For the demands
calculated assuming the dead load was applied to simply supported girders it was found that the midspan
flexure demand was 177% greater than the capacity and as shown in Figure 3 this would require a very large
amount of moment redistribution. When the demands were recalculated assuming ‘50% creep’ the midspan
flexure demand was 69% greater than the capacity. With 64% redistribution of the midspan moment an
overall load factor of 1.65 under DL + LL is obtained both at midspan and over the pier.
Because the moment redistribution required for midspan flexure is greater than the code allowable limit
there may be a risk of rupture of the tension reinforcement at midspan. In this case each half of the girder
would then act as a cantilever. As shown in Figure 3 even if this occurred there is still a DL + LL load factor of
1.32 for end hog flexure, thus the structure should not have a collapse mechanism in flexure. Note that as
detailed below for the edge girder it is expected that the section is capable of significant ductile curvature
and rupture of the tension reinforcement is therefore considered to be a relatively low risk.
Figure 3: Comparison between flexural demand and flexural capacity for edge girder.
The girder capacity in shear is compared to the shear demands in Figure 4. For modified compression field
theory the flexural demand affects the shear capacity. Therefore the shear capacity to AASHTO was
calculated three times, once assuming the flexural demands from the ‘50% creep’ case, once assuming the
flexural demands after redistribution of the midspan bending moment had occurred and once based on the
demands after fracture of the midspan tensile reinforcement. A DL + LL load factor against shear failure of
1.15 was obtained assuming fracture of the midspan tensile reinforcement or 1.38 assuming no fracture.
The shear capacity to BD44/15 was found to be less than the shear demand.
Revision #
Page 10 of 17

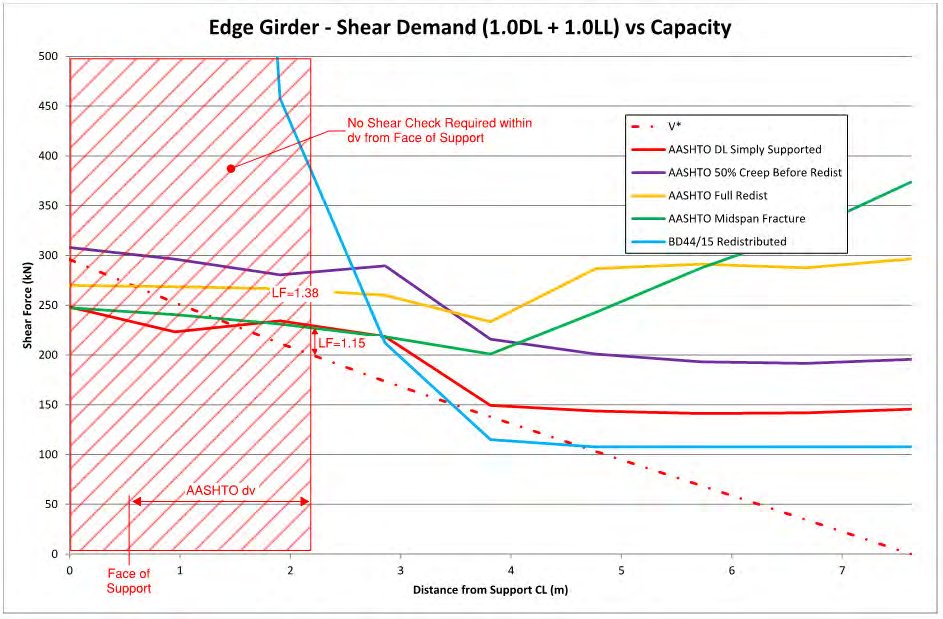 Figure 4: Comparison between shear demand and shear capacity for edge girder.
Longitudinal Internal Girders
The critical internal girder is directly beneath the retrofitted deck strips. Therefore it is ok by inspection to
consider 3.5DH25 longitudinal bars from this retrofit to contribute to the girder capacity in negative flexure.
The critical internal girder was checked for flexural capacity to NZS3101. A comparison between the flexural
capacity and demand along half the span of the girder is shown in Figure 5.
For the ‘50% creep’ case with a redistribution of 30% allowed by NZS3101, a midspan DL+LL load factor of
1.20 is obtained. With full redistribution so the load factor at the support and midspan are equal, a load
factor of 1.51 is obtained and redistribution of 45% of the midspan moment is required.
An assessment of the midspan section using a rotational moment curvature analysis to Response 2000
indicates the section is capable of significant ductile curvature and we would judge a value of redistribution
significantly higher than NZS3101 would be achievable. (However localised corrosion spots would reduce
this ductility capability).
Revision #
Page 11 of 17

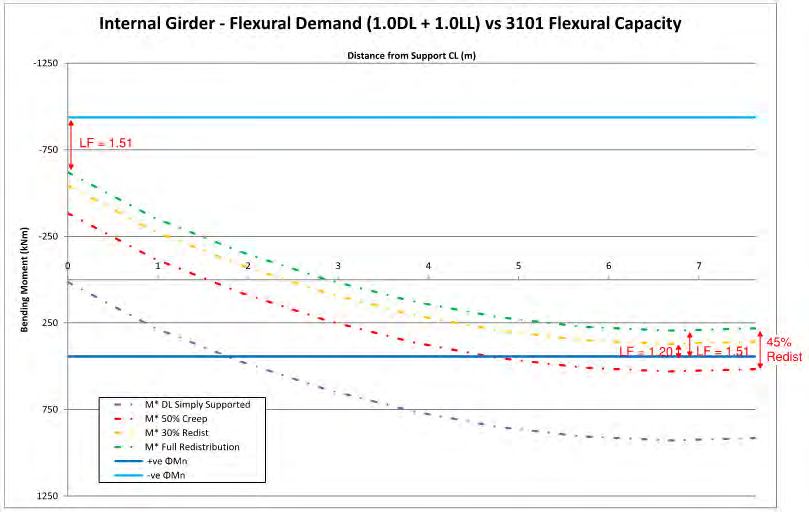
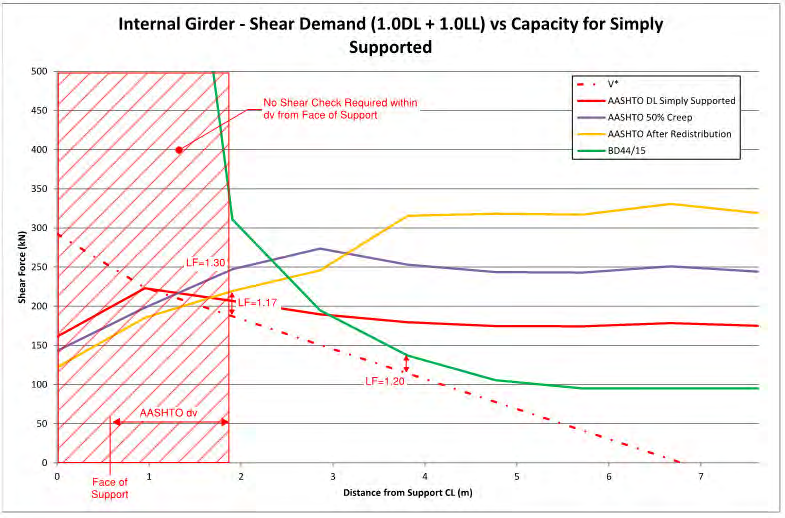 Figure 5: Comparison between flexural demand and flexural capacity for critical internal girder.
The girder capacity in shear is compared to the shear demands in Figure 6. For modified compression field
theory the flexural demand affects the shear capacity. Therefore the shear capacity to AASHTO was
calculated once based on the demands prior to moment redistribution and once based on the redistributed
demands. A DL+LL load factor against shear failure of 1.30 was obtained assuming no moment redistribution
had occurred and 1.17 after moment redistribution. When the shear capacity was calculated to BD44/15 a
DL+LL load factor of 1.20 was obtained.
Figure 6: Comparison between shear demand and shear capacity for critical internal girder.
Revision #
Page 12 of 17

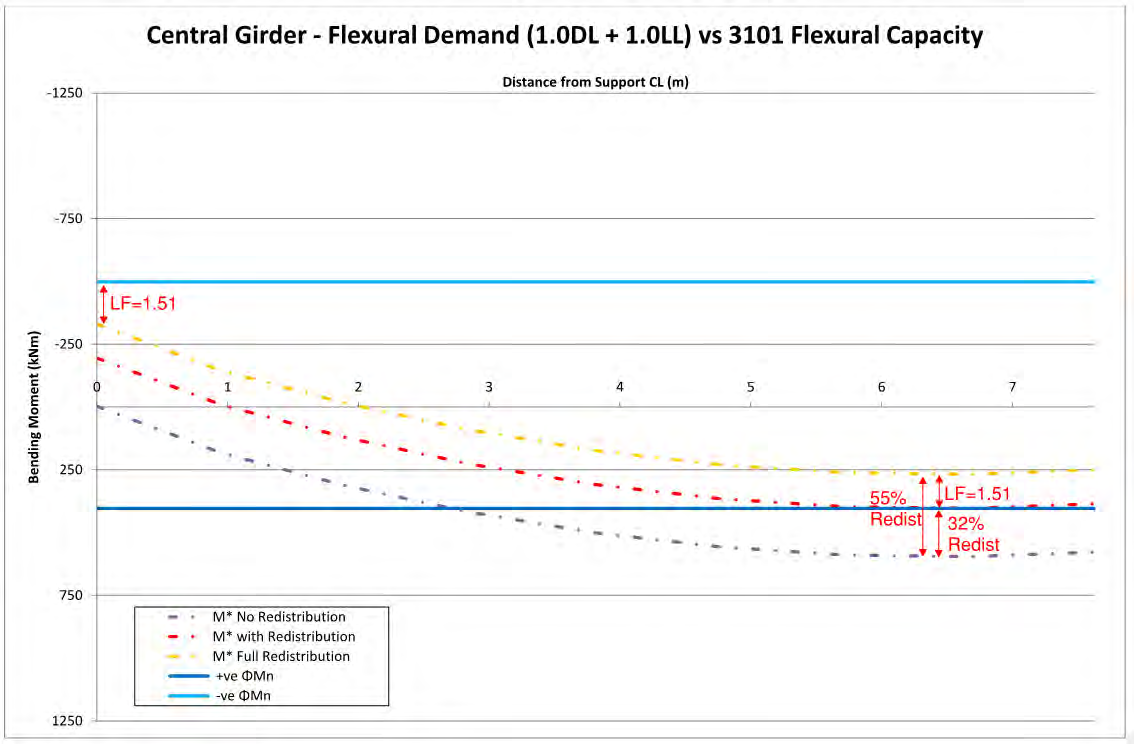
Longitudinal Central Internal Girder
The central internal girder of the bridge is similar to the other internal girders except that it is not located
below the retrofitted area of the concrete deck. The deck was found to only have sufficient shear capacity to
allow 1.75DH25 longitudinal bars from the deck retrofit to be effective as hogging steel for this girder. A
separate flexure check was therefore performed for the reduced demands on this girder as shown in Figure
7. Midspan flexure for this girder was found to be less critical than for the other internal girders.
After full moment redistribution of 55% there is a DL+LL load factor of 1.51 against failure due to negative
flexure over the pier or positive moment at midspan. This girder was also found to be less critical than the
other internal girders for shear.
Figure 7: Comparison between flexural demand and flexural capacity for central girder.
Pier Crosshead Beam
The edge girders and second internal girders are located directly over the piles that support the crosshead
beams. Loading of these girders is therefore not critical for capacity checks on the crosshead beams. These
results will look at the effects of loads applied via the first internal girders and the central internal girders.
For the
first internal girder the results of the flexural check to 3101 gave a DL+LL load factor of 1.08 against
failure due to both hogging and sagging.
For shear transfer between the
first internal girder and the edge pile the results of an NZS3101 shear
friction check at the face of the edge pile gave a DL+LL load factor of 1.0 and a DL only factor of 1.17. The
strut and tie modelling in accordance with NZS3101 (and including 30% enhancement of bond stresses due
to the compression reaction from the girder) gave the following results;
Using NZS3101 implied bond stresses – DL+LL load factor is 0.48
Using BD44/15 bond stresses – DL+LL load factor is 0.58
AASHTO also has requirements for anchorage of reinforcing into supports and using these with BD44/15
bond stresses (also compression enhanced) gives a DL+LL load factor of 0.8 and a DL load factor of 0.93.
Revision #
Page 13 of 17

(Note a conventional NZS3101 shear analysis of the crossbeam ignoring the shear reinforcement gave a
DL+LL load factor of 1.0 and the “pseudo” shear analysis including the reinforcement gave a DL+LL load
factor of 1.9, but this should not be used for assessment purposes). In summary the shear assessment of
this area of the crossbeam gave DL+LL load factors in the range of 0.5 to 0.8, and a DL only load factor about
15% higher than this.
For shear transfer between the
first internal girder and the internal pile the results of the NZS3101 shear
check using a strut and tie model gave a single strut at a roughly 28 degree angle between the girder seating
and the pile support. The DL+LL load factor for the capacity of this strut was 0.97 while the DL only factor for
the strut was 1.18.
For
the third internal girder the results of the flexural check to NZS3101 gave a DL+LL load factor of 1.16
against hogging failure. The DL only factor is 1.28.
For shear transfer between the
third internal girder and the internal pile the results of the NZS3101 shear
check using a strut and tie model gave a single strut at a roughly 39 degree angle between the girder seating
and the pile support. The DL+LL load factor for the capacity of this strut was 1.38 while the DL only factor for
the strut was 1.67.
Assessment Summary and Conclusions
Longitudinal Girder Flexural Capacity:
The minimum DL + LL load factor obtained from this assessment (using dependable capacities) with moment
redistribution generally following the 30% limit from NZS3101 is 1.20 for the internal girders but less than
1.0 for the edge girders. However the edge girders have an assessed DL + LL load factor of 1.30 even if the
midspan reinforcement is neglected. If redistribution substantially above the 30% limit is allowed, which is
likely to be achievable depending on the reinforcement condition, a minimum DL + LL load factor of around
1.5 is indicated.
Longitudinal Girder Shear Capacity:
The minimum DL + LL load factor using an AASHTO compression field theory based assessment (as allowed
by the NZTA Bridge Manual) and the NZS3101 capacity reduction factor (0.75) is 1.17. Note that using the
AASHTO capacity reduction factor of 0.9 would give a considerably higher result, however we do not
consider this to be appropriate. Also note that the assessment against BD44 gives a lower value of shear
capacity and this has been excluded from the above results.
Sensitivity to Assumptions:
The assessment results will be affected by the actual amount of reinforcement corrosion, the continued
integrity of the post-tensioning system, the members behaving as a continuous structure, the distribution of
load between members, the current level of creep redistribution, the actual concrete strength, the effective
member structural dimensions, the adequacy of the supports and a number of other factors.
The live load of 3kPa constitutes about 17% of the total DL + LL and hence excluding live load from the
assessment would increase the noted load factors by 1.2.
Note that the assessment used a contributory area contribution from each girder and however the relative
stiffness of the girders is similar for continuous structure behaviour.
For the case of loss of prestress to the internal girders we have reassessed the load factors above and find
the minimum DL + LL factors as; 1.0 for flexure with NZS3101 limits applied, 1.24 for flexure with full
Revision #
Page 14 of 17

redistribution of 44% and 0.90 for shear.
For the case of the structure behaving as simply supported the assessed load factors are reduced. For
flexure the DL + LL load factor with a 30% limit on moment redistribution is less than 1.0 for all girders.
However the DL + LL load factor for the edge girders with the midspan reinforcement neglected is the 1.3
factor noted above. For the critical internal girders, moment redistribution of 70% of the midspan moment
is required for the DL + LL load factor of 1.5. For shear the assessed DL + LL load factors are 1.15 for the
external girder and 1.10 for the critical internal girder.
Note that the NZTA Bridge Manual effectively requires 1.2DL + 1.56LL for capacity assessment. This is
equivalent to 1.26(DL + LL).
Longitudinal Girder Conclusion:
Based on the noted assumptions the bridge superstructure appears likely to have a reasonable flexural
capacity for DL + LL load and while not quite meeting NZTA Bridge Manual evaluation requirements, it would
with some midspan moment redistribution beyond NZS3101 limits. However the load factor for shear is low
in the context of the uncertainties around the behaviour of the structure and its condition and does not
meet the NZTA bridge manual requirements. A key assumption in the assessment is that the structure is
behaving in a continuous manner. Assuming the continuous structure behaviour it is noted that the load
factors obtained are in the same order as those from the AMA numerical assessment referenced earlier.
Pier Crosshead Beam Capacity:
The first internal girder and third internal girder loads are carried by the pier crosshead in flexure and shear.
The assessment of the crosshead to carry the first internal girder gave a DL+LL load factor of 1.08 in flexure
to NZS 3101. For shear, due to the short embedment of the beam bottom bars at the support, a DL+LL load
factor of in the range of 0.5-0.8 was derived from a strut and tie analysis and a compression field theory
analysis. The minimum DL only load factor in shear was about 15% higher.
The assessment of the crosshead to carry the third internal girder gave a DL+LL load factor of 1.16 for
flexure to NZS3101. For shear a DL+LL load factor of 1.38 was derived from a strut and tie analysis.
Pier Crossbeam Conclusion:
The capacity of the crossbeam to carry the first internal girder is significantly compromised by the short
anchorage of the bottom beam bars and does not meet the assessment standard. On the other hand the
bridge has been in this state for over 100 years and thus effectively “load tested” with significantly higher
loads than we are currently considering. With ongoing concrete deterioration this is clearly a vulnerability to
be addressed as a matter of priority at least for the spans where the concrete in the region of the outer
cross beam support is in poor condition.
Summary of Load Factors:
Table 1 summarises the DL+LL Load Factors and DL only Load Factors for the various elements assessed in
this peer review. Taking the condition of the structure into account it is necessary to include some level of
capacity reduction factor and these include the NZS3101 capacity reduction factors of 0.85 for flexure and
0.75 for shear. Factors of safety i.e. the capacity without the NZS3101 capacity reduction factors are also
presented.
Revision #
Page 15 of 17
 Table 1: Summary of DL+LL Factors and Factors of Safety for each element.
Edge Girders:
Table 1: Summary of DL+LL Factors and Factors of Safety for each element.
Edge Girders:
3101 Flexure (Simply Supported w/o Redistribution)
DL+LL Factor = 0.56
FOS = 0.66
3101 Flexure (50% Creep w/o Redistribution)
DL+LL Factor = 0.61
FOS = 0.72
3101 Flexure (50% Creep with 30% Redistribution)
DL+LL Factor = 0.87
FOS = 1.03
3101 Flexure (50% Creep with 64% Redistribution)
DL+LL Factor = 1.65
FOS = 1.94
3101 Flexure (Cantilever Assumption)
DL+LL Factor = 1.32
FOS = 1.55
AASHTO Shear
DL+LL Factor = 1.38
FOS = 1.84
BD44/15 Shear
DL+LL Factor = 0.83
FOS = 1.11
Internal Girders:
3101 Flexure (Simply Supported w/o Redistribution)
DL+LL Factor = 0.48
FOS = 0.56
3101 Flexure (50% Creep w/o Redistribution)
DL+LL Factor = 0.84
FOS = 0.99
3101 Flexure (50% Creep with 30% Redistribution)
DL+LL Factor = 1.20
FOS = 1.41
3101 Flexure (50% Creep with 45% Redistribution)
DL+LL Factor = 1.51
FOS = 1.78
AASHTO Shear
DL+LL Factor = 1.17
FOS = 1.56
BD44/15 Shear
DL+LL Factor = 1.20
FOS = 1.41
Pier Crosshead Beam (End Region):
3101 Flexure
DL+LL Factor = 1.08
FOS = 1.27
3101 Shear Friction at Face of Pile
DL+LL Factor = 1.0
FOS = 1.33
DL Only Factor = 1.17
FOS = 1.56
3101 Strut & Tie Check for Bar Anchorage
DL+LL Factor = 0.48
FOS = 0.64
3101 Strut & Tie Check for Bar Anchorage (BD44/15 Bond)
DL+LL Factor = 0.58
FOS = 0.77
AASHTO Bar Anchorage (with BD44/15 Bond)
DL+LL Factor = 0.80
FOS = 1.07
DL Only Factor = 0.97
FOS = 1.24
Pier Crosshead Beam (1st Internal Girder to Internal Pile):
3101 Strut & Tie Strut Capacity
DL+LL Factor = 0.97
FOS = 1.29
DL Only Factor = 1.18
FOS = 1.57
Revision #
Page 16 of 17
 Pier Crosshead Beam (3rd Internal Girder to Internal Pile):
3101 Flexure
DL+LL Factor = 1.16
FOS = 1.36
3101 Strut & Tie Strut Capacity
DL+LL Factor = 1.38
FOS = 1.84
Recommendations
With the assessed low load factors, intervention, ongoing management, investigation and monitoring of this
structure are indicated.
The most critical assumptions made for the structural assessment, and the most critical members should be
assessed and confirmed in the field as soon as practicable. For the members in the worst condition the
assessment would include; bottom midspan bar corrosion loss, effective web thickness, whether post-
tensioning is functioning, and concrete condition in the crossbeams and longitudinal beams near to the
supports. The assumption of continuous structure behaviour should be confirmed by inspection of the
superstructure deck over the piers in the critical spans. This may require surfacing removal. Also
investigation as to the presence of longitudinal reinforcing steel in the deck at this location would be
desirable.
For the spans in the worst condition, limiting live loading should be pursued as a matter of priority. For
example if loading was confined to the roadway area (i.e. pedestrians prohibited from the area above the
outside and first internal girders over the worst few spans) then the minimum assessed DL+LL load factor is
1.16. However the assessed DL load factor for the fenced off area would still be less than 1 because of the
cross girder deficiency. (Note as noted above these load factors are based on dependable capacities).
Because of the limited shear capacity any load testing should be approached cautiously and avoided if
possible.
Revision #
Page 17 of 17