link to page 2 link to page 16 link to page 26 link to page 28 link to page 28 link to page 45 link to page 45
Table of Contents
1.
The Income Tax and Transfer System
1
2.
Negative Income Tax Systems
15
3.
Modelling a Cost-Neutral Guaranteed Minimum Income (GMI) Scheme
25
4.
The Treasury’s position on income adequacy and poverty: previous advice and
27
potential directions
5.
The Treasury’s position on income adequacy and poverty: previous advice and
44
potential directions - Slide Pack
20180164 TOIA Binder New
Doc 1
Page 1 of 62
DRAFT – FOR OFFICIAL USE ONLY
IN-CONFIDENCE
The income tax and transfer system: issues and
options
This note is intended to be an internal resource for officials to support the analysis of tax and
transfer settings. It is not government policy or advice.
The scope of this report is the personal income tax system and the transfer payments (benefits,
supplementary assistance and tax credits) received by working-age individuals and families. This
report discusses the broad structure of the tax and transfer interface and does not evaluate each
individual transfer payment. Retirement income policy is not within scope.
Deleted - Not Relevant to Request
1. Deleted - Not Relevant to Request
2.
3. The nature of work is changing, which poses challenges for the tax and transfer system.
There is greater diversity of working arrangements than in the past and there may be
greater use of the social safety net in the future to support workers as they transition
between occupations. Some argue that a universal basic income (UBI) should be introduced
to reduce job insecurity in this environment. However, there is not a strong case for a UBI in
New Zealand as it would reduce the effectiveness of the welfare system in reducing poverty,
although overseas pilot studies should be monitored for their outcomes.
Deleted - Not Relevant to Request
4. Deleted - Not Relevant to Request
5.
6.
7.
1
20180164 TOIA Binder New
Doc 1
Page 2 of 62
DRAFT – FOR OFFICIAL USE ONLY
IN-CONFIDENCE
Deleted - Not Relevant to Request
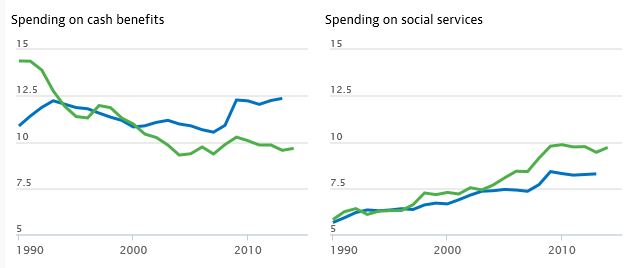
Cash transfers are one component of overall social spending. New Zealand’s social spending is
approximately equally split between cash transfers and social services (around 10% of GDP is spent
on each). For the working-age population, two-thirds of social spending is through in-kind support
and one-third is in cash transfers.
2
20180164 TOIA Binder New
Doc 1
Page 3 of 62
DRAFT – FOR OFFICIAL USE ONLY
IN-CONFIDENCE
FIGURE 1 - SPENDING ON CASH BENEFITS AND SOCIAL SERVICES
OECD
New Zealand
New Zealand
OECD
Source: OECD
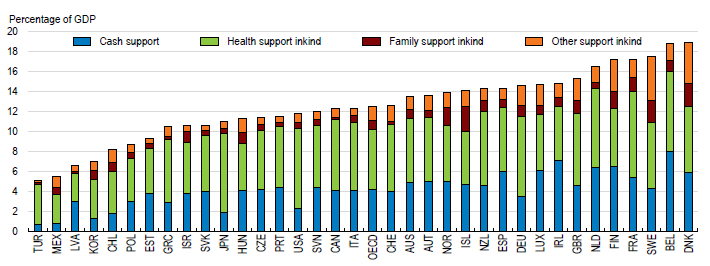
FIGURE 2 - PUBLIC SOCIAL SPENDING ON THE WORKING-AGE POPULATION
Source: OECD
Deleted - Not Relevant to Request
3
20180164 TOIA Binder New
Doc 1
Page 4 of 62
DRAFT – FOR OFFICIAL USE ONLY
IN-CONFIDENCE
Deleted - Not Relevant to Request
4
20180164 TOIA Binder New
Doc 1
Page 5 of 62
DRAFT – FOR OFFICIAL USE ONLY
IN-CONFIDENCE
Deleted - Not Relevant to Request
y
5
20180164 TOIA Binder New
Doc 1
Page 6 of 62
DRAFT – FOR OFFICIAL USE ONLY
IN-CONFIDENCE
Deleted - Not Relevant to Request
There are two fundamental types of structures for income transfers: 1) a universal basic income or
2) means-tested benefits. Both can achieve a poverty alleviation goal and create a progressive
effective tax rate structure. However, there will be different properties in terms of average and
marginal tax rates. Related to this is the concept of target efficiency. A universal basic income is
simple but is also received by the whole population, which means that some receive a transfer that
is not necessary to alleviate poverty. It is typically associated with a high average tax rate to fund the
universal transfer payment. Means-tested benefits generally have greater target efficiency but are
associated with potentially higher effective marginal tax rates for recipients as benefits are abated.
Deleted - Not Relevant to Request
6
Pages 7-25 Deleted - Not Relevant to Request
20180164 TOIA Binder New
Doc 1
Page 7 of 62
DRAFT – FOR OFFICIAL USE ONLY
IN-CONFIDENCE
FIGURE 21 – SOCIAL EXPENDITURE BY AGE OF CHILD IN NEW ZEALAND
$ (PPP per capital USD)
Cash benefits
Childcare
Other benefits in kind
Education
14,000
12,000
10,000
8,000
6,000
4,000
2,000
0
atal
0
1
2
3
4
5
6
7
8
9
10
11
12
13
14
15
16
17
18
19
20
21
22
23
24
25
26
27
28
29
en
Pr
Age of child
Source: OECD. Note: Data is for 2011, but pattern would be expected to be similar in 2017.
Deleted - Not Relevant to Request
26
Pages 27-31 Deleted - Not Relevant to Request
20180164 TOIA Binder New
Doc 1
Page 8 of 62
DRAFT – FOR OFFICIAL USE ONLY
IN-CONFIDENCE
Part 2: Options
The options that are considered will depend on objectives. We discuss the general issues relating to
addressing barriers to employment and income adequacy.
Options to addressing barriers to employment
Deleted - Not Relevant to Request
A universal basic income avoids the question of varying incomes from wages or salaries, since - by
definition – this kind of payment is not conditional on earned income. In a highly targeted transfer
system, however, state income support is withdrawn as income from wages and salaries increases.
This can have the perverse impact of discouraging people from taking up more employment. Income
taxes combine with abatement of transfers create high effective marginal tax rates.
Deleted - Not Relevant to Request
32
Pages 33-47 Deleted - Not Relevant to Request
20180164 TOIA Binder New
Doc 1
Page 9 of 62
DRAFT – FOR OFFICIAL USE ONLY
IN-CONFIDENCE
Deleted - Not Relevant to Request
Universal basic income
A universal basic income (UBI) is a type of tax and transfer policy that provides a guaranteed
minimum income to all households, irrespective of income, work-status or other criteria.
It is an old idea, but has received renewed attention. Its key advantage is its simplicity. Economic
changes mean that workers may have greater job insecurity, technological disruption and different
types of working arrangements (eg, the ‘gig economy’) than in the past. A UBI may support greater
income security in this type of economic conditions.
The disadvantages of a UBI is that it will likely increase poverty rates, in the absence of large
increases in tax revenues. Spreading existing working age benefits to the entire working age
population will materially reduce the level of payment to those who already receive benefits. At
current spending levels, a UBI would be substantially below the poverty line in most OECD
economies (OECD, 2017). This is particularly the case for New Zealand, given New Zealand’s existing
transfer payments are highly targeted. To illustrate, New Zealand spends around 10% of GDP on
working age benefits, which is around $8,500 a year per working age person. A sole parent jobseeker
currently receives around $17,000 a year.
While concerns around impact on poverty rates could be addressed with a higher payment rate, this
could not be budget neutral. It would require a significant increase in tax revenues, and therefore
average tax rates would rise. This could materially weaken work incentives and reduce employment
levels.
There are a number of pilot studies planned for UBIs in certain municipalities, including in Canada,
the Netherlands and Finland. It is too early to evaluate the effects of these pilot studies, but they
should be monitored for their results.
Deleted - Not Relevant to Request
Deleted - Not Relevant to Request
48
Pages 49-57 Deleted - Not Relevant to Request
20180164 TOIA Binder New
Doc 1
Page 10 of 62
DRAFT – FOR OFFICIAL USE ONLY
IN-CONFIDENCE
Deleted - Not Relevant to Request
The nature of work is changing, which poses challenges for the tax and transfer system. There is
greater diversity of working arrangements than in the past and there may be greater use of the
social safety net in the future to support workers as they transition between occupations. Some
argue that a universal basic income (UBI) should be introduced to reduce job insecurity in this
environment. However, there is not a strong case for a UBI in New Zealand as it would reduce the
effectiveness of the welfare system in reducing poverty, although overseas pilot studies should be
monitored for their outcomes.
Deleted - Not Relevant to Request
Deleted - Not Relevant to Request
58
20180164 TOIA Binder New
Doc 1
Page 11 of 62
DRAFT – FOR OFFICIAL USE ONLY
IN-CONFIDENCE
References
Kleven, Henrik Jacobsen. 2014. "How Can Scandinavians Tax So Much?"
Journal of Economic
Perspectives, 28(4): 77-98.
OECD (2011),
Taxation and Employment, OECD Publishing, Paris.
http://dx.doi.org/10.1787/9789264120808-en
John Creedy and Penny Mok (2015) “Labour Supply in New Zealand and the 2010 Tax and Transfer
Changes”. Treasury Working Paper 15/13.
John Creedy & Penny Mok, 2017. "The Marginal Welfare Cost of Personal Income Taxation in New
Zealand," Treasury Working Paper Series 17/01, New Zealand Treasury.
Penny Mok and Joseph Mercante (2014) “Working for Families changes: The effect on labour supply
in New Zealand” New Zealand Treasury Working Paper 14/18.
John Creedy, 2010. "Tax-and-Transfer Tensions: Designing Direct Tax Structures," Australian
Economic Review, The University of Melbourne, Melbourne Institute of Applied Economic and Social
Research, vol. 43(2), pages 103-113.
Carey, D. (2017), "Adapting to the changing labour market in New Zealand", OECD Economics
Department Working Papers, No. 1420, OECD Publishing, Paris.
http://dx.doi.org/10.1787/e6ced642-en
Veronica Jacobsen, Nicholas Mays, Ron Crawford, Barbara Annesley, Paul Christoffel, Grant Johnston
and Sid Durbin (2002) "Investing in Well-being: An Analytical Framework" New Zealand Treasury
Working Paper 02/23 December, 2002.
IMF,
Fiscal Monitor, October 2017
OECD 2012, “Income inequality and growth: The role of taxes and transfers”, OECD Economics
Department Policy Notes, No. 9. January 2012.
OECD (2016), “Enhancing Child Well-Being to Promote Inclusive Growth”
http://www.oecd.org/officialdocuments/publicdisplaydocumentpdf/?cote=DELSA/ELSA(2016)7/REV
1&doclanguage=en
Layard, R., A. Clark, F. Cornaglia, N. Powdthavee and J. Vernoit (2014), “What predicts a successful
life? A life-course model of well-being”,
The Economic Journal, Vol. 124, Issue 580, pp. F720-F738.
Emmanuel Saez (2002) “Optimal income transfer programs: intensive versus extensive labor supply
responses”
The Quarterly Journal of Economics, August 2002.
Robert W. R. Price & Thai-Thanh Dang & Jarmila Botev, 2015. "Adjusting fiscal balances for the
business cycle: New tax and expenditure elasticity estimates for OECD countries," OECD Economics
Department Working Papers 1275, OECD Publishing.
59
20180164 TOIA Binder New
Doc 1
Page 12 of 62
DRAFT – FOR OFFICIAL USE ONLY
IN-CONFIDENCE
Blanchard, Olivier, Dell'ariccia, Giovanni and Mauro, Paolo, (2010), Rethinking Macroeconomic
Policy
, Journal of Money, Credit and Banking, 42, issue s1, p. 199-215.
Jonathan Boston & Simon Chapple (2014)
Child poverty in New Zealand.
Jason Raven (2015) "Financial Incentives to Work"
Policy Quarterly – Volume 11, Issue 4 – November
2015
60
Pages 61-72 Deleted - Not Relevant to Request
20180164 TOIA Binder New
Doc 1
Page 13 of 62
IN-CONFIDENCE
Summary of modelling capabilities in terms of potential
options
Deleted - Not Relevant to Request
Universal
Basic Income
(UBI)
Potential
HES
data sources
Taxwell
Such a
significant
change to the
system means
that any
results based
on a static
analysis may
be too
removed from
the actual
impacts.
Taxwell B
No
27
http://www.stats.govt.nz/browse_for_stats/people_and_communities/Children/ChildcareSurv
ey_HOTP2009revised/Commentary.aspx
Treasury:3788507v1
IN-CONFIDENCE
73
20180164 TOIA Binder New
Doc 1
Page 14 of 62
IN-CONFIDENCE
Deleted - Not Relevant to Request
MSD – MSIM Only for MSD
clients
IR
No –
insufficient
data as does
not include
people with
no income
Treasury:3788507v1
IN-CONFIDENCE
74
20180164 TOIA Binder New
Doc 2
Page 15 of 62
Draft 1
NEGATIVE INCOME TAX SYSTEMS
Ewen McCann1
6 September 2000
Prepared for a Working Group on Financial Incentives to Work
1 I have had useful conversations with Martin Neylan while preparing this paper.
C:\NRPortbl\iManage\SHENK\92754_1.doc
20180164 TOIA Binder New
Doc 2
Page 16 of 62
Summary
1.
The negative income tax system of delivering welfare benefits consists
of,
• A lump sum transfer payment clear of tax.
• A tax on market income.
2.
Al welfare delivery systems are compromises between the conflicting
objectives of,
• Decent living standards.
• Low levels of break-even income.
• Low rates of the abatement-tax
3.
A negative income tax with wide coverage would,
• Be administratively cheap and transparent to beneficiaries.
• Preserve horizontal equity.
• Offer similar work incentives for al .
4.
Effective marginal tax rates are high under the existing welfare system.
A negative income tax system requiring high tax rates is therefore not
necessarily disadvantaged in comparison with the present welfare payment
system. One issue is what tax schedule would be required to finance a
negative income tax system.
5.
Negative income tax methods of welfare delivery could be
particularised to specific groups.
6.
The issue with all welfare delivery systems in promoting incentives to
work is the low rates of response of the labour supply to after tax incentives.
This has been demonstrated for welfare payments generally and also in
experiments with negative income tax systems.
7.
New Zealand unkowingly has an extensive system of negative income
tax welfare payments.
8.
One part of this is the family tax credit. It is a cash grant of $15080 p.a.
after which each dollar of income is taxed at 100% until the lump sum is paid
back. Education and health services are lump sums paid in kind. Families
receiving them pay income tax on market income. The services thereby meet
the two requirements for a negative income tax. Present welfare payments
can be shown to be equivalent to a complicated system of selective or
earmarked negative income taxes.
9.
The negative income tax framework is a useful way of conceptualising
the current New Zealand welfare payment system and thinking about reforms
to it. There is a diagrammatic representation of the scheme in the Appendix.
C:\NRPortbl\iManage\SHENK\92754_1.doc
20180164 TOIA Binder New
Doc 2
Page 17 of 62
1. Introduction
10.
A comprehensive negative income tax fully integrates the tax and
welfare payment systems and is the only way of doing so. It consolidates the
two systems.
11.
A negative income tax system requires just two things: a lump sum
transfer from the Government to a person and a tax on market income.
12.
The term is a mite confusing. Positive income tax is paid by people to
the Government. Negative income tax is paid by the Government to the
people. The receipt of money from the Government is the negative tax as far
as the household is concerned because tax money usually flows in the other
direction. Think of it as a poll tax in reverse. Instead of paying it a person
receives it from the Government.
13.
The negative income tax provides a single type of benefit that is a lump
sum payment made at, say, the beginning of the period though in practice
probably at intervals through it. That is the end of the benefit side of the
tax/welfare system. Thereafter, all is tax. Tax is applied only on what is
subsequently earned. There may or may not be a single tax schedule for all.
14.
The system can be seamless between transfers to and from the
Government. Threshold problems need not emerge. There is no point in
falsifying welfare claims if there is universal entitlement. Tax fraud remains
profitable.
15.
A negative income tax need not be as comprehensive as this and it can
be piecemeal, earmarked or in kind as we will see.
16.
A negative income tax system would not impose marginal tax rates
above 100% the way the existing tax/abatement regime occasionally does.
17.
Beneficiaries apparently see at present just the total of the welfare
payments that they receive without distinguishing the component benefits.
There need be no separate benefits in the lump sum of the negative income
tax.
18.
The conflicting requirements of a decent living standard, low breakeven
income (the level of earned income where benefits are clawed back in tax or
benefit abatement), low tax or abatement rates, and low budgetary cost apply
to al welfare payment systems.
19.
There is a diagrammatic representation of the scheme in the Appendix
where design and important issues around incentives to work are discussed.
2. Features of the System
C:\NRPortbl\iManage\SHENK\92754_1.doc
20180164 TOIA Binder New
Doc 2
Page 18 of 62
20.
The advantages of the negative income tax method of poor relief are
that,
• It is administratively cheap and transparent to beneficiaries.
• Horizontal equity is preserved.
• Work incentives are the same for al .
21.
The negative income tax system is distinguished from earmarked
welfare payments which have effects that are the opposite of these.
Earmarked welfare payments provide sub-groups with individualised welfare
benefits. High effective tax rates of the abatement regimes can be a
consequence of beneficiaries receiving more than one earmarked benefit, a
core benefit and a supplementary benefit. Labour market inefficiencies result.
22.
If the negative income tax reached a significant portion of or even all
the population, it would be expensive and marginal tax rates have therefore to
be high for at least some taxpayers in order to finance it or recoup it. There
would then be significant work disincentives with it, as there are with the
extant earmarked benefits.
3. Marginal Tax Rates
23.
The relatively high marginal rates of income tax that would accompany
a negative income tax system with broad coverage is
not a particularly
important objection to it. This is because the system of earmarked benefits
that we have at present is widespread and is accompanied by high effective
tax rates.
24.
An extensive negative income tax system would probably involve high
marginal tax rates because of the Government’s budget imperative. In its pure
form a negative income tax system would have the same tax schedule
applying to everyone’s market income. The difference between this and the
high effective marginal tax rate system is that the present skyscraper skyline
diagram of effective marginal tax rates need not accompany the negative
income tax system. Labour market distortions should be less under the
negative income tax system than under the present system of supporting the
poor.
25.
The proper question is, given the broad coverage and high EMTRs of
the present benefit system, what income tax schedule would be required to
finance a parallel negative income tax system?
4. Earmarked Negative Income Taxes 26.
Half way houses seem possible, like applying the negative income tax
system to earmarked groups. The trick to cost containment would be to sort
groups by non-economic criteria that are not readily under the control of
individuals, or that are costly for them to meet.
C:\NRPortbl\iManage\SHENK\92754_1.doc
20180164 TOIA Binder New
Doc 2
Page 19 of 62
27.
The privileged status of one group causes others to try to join it. Their
success in joining would raise the budgetary cost of a programme and the
new members may not be work responsive. Any social assistance scheme
contains an incentive to move from work to welfare in some degree. This may
make their effects on the distribution of income ambiguous. Take the case
where sizeable numbers went from work to welfare, accepting an income
reduction. This increases the income inequality that the programmes are
designed to reduce.
28.
Demographic characteristics are the obvious selection criteria for a
restricted system of negative income tax. Age, gender, congenital
abnormalities and dependents are either impossible or costly to modify.
Excluded groups cannot readily join in. Earmarked groups could be taken off
their present benefits and become a part of the restricted negative income tax
system.
29.
For example, all or some DPB beneficiaries could be given a suitable
weekly lump sum, usually expressed as a fraction of the average wage. Then,
whatever they earned above this
could be taxed at the income tax rates
applying to non-beneficiaries. The high EMTRs inherent in the current benefit
abatement and income tax regimes are removed for them as a result. Work
incentives improve for this earmarked group. This is an earmarked negative
income tax system.
30.
In a pure form of negative income tax the same lump sum is paid to all
though this need not be the case. Lump sums could rise with family size or
other circumstances. Administration costs would rise with them.
31.
It is not necessary for its operation that the beneficiaries of the negative
income tax face the same income tax schedule as other taxpayers. There are,
however, clear administrative and labour market efficiency advantages a
single tax schedule.
5. Responsiveness
32.
Groups with the higher labour supply elasticities are the ones that are
the better candidates for an earmarked negative income tax rate, as long as
their memberships can be circumscribed for budgetary reasons, perhaps by
demographic criteria.
33.
The rates of response of work effort to changes in after tax wages are
typically low. Deadweight losses are probably low because of it. From this
point of view beneficiaries’ present high effective marginal tax rates involve
little social cost in the economic sense of the term because their labour
supplies are probably inelastic.
34.
It is hard to see why the high EMTRs receive the attention in policy
discussion that they do when their economic welfare costs are likely to be
small.
C:\NRPortbl\iManage\SHENK\92754_1.doc
20180164 TOIA Binder New
Doc 2
Page 20 of 62
35.
Just as the present welfare system appears to do little to get people
working, not too much should be expected of a negative income tax either,
and for the same reasons
viz, the supposedly low labour supply elasticities.
36.
This expectation has been confirmed by experiments with the negative
income tax. There were tests of this welfare delivery method in the 1970’s in
New Jersy, Gary Indianna, Seattle, Denver and in Manitoba. The Denver
experiment lasted eight years.
37.
The designers of the negative income tax have problems with al of the
experiments because,
• The lump sums were set at too high a level.
• It did not replace other benefits but was in addition to them.
It is for these reasons that one of them (Milton Friedman) publicly opposed
President Nixon’s variation of the scheme2.
38.
There have been a number of studies of the work incentives in the Aid
to Families with Dependent Children programme in the USA. This is not a
negative income tax but nevertheless,
Changing benefits formulas to increase work incentives are likely to generate
minimal increases in the labour supply3
6. New Zealand Case
39.
A negative income tax requires just two things: an untaxed lump sum
and a tax on market income.
40.
Without realising it, New Zealand presently operates an extensive
though complicated negative income tax. There are three parts to the New
Zealand negative income tax (
i.e. welfare) system. One is through Family Tax
Credit scheme and some similar practices, another is through benefits in kind
and the other is the current general welfare payment system. We treat them in
turn.
41.
The Family Tax Credit is a negative income tax. It applies to a
restricted group of people who receive a cash grant of $15080 p.a. Each
dollar of market income reduces the $15080 by one dollar4. The two
requirements of a negative income tax are therefore met by this welfare
benefit. These are the lump sum grant and the taxation of market income. In
this case the lump sum grant from the Government is not of a gross amount,
though it can be converted to one, and the tax-abatement rate is 100%. This
along with other tax credits is the first of New Zealand’s negative income
taxes.
2 Parker, Hermione (1989).
Instead of the Dole. Routledge, London. p 144.
3 Hoynes, H.W.(1996)
Work Welfare and Family Structure: What have We Learned? National
Bureau of Economic Research, Cambridge MA. Working Paper 5644 p 34.
4 This dollar reduction is composed first of income tax and then of the abatement tax.
C:\NRPortbl\iManage\SHENK\92754_1.doc
20180164 TOIA Binder New
Doc 2
Page 21 of 62
42.
The second negative income tax system is of payments in kind. Health
and education goods are transfer payments in kind that the Government
provides to families. These do not abate, they are lump sum transfers in kind
and are unrelated to income, just like a full scale negative income tax would
be. Education and health recipients pay tax on their market income at the
standard income tax schedule. They are on a negative income tax system for
health and education goods.
43.
Negative income tax types of transfers in kind could be extended. Food
stamps and rent subsidies are obvious extensions. Payments in kind are not
optimal for the recipients because they will be better off, by their own lights,
upon the receipt of a benefit to the same value in cash.
44.
We do not hear these optimality arguments mounted to replace
negative income taxes in kind by cash transfers. This is because taxpayers
want to know what the transfers are being spent on.
45.
A voucher system of welfare payments preserves the specified good
characteristic of the transfer and would also be a negative income tax in kind
that is supposedly more economically efficient than state produced goods.
The accommodation supplement is similar to a voucher inasmuch as the
recipient can spend it on any supplier of a specified good.
46.
The current cash welfare payments are the third component of New
Zealand’s negative income tax system. The current system of the payment of
cash benefits is a complicated negative income tax system though it is not
seen as such because of the way that the abatement regimes are interpreted.
47.
We see abatement as reducing the amount of the benefit in the hand
as income increases. And we see income tax as reducing income in the hand
as income increases. These viewpoints probably arise because of the
separate functions of the Department of Work and Income and the Inland
Revenue Department. We will look at them a little differently.
48.
It will be helpful to imagine that the “first” division of the Department of
Work and Income decides on an applicant’s gross benefit entitlement and that
the “second” division applies the abatement regime.
49.
Let us focus on the second division’s activity. A beneficiary would see
no economic distinction between a reduction in a welfare cheque determined
by the second division and the same reduction in take-home market income
determined by the Inland Revenue Department. The person’s disposable
income is reduced by the same amount and has the same smaller total in
each case. Income tax and abatement have the same effect on the
beneficiary, as long as the penalties are equal. The reason for this is that is
that abatement and income tax are both determined by the amount of market
income.
C:\NRPortbl\iManage\SHENK\92754_1.doc
20180164 TOIA Binder New
Doc 2
Page 22 of 62
50.
An abatement at 70 cents in the dollar is entirely equivalent to an
income tax at the same rate as far as the income-taxpaying-beneficiary is
concerned.
51.
To a beneficiary, a particular abated benefit plus an after tax market
income is therefore equivalent to a lump sum benefit plus a gross market
income that is taxed at a rate suitably greater than is specified by the statutory
income tax schedule. A welfare payment under the current system has been
shown to meet the two requirements of a negative income tax, the lump sum
transfer and a tax on market income.
52.
This proves our point. The incentive effects of the benefit-abatement-
income–tax regimes are the same as a specific and highly structured negative
income tax system as far as beneficiaries are concerned.
53.
We can, and we perhaps should, view the present tax and benefit
systems as complicated negative income tax regimes. This would provide a
framework for welfare payment reform, if reform is necessary.
C:\NRPortbl\iManage\SHENK\92754_1.doc
20180164 TOIA Binder New
Doc 2
Page 23 of 62
APPENDIX
54.
The diagram for a person under a negative income tax is,
Negative Income Tax
Disposable
Income C
B Disposable Income
D A
$10,000
45O
Before Tax Market Income
55.
The solid line shows the person’s disposable income. The lump sum
transfer from the Government is $10,000 at point D. As the person earns
income in the market place tax is paid just on that income. The slope of DB
reflects that first rate of income tax. At point A the tax paid equals the lump
sum transfer payment. At point B the tax rate reduces and at C it increases.
The negative income tax is $10,000 because that is what the Government
gives the person.
56.
The characteristics of the disposable income line reflects the incentives
to work that are designed into the negative income tax system. The flatter is a
segment the higher is the tax rate. Different designs shift the disposable
income line and alter the slopes of the segments,
i.e. the tax rates.
57.
The slope of DB reflects a relatively high first tax rate to clawback the
transfer. Point A is the clawback point, where tax paid equals the transfer
received, and is always at a market income of the lump sum divided by the
first tax rate, $10,000/(tax rate) in this case. A lower first income tax rate
moves point A north-east and increases the fiscal cost of the scheme. Points
A and B could coincide.
58.
The type of tax schedule reflected in the diagram carries the problem
that the taxpayer-beneficiary can be trapped on segment DB. Schedules that
bend the other way can also leave them stuck - at a kink such as C.
59.
These sorts of problems apply to most tax schedules and they are not
peculiar to the negative income tax system. Their importance is that they
show that transfers, wages and taxes are only half of the incentive story.
60.
The full picture involves the individual’s personal evaluations.
The
incentive to work is not the after tax and transfer wage. The incentive is
the difference between this amount and the individual’s personal valuation of
an hour’s work times a constant. When this difference is positive a person will
increase the amount of work that they do.
C:\NRPortbl\iManage\SHENK\92754_1.doc
20180164 TOIA Binder New
Doc 2
Page 24 of 62
C:\NRPortbl\iManage\SHENK\92754_1.doc
20180164 TOIA Binder New
Doc 3
Page 25 of 62
IN-CONFIDENCE
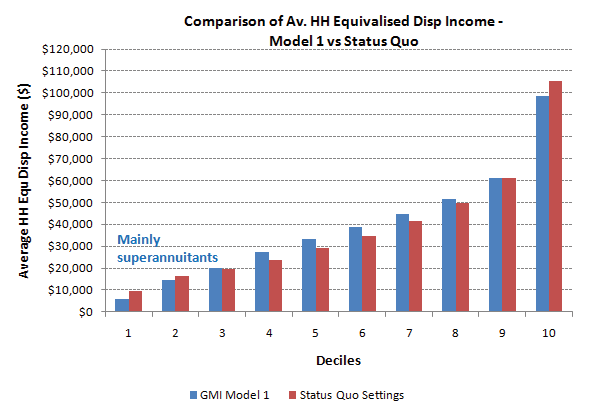
Modelling a Cost-Neutral Guaranteed Minimum Income (GMI) Scheme – Welfare Working Group 2010
STATUS QUO – Summary of fiscal costs and measures under
Model 1 – GMI with NZ Superannuation
Model 1 Contd.
settings for the 2011/12 tax year
Model specifications
Winners and Losers – Model 1 compared to status quo settings
The status quo model incorporates the personal tax structure as
Benefit system abolished
from 1 October 2010:
Status quo settings for NZ Superannuation retained
Families
Working for Families retained – payments for dependants aged 16
(total across
# Families
% Families
population)
Income
Rate
– 18 set to zero
$0 – 14,000
10.5%
Winners
1,485,353
65.86%
GMI scheme - payment of $300 per week for each person
$14,001 - $48,000
17.5%
Losers
769,433
34.12%
between the ages of 16 and 64 inclusive - people aged over 64
$48,001 - $70,000
30.0%
No Change
-
-
who do not receive NZ Superannuation are eligible for GMI
Over $70,000
33.0%
Total
All other settings and assumptions as per BEFU 2010
(approx.)
2,255,260
Mainly super
GST set at 15%
annuitants and high
Rates for core benefits, Working for Families and NZ
Fiscal Cost of GMI
Households
income earners
(total across
# HH
% HH
Superannuation and income projections are based on
population)
assumptions and settings from the
Budget Economic and Fiscal
Winners
1,004,174
60.51%
Update (BEFU), 2010
Weekly payment for GMI
$300
Total population
4,344,921
Losers
655,357
39.49%
# People eligible for GMI
2,839,284
No Change
-
-
Total
Total
1,659,531
($ millions)
Fiscal cost of GMI ($ millions)
$44,463
Financial Assistance
Equality and Poverty Measures
Invalid Benefit
$ 1,457.3
Estimating a flat tax for GMI
Sickness Benefit
$ 884.3
Domestic Purposes Benefit
$ 1,614.3
Total
Equality
Widows Benefit
$ 264.9
($ millions)
Measures
Unemployment Benefit
$ 1,082.1
Financial Assistance
Gini Coefficient
0.349
NZ Super and Veterans Pension
$ 8,246.3
General Minimum Income (GMI)
$ 44,463
80 / 20 Ratio
3.491
Under Age Non-Qualified Partner
$ 184.1
Working for Families
$ 2,813
Supplementary Assistance
$ 748.0
NZ Super and Veterans Pension
$ 8,262
Poverty Reference Line
Median HH disposable income
Other Benefits
$ 518.4
Social Transfers Total
$ 55,537
(equivalised)
Student Allowance
$ 319.9
Relative Reference
$36,009
Working for Families Tax Credit Total
$ 2,848.2
Taxation
Social Transfers Total
$ 17,983.7
Taxable income
$ 122,380
Poverty line: % of relative reference line
% HH below poverty line
Tax NZ Super
$ 969
50% relative
22.2%
Taxation
Total Tax payable
$ 23,801
60% relative
27.4%
Tax on Benefits
$ 584.5
70% relative
32.3%
Tax on Super
$ 967.2
Net Benefit Cost (Tax Payable – Total
Other income tax
$ 22,939.0
Social Welfare)
-$ 31,736
Individual Rebates
$ 18.9
The redistributive effect of GMI with NZ Superannuation
Tax Payable
$ 24,471.8
For cost-neutrality (
whereby social assistance payments are fully
funded by personal tax revenue), tax payable needs to be $
Better off compared to SQ - households in deciles 3 to 8
Equality
55,537 million
Worse off - mainly superannuitants who are in deciles 1 and 2 and high
Measures
Revenue from personal taxes under 1 October 2010 settings is
income earners (mainly decile10) whose higher tax contribution exceeds
Gini Coefficient
0.355
estimated at $ 23,801 million
the GMI payment
80 / 20 Ratio
3.010
Additional amount to raise from personal tax to fund GMI $ 31,736
million
Poverty Reference Line
Median HH disposable income
(equivalised)
The tax rate that raises this additional amount is ($55,537 /
Relative Reference
$31,671
$122,380) ≈
45.4% (this is the flat tax rate for cost-neutrality)
Poverty line: % of relative reference line
% households below poverty line
Taxwell simulation with a flat tax of 45.4%
50% relative
13.4%
60% relative
23.7%
Total
70% relative
32.1%
($ millions)
Financial Assistance
Notes:
General inimum Income (GMI)
$ 44,463
Increase
This analysis is based on Statistics New Zealand’s ‘
Household
Working for Families
$ 2,946
mainly due to
MFTC
and Economic Survey’ (HES) 2008/09 – results are subject to
NZ Super and Veterans Pension
$ 4,596
sampling error
Social Transfers Total
$ 52,005
Fiscal cost estimates detailed here are generated using
Taxation
Broadly cost-
Treasury’s static micro-simulation model ‘Taxwel ’ – these may
Taxable income
$ 118,716
neutral
differ from official Inland Revenue Department (IRD) and Ministry of
Tax NZ Super
$ 2,081
Social Development (MSD) forecasts
Total Tax payable
$ 53,843
IN-CONFIDENCE
1
20180164 TOIA Binder New
Doc 3
Page 26 of 62
IN-CONFIDENCE
Modelling a Cost-Neutral Guaranteed Minimum Income (GMI) Scheme – Welfare Working Group 2010
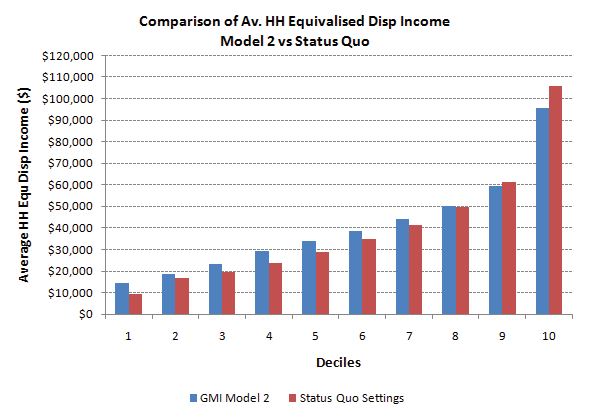
Model 2 – GMI without NZ Superannuation
Model 2 Contd.
Model 2A – Model 2 without Working for Families
Model specifications
Winners and Losers - Model 2 compared to status quo settings
Model specifications
Benefit system abolished
Families
# Families
% Families
As for model 2 but with Working for Families abolished and
NZ Superannuation abolished
(total across
replaced with a payment of $86 per child per week (assuming
population)
Working for Families retained – payments for dependants aged 16
Winners
1, 466,69
65.03%
child is aged 0 to 15)
– 18 set to zero
Losers
788,094
34.94%
GMI scheme - payment of $300 per week for each person aged
No Change
-
-
Fiscal Cost
16 years and older.
Total
2,255,260
All other settings and assumptions as per BEFU 2010
(approx.)
Weekly payment for GMI
$300
Fiscal Cost of GMI
Households
# HH
% HH
Total population
4,344,921
(total across
# People eligible for GMI
3,361,325
population)
# Children eligible for weekly
983,596
Winners
1,039,695
62.65%
Weekly payment for GMI
$300
payment
Losers
619,836
37.35%
Total population
4,344,921
No Change
-
-
# People eligible for GMI
3,361,325
Total
1,659,531
Fiscal cost of GMI ($ millions)
$52,638
Total
($ millions)
Financial Assistance
Total
Equality and Poverty Measures
General Minimum Income (GMI)
$ 52,638
($ millions)
Weekly child payment
$ 4,416
Financial Assistance
Equality
Social Transfers Total
$ 57,054
General Minimum Income (GMI)
$ 52,638
Measures
Working for Families
$ 2,819
Gini Coefficient
0.294
Taxation
Social Transfers Total
$ 55,458
80 / 20 Ratio
2.622
Taxable income
$ 114,127
Total Tax payable
$ 22,581
Taxation
Poverty Reference Line
Median HH disposable income
Taxable income
$ 114,127
(equivalised)
Net Benefit Cost (Tax Payable – Total
-$ 34,473
Total Tax payable
$ 22,581
Relative Reference
$36,381
Social Welfare)
Net Benefit Cost (Tax Payable – Total
-$ 32,876
Poverty line: % of relative reference line
% HH below poverty line
Tax rate that funds this scheme
50%
Social Welfare)
50% relative
14.1%
60% relative
22.7%
Taxwell simulation with a flat tax of 50%
For cost-neutrality (
whereby social assistance payments are fully
70% relative
29.0%
funded by personal tax revenue), tax payable needs to be
Total
$55,458 mil ion
The redistributive effect of GMI without NZ Superannuation
($ million )
Revenue from personal taxes under 1 October 2010 tax settings
Social Transfers Total
$ 57,054
is estimated at $22,581 mil ion
Better off compared to SQ - mainly households in deciles 1 to 7
Additional amount to raise from personal taxes to fund GMI
Worse off – households in deciles 9 and 10
Taxation
Taxable income
$ 114,127
$32,876 million
Total Tax payable
$ 57,042
The tax rate that raises this additional amount is ($55,458 /
$114,127) ≈
48.6% (this is the flat tax rate for cost-neutrality)
Equality and Poverty Measures
Taxwell simulation with a flat tax of 48.6%
Equality
Measures
Total
Gini Coefficient
0.292
($ million )
80 / 20 Ratio
2.646
Financial Assistance
General Minimum Income (GMI)
$ 52,638
Poverty Reference Line
Median HH disposable income
Working for Families
$ 2,993
(equivalised)
Social Transfers Total
$ 55,631
Relative Reference
$36,644
Taxation
Broadly cost-
Taxable income
$ 114,127
Other poverty measures similar to those for model 2
neutral
Total Tax payable
$ 55,444
Contacts for further information:
A flat tax of ≈
49% (that broadly allows cost-neutrality) converts
Gerald Minnee s9(2)(k)
Omar A. Aziz s9(2)(k)
the tax less transfers deficit to a surplus
IN-CONFIDENCE
2
Manager - Economic, Research
Analyst - Economic Research and
and Analysis Unit
Analysis Unit
20180164 TOIA Binder New
Doc 4
Page 27 of 62
IN-CONFIDENCE
The Treasury’s position on income adequacy and
poverty: previous advice and potential directions
Barbara Annesley
7 April 2017
1
20180164 TOIA Binder New
Doc 4
Page 28 of 62
IN-CONFIDENCE
Executive Summary
This report reviews previous Treasury advice on policy settings that directly influence income
adequacy: taxes and transfers, wages and other work incentives. It considers this advice in relation
to data about the adequacy of current benefits and wages, evidence on the effectiveness of different
levers for addressing poverty, and wider social and labour market changes.
Deleted - Not Relevant to Request
2
20180164 TOIA Binder New
Doc 4
Page 29 of 62
IN-CONFIDENCE
Current and emerging labour market trends in New Zealand and overseas point to risks associated
with low work intensity and precarious employment. These risks may contribute to reduced income
adequacy, security, mobility and smoothing over the life-course. In response to such trends there
have been calls for a shift from highly targeted to universal forms of income support, and from re-
distributive mechanisms (such as tax credits) to approaches that ensure earned income is sufficient
to meet basic needs (such as ‘living wage’ proposals).
While previous Treasury advice is high quality, analytically sound and reflective of the agencies wider
economic and fiscal interests, there is scope to strengthen it further. Suggested areas of focus for
future work include: clarifying the application of the Living Standards Framework and investment
approach to some income adequacy policy settings; better articulation of the respective roles and
application of targeted and universal approaches; additional analysis and modelling of the universal
basic income or similar concepts; the provision of advice on opportunities to improve the integrity
and coherence of the tax and transfer system; and a deep-dive analysis of trends and determinants
of wage levels at the lower end of the income distribution.
3
20180164 TOIA Binder New
Doc 4
Page 30 of 62
IN-CONFIDENCE
Introduction
1. This report reviews previous Treasury advice related to income adequacy, considers relevant
New Zealand and overseas trends and developments, and identifies potential areas of focus and
opportunities to strengthen future Treasury advice.
2. Deleted - Not Relevant to Request
3.
4. This report is accompanied by a slide pack that provides visual and summary information on the
key points.
4
Pages 5-17 Deleted - Not Relevant to Request
20180164 TOIA Binder New
Doc 4
Page 31 of 62
IN-CONFIDENCE
Deleted - Not Relevant to Request
•
Treasury advice on directions for change in existing policy
se
(slide 17)
44. Deleted - Not Relevant to Request
45.
46. A consistent message in Treasury advice is that universal benefits, and changes to tax settings
and wage levels (e.g. minimum wage increases, a ‘living wage’) are ineffective mechanisms for
addressing poverty and material hardship. Advice notes that they are costly and poorly targeted,
with the potential to create significant labour market and economic distortions.
47. Deleted - Not Relevant to Request
18
Pages 19-25 Deleted - Not Relevant to Request
20180164 TOIA Binder New
Doc 4
Page 32 of 62
IN-CONFIDENCE
Deleted - Not Relevant to Request
78.
79.
Emerging challenges to targeted approaches to income support
and social investment
(slide 24)
80. Central to Treasury’s advice on income adequacy and the social investment approach is an
emphasis on closely targeting assistance to those who stand to benefit the most, including using
administrative data to identify risk propensity.
12 The OECD defines activation strategies as aiming to
“bring more people into the effective labour force, to counteract the
potential effects of unemployment and related benefits on work incentives by enforcing their conditionality on active job
search and participation in measures to improve employability, and to manage employment services and other measures so
that they effectively promote and assist the return to work” (Martin, 2014, Pg 3)
26
20180164 TOIA Binder New
Doc 4
Page 33 of 62
IN-CONFIDENCE
81. Standing in stark contrast to this is the growing political momentum and popular support for
more universal and broad-based approaches to poverty reduction, such as through the provision
of universal child benefits or a universal basic income (UBI) to replace existing means-tested and
work-tested income support.
Universal basic income (slide 25)
82. The idea of a Universal Basic Income has a long history, and has recently re-emerged in response
to a range of social and economic changes. These include increased inequality of income and
wealth, the changing nature of work (particularly the rise of precarious and part-time
employment), lack of recognition and value attached to unpaid family responsibilities and
voluntary work, and concerns about some of the downsides of narrowly targeted income support
(e.g. their stigmatising nature, poverty traps and work disincentives, and administrative
complexity).
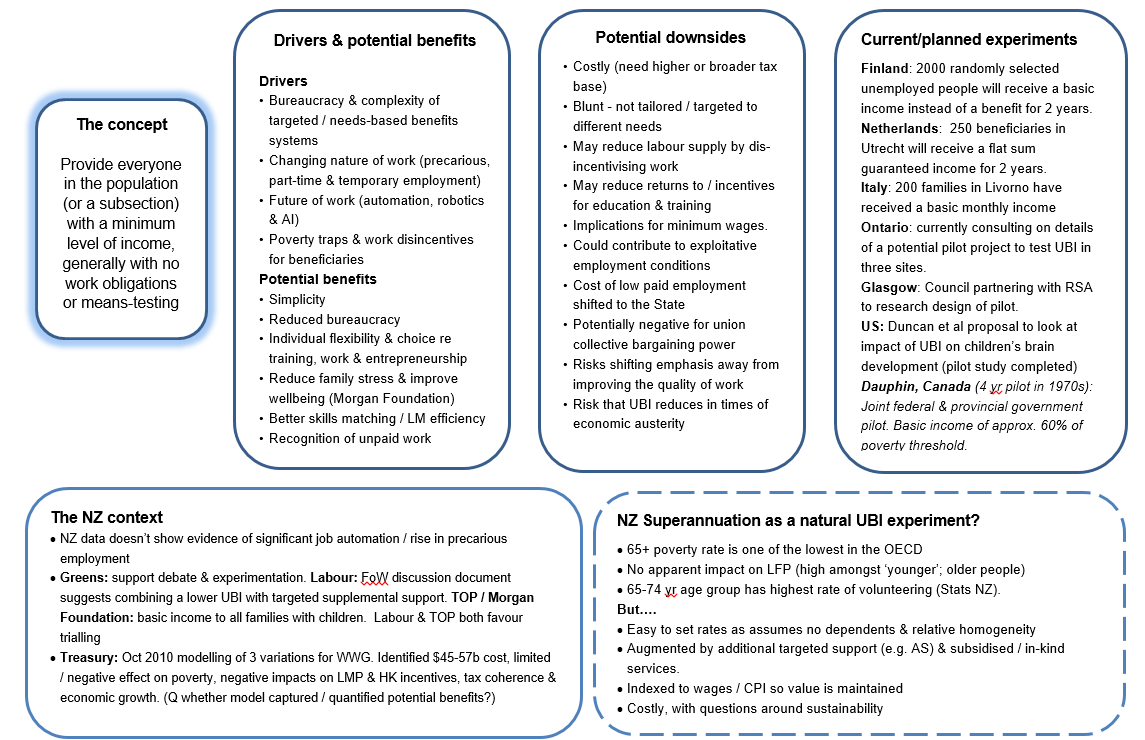
83. The general idea of a UBI is to provide everyone in the population (or a subsection thereof) with
a minimum level of income, generally with no work obligations or means-testing. It’s important
to note, however that there is not one version of UBI – specific versions can include abatements
and targeted additional support.
84. Proponents of a UBI suggest that it is likely to have multiple and varied benefits, including
reduced bureaucracy as a result of its administrative simplicity, reduced family stress, improved
incentives to develop skills and be entrepreneurial, better skills matching and labour market
efficiency (as people will be able to be more selective about the employment they undertake)
and increased household savings and spending, contributing to economic growth.
85. Many of these suggested benefits are purely speculative, and the lack of a robust evidence base
makes it difficult to ascertain the extent to which they would be realised. Many commentators
and policymakers have drawn attention to the significant costs associated with implementing a
UBI, along with other issues such as negative effects on work incentives, reduced returns to skills,
potential for employers to reduce wages and exploit vulnerable workers; regressive
redistribution of government transfers to middle income earners.
86. For these reasons, even many of those who support the UBI concept in principle advocate a
cautious approach to its adoption, such as small-scale trials to its effectiveness in delivering
expected outcomes. Current and proposed overseas examples of such trials include:
•
Finland: 2000 randomly selected unemployed people will receive a basic income instead of a
benefit for 2 years
•
Netherlands: 250 beneficiaries in Utrecht will receive a flat sum guaranteed income for 2
years
•
Italy: 200 families in Livorno have received a basic monthly income, with plans to expand this
further
•
Ontario, Canada: the provincial government is currently consulting on details of a potential
pilot project to test UBI in three sites
•
Glasgow, Scotland: the city’s council is partnering with the Royal Society of Arts to research
the design of a pilot UBI project
27
20180164 TOIA Binder New
Doc 4
Page 34 of 62
IN-CONFIDENCE
•
USA: Professor Greg Duncan (an economist at the University of California) and colleagues
from a number of other major American universities have completed a pilot study looking at
the impact of UBI receipt on children’s brain development, and are planning a larger study
involving 1000 low-income mothers and their children.
87. Closer to home, several political parties have indicated support, to a greater or lesser extent, for
a UBI. The Green Party has said that they support debate and experimentation; the Labour Party
has signalled that it would consider a limited trial of a UBI, while its ‘Future of Work’ discussion
document suggests combining a lower UBI with targeted supplemental support. The newly
established ‘The Opportunities Party’, has released a detailed proposal outlining a progressive
approach to introducing an Unconditional Basic Income, starting with $200 per week to all
families with children aged under 3 (replacing paid parental leave) and for all people aged over
65 (replacing New Zealand Superannuation, but accompanied by a means-tested top-up). This
would be augmented by an additional non-work tested payment of $72 per week to all low
income families with dependent children (replacing the current In-Work Tax Credit) and free full-
time childcare for the under 3 year olds from families with low income parents engaged in any
paid work.
88. While Treasury hasn’t undertaken a general analysis of UBI, in 2010 it undertook ‘preliminary’
modelling for the Welfare Working Group (WWG) on a specific UBI proposal involving a universal
and unconditional payment of $300 per week to all individuals aged 16 and over, with an extra
payment to families with children. This modelling highlighted a range of issues and negative
consequences, not least of which is the considerable fiscal cost. The following table summarises
the Treasury’s conclusions about the GMI scheme, and this appears to stands as Treasury’s
advice on UBIs to date
(slide 26).
Table 4: UBI Benefits and Costs identified by the Treasury, 2010
Benefits
Costs
• More equal distribution of income
• Poverty is either increased across all relative levels as
• Removes disincentive for beneficiaries
Superannuitants have their payment decreased by
to undertake part-time work
44% on average*, or is increased when measured at
• Poverty is reduced but only at the 60
the 50 percent relative level*.
and 70 percent relative levels*
• Horizontal equity problems due to differential
• May improve labour market outcomes in
treatment of one and two parent families
some areas: more employee flexibility;
• Many current beneficiaries (e.g. sole parents, the
encourages unpaid work; additional
disabled and carers) will be financially worse off
employee bargaining power; encourages
under the scheme
entrepreneurial activity; and reduces the
• Reduces the supply of labour: decreases hours
opportunity cost of full time training or
worked; increases migration of skilled workers;
education.
discourages people from taking entry level jobs;
• Lowers administrative, management and
discourages further education and training; and the
operating costs
EMTRs for families with children are very high
discouraging further work, MFTC*.
* These specific effects relate to one or more of
• High personal income taxes have negative
the three versions of the GMI that were modelled
implications for saving, investment and productivity
by Treasury. Fuller information is contained in
the Treasury report
• Lowers economic growth (estimated at 2.8
percentage points per year)
• Non-alignment causes integrity and coherence issues
for the tax system
(GMI - A Preliminary Assessment of the Tax and Equity Implications:1909076) .
28
20180164 TOIA Binder New
Doc 4
Page 35 of 62
IN-CONFIDENCE
89. A core assumption in Treasury’s 2010 modelling was that the GMI scheme would be funded by
increased personal income tax, although it was noted that it may be possible to fund part of the
GMI by increasing other taxes, by base broadening, or by reducing government expenditure in
other areas.
90. In developing advice for the incoming government, Treasury should consider providing well-
considered advice on the risks and benefits of a UBI-type approach to income support, key design
considerations, and options for meeting the costs associated with such a policy. This is likely to
require new modelling to reflect different assumptions. Treasury could also consider presenting
alternative options that could achieve similar objectives to a UBI, with fewer downsides.
91. More generally, the UBI debate highlights the perceived binary nature of targeted and universal
approaches to improving income adequacy and distribution. In reality, all systems have a
combination of both approaches. Even within an investment approach, there will continue to be
a core set of universal provisions (e.g. in health and education), with explicit decisions needed
about the balance between these and more targeted interventions.
92. There may be value in Treasury better articulating the respective roles of targeted vs universal
support and services. A report by Gugushvili and Hirsch (2014) reviews the effectiveness of
universal and targeted social spending in reducing poverty, against the background of
longstanding debate and emerging evidence in this area. They note that the universal vs. means-
tested debate is far from resolved, but that more recent studies have challenged the previously
established correlation between universal systems, higher redistribution and improved poverty
reduction. Sen (2009) whose work on capabilities has strongly influenced Treasury’s Living
Standards Framework, has also written on the political economy of targeting.
Deleted - Not Relevant to Request
29
20180164 TOIA Binder New
Doc 4
Page 36 of 62
IN-CONFIDENCE
Deleted - Not Relevant to Request
30
20180164 TOIA Binder New
Doc 4
Page 37 of 62
IN-CONFIDENCE
Deleted - Not Relevant to Request
31
20180164 TOIA Binder New
Doc 4
Page 38 of 62
IN-CONFIDENCE
Suggested areas of focus for future Treasury advice
Deleted - Not Relevant to Request
32
20180164 TOIA Binder New
Doc 4
Page 39 of 62
IN-CONFIDENCE
Deleted - Not Relevant to Request
• Clarifying its policy position and strengthening advice on the roles and respective uses of
targeted vs universal support and services, and the balance between them.
105.
With regard to welfare settings, Treasury could
(slide 31):
• Deleted - Not Relevant to Request
• Refresh modelling and analysis in relation to the universal basic income concept, to take
account of current international developments and New Zealand proposals (though not
costing specific political party policies);
• Deleted - Not Relevant to Request
•
106.
•
•
•
Deleted - Not Relevant to Request
33
Pages 34-42 Deleted - Not Relevant to Request
20180164 TOIA Binder New
Doc 4
Page 40 of 62
IN-CONFIDENCE
References
Anon (2009) Design of the Income Tax / Transfer System: Background Paper for the Tax
Working Group. 24 July 2009.
Australian Government Productivity Commission (2015) Tax and Transfer Incidence in
Australia. Commission Working Paper, Canberra. October 2015
Burton, Tony, Louise Butler, Melissa Piscetek, Caroline Reid, Paul Rodway and Robert
Templeton (2016) The benefits of improved social sector performance. Background paper for
He Tirohanga Mokopuna: 2016 Statement on the Long-Term Fiscal Position. New Zealand
Treasury. November 2016
Cleland, Alice, Amapola Generosa, Ben Wallace, Dan Harvey and Holly Norton (2016) The
workforce, workplace and the nature of work: A snapshot of key trends. Ministry of Business,
Innovation and Employment.
Conway, Paul, Lisa Meehan & Dean Parham (2015) Who benefits from productivity growth? –
The labour income share in New Zealand, New Zealand Productivity Commission Working
Paper 2015/1. Wellington: Productivity Commission.
Design of the Income Tax/Transfer System: Background paper for the Tax Working Group
(http://www.victoria.ac.nz/sacl/cagtr/twg/Publications/taxes_transfers.pdf)
Eichhorst, Werner (2017) Labour market institutions and the future of work: Good jobs for all?
IZA Institute of Labour Economics Policy Paper Series. IZA Policy Paper No. 122. January 2017
Fletcher, Michael (2015) The structure and generosity of financial assistance for beneficiaries:
How New Zealand compares with other OECD countries. March 2015. Retrieved from the
New Zealand Ministry of Social Development website
(https://www.msd.govt.nz/documents/about-msd-and-our-work/publications-
resources/research/social-assistance-international-comparisons/social-assistance-
international-comparisons-publication-version.docx
Gregg, Paul (2012) Pre-distribution opens up a new set of policy tools but also a key constraint.
www.blogs.lse.ac.uk
Gugushvili, Dimitri and Donald Hirsch (2014) Means-tested and universal approaches to
poverty: international evidence and how the UK compares. Centre for Research in Social Policy
Working Paper 640. Loughborough University. August 2014
Hirsch, Donald (2013) Paying for children: the state’s changing role and income adequacy.
Journal of Social Policy. Volume 42, Number 3, Pgs 495-512
Hurnard, Roger (2012) The assessment of retirement income system options. A paper for the
external panel on the Treasury’s long-term fiscal statement. October 2012
43
20180164 TOIA Binder New
Doc 4
Page 41 of 62
IN-CONFIDENCE
Johnson, Jennifer and Kristie Carter (2015) Increasing Equity Background Paper. Treasury’s
Living Standards Framework Papers. The New Zealand Treasury. December 2015
Leoni, Thomas (2015) The social investment perspective as guiding principle for welfare state
adjustment. WIFO (the Austrian Institute for Economic Research). May 2015
Maloney, Tim and Amanda Gilbertson (2013) A literature review on the effects of Living Wage
policies. Auckland Council technical report TR2013/034
Martin, John (2014) Activation and active labour market policies in OECD countries: stylised
facts and evidence on their effectiveness. IZA Policy Paper No 84. June 2014
Nolan, Patrick (2017) Family and work tax credits in five liberal welfare states. Presentation to
Australasian Tax Teachers Association Conference. January 2017
Nolan, Patrick (2007) Lifting families’ incomes. Policy Quarterly. Volume 3, Issue 2, Pgs 22-29
Nolan, Patrick (undated) When work and marriage do not pay: poverty traps and marriage
penalties in New Zealand’s tax-benefit system. New Zealand Institute for Economic Research.
OECD (2016) Benefits and Wages Indicators. Printed on 22/03/2017 from
www.oecd.org/ols/social/workincentives
Pacheco, Gail, Philip S Morrison, Bill Cochrane, Stephen Blumenfeld and Bill Rosenberg
(undated) Understanding insecure work. New Zealand Work Research Institute and Victoria
University of Wellington Centre for Labour, Employment and Work.
Perry, Bryan (2016) Household incomes in New Zealand: Trends in indicators of inequality and
hardship 1982 to 2015. Ministry of Social Development, Wellington. August 2016
Raven, Jason (2015) Financial incentives to work: the size of the margin between benefits and
in-work incomes. Policy Quarterly. Volume 11, Issue 4, November 2015, Pgs 26-33
Rosenberg, Bill (2014) New Zealand’s wages system is buggered. Briefing papers.
www.briefingpapers.co.nz
Sen, Amartya (1995) The political economy of targeting. In: Van de Walle, D and Nead K (eds)
Public Spending and the Poor: Theory and Evidence. John Hopkins University Press. Baltimore
The Treasury (2010) A guaranteed minimum income for New Zealand: A preliminary
assessment of the tax and equity implications. Welfare Working Group Options for Reform.
October 2010
Victoria University of Wellington Tax Working Group (2010) A Tax System for New Zealand’s
Future. Report of the Victoria University of Wellington Tax Working Group. January 2010
44
20180164 TOIA Binder New
Doc 4
Page 42 of 62
IN-CONFIDENCE
Other source documents
Adema, Willem (2011) Setting the scene: the mix of family policy objectives and packages
across the OECD. Children and Youth Services Review, Vol 34 (2012) Pgs 487-498.
Aziz, Omar, Norman Gemmell and Atheme Laws (2013) The distribution of income and fiscal
incidence by age and gender: Some evidence from New Zealand. Victoria University of
Wellington, Working Papers in Public Finance. Working Paper 10/2013
Broadway, Barbara, Guyonne Kalb, Duncan McVicar and Bill Martin (2016) The impact of paid
parental leave on labour supply and employment outcomes. Melbourne Institute Working
Paper Series. Working Paper No. 9/16. University of Melbourne Faculty of Business and
Economics. March 2016
www.basicincome.org – articles on basic income pilots being undertaken in various
jurisdictions around the world
Colombino, Ugo (2015) Is unconditional basic income a viable alternative to other social
welfare measures? IZA World of Labour 2015: 128. February 2015 www.wol.iza.org
Crampton, Eric (2016) I love the idea of a Universal Basic Income. But here’s the problem. 31
March 2016. www.thespinoff.co.nz
Creedy, John (undated) Designing tax and transfer schemes: some basic principles.
Fletcher, Michael (2016) A Universal Basic Income may be a good idea but we will still need
social security that works. 30 March, 2016. www.briefingpapers.co.nz
NZIER (2016) Defining social investment, Kiwi-style. NZIER pubic discussion paper. Working
Paper 2016/5. December 2016
Perry, Bryn (2016) The material wellbeing of New Zealand households: trends and relativities
using non-income measures, with international comparisons. Ministry of Social Development.
August 2016
Rankin, Keith (2016) Universal Basic Income and Income Tax Reform. 22 March 2016.
www.briefingpapers.co.nz
Statistics New Zealand (2016) Household living-cost price indexes: Background. October 2016
www.statistics.govt.nz
Stewart, Miranda, Andre Moor, Peter Whiteford and R Quentin Grafton (2015) A stocktake of
the tax system and directions for reform: five years after the Henry Review. Tax and Transfer
Policy Institute, Crawford School of Public Policy. Australian National University. February
2015
Social Policy Evaluation and Research Unit (2015) Perceptions of income adequacy by low
income families. SUPERU, January 2015
The Opportunities Party: UBI and Thriving Families. www.top.org.nz
45
20180164 TOIA Binder New
Doc 4
Page 43 of 62
IN-CONFIDENCE
Van Der Linden, Bruno (2016) Do in-work benefits work for low-skilled workers? IZA World of
Labour 2016: 246. March 2016 www.wol.iza.org
Whiteford, Peter (undated presentation) adequacy of social security benefits for working age
households: a comparative assessment. Crawford School of Public Policy, Australian National
University
http://www.google.co.nz/url?sa=t&rct=j&q=&esrc=s&source=web&cd=1&cad=rja&uact=8&ve
d=0ahUKEwij2IPYsP3SAhVilVQKHTdPAfcQFggYMAA&url=http%3A%2F%2Frsss.anu.edu.au%2Fs
ites%2Fdefault%2Ffiles%2FPeterWhiteford.pdf&usg=AFQjCNF_lCVAns-XDZpdU0rxjWx90iqQiQ
46
20180164 TOIA Binder New
Doc 4-1
Page 44 of 62
The Treasury’s position on
income adequacy and poverty:
Previous advice and
possible future d
irections
Barbara Annesley
7 April 2017
20180164 TOIA Binder New
Doc 4-1
Page 45 of 62
Purpose and scope
This work:
Identifies policy levers and reviews policy advice
Discusses emerging trends and issues
Makes suggestions for areas for further work and focus
It doesn’t:
Provide an exhaustive review of advice, da ta and evidence
Include a detailed discussion of definitional and measurement issues
Consider the distribution of income (inequality)
Propose specific policy changes
2
20180164 TOIA Binder New
Doc 4-1
Page 46 of 62
Setting the scene:
Measures, data and policy levers
Pages 4-12 Deleted - Not Relevant to Request
3
20180164 TOIA Binder New
Doc 4-1
Page 47 of 62
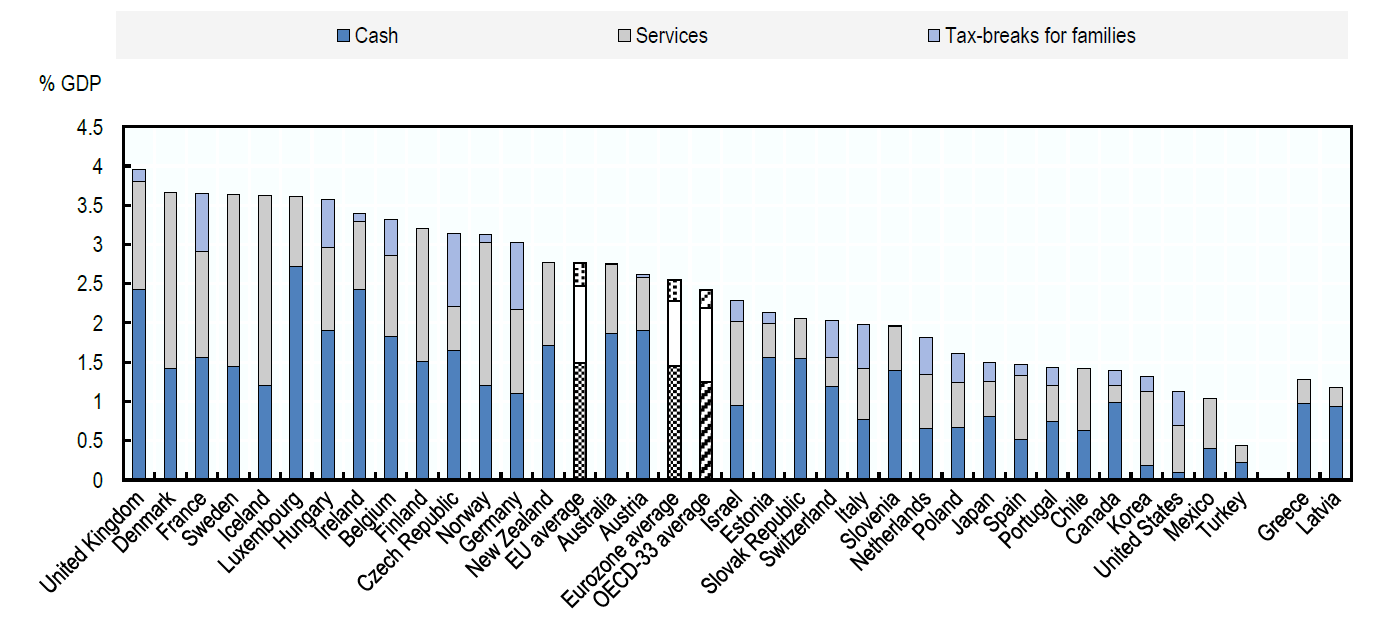
NZ has a mix of measures (noting difficulty of cross-
country comparisons)
Public spending on family benefits in cash, in-kind and through tax measures (percentage of GDP, 2013)
Source: OECD Benefits and Wage Indicators Database
13
20180164 TOIA Binder New
Doc 4-1
Page 48 of 62
Previous Treasury advice:
Frameworks used, issues identified and proposed
directions for change
14
20180164 TOIA Binder New
Doc 4-1
Page 49 of 62
Deleted - Not Relevant to Request
15
20180164 TOIA Binder New
Doc 4-1
Page 50 of 62
Deleted - Not Relevant to Request
16
20180164 TOIA Binder New
Doc 4-1
Page 51 of 62
Suggested areas for change identified in Treasury
advice (mainly 2013-15)
Deleted - Not Relevant to Request
Universal benefits and changes to personal tax settings and wage levels are not supported as ways to lift
incomes (high cost, poorly targeted, potential distortionary economic and labour market effects)
Deleted - Not Relevant to Request
Pages 18-21 Deleted - Not Relevant to Request
17
20180164 TOIA Binder New
Doc 4-1
Page 52 of 62
New and emerging considerations:
The nature and quality of employment; challenges
to current paradigms
22
20180164 TOIA Binder New
Doc 4-1
Page 53 of 62
Deleted - Not Relevant to Request
23
20180164 TOIA Binder New
Doc 4-1
Page 54 of 62
Challenges to existing paradigms, settings and
advice
Universal vs. targeted approaches to addressing poverty:
UBI the most obvious example (a response to increased targeting, ‘new social risks’
and changing nature of work)
In reality universal vs. targeted approaches are binary – there’s a place for both
Treasury’s 2010 modelling based on specific set of features and assumptions. Worth
re-visiting and doing modelling a few options
24
20180164 TOIA Binder New
Doc 4-1
Page 55 of 62
Universal Basic Income
25
20180164 TOIA Binder New
Doc 4-1
Page 56 of 62
Previous Treasury advice on UBI
Benefits
Costs
More equal distribution of income
Poverty is either increased across all relative levels as Superannuitants
Removes disincentive for beneficiaries to
have their payment decreased by 44% on average*, or is increased
undertake part-time work
when measured at the 50 percent relative level*.
Poverty is reduced but only at the 60 and 70
Horizontal equity problems due to differential treatment of one and
percent relative levels*
two parent families
May improve labour market outcomes in
Many current beneficiaries (e.g. sole parents, the disabled and carers)
some areas: more employee flexibility;
will be financially worse off under the scheme
encourages unpaid work; additional employee
Reduces the supply of labour: decreases hours worked; increases
bargaining power; encourages entrepreneurial
migration of skilled workers; discourages people from taking entry level
activity; and reduces the opportunity cost of
jobs; discourages further education and training; and the EMTRs for
full time training or education.
families wit
h children are very high discouraging further work, MFTC*.
Lowers administrative, management and
High personal income taxes have negative implications for saving,
operating costs
investment and productivity
Lowers economic growth (estimated at 2.8 percentage points per year)
Non-alignment causes integrity and coherence issues for the tax system
* These specific effects relate to one or more of the three versions
of the GMI that were modelled by Treasury.
26
20180164 TOIA Binder New
Doc 4-1
Page 57 of 62
Deleted - Not Relevant to Request
27
20180164 TOIA Binder New
Doc 4-1
Page 58 of 62
Deleted - Not Relevant to Request
28
20180164 TOIA Binder New
Doc 4-1
Page 59 of 62
Potential areas of f ocus for future
Treasury advice
29
20180164 TOIA Binder New
Doc 4-1
Page 60 of 62
At a strategic level, Treasury could:
Deleted - Not Relevant to Request
Clarify its policy position and strengthen advice on the roles and respective uses
of targeted vs universal support and services, and the balance between them
30
20180164 TOIA Binder New
Doc 4-1
Page 61 of 62
Deleted - Not Relevant to Request
31
20180164 TOIA Binder New
Doc 4-1
Page 62 of 62
Deleted - Not Relevant to Request
32
Document Outline