2
Distributional impacts of OCR changes across income deciles
Which socioeconomic groups bear the greatest burden of inflation control
2. MONETARY POLICY COMMITTEE DELIBERATIONS
2.1 Social Impact Considerations:
Please provide documentation of:
Whether the Monetary Policy Committee (MPC) receives briefings on potential
social harm impacts before OCR decisions
Whether MPC meeting minutes record discussion of suicide risk, mental health
impacts, or social harm
Any framework or guidance requiring MPC to consider social impacts alongside
inflation and employment mandates
2.2 Trade-off Analysis:
Please provide any Reserve Bank analysis of:
The social cost of reducing inflation through OCR increases (lives lost, mental
health harm, family violence) versus the cost of tolerating higher inflation
Whether the Reserve Bank has quantified the "acceptable" level of social harm in
pursuit of the inflation target
Cost-benefit analysis comparing inflation costs versus monetary tightening costs
(including social harm)
2.3 Alternative Approaches:
Please provide any Reserve Bank analysis comparing:
Social harm impacts of OCR-based inflation control versus alternative tools
(macroprudential policy, fiscal coordination)
International examples of central banks using less socially harmful inflation
control methods
Whether targeted approaches (e.g., sector-specific tools) could reduce inflation
with less col ateral damage
3. STATISTICAL MONITORING AND RESEARCH
3.1 Time-Series Analysis:
Please provide any Reserve Bank research examining:
Whether OCR changes are a leading indicator of changes in suicide rates (with
lag analysis)
Historical correlations between previous tightening cycles (1997-1998, 2004-2007,
2
UNCLASSIFIED
3
2021-2023) and mortality data
Econometric modeling of causal pathways: OCR → mortgage stress → mental
health crisis → suicide
3.2 Data Col ection:
Please confirm:
Whether the Reserve Bank col ects or receives data on suicide rates, mental
health hospitalizations, or social harm indicators
Whether the Reserve Bank has requested such data from Stats NZ, Ministry of
Health, or other agencies
Whether the Reserve Bank monitors real-time indicators of social distress during
tightening cycles
3.3 Research Publications:
Please provide (titles and dates):
Any Reserve Bank Analytical Notes, Discussion Papers, or Bulletins examining
social impacts of monetary policy
Any internal research or commissioned studies on health ef ects of OCR changes
Any literature reviews conducted by RBNZ on international research linking
monetary policy to mortality
4. REMIT AND LEGISLATIVE FRAMEWORK
4.1 Current Remit Interpretation:
The Reserve Bank's remit includes maintaining price stability and supporting
maximum sustainable employment. Please provide:
The Reserve Bank's interpretation of whether "supporting maximum sustainable
employment" includes considering the health and wellbeing of the workforce
Whether the Reserve Bank considers premature death (suicide) due to financial
stress as relevant to the employment objective
Any legal advice on whether the Reserve Bank has authority or obligation to
consider social harm in OCR decisions
4.2 Remit Evolution:
Please provide documentation of:
Any recommendations the Reserve Bank has made to Ministers regarding
expanding the remit to include social wel being considerations
Any analysis of whether the current remit adequately accounts for social costs of
monetary policy
3
UNCLASSIFIED
4
Comparisons with other central banks' mandates that explicitly include wel being
or social cohesion objectives
4.3 Crown Entity Responsibilities:
As a Crown entity, please confirm:
Whether the Reserve Bank considers itself bound by the Public Service Act 2020's
commitment to wellbeing
Whether the Reserve Bank applies the Living Standards Framework in policy
analysis
How the Reserve Bank reconciles pursuit of inflation targets with broader
government wel being objectives
5. COORDINATION WITH OTHER AGENCIES
5.1 Health Sector Coordination:
Please provide documentation of:
Any formal coordination with Ministry of Health or Health NZ regarding mental
health impacts of monetary policy
Whether the Reserve Bank notifies health agencies in advance of significant OCR
increases to prepare for demand spikes
Any joint analysis between RBNZ and health agencies on monetary policy health
impacts
5.2 Treasury Coordination:
Please provide documentation of:
Whether the Reserve Bank shares analysis of social costs of monetary policy with
Treasury
Whether Treasury's fiscal forecasts incorporate RBNZ's assessment of OCR-
induced social harm
Any disagreement between RBNZ and Treasury on the social costs of inflation
control
5.3 Social Sector Agencies:
Please confirm whether the Reserve Bank coordinates with:
Ministry of Social Development on benefit demand forecasts during tightening
cycles
Oranga Tamariki on child welfare impacts of household financial stress
Ministry of Justice on crime and family violence correlations with economic stress
4
UNCLASSIFIED
5
6. INTERNATIONAL COMPARISONS AND BEST PRACTICE
6.1 Peer Central Banks:
Please provide any Reserve Bank analysis comparing New Zealand's approach
with:
Reserve Bank of Australia's consideration of social impacts
Bank of England's research on distributional ef ects of monetary policy
European Central Bank's work on monetary policy and inequality
Federal Reserve's dual mandate explicitly including "maximum employment"
6.2 Academic and International Research:
Please provide:
Any Reserve Bank review of international literature on monetary policy and
suicide rates
Awareness of research documenting correlations between financial crises,
austerity, and mortality (e.g., Stuckler & Basu, "The Body Economic")
Reserve Bank's position on whether this international evidence is relevant to New
Zealand monetary policy
6.3 BIS and IMF Guidance:
Please confirm:
Whether the Bank for International Settlements (BIS) or International Monetary
Fund (IMF) provide guidance on central banks considering social impacts
Whether the Reserve Bank participates in international forums discussing central
banking and wel being
Any international standards or best practices the Reserve Bank fol ows regarding
social impact assessment
7. COST-BENEFIT METHODOLOGY
7.1 Value of Statistical Life:
Please confirm:
Whether the Reserve Bank uses a Value of Statistical Life (VSL) figure in any
policy analysis
If yes, what VSL figure is used (noting Ministry of Transport uses $4.9 mil ion in
2021 dol ars)
Whether the Reserve Bank has calculated the VSL cost of suicides potential y
linked to financial stress from OCR increases
5
UNCLASSIFIED
6
7.2 Inflation Cost Calculation:
Please provide the Reserve Bank's methodology for:
Calculating the economic and social cost of inflation above the target band
Whether this includes quantification of inflation's impact on mortality, health, and
wellbeing
How the Reserve Bank compares the cost of inflation versus the cost of inflation-
fighting measures
7.3 Net Social Benefit:
Please provide any Reserve Bank analysis demonstrating:
That the social benefits of achieving the inflation target exceed the social costs of
the methods used to achieve it
How the Reserve Bank quantifies lives saved through price stability versus lives
lost through financial stress
Whether the Reserve Bank has a framework for determining when inflation
control costs exceed inflation costs
8. RECENT OCR CYCLE (2021-2024)
8.1 Latest Tightening Cycle:
For the OCR increases from 0.25% (October 2021) to 5.50% (May 2023), please
provide:
Any Reserve Bank analysis of projected social impacts before implementing
increases
Monitoring of actual social harm indicators during the tightening period
Post-implementation review assessing whether social harm materialized as
expected
Any adjustment to future decision-making based on observed social impacts
8.2 Mortgage Stress Projections:
Please provide any Reserve Bank modeling of:
Number of households projected to experience severe mortgage stress from the
2021-2023 OCR increases
Regional and demographic distribution of this stress
Expected increases in defaults, bankruptcies, and forced house sales
8.3 Alternative Scenarios:
Please provide any Reserve Bank analysis of:
6
UNCLASSIFIED
7
Whether a slower OCR increase path would have achieved inflation control with
less social harm
Whether alternative tools (loan-to-value ratios, debt-to-income limits) could have
reduced inflation without OCR increases
Why the chosen OCR path was selected over less aggressive alternatives
9. VULNERABILITY AND DISTRIBUTIONAL ANALYSIS
9.1 Impact on Vulnerable Groups:
Please provide any Reserve Bank analysis of OCR impacts on:
Low-income renters (through pass-through of landlord mortgage costs)
Māori and Pacific communities (who have higher debt-to-income ratios)
Single-parent families
Young people with recent mortgages
Small business owners with variable-rate business loans
9.2 Intergenerational Impacts:
Please provide:
Any Reserve Bank analysis of how OCR changes affect dif erent age cohorts
differently
Whether monetary policy systematically favors asset-holders over workers
Analysis of how OCR decisions affect intergenerational wealth distribution
9.3 Regional Impacts:
Please confirm:
Whether the Reserve Bank assesses regional variation in OCR impacts (e.g.,
Auckland mortgage holders versus rural communities)
Whether uniform national OCR settings create disproportionate harm in specific
regions
Any consideration of regional monetary policy tools to reduce distributional harm
10. TRANSPARENCY AND ACCOUNTABILITY
10.1 Public Communication:
Please provide:
Any Reserve Bank public communications acknowledging potential social harm
from OCR decisions
Whether OCR decision announcements include information on expected social
7
UNCLASSIFIED
8
impacts
Whether the Reserve Bank publishes health and social cost estimates alongside
economic projections
10.2 Ex-Post Assessment:
Please confirm:
Whether the Reserve Bank conducts post-implementation reviews of OCR
decisions including social outcomes
Whether the Reserve Bank tracks accuracy of its forecasts for employment,
income, and financial stress
Any mechanism for learning from cases where OCR changes caused greater
social harm than projected
10.3 Democratic Accountability:
Please provide the Reserve Bank's position on:
Whether unelected monetary policy of icials should have authority to make
decisions with life-and-death consequences without assessing those
consequences
How democratic accountability is maintained when social harm from OCR
decisions is not transparently reported
Whether the public has a right to know the Reserve Bank's assessment of social
costs before OCR decisions are made
11. SPECIFIC RESEARCH QUESTIONS
11.1 Has the Reserve Bank ever calculated how many additional suicides might
result from a 1% OCR increase through financial stress pathways?
11.2 Does the Reserve Bank have a threshold level of projected social harm that
would cause it to choose a dif erent policy path?
11.3 Has the Reserve Bank identified the OCR level at which social harm costs
begin to exceed inflation costs?
11.4 Does the Reserve Bank consider that maintaining operational independence
requires transparency about social impacts, or does independence mean avoiding
accountability for social consequences?
12. METHODOLOGICAL CAPABILITIES AND CONSTRAINTS
12.1 Current Analytical Capacity:
Please confirm:
8
UNCLASSIFIED
9
Whether the Reserve Bank has in-house expertise in health economics, sociology,
or public health to assess social impacts
Whether the Reserve Bank has capacity to conduct epidemiological analysis of
monetary policy health ef ects
What barriers prevent the Reserve Bank from modeling social harm impacts
12.2 Data Access:
Please confirm:
Whether the Reserve Bank has access to Stats NZ's Integrated Data Infrastructure
(IDI) for analyzing social impacts
Whether privacy or legal constraints prevent the Reserve Bank from accessing
health and mortality data
Whether the Reserve Bank has requested but been denied access to social harm
data
12.3 Modeling Limitations:
Please provide:
The Reserve Bank's assessment of whether its current macroeconomic models
can incorporate social harm variables
Whether technical constraints prevent including health and mortality in the
Reserve Bank's forecasting models
What additional resources or capabilities would be needed to comprehensively
model social impacts
Response
Under New Zealand’s monetary policy framework, Parliament is responsible for setting the
objectives of monetary policy through the Reserve Bank of New Zealand Act 2021 and the
Monetary Policy Committee Remit issued by the Minister of Finance. This provides democratic
legitimacy for monetary policy and allows elected representatives to make judgements about the
monetary policy regime that will best support the wellbeing of New Zealanders.
Currently, the Reserve Bank is tasked with setting monetary policy with the objective of achieving
and maintaining stability in the general level of prices over the medium term. Underpinning this
objective is a view that the best contribution that monetary policy can make to the wellbeing of
New Zealanders is to maintain price stability. The Monetary Policy Committee is also tasked with
seeking to avoid unnecessary instability in output, employment, interest rates and the exchange
rate. This requirement recognises that abrupt adjustments to monetary policy can generate wider
economic and societal costs that in some cases could be reduced through a more gradual
approach.
9
UNCLASSIFIED
10
Given this objective, the Reserve Bank does not have a mandate to evaluate the wider social and
health impacts of OCR decisions, so does not hold material relevant to most of the items in your
request.
We are, however, able to provide some material relevant to your request. We have some material
relating to the objectives of monetary policy, distributional impacts of monetary policy, and
monitoring of the impact of interest rates on loan arrears.
Links
https://www.rbnz.govt.nz/-/media/project/sites/rbnz/files/monetary-policy/monetary-policy-
handbook/monetary-policy-handbook-july-2024.pdf - Our monetary policy handbook - Chapter 2
discusses monetary policy objectives in more detail
Remit Review - Reserve Bank of New Zealand - Te Pūtea Matua – This page contains advice and
background material related to the 5-yearly review of the Monetary Policy Committee’s Remit. The
key document is the advice to the Minister of Finance.
Topic
Link
1.3 Employment and
An overview of the distributional effects of monetary policy
Income Impacts
1.3 Employment and
Monetary Policy Easing and the Distribution of Wealth in New
Income Impacts
Zealand - Reserve Bank of New Zealand …
1.3 Employment and
Research on the impact of lower interest rates on wealth and income
Income Impacts
- Reserve Bank of New Zealand -…
1.3 Employment and
Labour market cycles across dif erent groups: What does history tell
Income Impacts
us? Part I: Theory, ethnicitie…
1.3 Employment and
Labour Market Cycles Across Dif erent Groups: What Does History
Income Impacts
Tell Us? Part I : Age and Sex - Res…
1.3 Employment and
Monetary policy and regional unemployment - Reserve Bank of New
Income Impacts
Zealand - Te Pūtea Matua
Financial Stability Indicators
This includes the main indicators of financial stress that we monitor - see slide 13.
10
UNCLASSIFIED
11
FSRs
Financial stress was a common topic in our Financial Stability Reports over H2 2022 to 2024. There
was a particular focus on the impact of interest rate increases over the period from 2022 to 2024.
Below are links to some of the pieces we included in the FSR:
Update on the financial strain faced by households and businesses - May 2024 FSR
Financial Stability Report November 2023 - see special topic on Financial strain faced by
households and businesses
Financial Stability Report May 2023 - see special topic on Financial strain on households and
businesses in a higher interest rate environment
Financial Stability Report November 2022 - see chapter 2 including figure 2.11
HH team discussions for the FSR
See attached a couple of team discussions from 2022 that showed some of our early monitoring
of debt servicing stress when interest rates increased. This would have been improved and
published in the FSR.
We have also attached some documents you may find helpful. Some information has been
withheld under section 9(2)(b)(i) of the OIA, to protect information where the making available of
the information would be likely to prejudice the supply of similar information, or information from
the same source, and it is in the public interest that such information should continue to be
supplied.
This response may be published on the RBNZ website during our regular publication cycle.
Typically, information is released monthly, or as otherwise determined. If we publish this response,
your name and contact details will be removed before publication.
We encourage you to raise any concerns you have about this response with the RBNZ directly.
Alternatively, you have the right to seek an investigation and review of this response from the
Of ice of the Ombudsman. Information about how to make a complaint is publicly available, at
www.ombudsman.parliament.nz or freephone 0800 802 602.
Nāku noa, nā
Ministerial and OIA
Reserve Bank of New Zealand
11
UNCLASSIFIED
12
12
UNCLASSIFIED
SENSITIVE
SENSITIVE
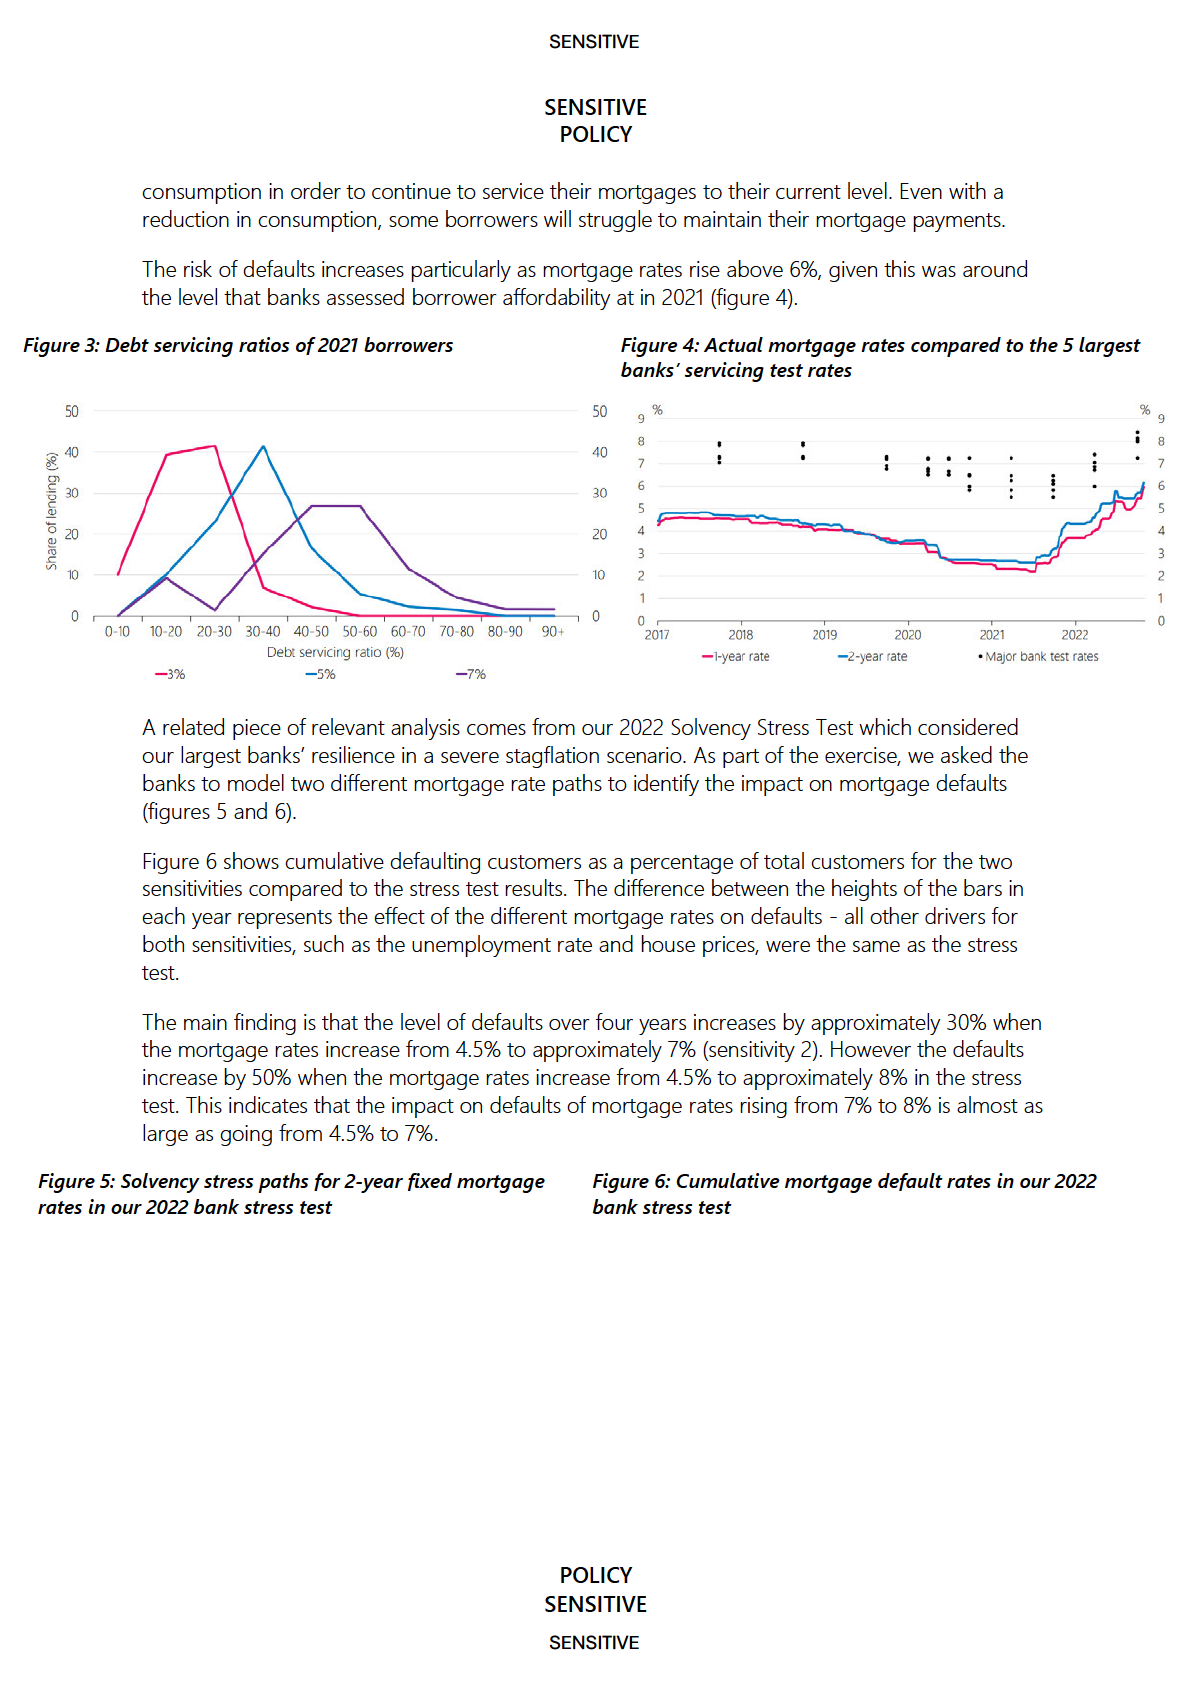
POLICY
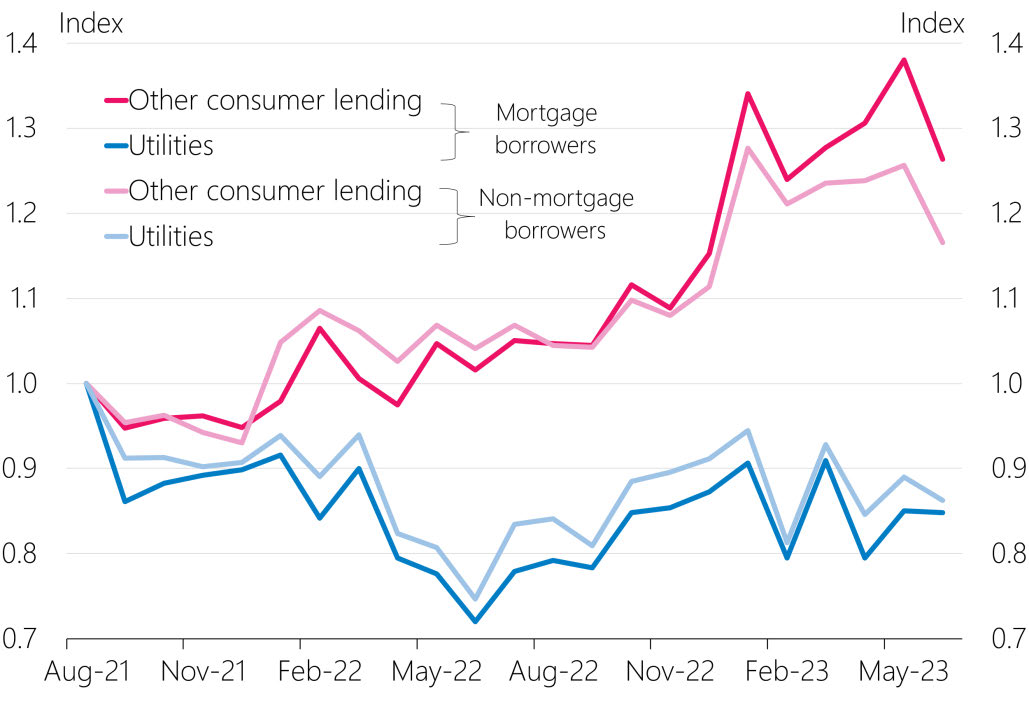
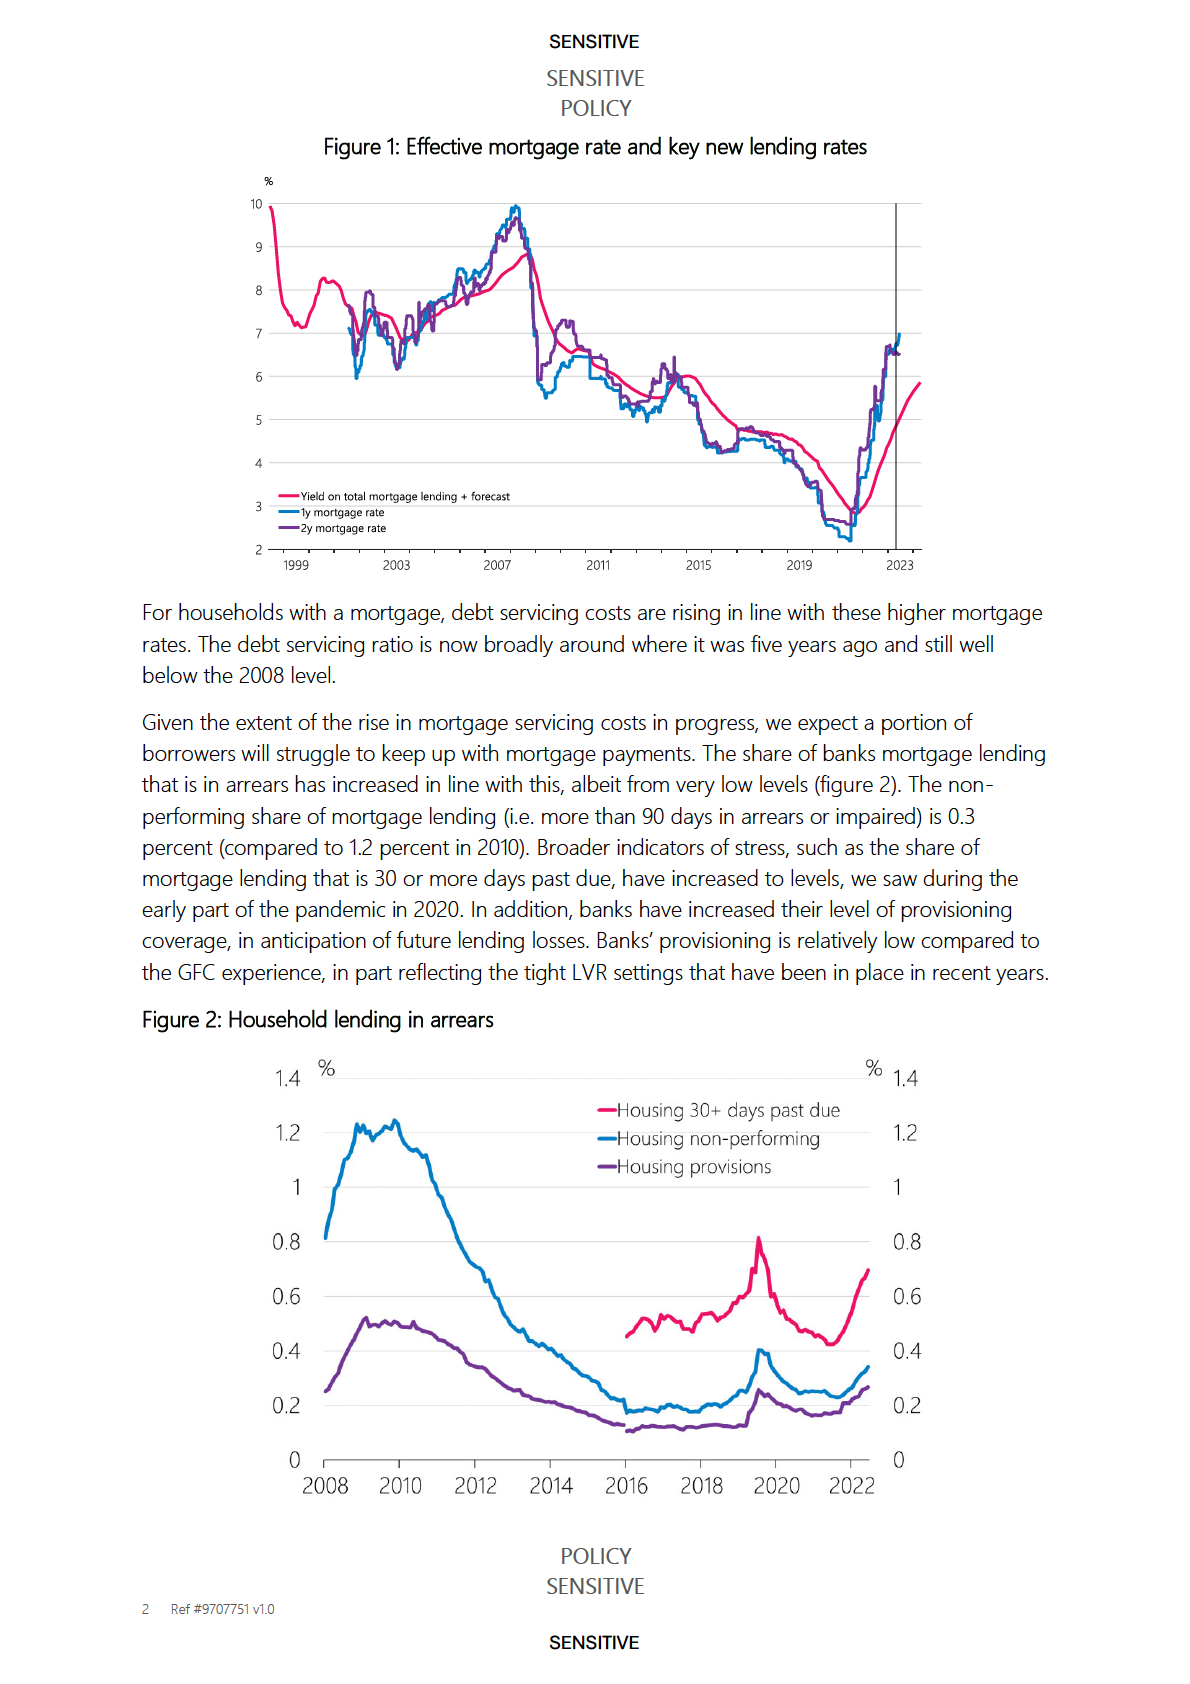
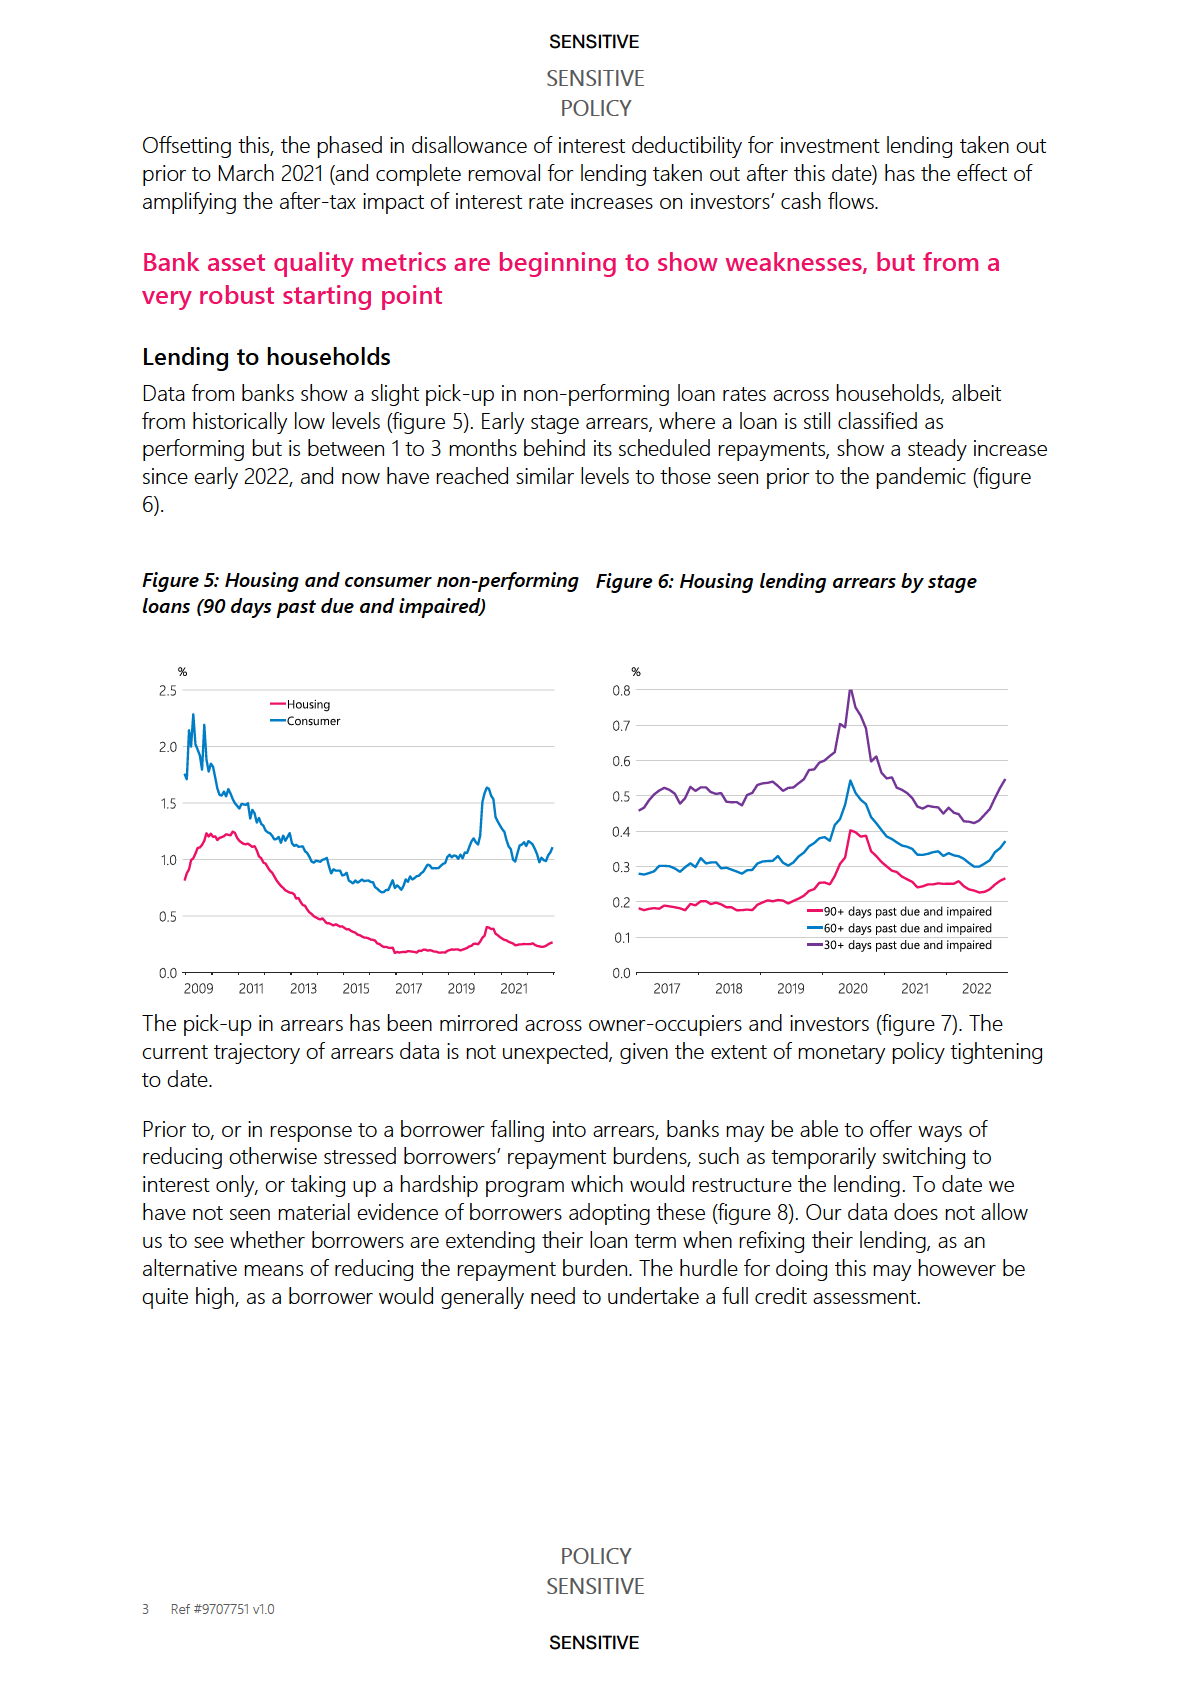
without mortgages. Figure 1 shows the arrears rates for mortgage borrowers vs non-mortgage
borrowers indexed to August 2021 (approximately when the OCR began to rise). This highlights
that borrowers have tended to prioritise repayments of debt for utilities bills relative to their other
forms of consumer lending (shown on the chart by the gap between the pink and blue lines).
Furthermore, there is some indication that – as expected – mortgage borrowers are facing
relatively more financial distress than non-mortgage borrowers, due to higher mortgage rates (the
difference between the dark and light pink lines).
Figure 1: Index of missed payments on consumer lending and bills
Note: Other consumer lending is an average of the indexed arrears value for auto loans, BNPL, credit cards and personal
loans. Indexed to 1 at August 2021.
Source: Centrix
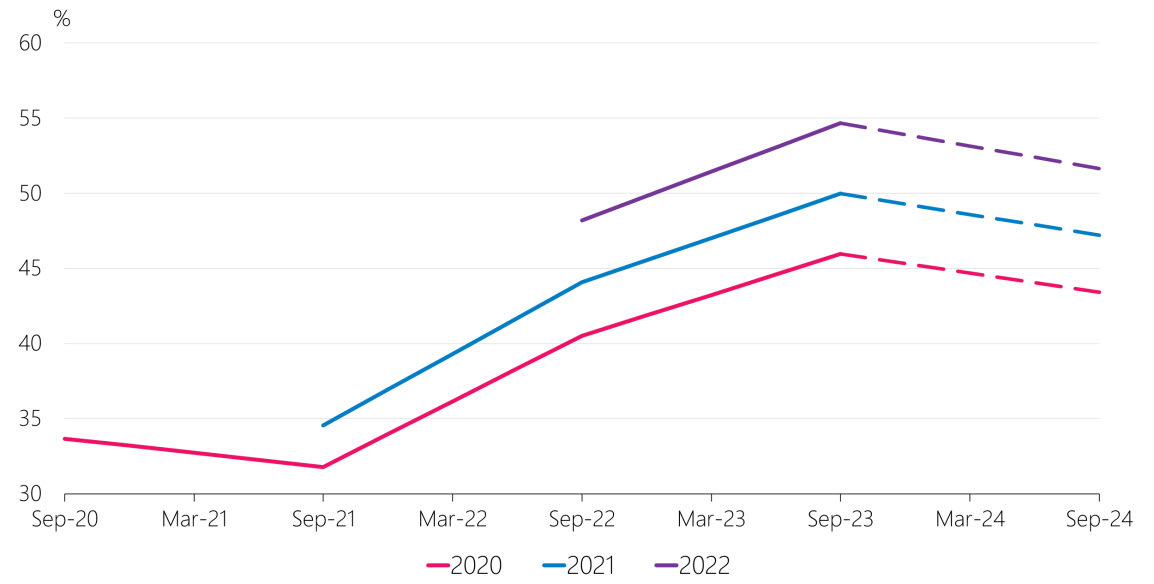
As noted in previous rounds, a particularly at-risk group is households that borrowed at high debt-
to-income (DTI) ratios in 2020 and 2021 and now have interest rates that exceed the test rates
originally used by their banks to assess affordability. Households who borrowed in these two years
at a DTI of 7 and taking into account observed and expected income growth, are expected to see
their debt servicing ratio rise to around 50 percent by late 2023, a level at which many would face
significant pressure to meet their debt servicing obligations (figure 2).
POLICY
SENSITIVE
2 Ref #9707751 v1.0
SENSITIVE
SENSITIVE
SENSITIVE
POLICY
Figure 2: Estimated debt servicing ratio for borrowers with a DTI of 7 that originated in different
years with a projection for the next year
Note: This chart shows a debt servicing ratio (including principal and interest) for representative borrowers at a DTI of 7
originating in September 2020, 2021 and 2022. It assumes principal wil be repaid over a 30-year term and also makes
adjustments for observed and future expected income growth. The other key assumption is that borrowers fix for 1 year
and rol this forward each year it comes up for renewal. Future mortgage rates are held fixed at their current level to
determine the projection. For context, 15 percent of lending was borrowed at a DTI greater than 7 in 2020, 20 percent in
2021 and 10 percent in 2022.
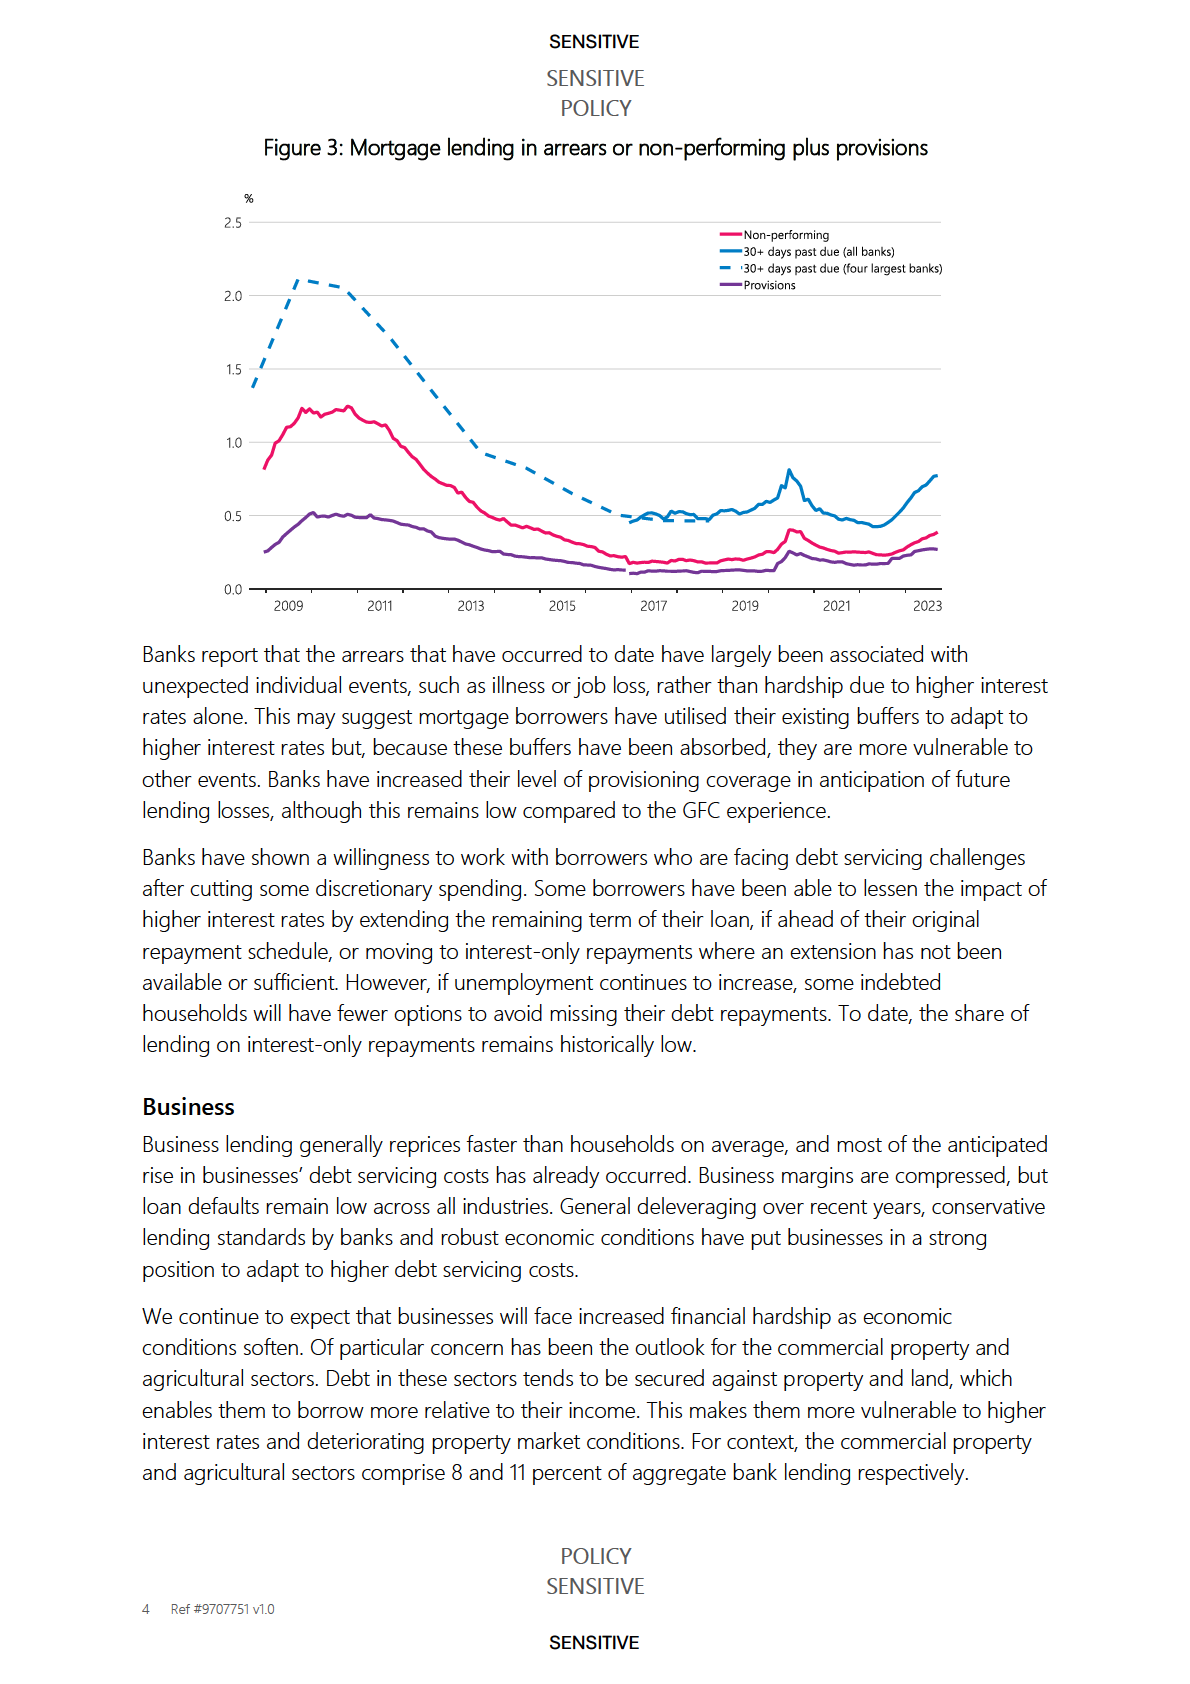
Against the backdrop of heightened cost of living pressures, more borrowers overall are under
pressure meeting their debt servicing commitments. The share of mortgage lending that is 30 or
more days past due has increased and now has surpassed the levels seen at the start of the
pandemic. The slower moving non-performing share of mortgage lending (i.e. more than 90 days
in arrears or impaired) has increased to 0.4 percent (figure 3). However, this is still significantly
lower than it was in the aftermath of the GFC (1.2 percent in 2010). The number of mortgagee sales
also remains low, despite increasing in recent months.
POLICY
SENSITIVE
3 Ref #9707751 v1.0
SENSITIVE
SENSITIVE
SENSITIVE
POLICY
Commercial property
International regulators are watching the commercial property sector closely as high interest rates
and other market developments have placed downward pressure on property values, although in
New Zealand transaction volumes remain low. This is particularly the case for lower-quality office
properties around New Zealand due to ongoing structural trends, such as increased prevalence of
working from home. Vacancies for lower-quality office properties have increased, especially in
Auckland, putting downward pressure on rents.
Across the sector, high interest rates have also contributed to a large increase in debt servicing
costs. Accordingly, interest coverage ratios (ICR) have also fallen. Banks have noted in recent
meetings that some borrowers were breaching ICR covenants. However, in general they were
comfortable with the quality of the commercial property lending book, having maintained
conservative lending standards in recent years – bank lending to commercial property is somewhat
biased towards higher grade properties with stricter LVR requirements applied to less attractive
properties. Some property owners will benefit from raising rents as existing lease agreements roll
over (leases are usually fixed for 3-4 years) although in some cases a lack of demand from
prospective tenants will limit this.
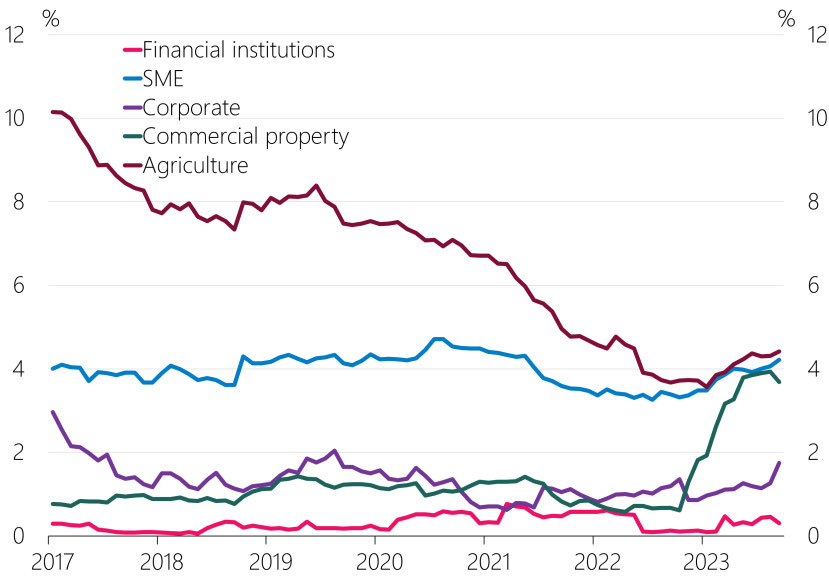
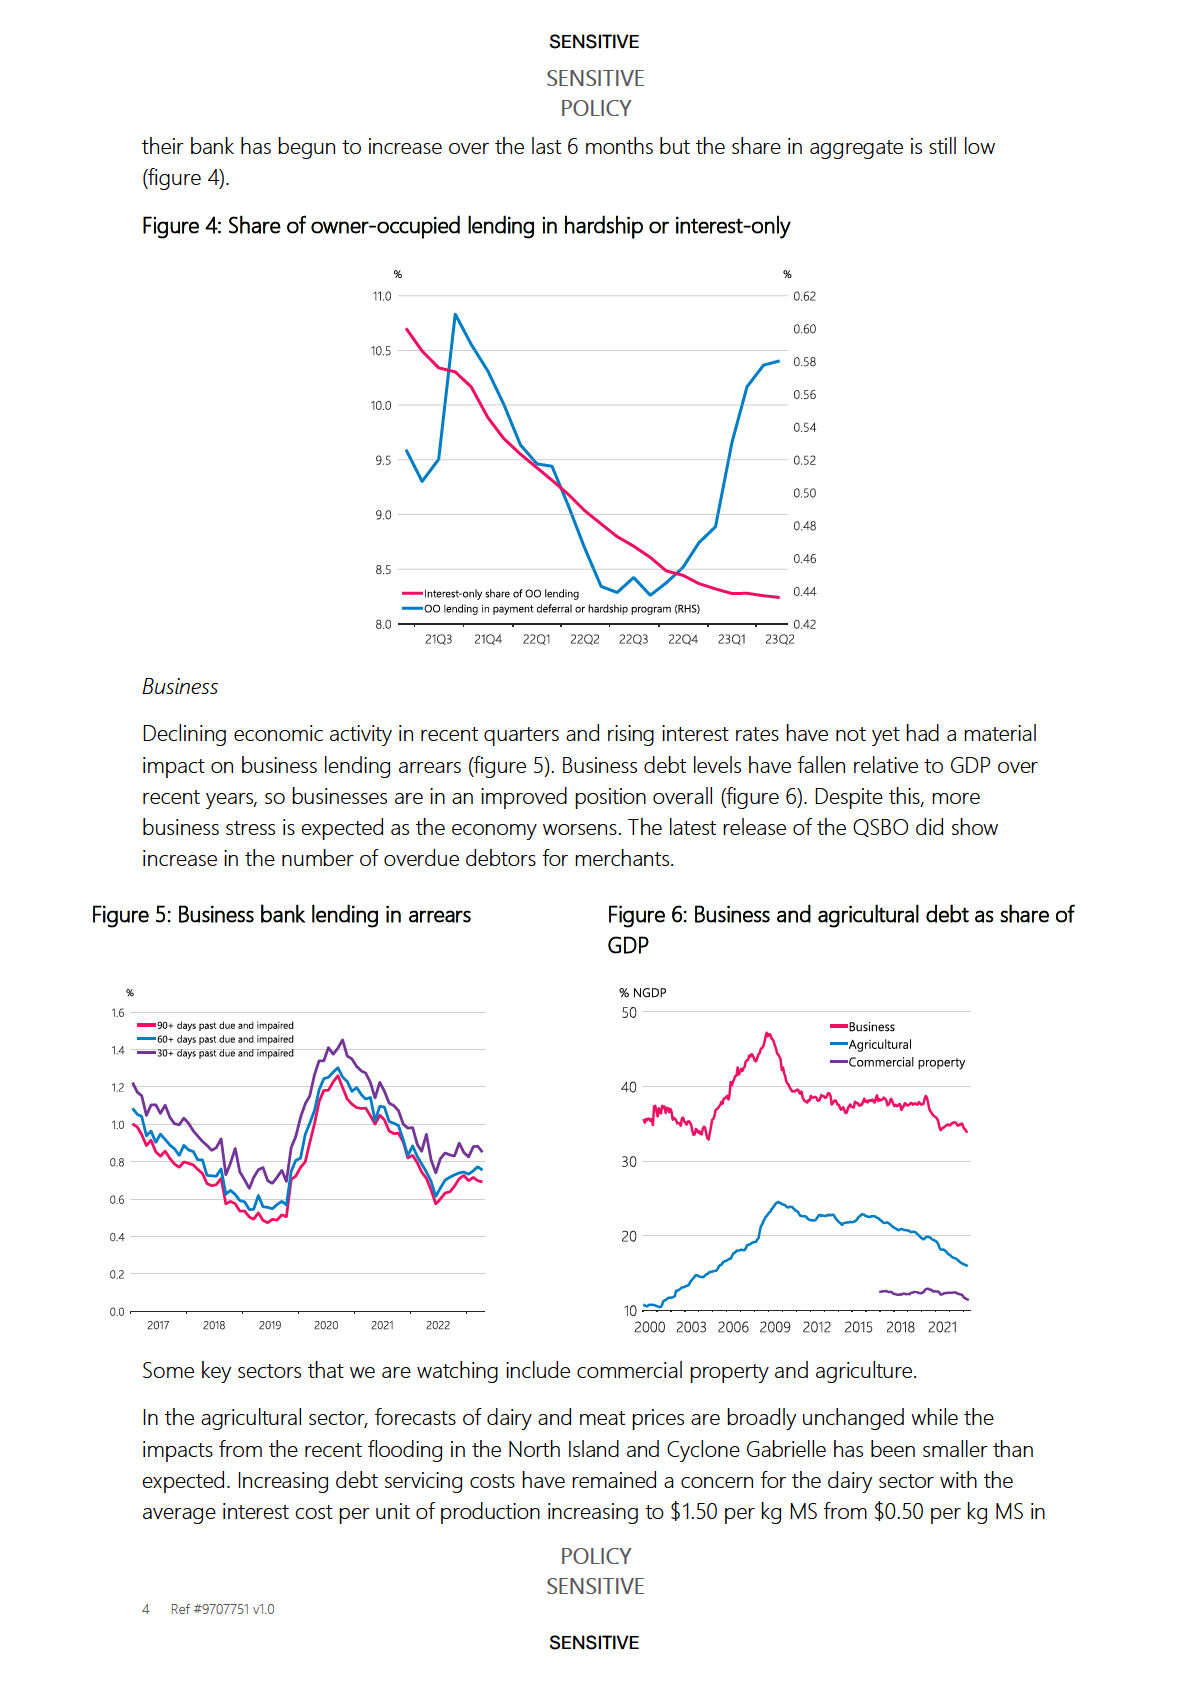
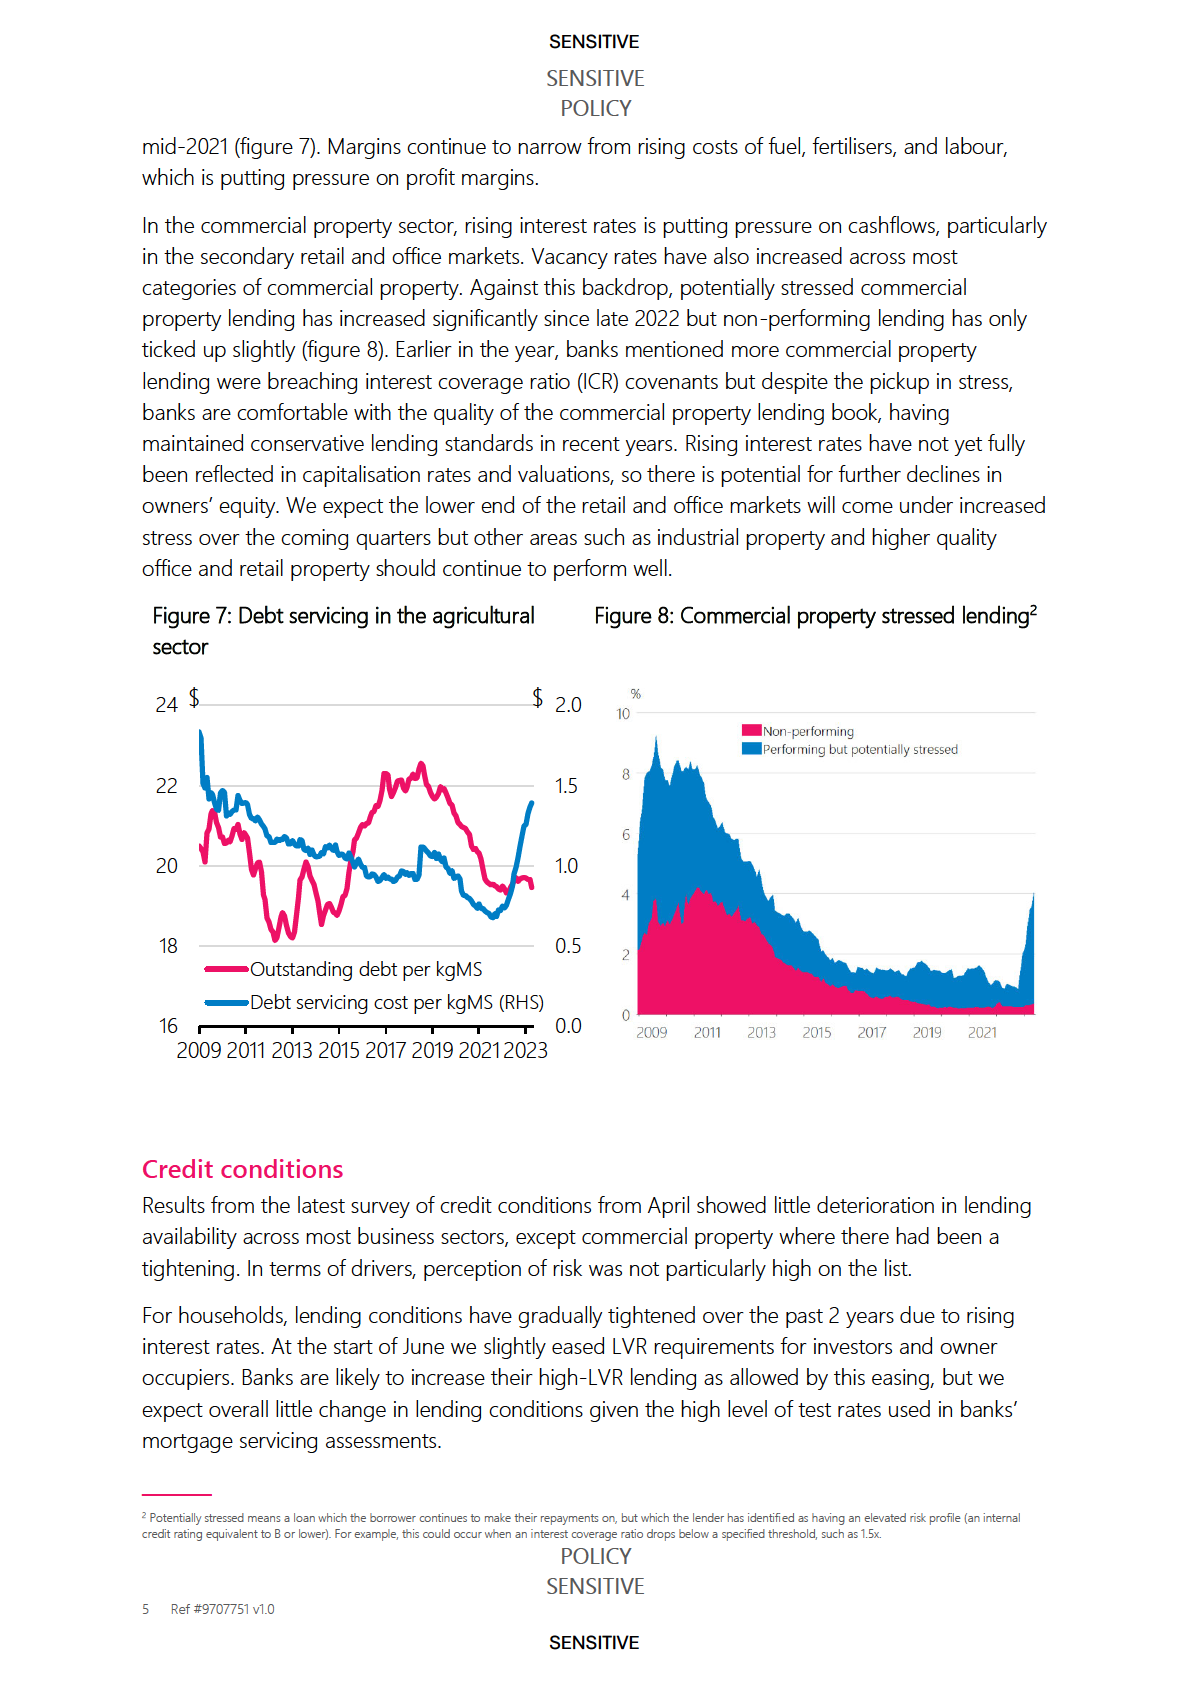
We expect the lower end of the retail and office markets will come under increased stress over the
coming quarters, but other areas such as industrial property and higher quality office and retail
property should continue to perform well.1 Against this backdrop, potentially stressed commercial
property lending has increased significantly since late 2022 but non-performing lending has only
ticked up slightly (figure 4).
Figure 4: Potentially stressed lending by sector
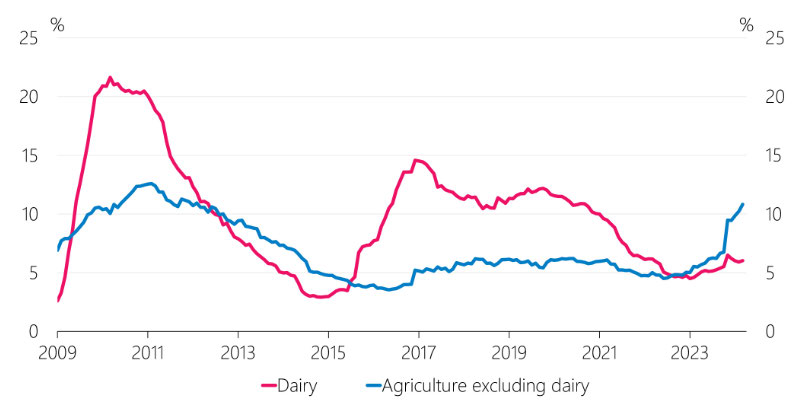
Agriculture
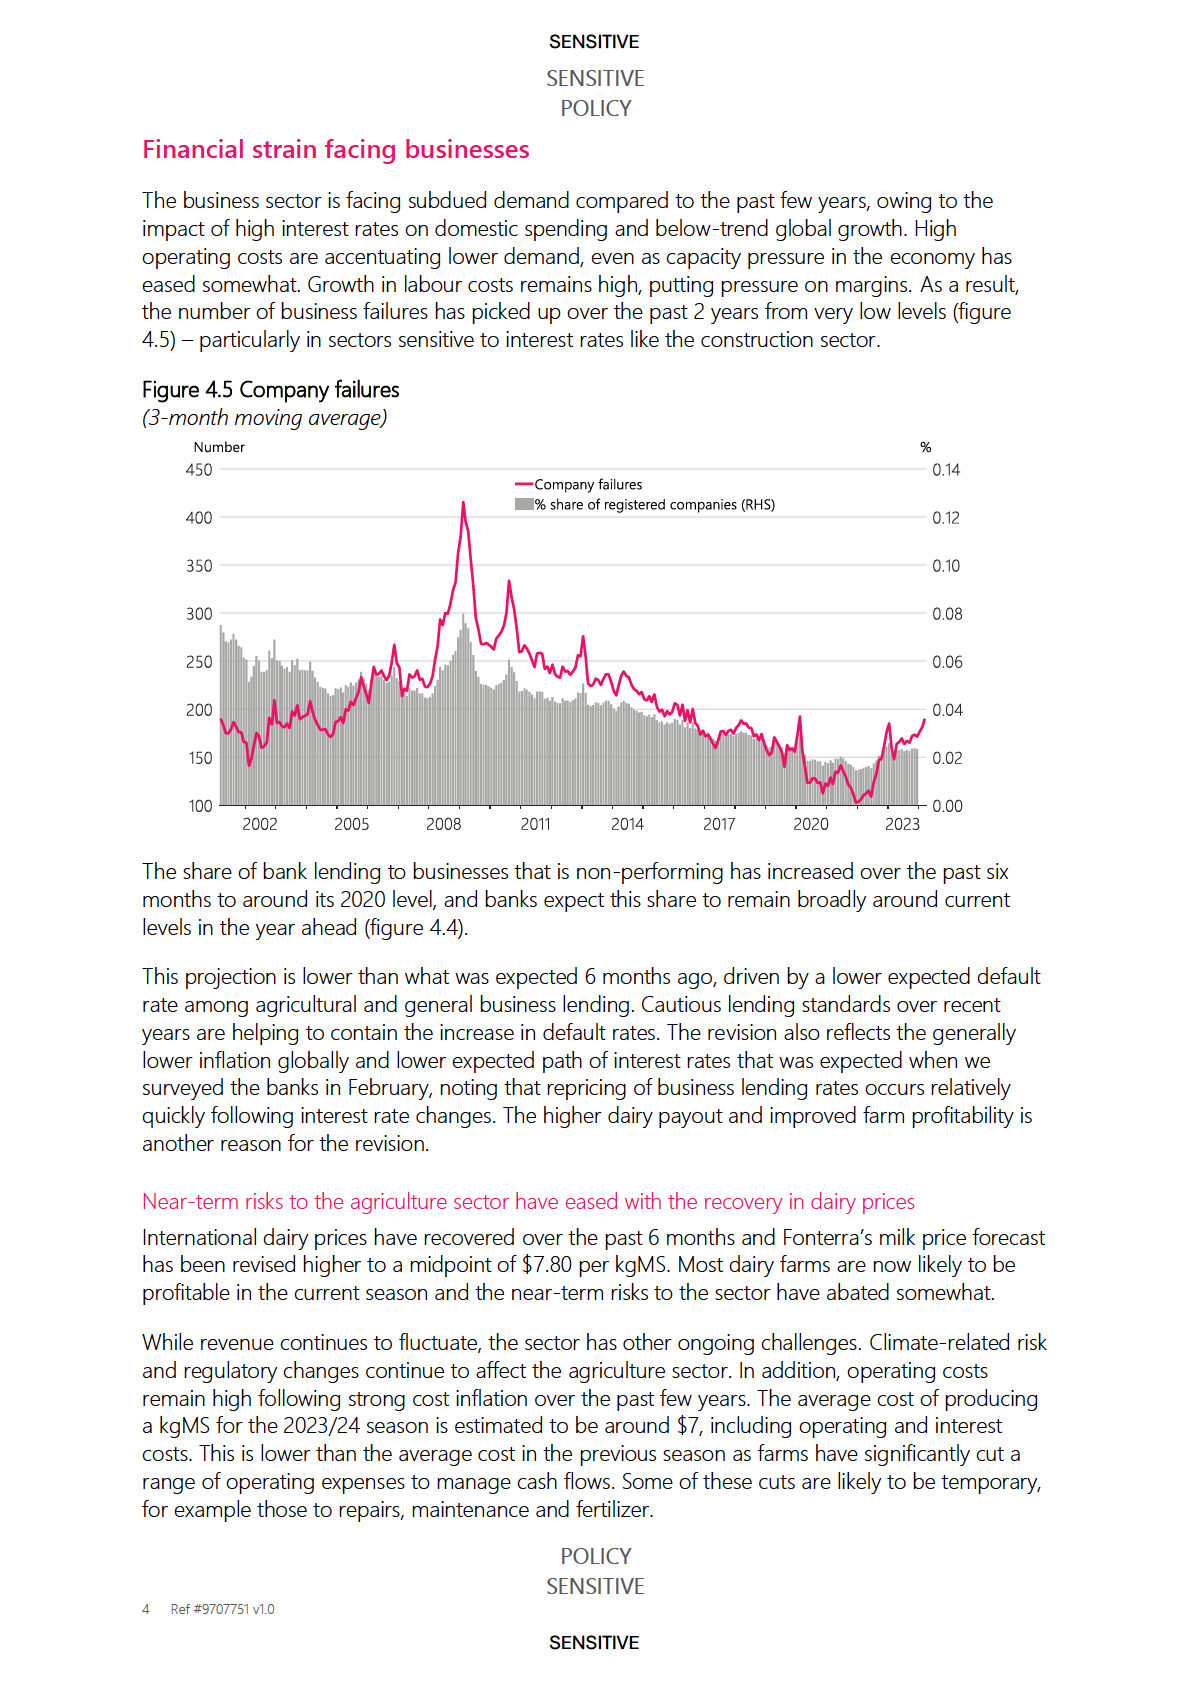
In our recent financial stability report we published a detailed special topic covering developments
in the agricultural sector. Within this we noted that the agricultural sector has been facing
challenges from falls in dairy and meat prices, elevated operating expenses and higher debt
____________
1 Prior to the election, National stated they intended to disal ow tax deductions for commercial property depreciation which if enacted wil add to tax costs for property owners.
POLICY
SENSITIVE
5 Ref #9707751 v1.0
SENSITIVE
SENSITIVE
SENSITIVE
POLICY
servicing costs. For each kilogram of milk solids produced, we estimate dairy sector average debt
servicing costs have increased to $1.46 in September, from around 60 cents two years earlier.
While dairy farmers have generally deleveraged over the past five years, reducing the impact of
rising interest rates, higher debt servicing costs are still a significant burden for heavily indebted
farmers.
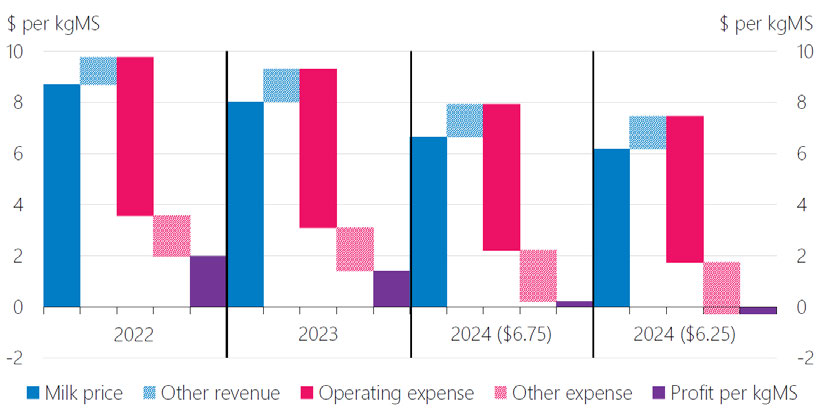
The decline in expected payouts for this season and the increased cost of debt servicing means
many farmers are likely struggling to remain profitable. The average breakeven dairy revenue per
kgMS for the 2023/24 season is estimated to be around $8 (figure 5), higher than the expected
payout mid-point of $7.25. Recent farm-level analysis provided by farming software company
Figured suggests approximately half of dairy farms would make a loss if the final milk price were to
settle at $6.75 (the previous Fonterra forecasted payout), and over 60 percent could make a loss if
the price was to fall further to $6.25. How long farmers can operate under these conditions
depends on factors such as indebtedness, access to working capital, cost structures and scale.
Figure 5: Average revenue, expenses and profits of dairy farmers
Note: Other revenue is livestock sales and earnings per share. Other expenses include interest and rents.
Source: Figured
We expect most of their dairy customers to be well-placed to weather a short period of low
payout. Significant deleveraging in the sector in recent years means many farmers have the option
to go interest-only to alleviate cash flow stress. A prolonged period of low dairy prices or a further
reduction in prices are more likely to exhaust the cash buffer of farmers with weaker balance
sheets, leading to default rates significantly higher than those currently expected (see below).
This summer, we are expected to experience a relatively strong El Niño cycle. Although its effects
are uncertain, Australia in particular faces an increased risk of drought causing grain prices to
increase, and as a result, feed prices for farmers in NZ to increase. Drought in Australia may also
cause lower meat prices, as farmers cull their herds. NIWA informs us that El Niño tends to cause
the west and south of New Zealand to be wetter, and the north and east to be drier which may
result in an increased risk of drought for farmers in these areas.
POLICY
SENSITIVE
6 Ref #9707751 v1.0
SENSITIVE
SENSITIVE
SENSITIVE
POLICY
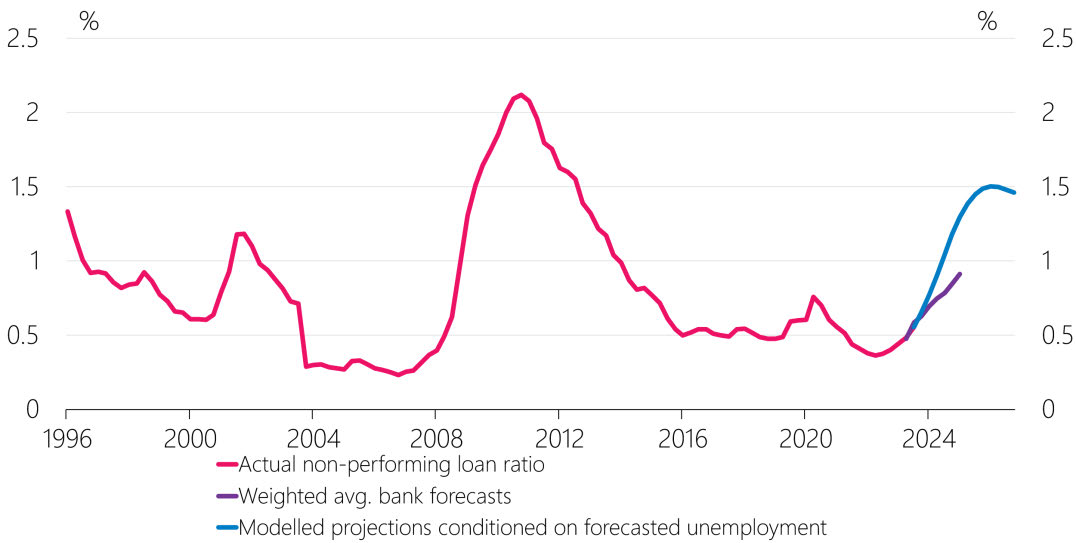
Expectations for non-performing loans
Recently, we asked the large five banks to project the share of their own lending that might
become non-performing under a central economic projection. These suggest that the weighted
average total of non-performing lending could increase to around 1 percent by early 2025 from
0.55 percent currently (figure 6). Our analysis gives a similar outlook based on the first pass
projection for unemployment from the Forecasting team, noting unemployment has historically
been a key indicator of debt servicing stress. The lack of data for historical episodes of stress
driven by higher interest rates makes this modelling a challenge, so these projections are
particularly uncertain.
Figure 6: Projected total non-performing loans
Note: This chart displays total non-performing loans as a share of total lending alongside forecasts from a structural
macro-economic model and the weighted average of the largest five banks’ projections for their own loans.
Implications for monetary policy
In line with our previous papers, we see no material trade-off between meeting our inflation and
employment objectives and maintaining financial stability at this stage. This reflects that lending
defaults remain low and, while early indicators have increased and our projections suggest defaults
will continue to rise, the anticipated increase is well within what we consider manageable.
Furthermore, as mentioned in our October MPR paper, the most recent credit conditions survey
showed credit availability continues to hold up. Banks’ lending risk appetites have not materially
tightened across most sectors, with weaker lending growth being mainly a function of the higher
level of interest rates and the corresponding impact this has on borrowing capacity (and overall
loan demand).
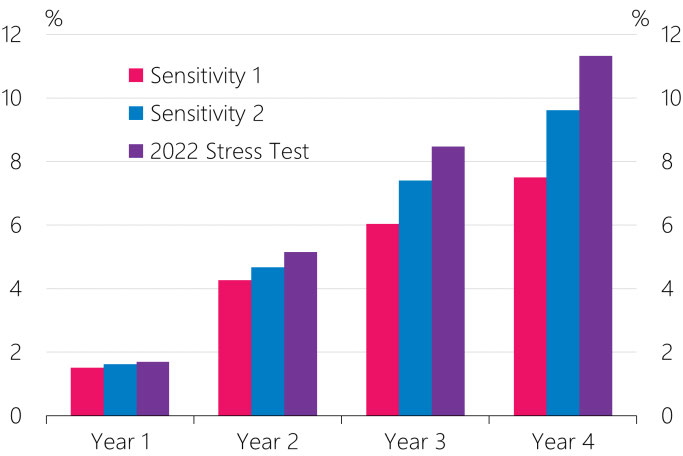
All of this is in the context of a strong financial system overall, where capital and liquidity ratios are
near historical highs and also intensively supervised. We take further assurance from the findings
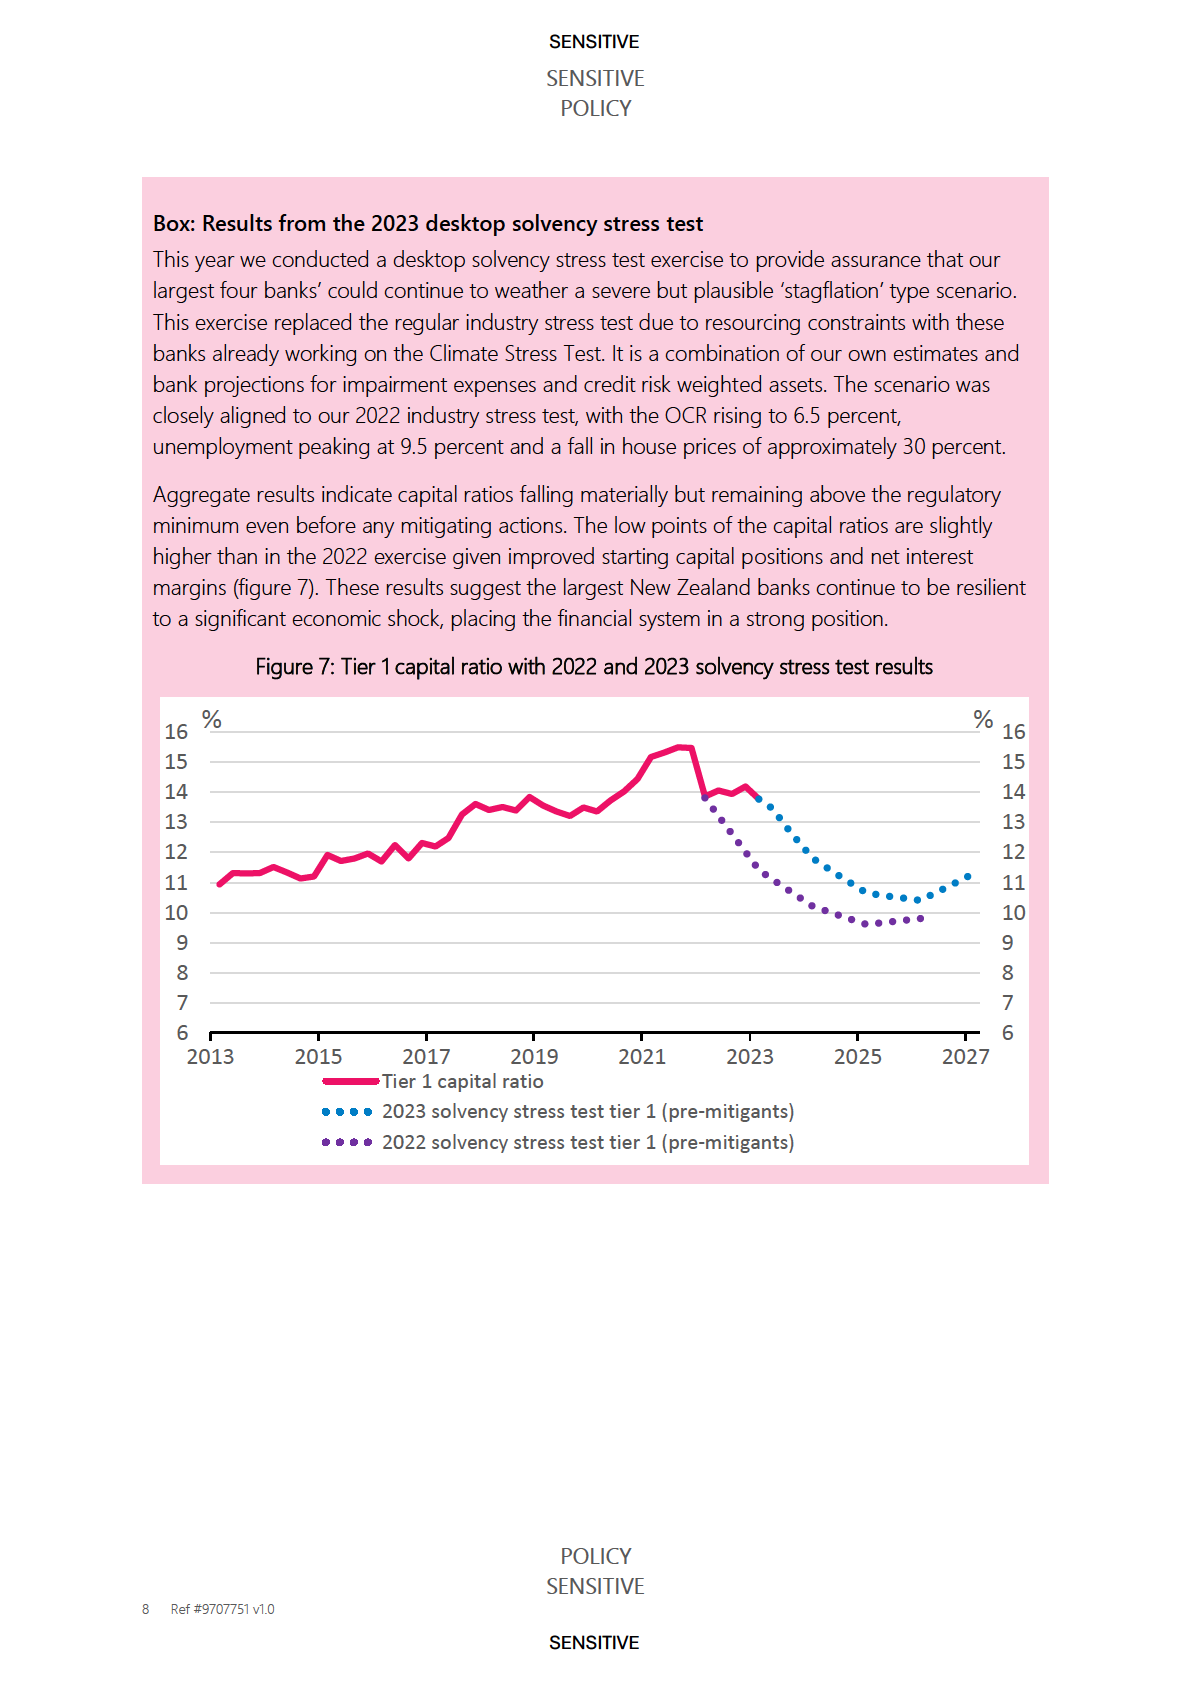
of our 2023 desktop solvency stress test which showed our largest banks remain resilient to a
significant economic shock (Box: Results from the 2023 desktop solvency stress test). This stress
test suggests that the banking system is more resilient to a ‘stagflation scenario’ compared to last
year.
POLICY
SENSITIVE
7 Ref #9707751 v1.0
SENSITIVE
SENSITIVE
SENSITIVE
POLICY
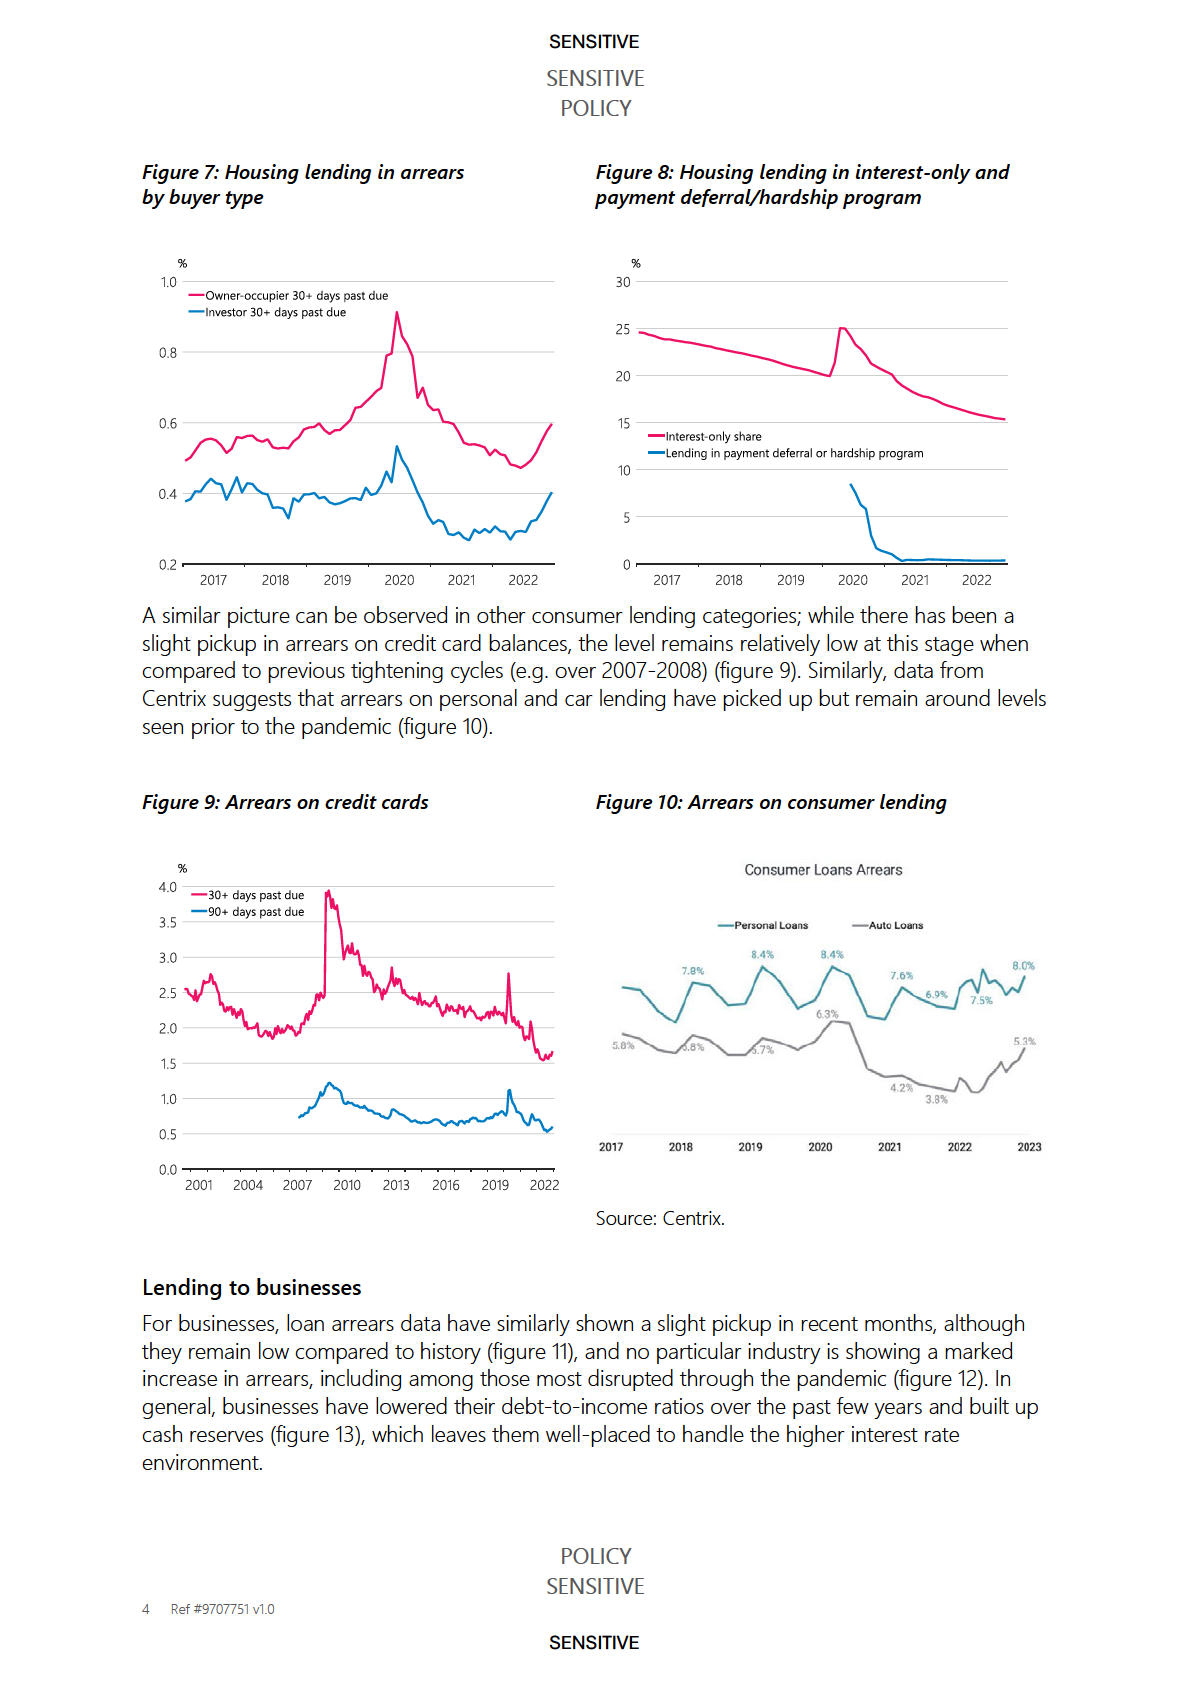
A similar picture is also continuing to be observed in other consumer lending categories. Arrears
on consumer loans and credit card balances has only increased slightly relative to a few months
ago and is still low relative to their pre-COVID-19 levels. Centrix has reported that BNPL arrears
increased above 10% of active accounts, continuing its upward trend over the last six months.
Banks are continuing to monitor stress in their lending portfolios closely. Insights from recent large
bank risk committee reports has indicated only a very small share of borrowers are more than 90
days behind on their lending repayments and also in negative equity. Furthermore, to date only a
small number of borrowers have applied for hardship grants as a result of the North Island
flooding and Cyclone Gabrielle but more stress is being expected.
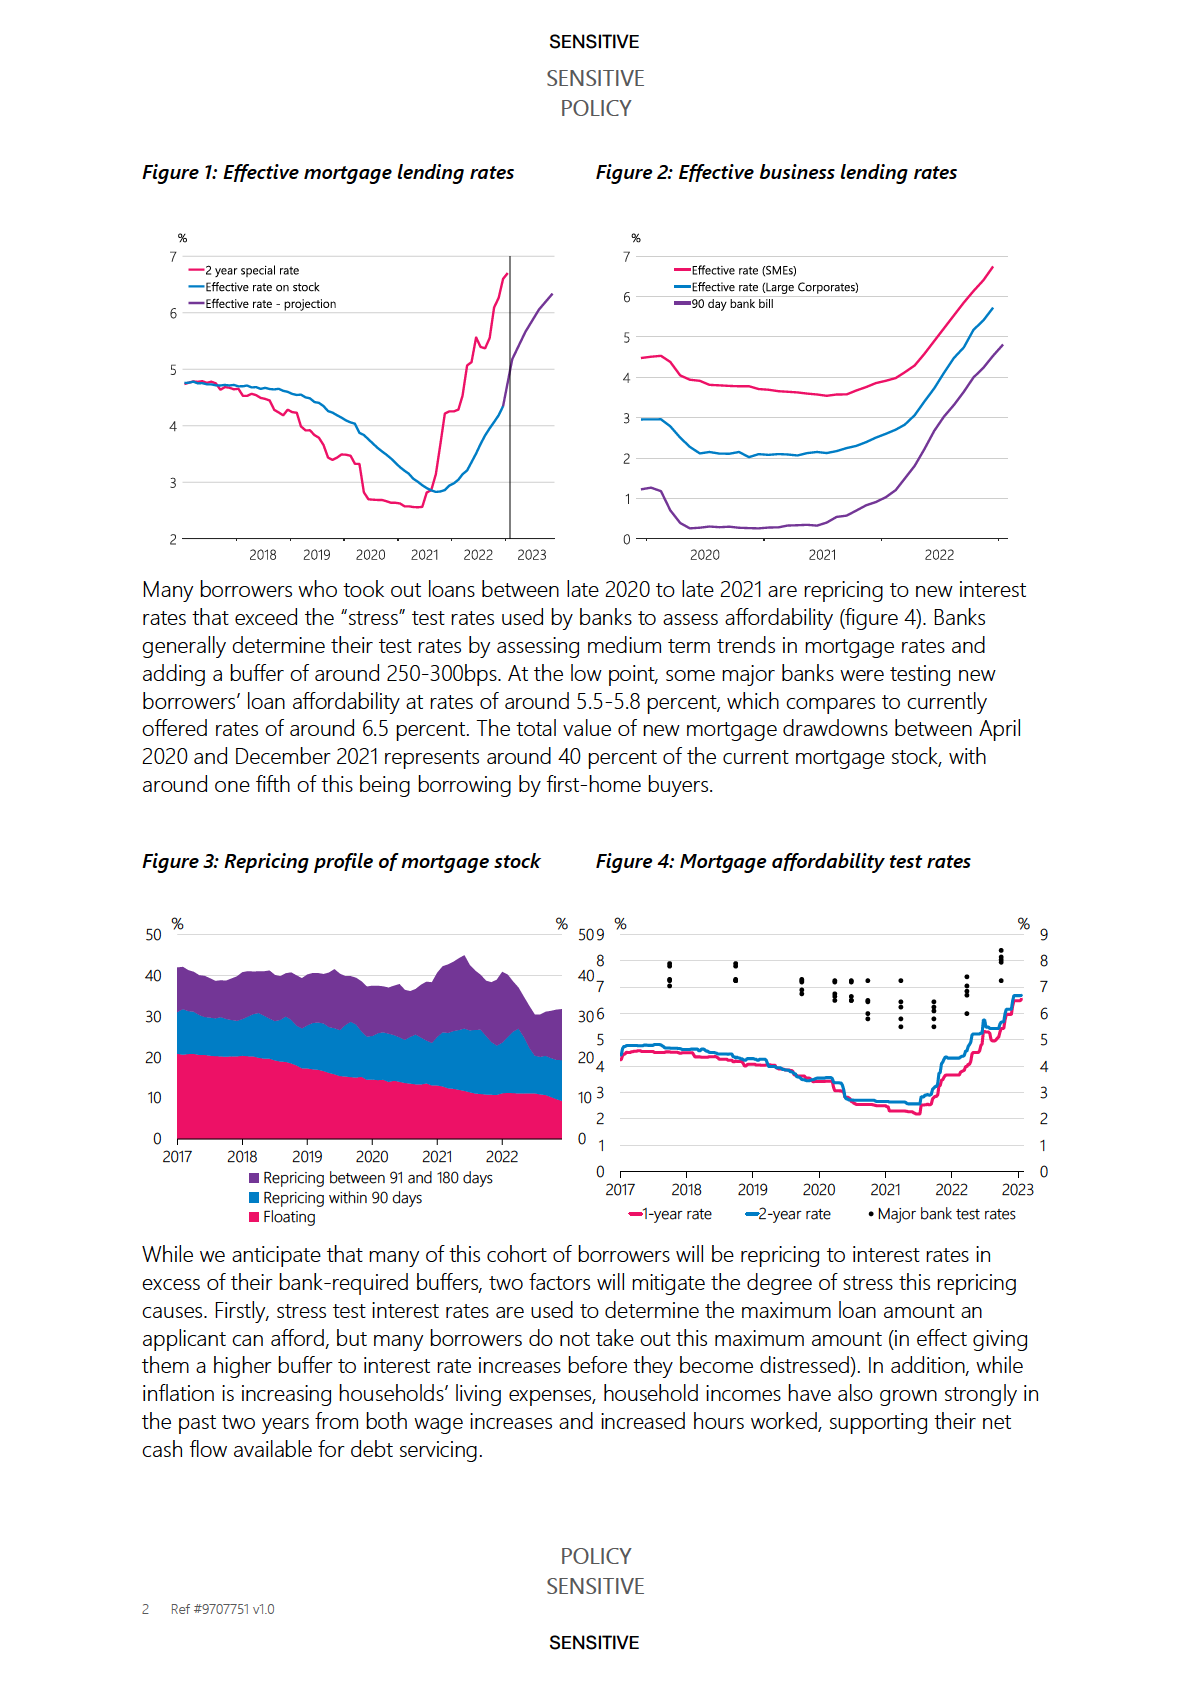
Around 60% of mortgage lending is either on a floating rate or will experience a repricing event
over 2023. Banks’ reports suggest that around a third of mortgage lending which is expected to
reprice this year will be coming off an interest rate less than 4%. However, most borrowers have
financial buffers in place to absorb increases in their debt servicing costs, for example offsetting
savings balances, or the ability to reduce their repayments to the minimum contractual amount
(having been overpaying in recent years). One major bank reported that approximately half of all
mortgage customers have a savings buffer greater than $5,000 and 20% has a buffer greater than
$25,000. Another major bank provided the following information on the proportions of borrowers
paying in excess of their minimum repayments, which indicates how borrowers have been able to
accommodate higher interest rates by reducing excess principal repayments (figure 3).
9(2)(b)(i)
Rates of non-performing mortgages and the number of mortgagee sales are also low albeit
growing. It is worth noting though that distressed sales such as mortgagee sales are a lagging
indicator and would be one of the last things a bank would do in the event of acute borrower
stress. It is difficult to assess the extent of any banks encouraging borrowers to reduce debt (e.g.
investors selling one or two properties in a portfolio), which would be an earlier step prior to
mortgagee sales. The share of owner-occupied borrowers moving onto hardship programmes at
____________
1 Note this data is only from one of the big 4 banks
POLICY
SENSITIVE
3 Ref #9707751 v1.0
SENSITIVE
SENSITIVE
SENSITIVE
POLICY
Implications for Monetary policy
In line with previous papers, we still do not see a trade-off between getting inflation down to
target and financial stability. This reflects that banks’ lending risk appetite has not tightened across
most sectors, with tighter credit conditions being mainly a function of the higher level of interest
rates and the effect this has on loan demand. Lending defaults remain low and, while early
indicators suggest this will continue to rise, the anticipated increase is well within what we consider
manageable.
All of this is in the context of a strong financial system overall, where capital and liquidity ratios are
near historical highs. We take further assurance from the findings of our 2022 stagflation stress test
which showed a high degree of resilience across banks in New Zealand.
POLICY
SENSITIVE
6 Ref #9707751 v1.0
SENSITIVE
SENSITIVE
SENSITIVE
POLICY
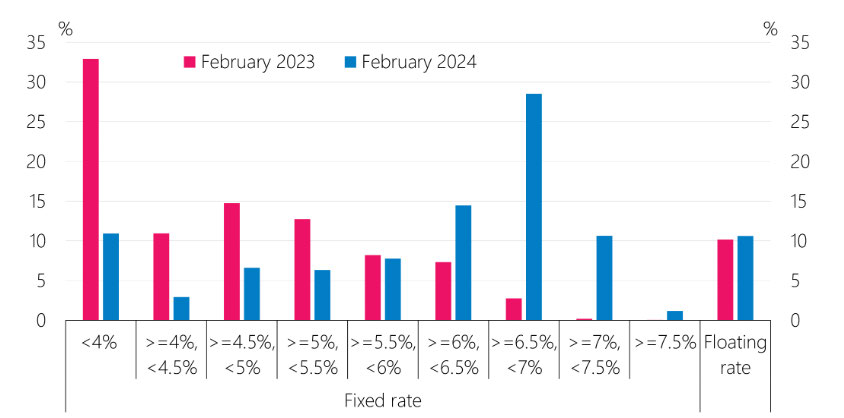
Figure 4.1 Distribution of mortgage rates across the stock of mortgage lending
Mortgage borrowers have had to adapt to the higher interest costs, partly by reducing
discretionary spending. Retail spending volumes have declined since early 2022 despite strong net
immigration. Some borrowers have also reduced principal repayments, which is an option
available to borrowers who have paid off principal faster than required. Strong nominal income
growth has also helped households manage the higher interest costs.
Mortgage arrears continue to rise from recent lows
A small proportion of mortgage borrowers has not been able to keep up with mortgage
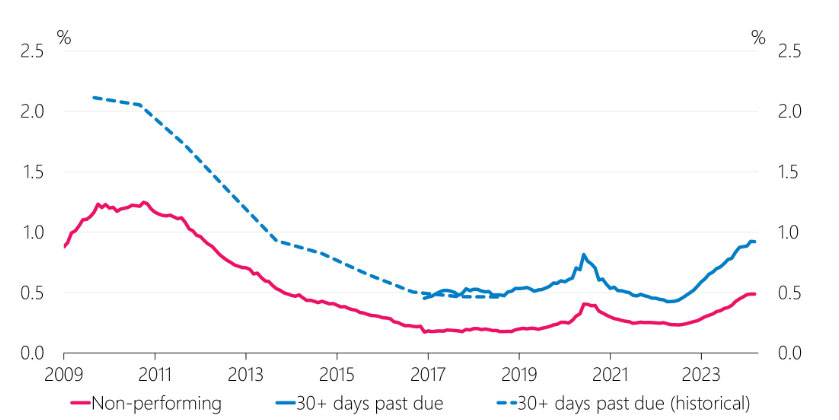
payments. An increasing share of mortgage lending has been categorised as non-performing
(defined as those 90 or more days in arrears or impaired). This share has increased from 0.2
percent in 2022, a very low level, to around 0.5 percent currently (figure 4.2).
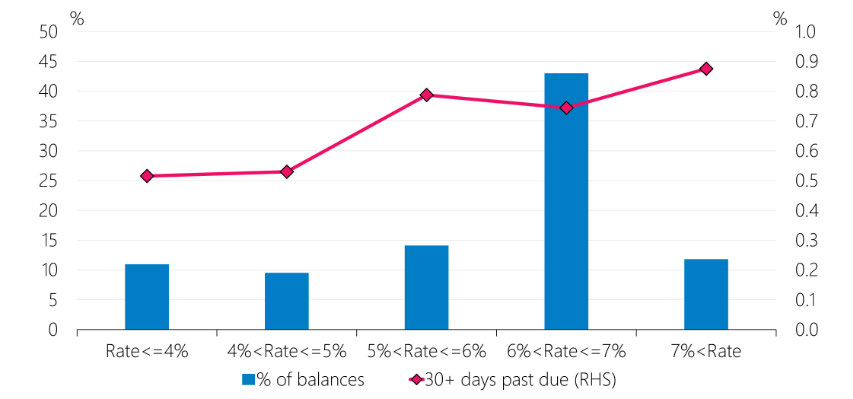
Data from the four largest banks show that the non-performing share is somewhat higher for
lending already on higher mortgage rates, highlighting the link between debt servicing costs and
borrower cash flow pressures (figure 4.3). Difficulty in keeping up with payments has likely been
made worse by cost-of-living pressures and other unforeseen events like job losses.
Figure 4.2 Non-performing and past due mortgage lending
POLICY
SENSITIVE
2 Ref #9707751 v1.0
SENSITIVE
SENSITIVE
SENSITIVE
POLICY
Figure 4.3 Mortgage arrears by fixed mortgage rate
(excludes floating-rate mortgages, February 2024)
Banks expect further increases in mortgage arrears
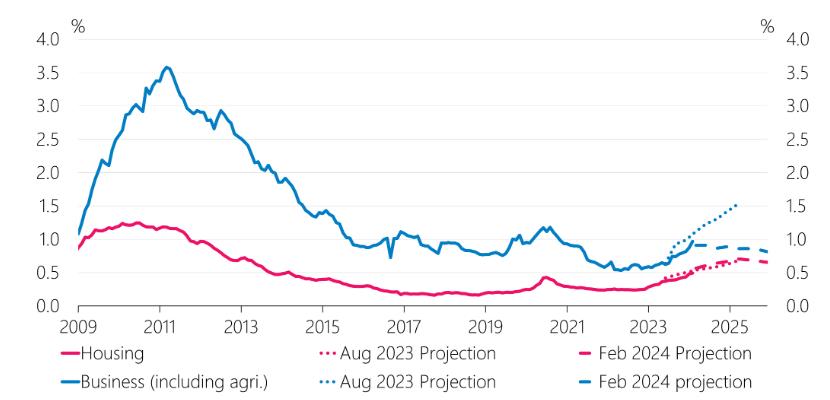
Banks have provided us with projections of the non-performing share of their lending by sector
(figure 4.4). Focusing on housing (red line), they expect the non-performing share of mortgage
lending to increase to 0.7 percent by around the end of this year, around half what it was during
the Global Financial Crisis.
Figure 4.4 Projections for non-performing loans by sector
Arrears are expected to rise as some borrowers continue to roll onto even higher mortgage rates,
albeit with the bulk of the transition already complete. Partly this reflects the impacts mortgage
servicing struggles can take time to be realised. Unemployment is also expected to increase over
the next year, which is likely to lead to an increase in arrears.
This expected level of defaults is manageable for banks. Few borrowers are in a position of
negative equity which helps to contain losses for banks in the event of default. Also, banks have set
aside provisions for expected losses.
POLICY
SENSITIVE
3 Ref #9707751 v1.0
SENSITIVE
SENSITIVE
SENSITIVE
POLICY
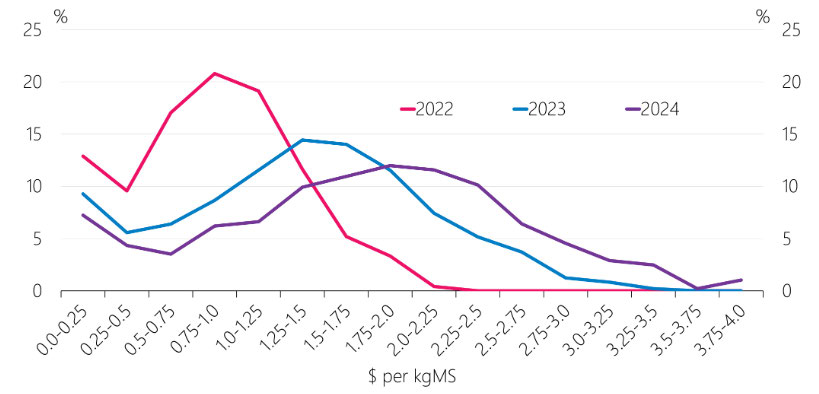
Debt servicing costs have increased considerably. The majority of farms currently pay between $1.0
and $2.5 per kgMS (figure 4.6). Around 7 percent of farms pay more than $3 per kgMS, and this
proportion has been increasing. The reduction in debt held by the sector over the past 5 years has
helped to contain these increasing costs. Farmers have also reduced principal repayments
considerably to mitigate the rising cash flow pressure in the short term, which will slow any further
debt reduction.
Figure 4.6 Distribution of interest cost for dairy farms
(dol ars per kgMS)
Despite these challenges, the share of banks’ dairy lending that is non-performing or potentially
stressed remains low (figure 4.7). Several profitable seasons have put farmers in a stronger position
to manage the current challenges. However, a prolonged period of low payouts would see a
material rise in loan losses for banks.
Around 40 percent of bank’s agriculture lending is outside the dairy sector, which is around 3
percent of their total lending. These other parts of the agriculture sector are struggling overall,
with potentially stressed lending picking up over the past 6 months. For example, falls in
international prices are impacting the profitability of sheep and beef farmers. Like dairy, the meat
sector faces higher debt servicing costs and climate change-related risks in the longer term, and
many farms still require substantial investment to transition to a lower emission environment.
POLICY
SENSITIVE
5 Ref #9707751 v1.0
SENSITIVE
SENSITIVE
SENSITIVE
POLICY
Figure 4.7 Non-performing and potentially stressed loans in the agriculture sector
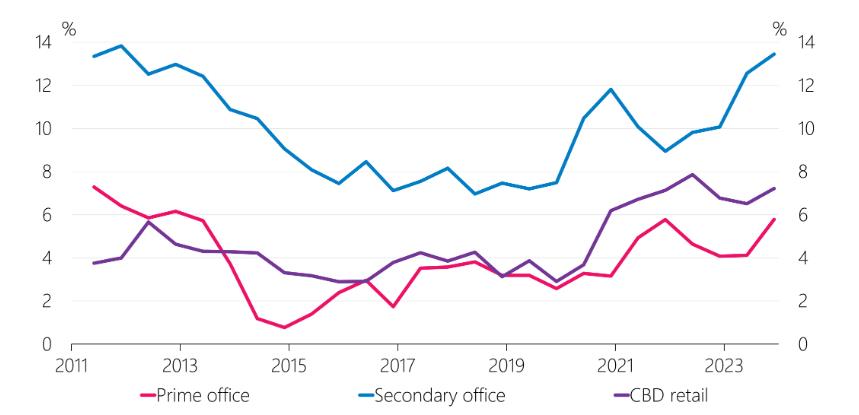
Commercial property risk remains a focus internationally and in New Zealand
Structural trends like increased remote working and online shopping were accelerated by the
pandemic, causing a rise in vacancies for office and retail properties globally. In addition, high
interest rates mean debt servicing costs have increased and property valuations have declined.
These trends are evident in New Zealand as well but are generally less acute than overseas. Office
vacancies have risen primarily for lower-quality spaces, while demand for higher-quality offices
remains solid as firms prioritise locational advantage and collaborative spaces (figure 4.8). New
Zealand cities tend to have lower office vacancy rates compared to Australian cities.
The ongoing slowing in the New Zealand economy is the key near-term risk to the commercial
property sector. In addition, the proposed removal of depreciation from allowable tax deductions
could add to existing cash flow pressures. Some property owners may look to reduce their debt
through property sales, particularly if cash flow stress is severe. However, there have been fewer
property sales in the market since 2021, pointing to a less liquid market that could make this
deleveraging harder. A global commercial property slowdown could further exacerbate this as it
could weaken foreign investors’ appetite for property in New Zealand. This would further reduce
the pool of potential buyers.
Figure 4.8 Commercial property vacancy rates
POLICY
SENSITIVE
6 Ref #9707751 v1.0
SENSITIVE
SENSITIVE
SENSITIVE
POLICY
An update on credit conditions
We survey banks for their perspective of credit conditions every six months. The findings from this
are a useful input into our financial stability and monetary policy deliberations, given their
relevance to the transmission of monetary policy and because it provides more explanation of the
drivers of credit supply. A widespread tightening in lending standards, particularly if it was due to a
retrenchment in banks’ risk appetite, would be a particular concern.
Our latest survey was published in late April. Lending standards were noted as broadly unchanged
over the past six months, while demand remained weak across sectors.
Lending standards for residential mortgages eased moderately, noting the easing of LVR
restrictions just prior to this period. Borrowers’ ability to pass serviceability assessments remains
the main constraint on borrowers’ affordability. Test mortgage rates used by banks in their
affordability assessments were slightly higher compared to 6 months ago at between 8.5 and 9
percent. On net, banks expect little change in mortgage credit availability during the next six
months, suggesting the combined impacts from proposed changes to the Credit Contracts
and Consumer Finance Act and the proposed restrictions on debt-to-income ratios are not
expected to be large. Demand for new mortgages fell further over the past six months as
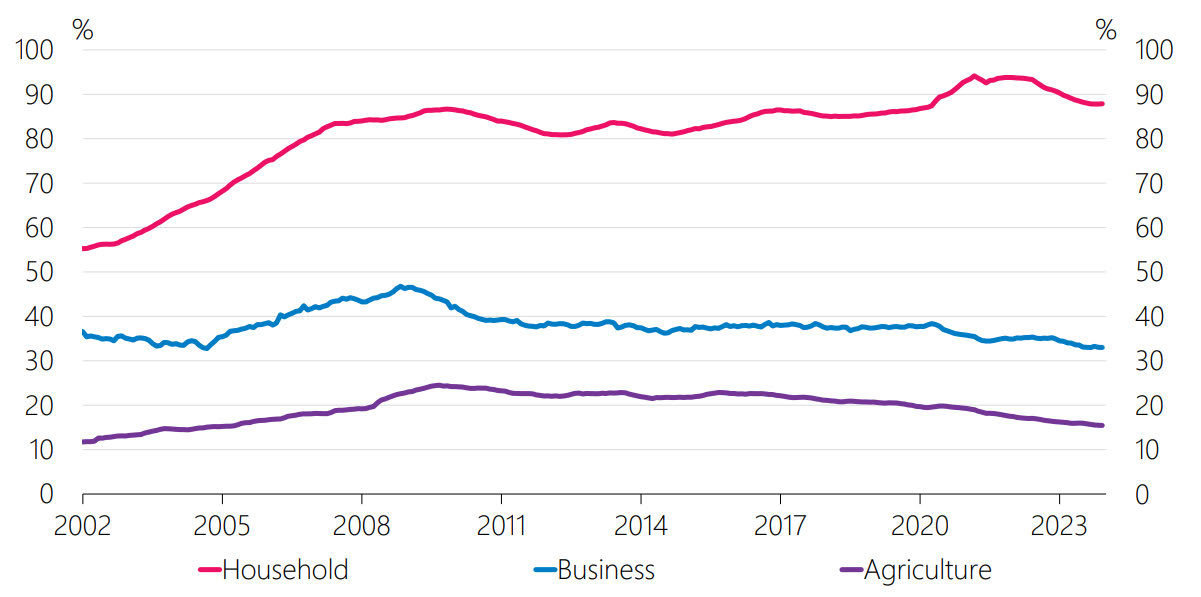
borrowing costs remained high. Weaker demand for mortgage lending has contributed to a
decline in the stock of lending to households relative to GDP (figure 4.9).
Figure 4.9 Borrowing by sector as a percent of GDP
Credit availability for businesses is broadly around the 3-year average across most sectors, with
commercial property being the exception as it is facing notably tighter conditions. More-
indebted borrowers have found it harder to meet interest coverage ratio (ICR) covenants given
higher interest costs. Banks have been willing to temporarily ease ICR covenants on corporate
borrowing, so long as borrowers can still service their debt. Temporary relaxation of ICR
covenants is expected to revert to longer-term settings from around the end of this year. On
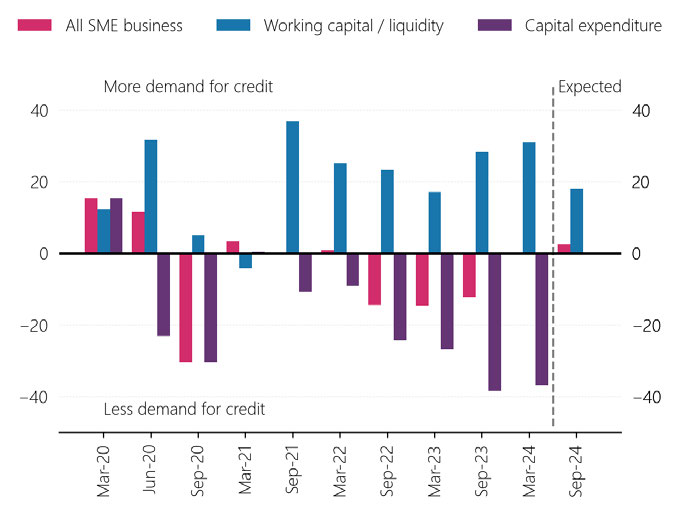
demand, banks reported that businesses continued to access bank liquidity facilities for
working capital to ease short-term cash flow pressures. Capital expenditure remains subdued
in an environment of elevated uncertainty and high interest rates (figure 4.10).
POLICY
SENSITIVE
7 Ref #9707751 v1.0
SENSITIVE
SENSITIVE
SENSITIVE
POLICY
Figure 4.10 Small and medium business demand for credit
Eased requirements for ICRs on commercial property investment lending from banks continue
to be more than offset by increased interest markups to reflect heightened risks within the
sector. Banks’ appetite for new high-quality lending for commercial property is expected to
increase, with some banks considering how to rebuild their commercial property lending
portfolios after the run-off that occurred during the past 12-18 months. This is expected to see
some improvement in credit availability during the next 6 months. Demand for commercial
property lending recorded another large decline over the survey period. Higher borrowing
costs have narrowed property developers’ margins, with few proposed projects deemed
financially feasible.
POLICY
SENSITIVE
8 Ref #9707751 v1.0
SENSITIVE
SENSITIVE
SENSITIVE
POLICY
underlying buildings, and gained new information on regional seismology and how buildings
perform through complex earthquake sequences.
Climate change is also contributing to higher underlying physical risks, including floods, storms
and other damaging weather events. Insurance premiums will increase if insured losses from these
events also grow. Claims from the 2023 Auckland Anniversary weekend floods and Cyclone
Gabrielle have totalled $3.7 billion so far, contributing to New Zealand insurers bearing higher
reinsurance premiums over the past year.
Risk-based pricing is becoming more common
There is a clear trend of insurers moving towards greater use of risk-based pricing for residential
dwelling insurance. This means that the value of insurance premiums is becoming more tailored to
the specific risks a property faces (e.g. seismic or flood) as opposed to reflecting broad averages of
the risks facing properties over wide areas.
To date, risk-based pricing has been most prominent for seismic risk, affecting regions such as
Wellington. Granular pricing for flood risk is at varying stages of being rolled out by insurers. A
withdrawal of insurance availability for high-risk properties is likely to occur only gradually.
However, some owners may find insurance increasingly unaffordable. Insurers may begin to make
coverage of some risks optional as risk-based pricing becomes more commonplace.
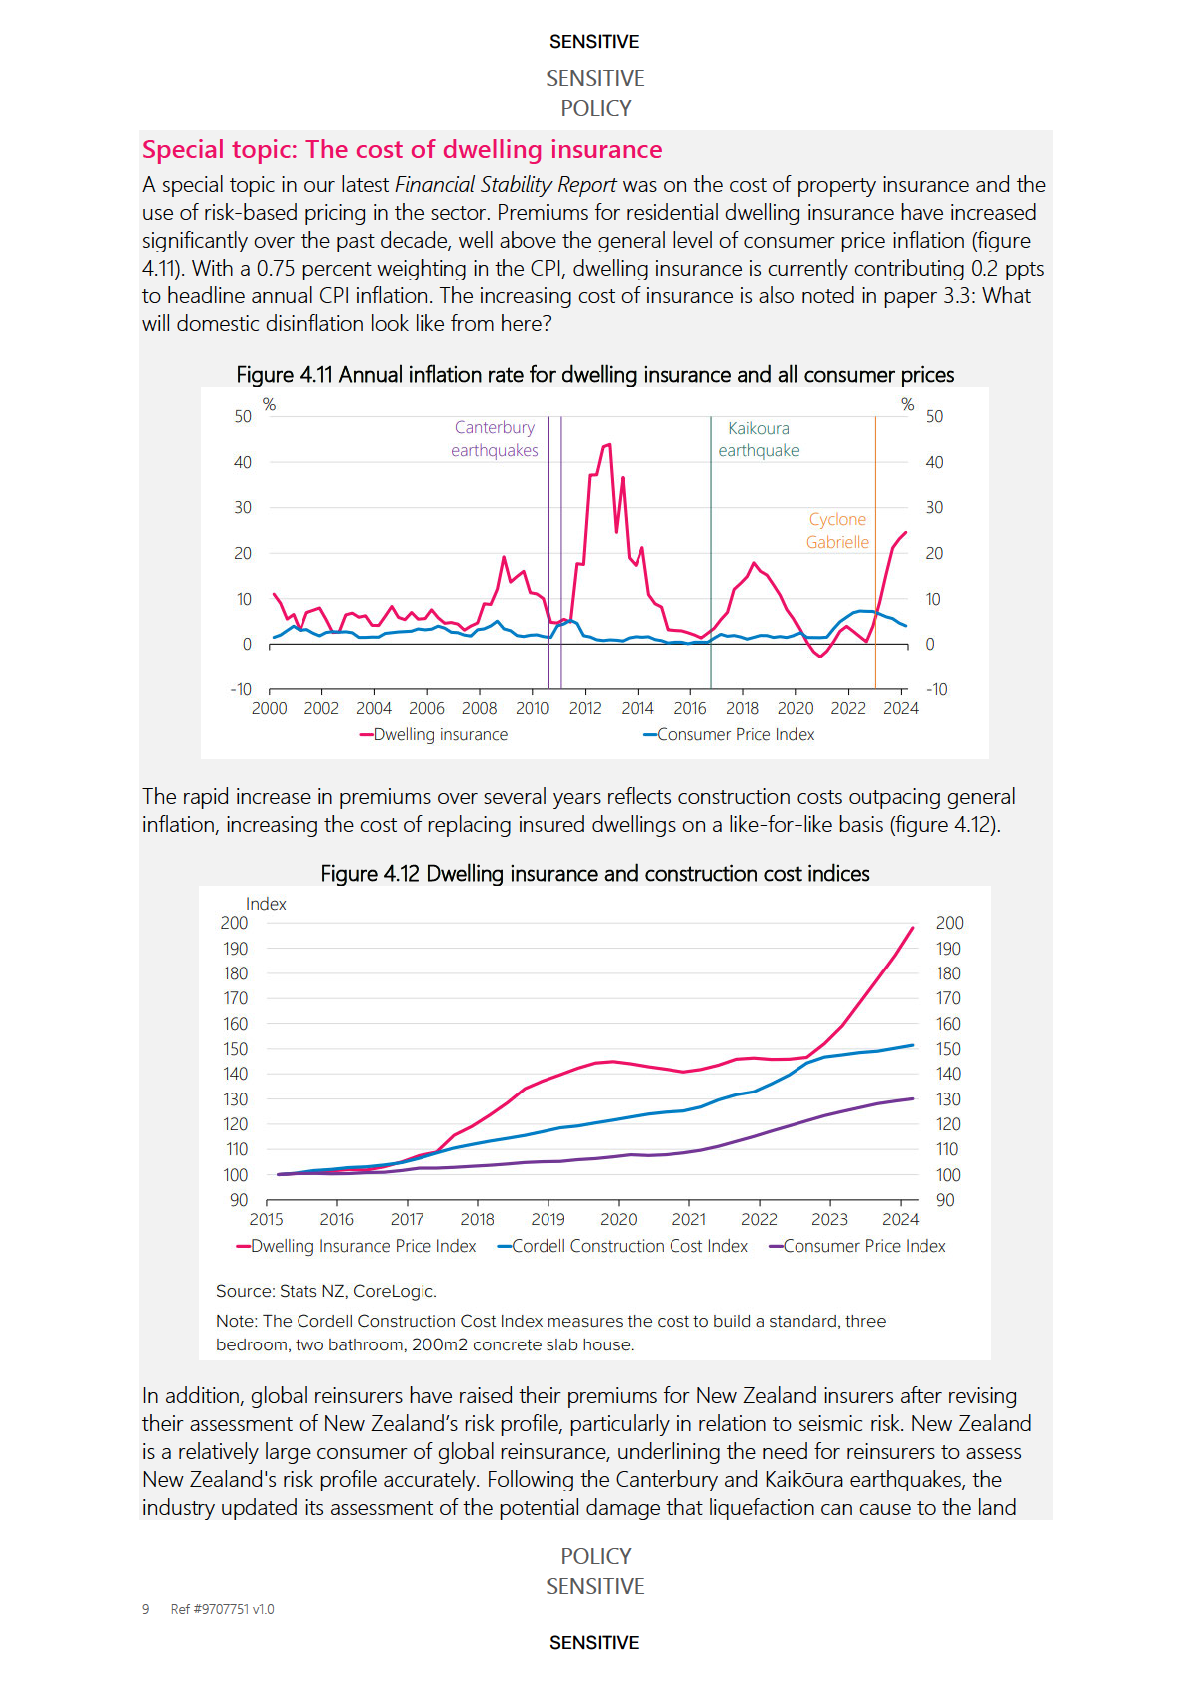
The impact of this trend on CPI inflation is uncertain but unlikely to be as significant as the drivers
noted above. The main impact of risk-based pricing is a greater dispersion of premiums, causing
some people to pay more for property insurance and others to pay less. This work has highlighted
the importance for stakeholders (insurers, central and local governments, buyers and lenders) to
take actions now to improve their understanding of natural hazards so that future affordability
challenges can be managed proactively. Overtime these actions could have implications for
investment and economic activity, relevant for monetary policy.
POLICY
SENSITIVE
10 Ref #9707751 v1.0
SENSITIVE
SENSITIVE
SENSITIVE
POLICY
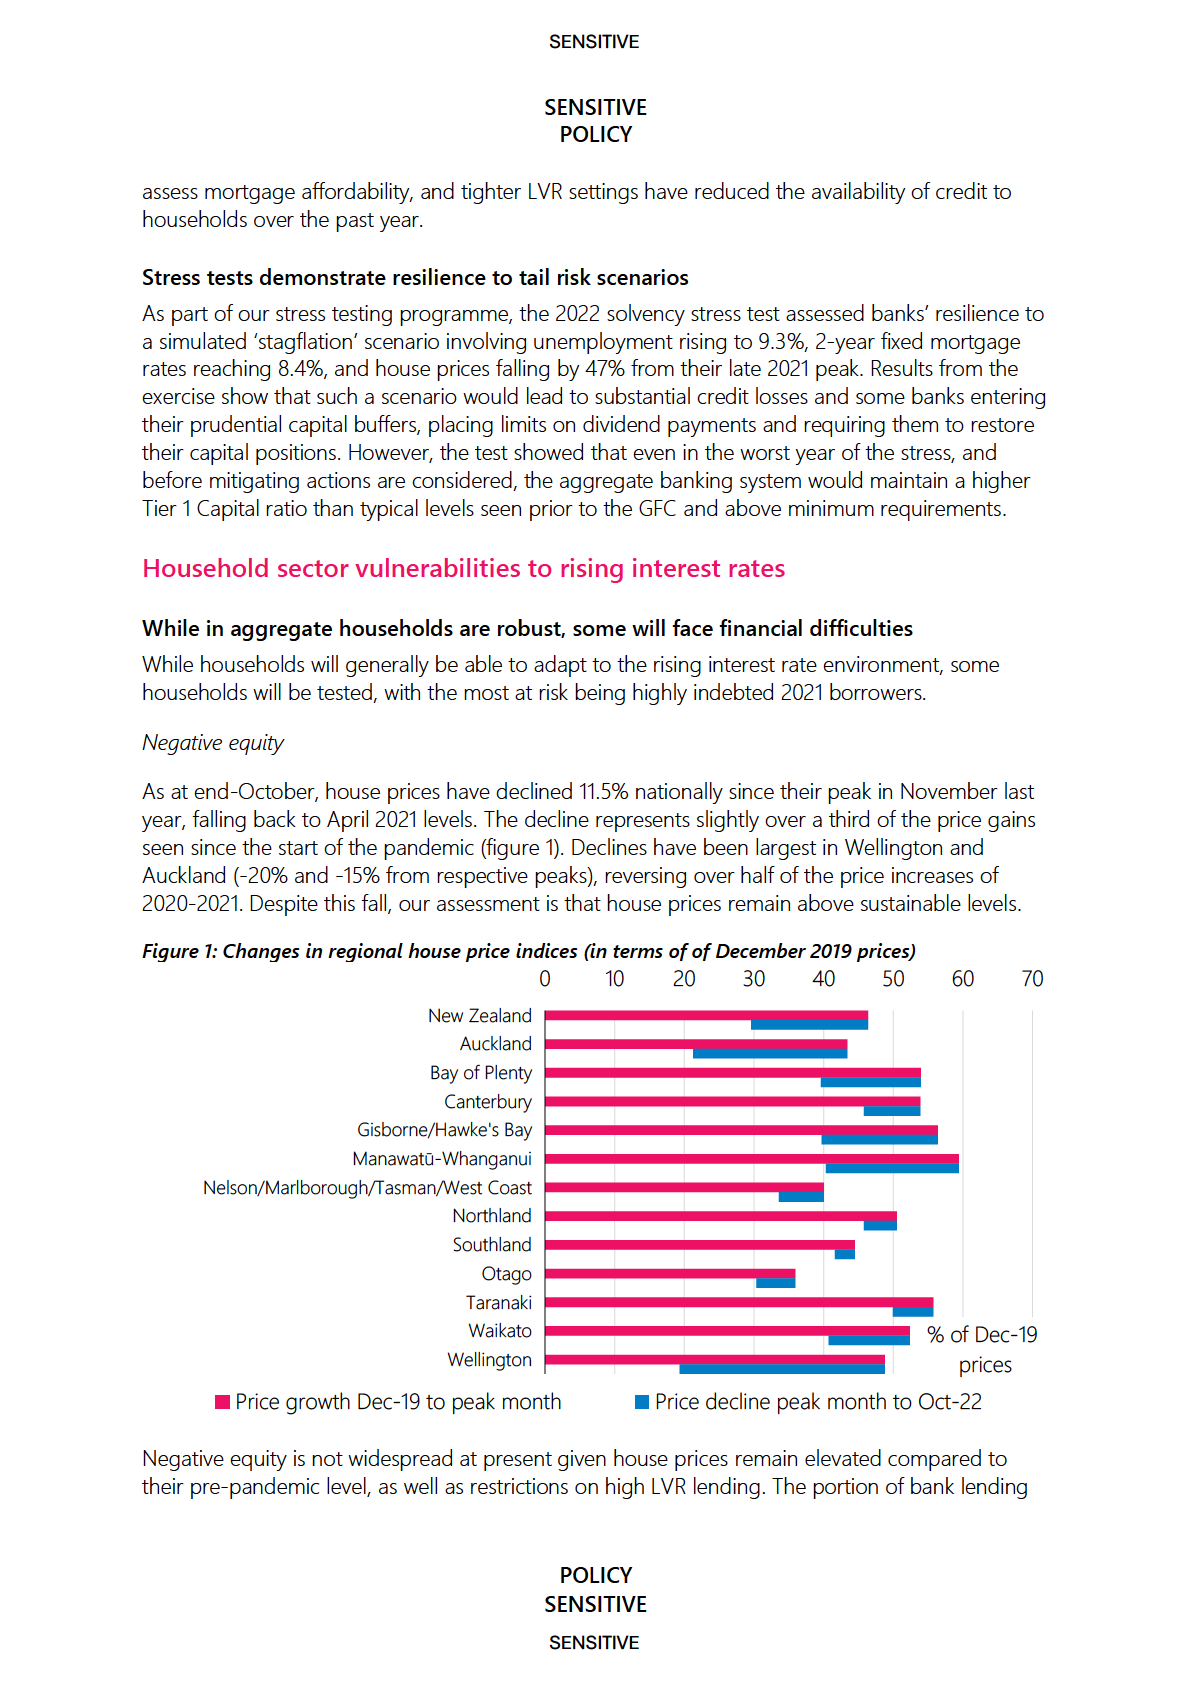
which is to borrowers who are currently in negative equity is 2%, as at September 2022. This would
increase to 7% if house prices fell a further 10% and to 18% if house prices fell a further 20%.
Negative equity on its own does not lead to losses to the financial system. It would take a rise in
defaults as well as widespread negative equity to create material financial losses.
Debt serviceability
Debt servicing costs are increasing from a low level. Over the next six months around 20% of all
mortgages will roll over onto significantly higher rates, while over the next year this portion is
nearly 50%. Given current market pricing, the effective (average) mortgage rate across banks’
mortgage lending will rise to around 6% (from 4.0% in September this year and 2.8% in
September 2021).
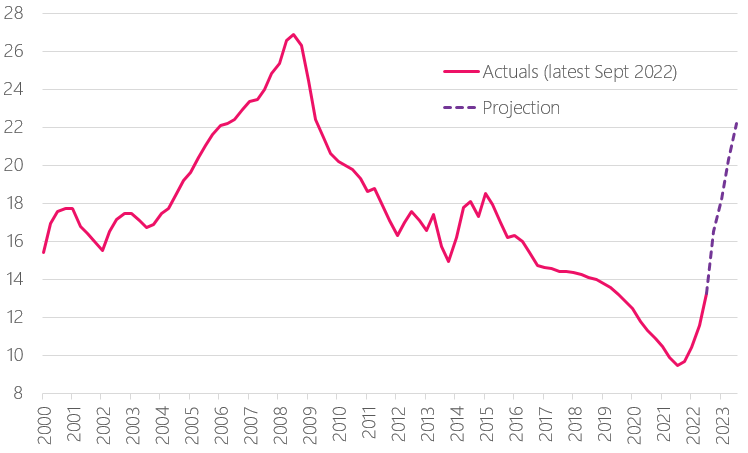
Another way of looking at this is the share of disposable income dedicated to debt servicing across
all mortgage borrowers (figure 2). This is expected to rise from 9% to 22% over the next year
based on current mortgage rates. This remains below the period from 2007-2009.
Figure 2: Average debt servicing costs for mortgage borrowers (% of disposable income)
Within this average, we expect that some borrowers face very large increases in their mortgage
payments. The 2021 cohort of borrowers are particularly vulnerable. We see this vulnerability in an
increasing portion of 2021 lending with debt servicing ratios of more than 50% as mortgage rates
rise. For example, based on our modelling work the portion is:
- 9% at a mortgage rate of 5%;
- 24% at a mortgage rate of 6%; and
- 46% at a mortgage rate of 7%.
While our modelling has some conservative assumptions in it (for example, that nominal incomes
haven’t changed since the loans were taken out), it suggests that as mortgages reprice an
increasing number of borrowers from 2021 will need to significantly reduce their discretionary
POLICY
SENSITIVE
SENSITIVE
SENSITIVE
SENSITIVE
POLICY
Business sector vulnerabilities to rising interest rates
Most business sectors are well placed to handle higher interest rates
Input cost inflation, the tight labour market, and lingering supply chain issues in some sectors are
creating a difficult operating environment for many businesses. However, overall profitability has
remained healthy as most firms have been able to pass on input cost increases to customers,
preserving profit margins.
While interest servicing burdens will increase with the rising interest rate environment, we have
seen a general deleveraging across most business sectors in recent years, which will lessen the
strain this causes. This is particularly the case for the dairy sector, where farmers have used high
milk payouts in recent years to reduce debt. To date, data on bank lending to businesses has
shown limited signs of financial stress emerging, despite average business lending rates having
already repriced from mid-2021 lows of 3.1% to around 5.5% currently.
The outlook for residential development has deteriorated, due to declining prices for existing
houses, ongoing construction cost inflation, negative net migration, and rising interest rates. The
number of new houses being sold off the plans (pre-sales) has declined considerably. Since a high
level of pre-sales is a prerequisite for obtaining finance from lenders, developers are potentially
facing a substantial slowdown in activity once currently committed development pipelines are
completed. Owing to these relatively stringent lending criteria, the financial system’s exposure to
residential development risks is assessed as being contained.
Macroprudential policy update
LVR settings remain appropriate for now
LVR settings remain appropriate for now given house prices remain unsustainably high and
concerns for some existing borrowers due to rising interest rates.
POLICY
SENSITIVE
SENSITIVE
SENSITIVE
SENSITIVE
POLICY
An easing in LVR settings would be considered if they were judged to be creating excessively tight
lending conditions and we were confident that house prices were no longer above their
sustainable level.
Progress to operationalise a debt-to-income tool
We will soon consult on operationalising a debt-to-income (DTI) tool for mortgage lending, aiming
to make final decisions on the design in the first half of 2023. It would take a further 12 months
from that point for the banking sector to be ready to implement such a tool.
We do not see an immediate need to introduce DTI limits given the current conditions in the
housing market and recent tightening banks have made to their serviceability assessments.
POLICY
SENSITIVE
SENSITIVE