

3 December 2025
Dear S Smith
I am responding to your Ocial Information Act request of 6 November asking for:
“the underlying study, or research, or report that is the source for this quote from the recent Michelin
Guide press release: “Tourism New Zealand data estimates Michelin’s arrival to bring in up to 36,000
more international visitors”
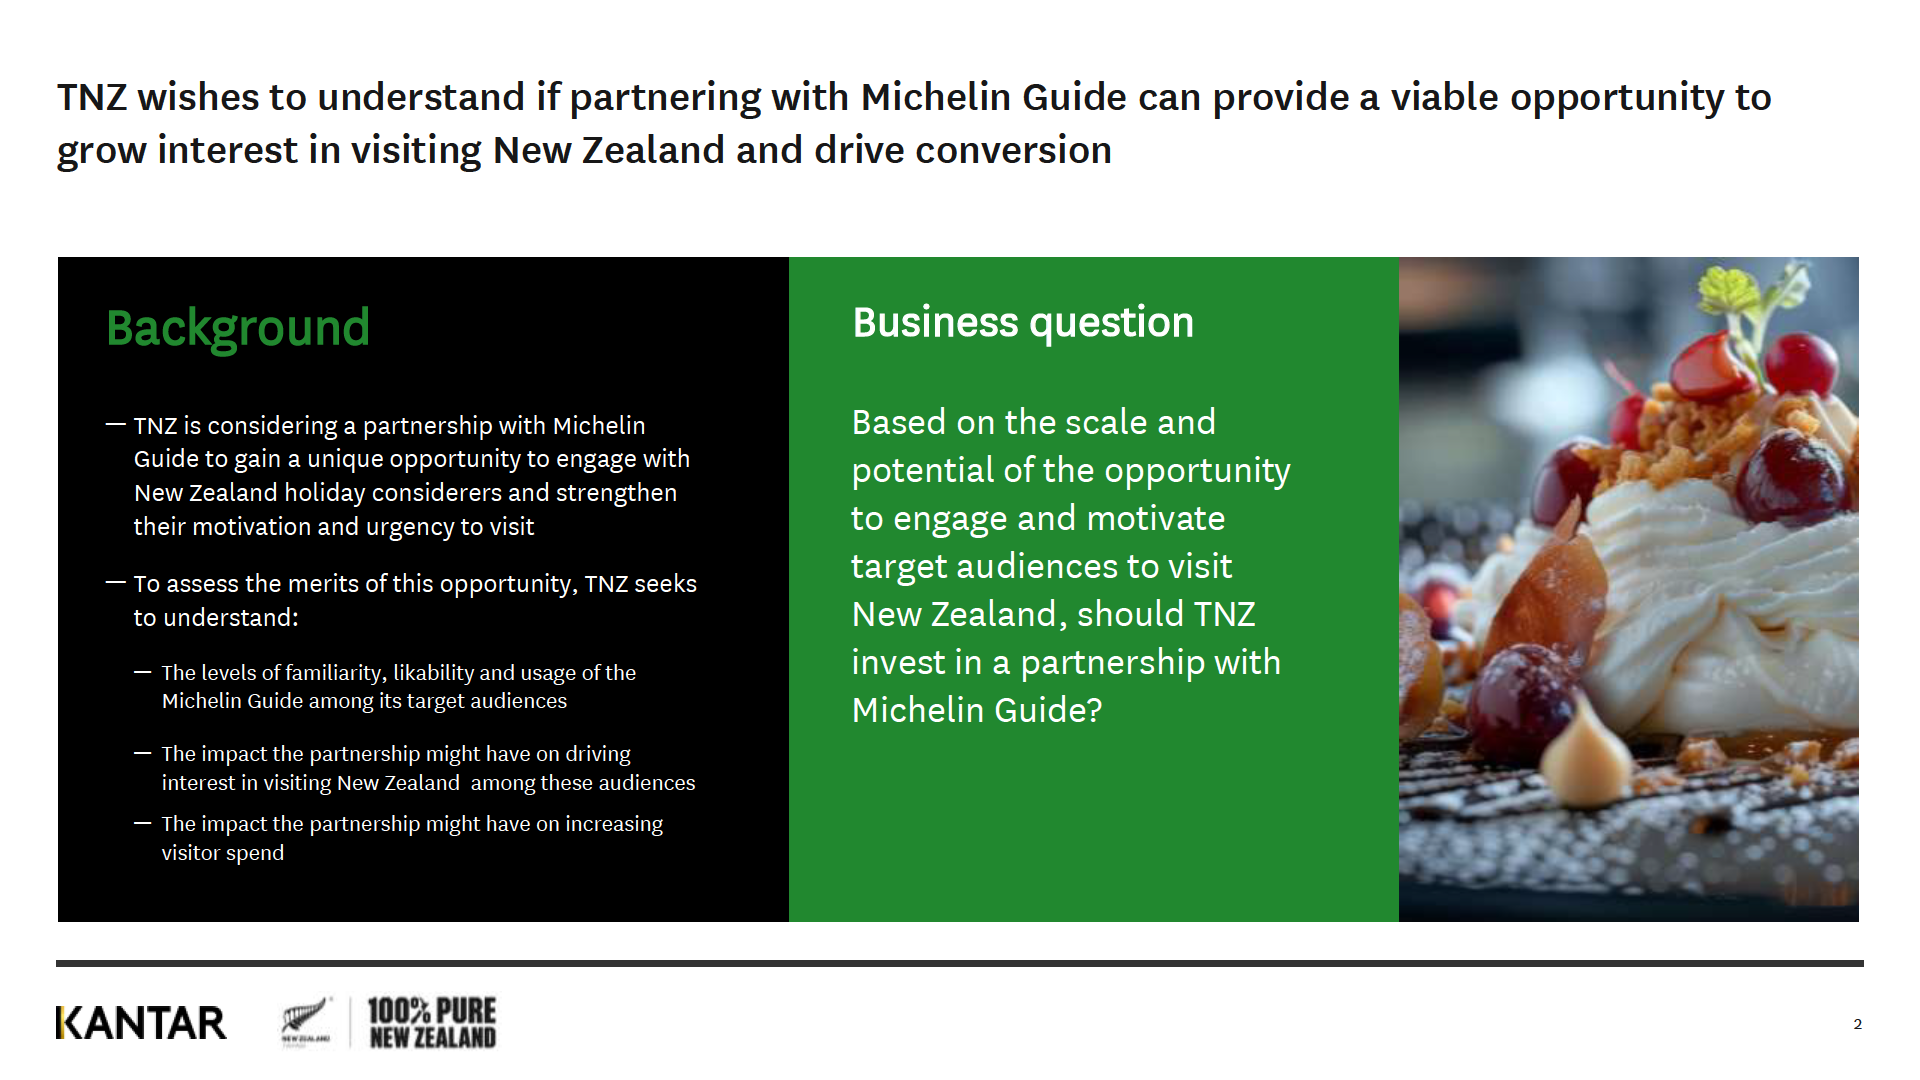
Tourism New Zealand (TNZ) is investing $2.5 million into a programme of activity with the Michelin
Guide in the 12 months to June 2026, including $1.9 mil ion allocated to TNZ from the International
Visitor Conservation and Tourism Levy (IVL). Visitors pay this levy before entering New Zealand; MBIE
administers the fund, and the collected money is used for tourism and conservation initiatives. An
additional $3.8 million from the IVL will be invested into the programme in future years.
TNZ estimates that this investment will result in an increase of up to 36,000 international visitor
arrivals per year from 2026/27. This international visitor arrivals estimate was calculated internally by
TNZ using historical campaign performance data, and Michelin Guide-specic market research.
I have attached the spreadsheet showing our internal modelling and estimates, as well as Tourism New
Zealand’s research into the impact of Michelin on visitors' intentions to travel to New Zealand.
If you would like further information, please contact
[email address]
You have the right to seek an investigation and review by the Ombudsman of this decision. Information
on how to make a complaint is available at
www.ombudsman.parliament.nz or by freephone on 0800
802 602.
Yours sincerely
René de Monchy
Chief Executive

9(2)(b)(ii)
9(2)(b)(ii)

Project M - Arrivals Scenarios
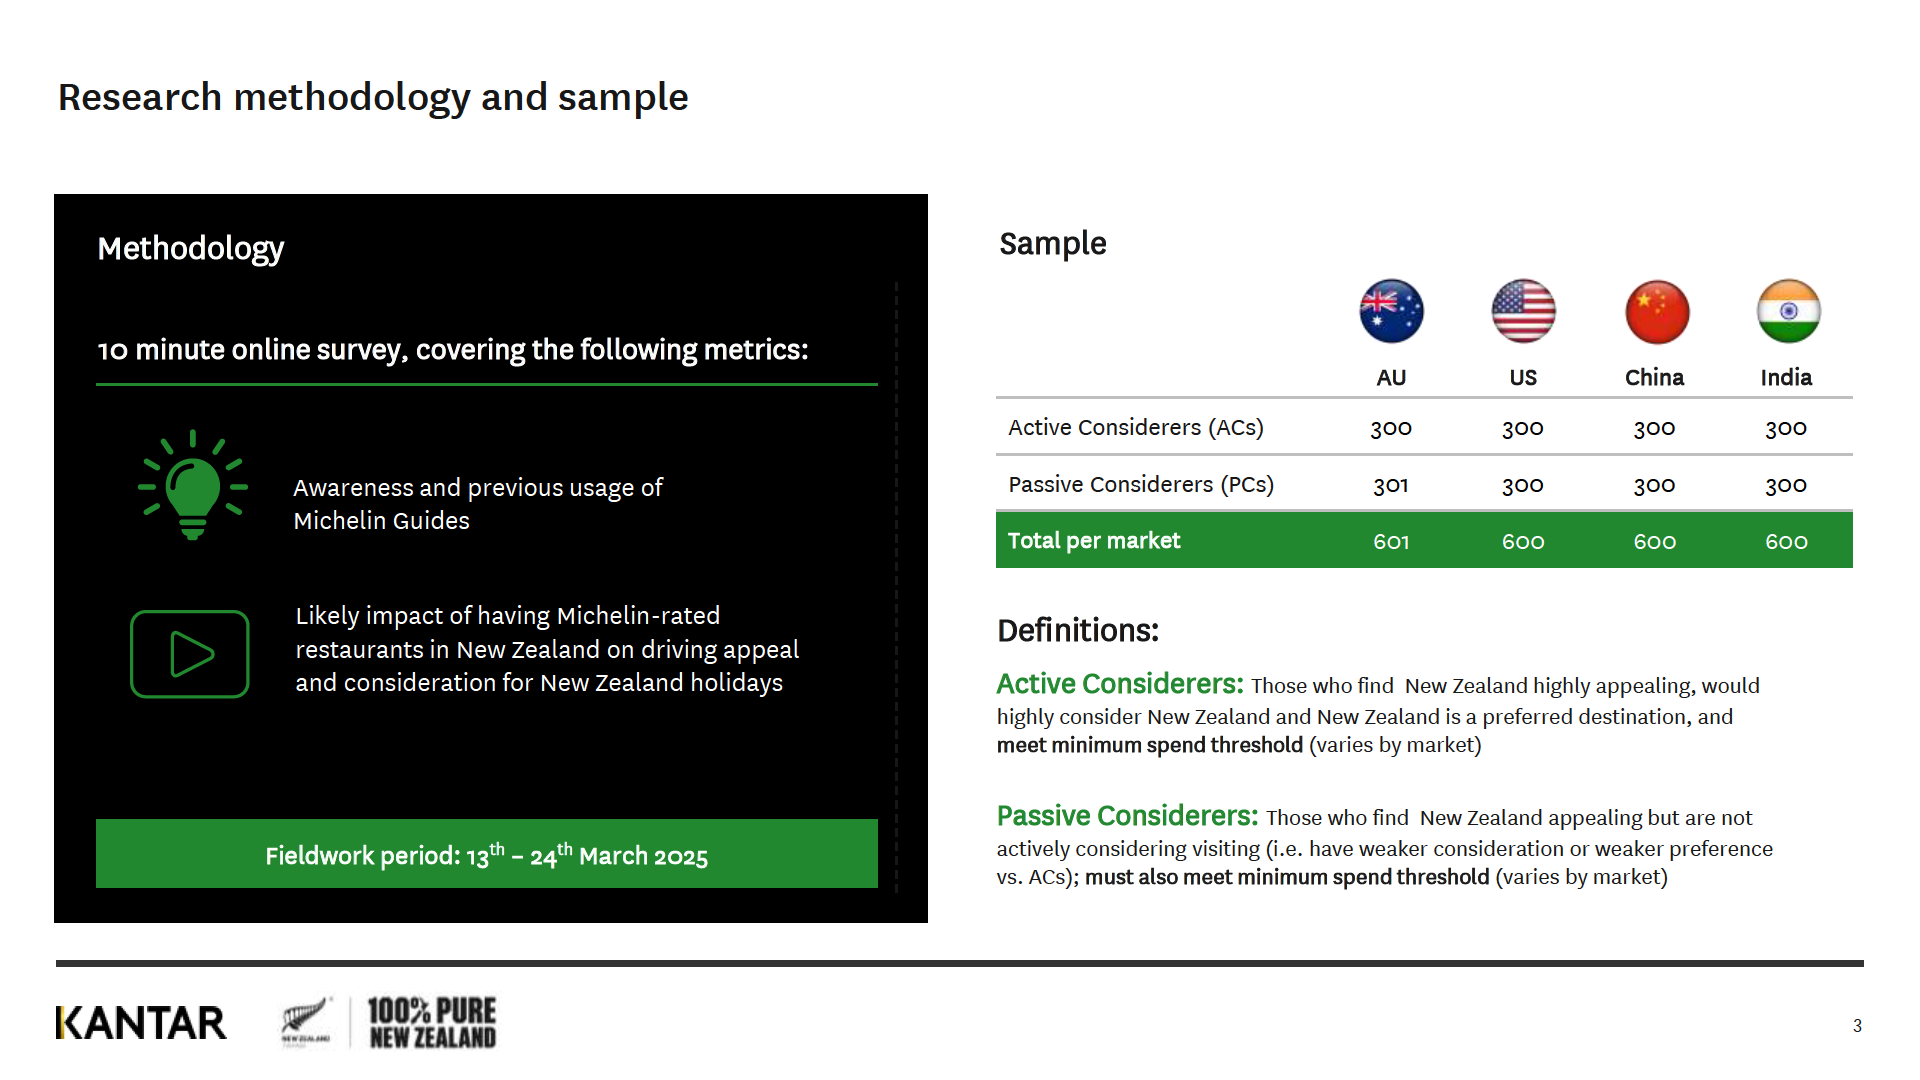
Australia
USA
China
India
Total
ACM Mar'25
Number
Conversion
Number
Conversion
Number
Conversion
Number
Conversion
Number
Conversion
Rate
Rate
Rate
Rate
Rate
Population
17,
182,674
209,
916,536
104,
766,840
40,
354,610
372,220,660
Find NZ Appealing
10,
389,103
60.5% 109,
211,564
52.0% 89,
191,152
85.1% 30,
945,964
76.7%
239,737,783
64.4%
Consider Visiting NZ in the next 3 years
7,
236,812
69.7% 79,
145,138
72.5% 75,
323,017
84.5% 26,
834,215
86.7%
188,539,182
78.6%
NZ a prferred Destination
6,
175,697
85.3% 67,
527,229
85.3% 74,
720,135
99.2% 25,
955,002
96.7%
174,378,063
92.5%
AC Population
4,
480,692
72.6% 49,
736,093
73.7% 62,
206,532
83.3% 14,
802,267
57.0%
131,225,584
75.3%
Holiday Arrivals - 12mths to Jan'25
582,
337
13.0% 241,
476
0.5% 180,
552
0.3%
23,
930
0.2%
1,
028,295
0.8%
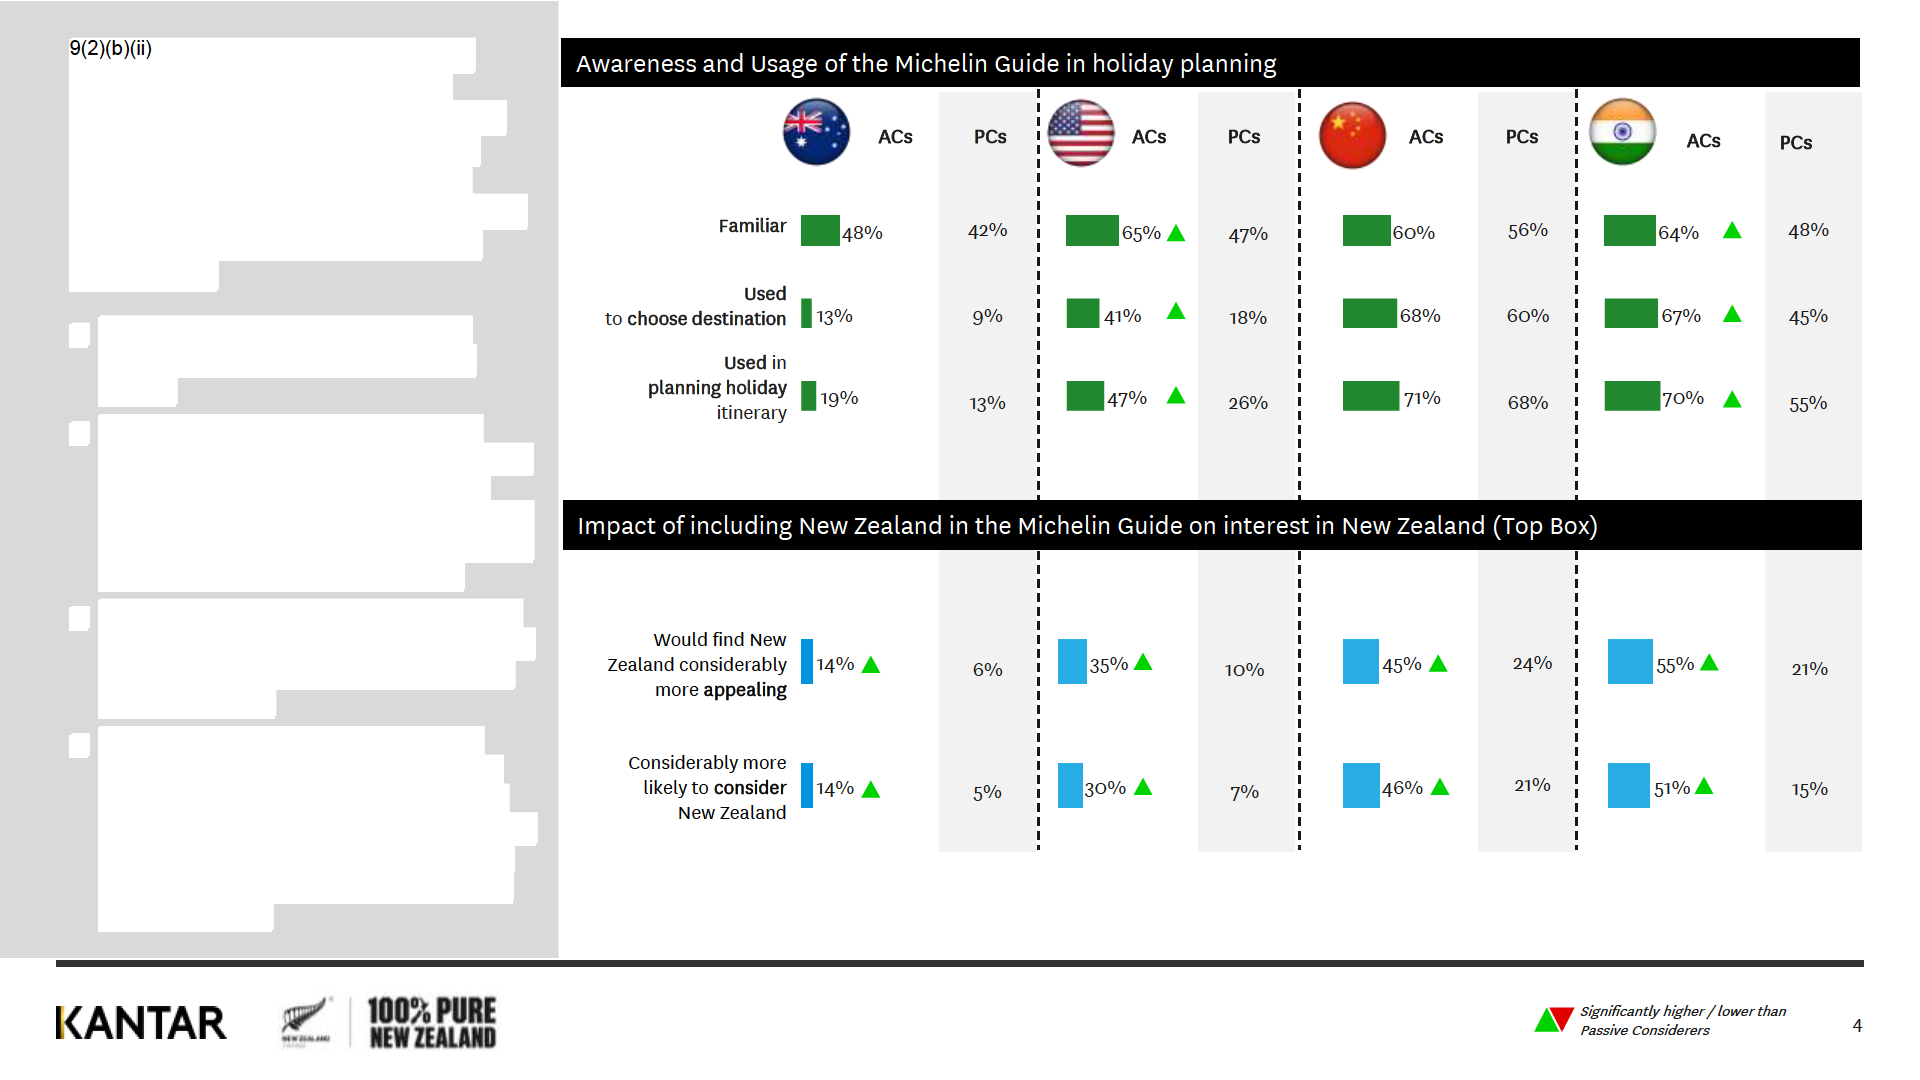
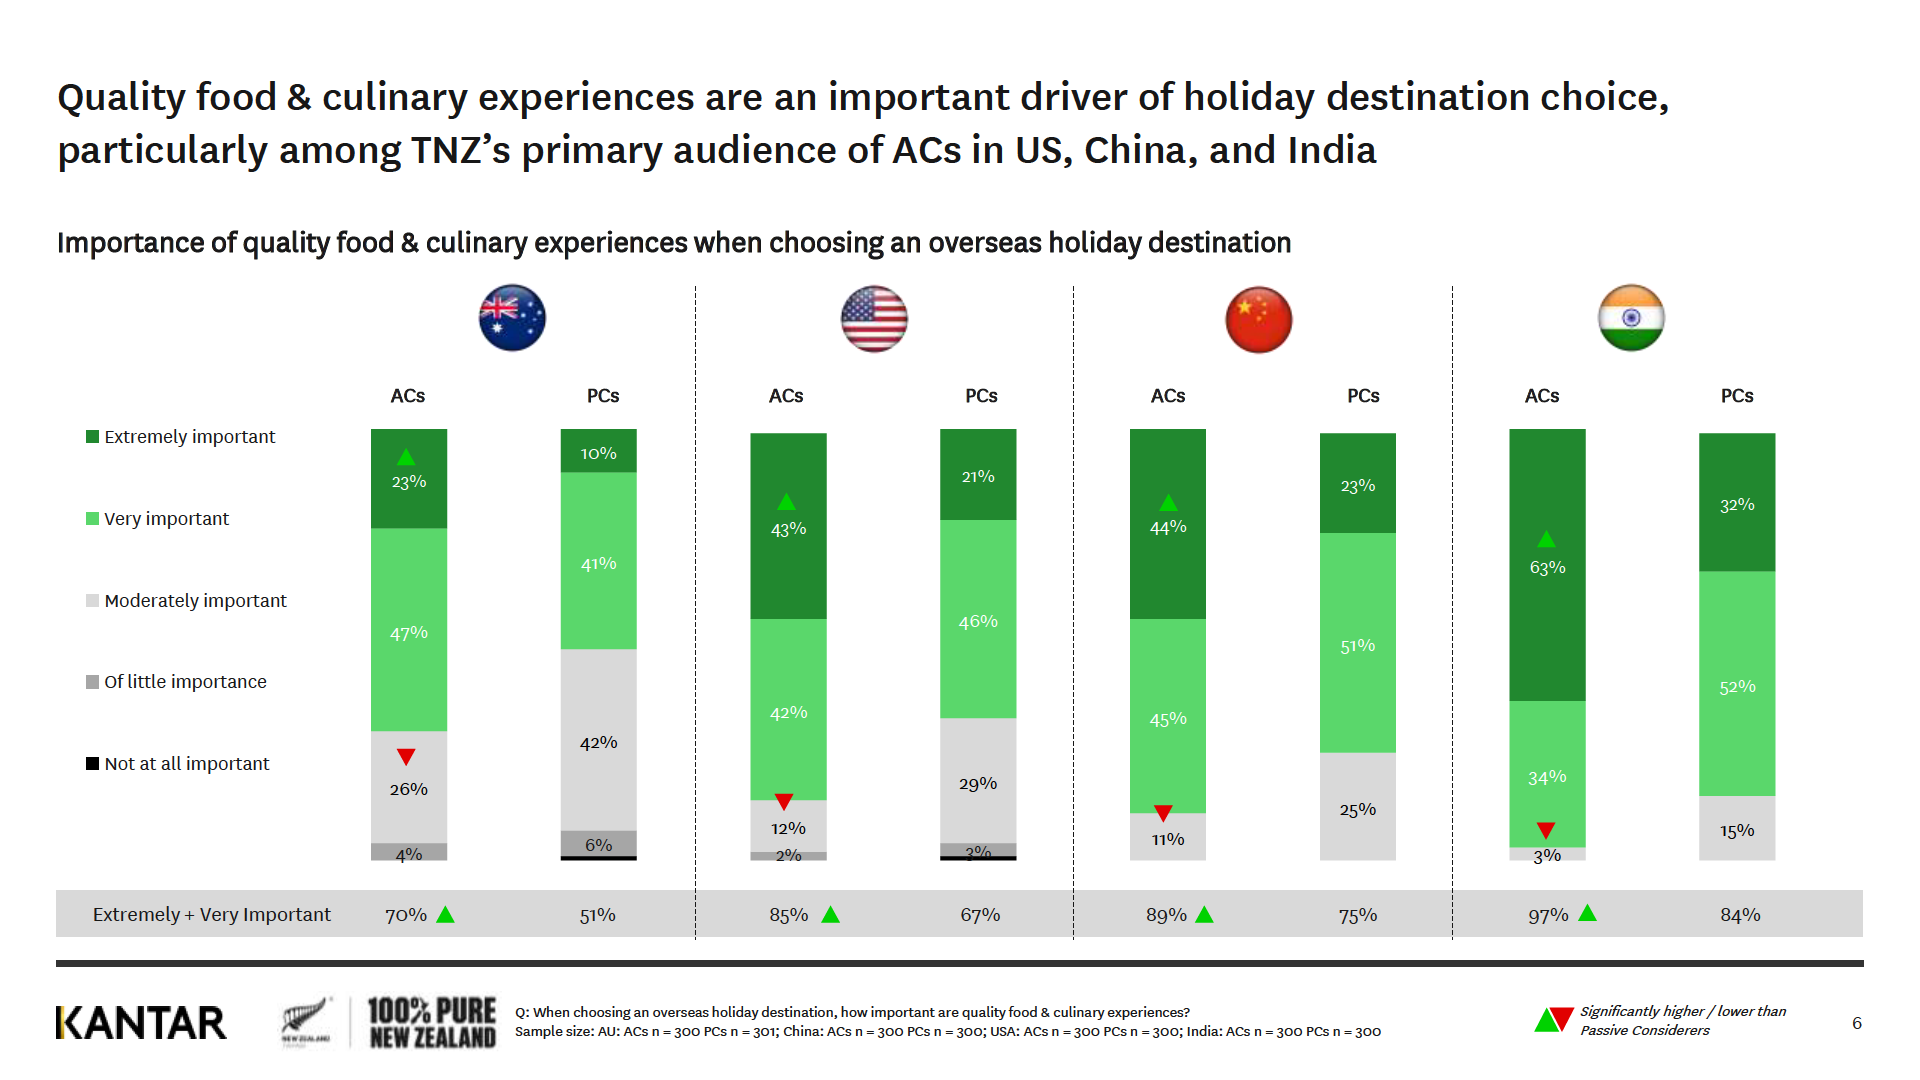
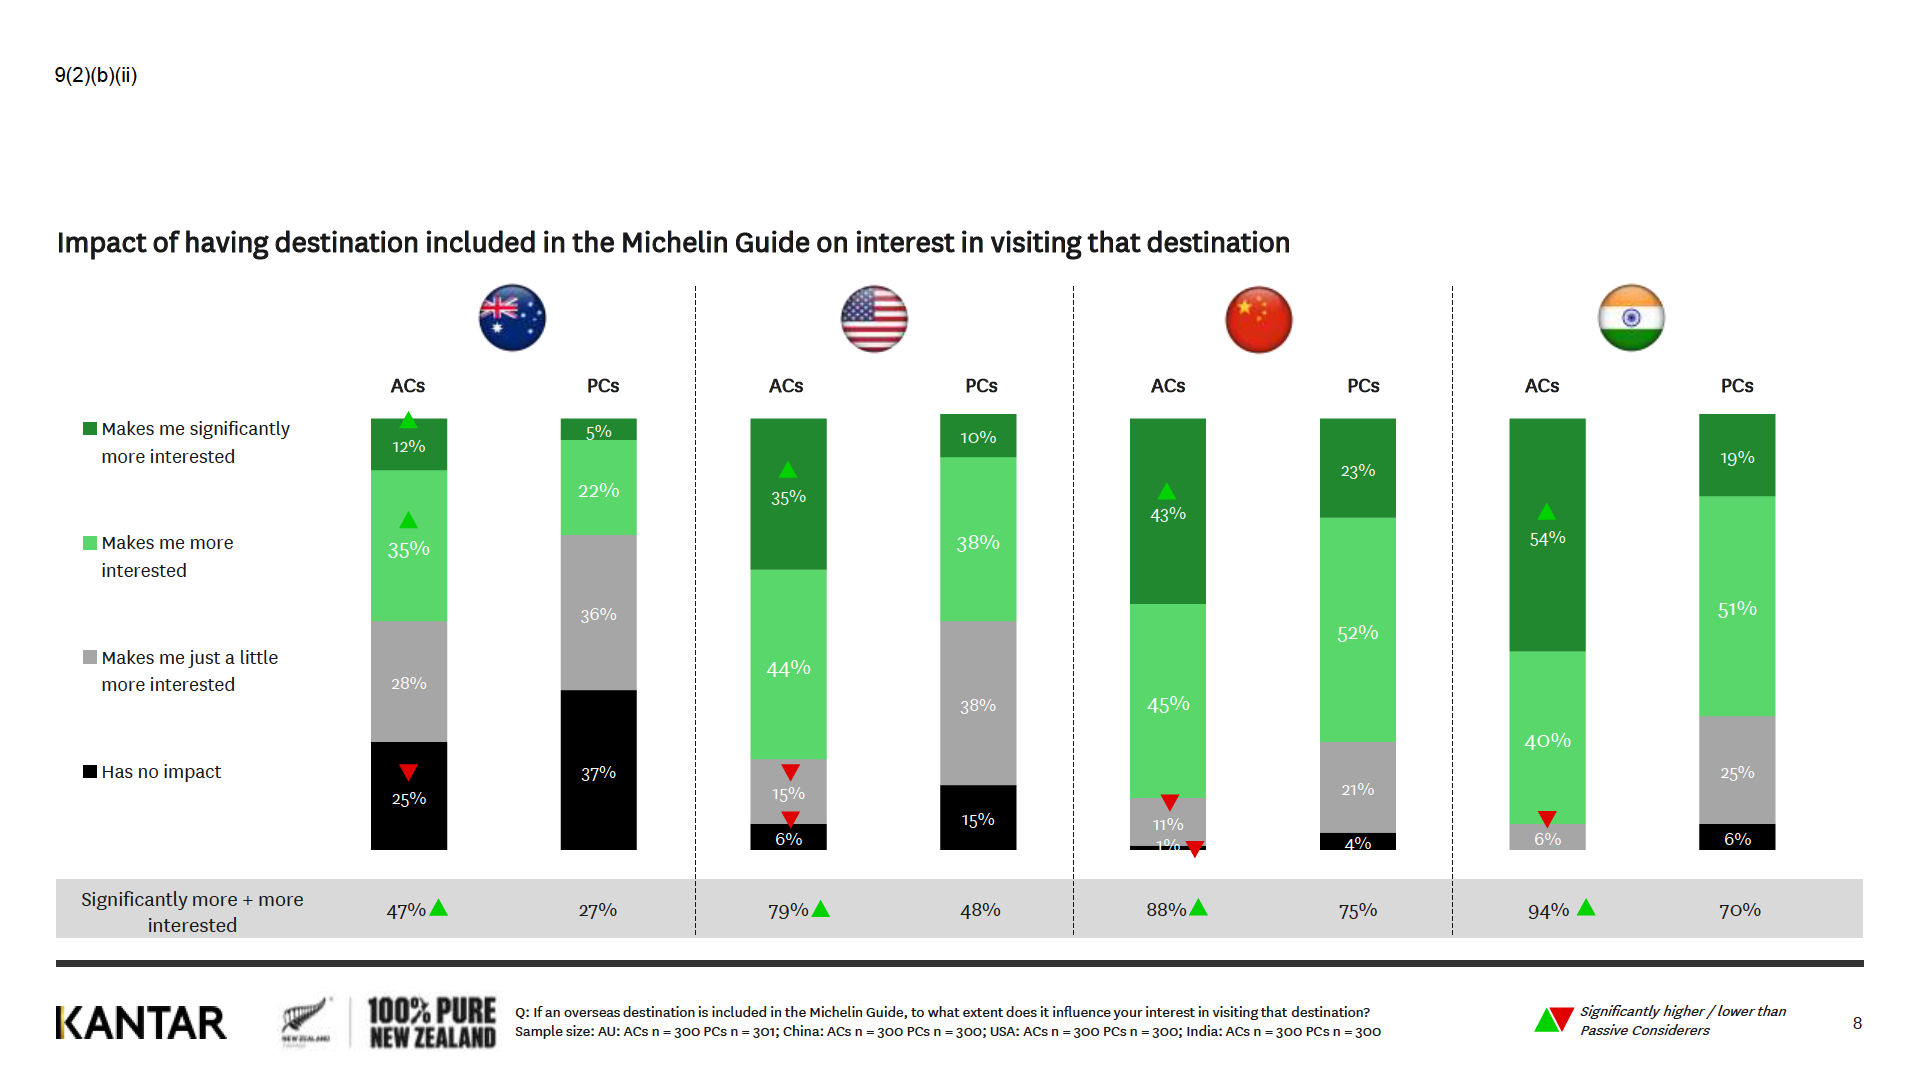
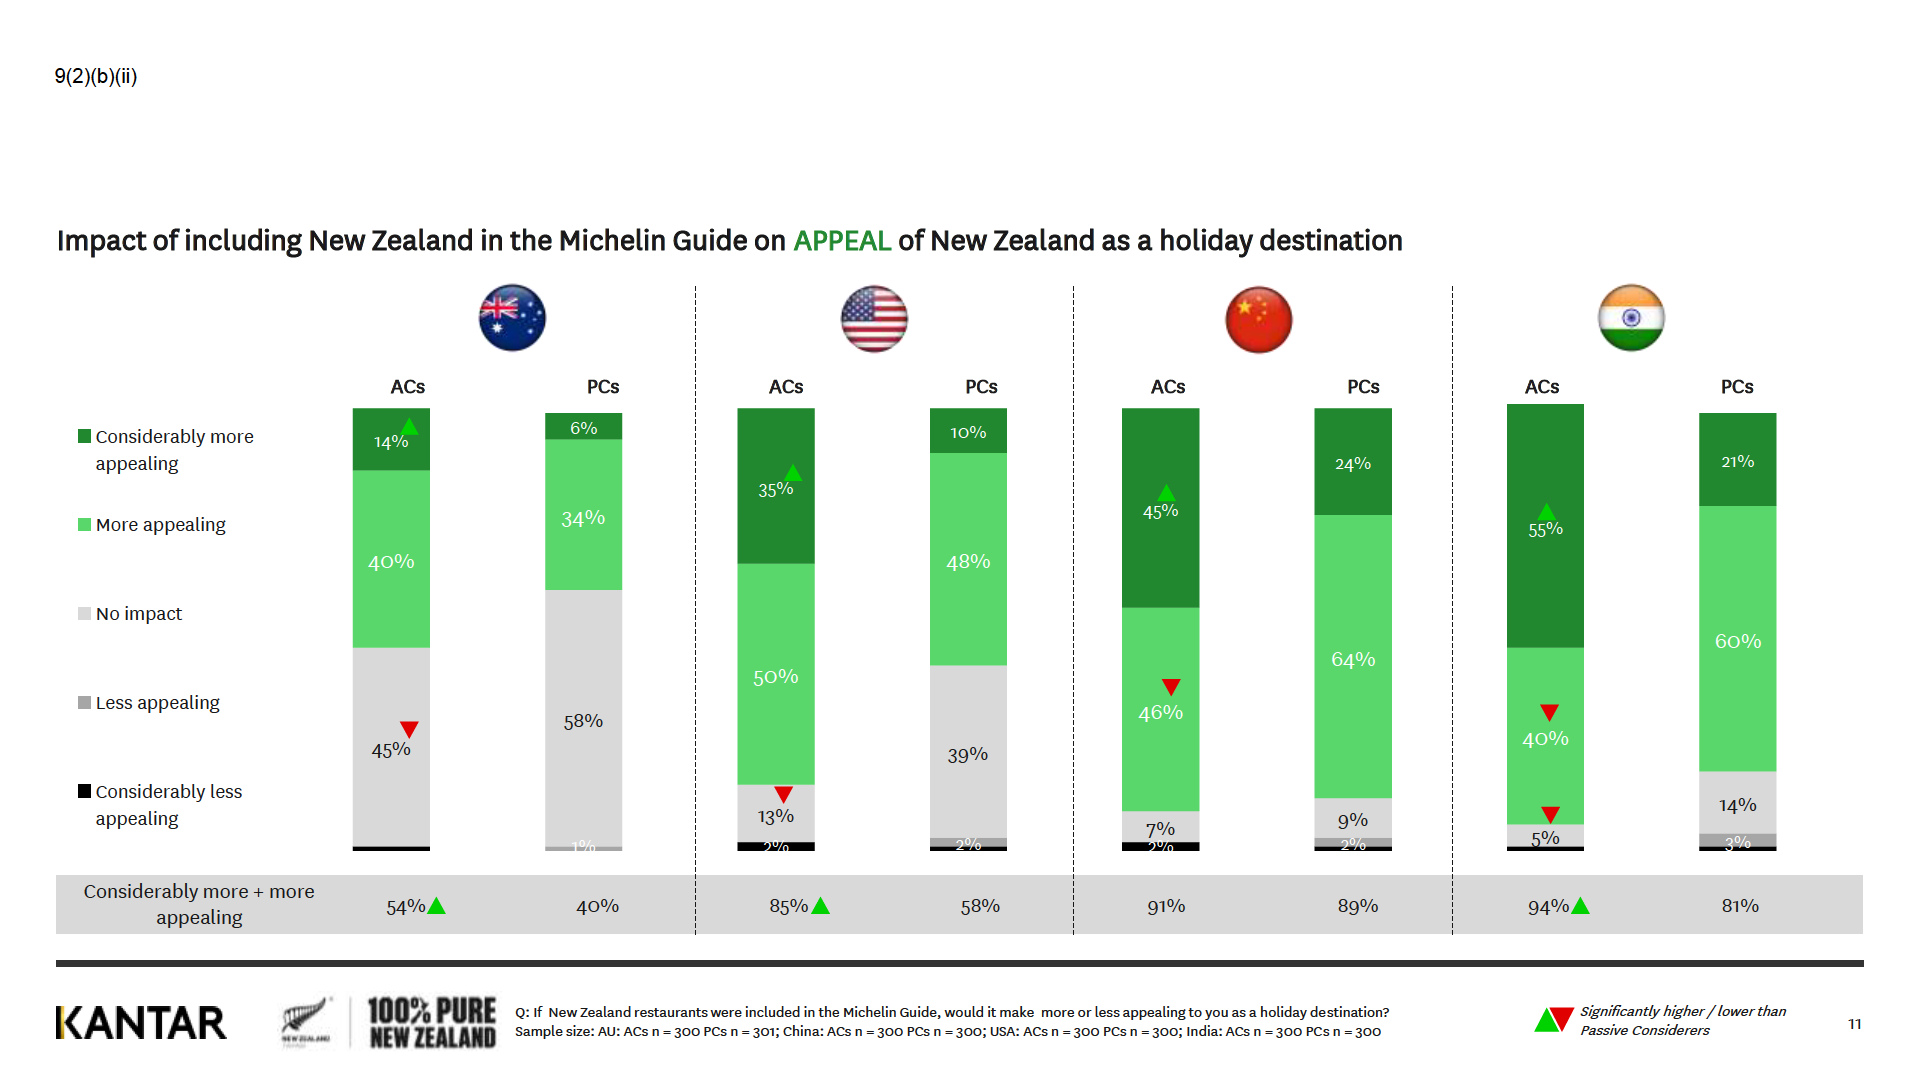
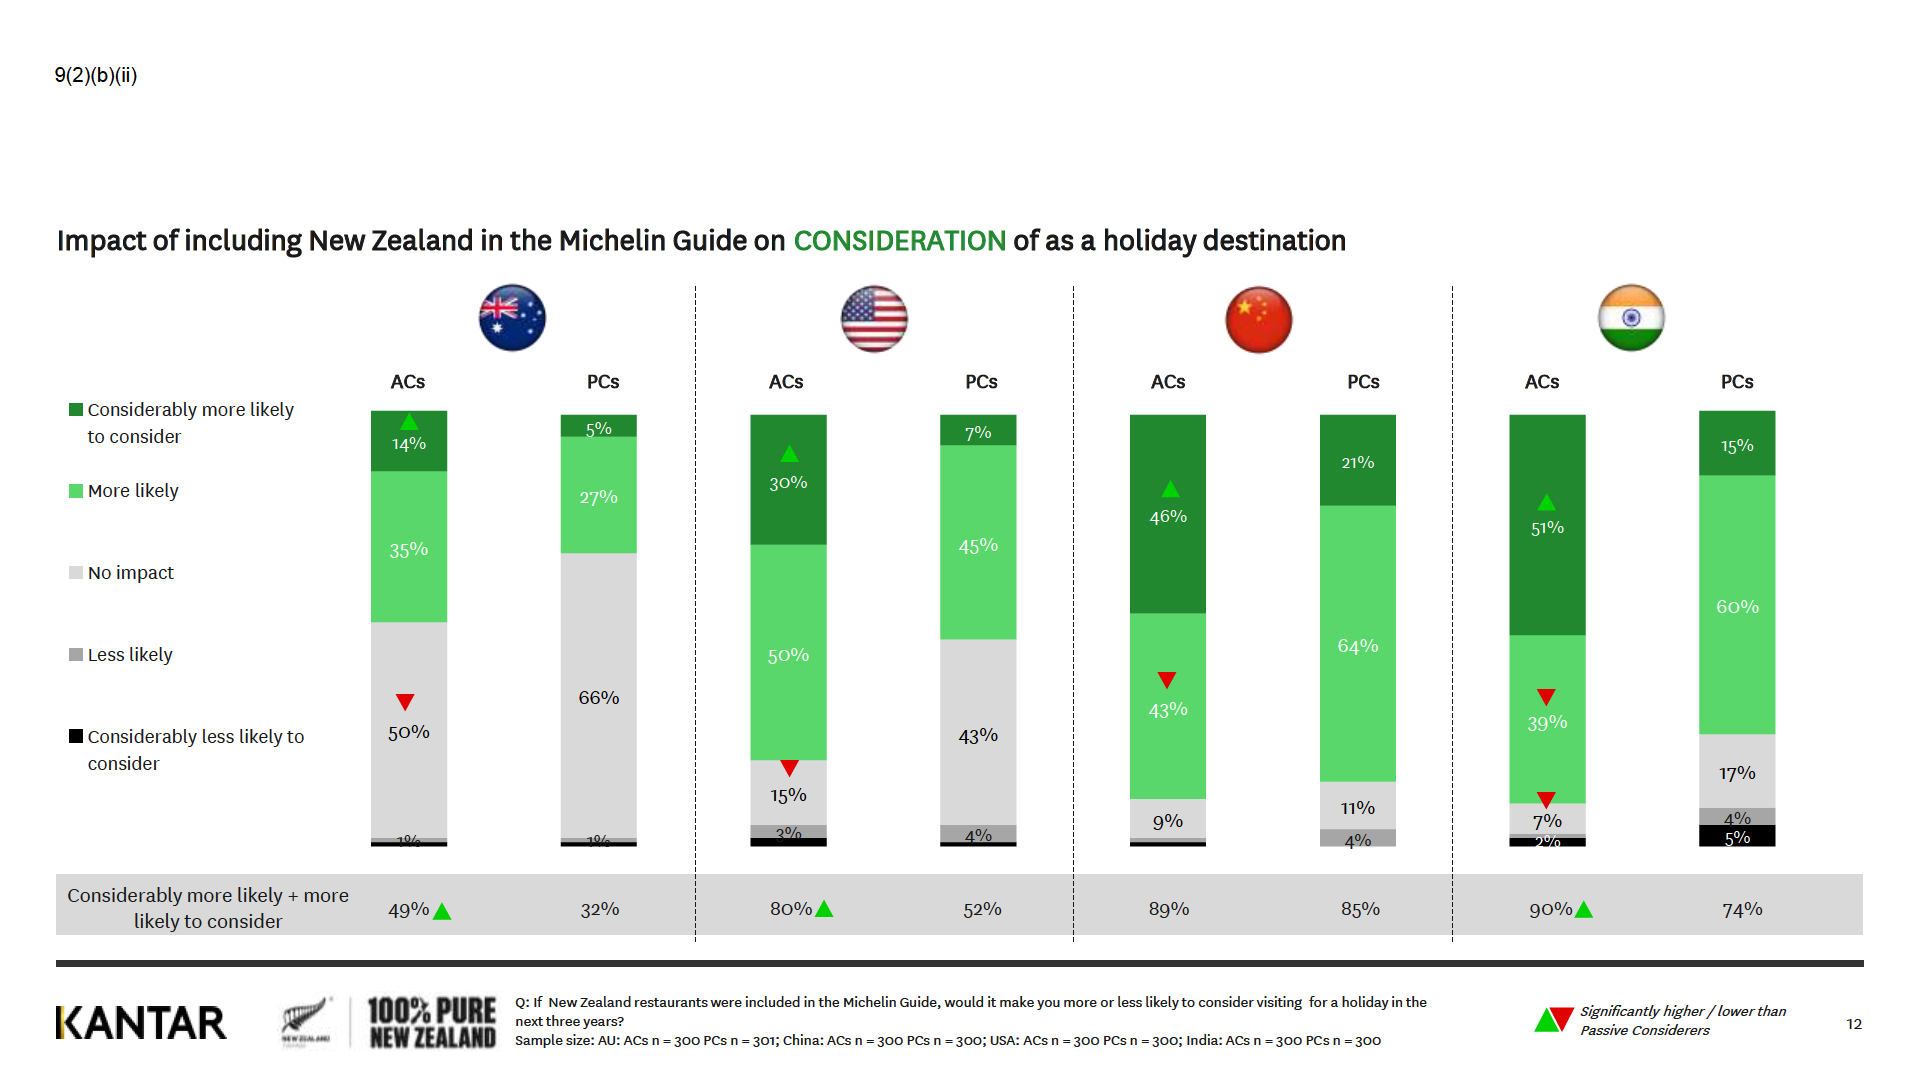
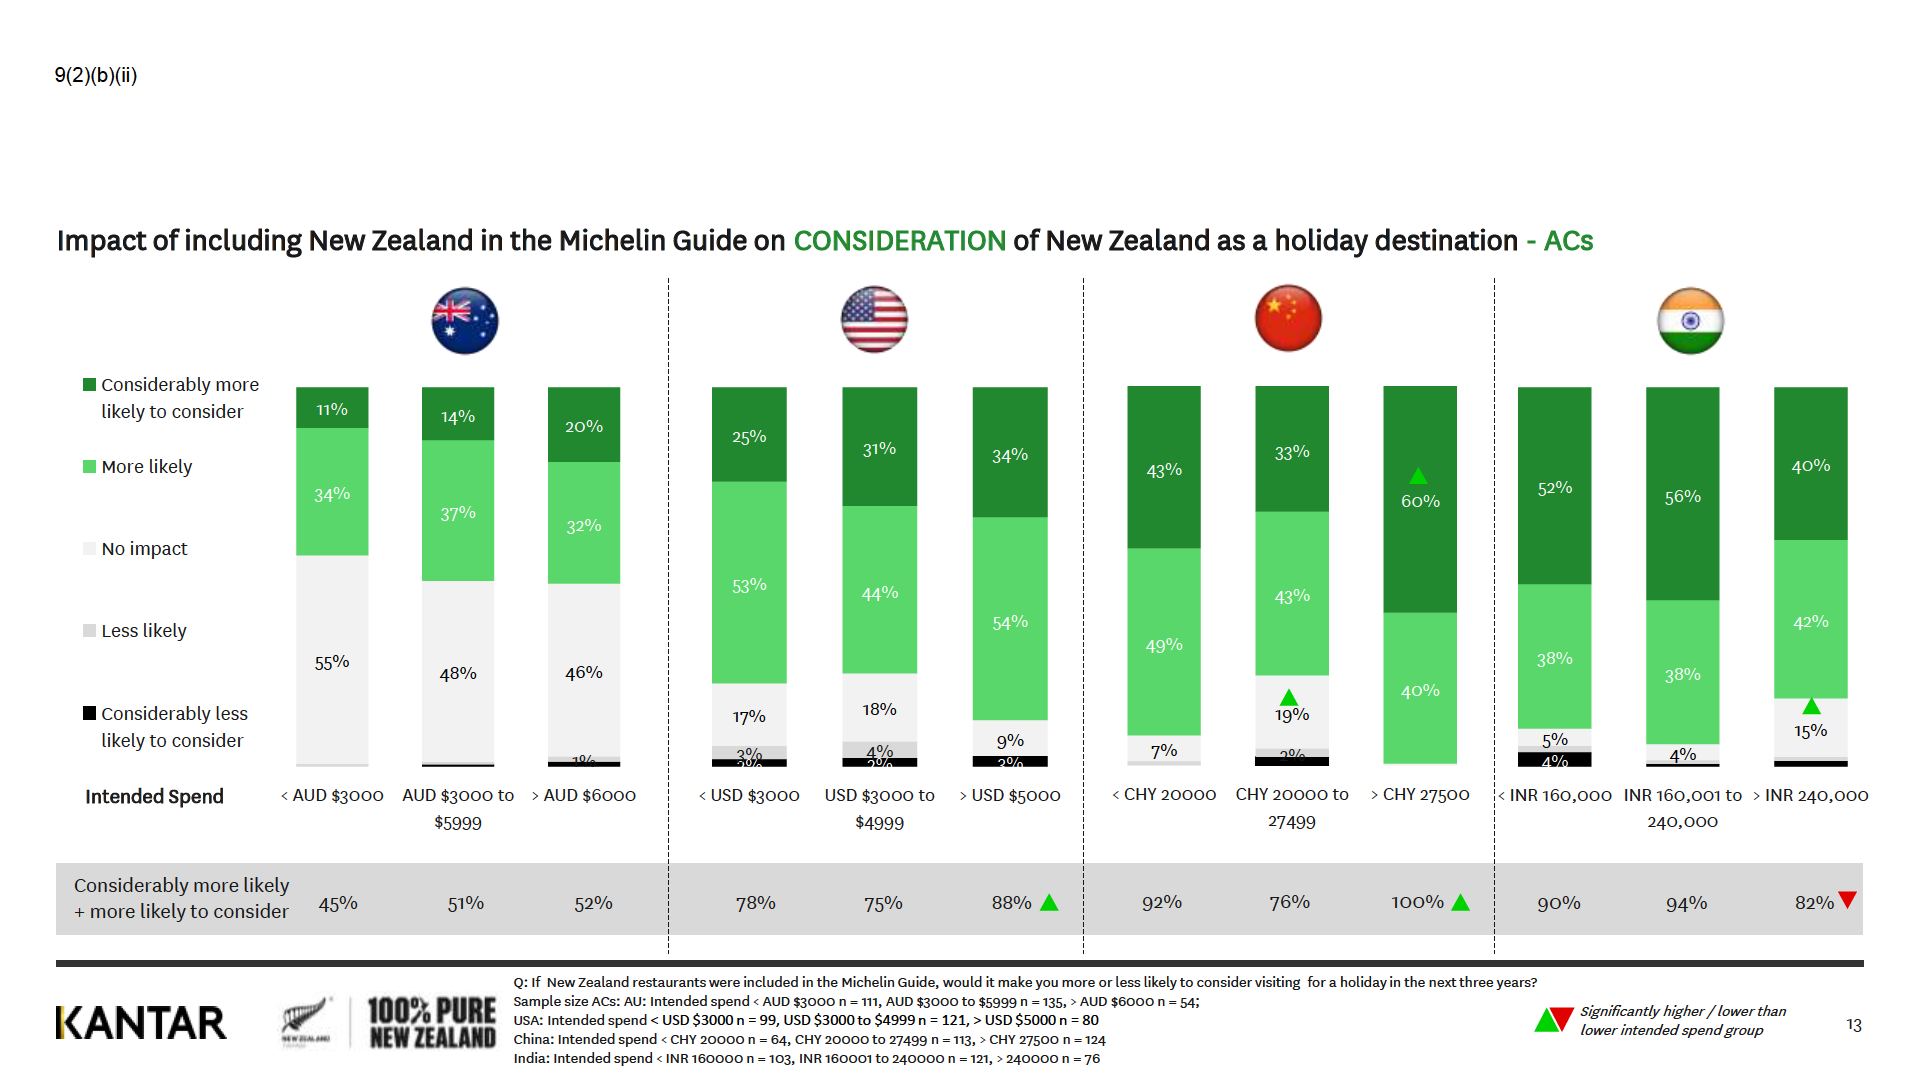
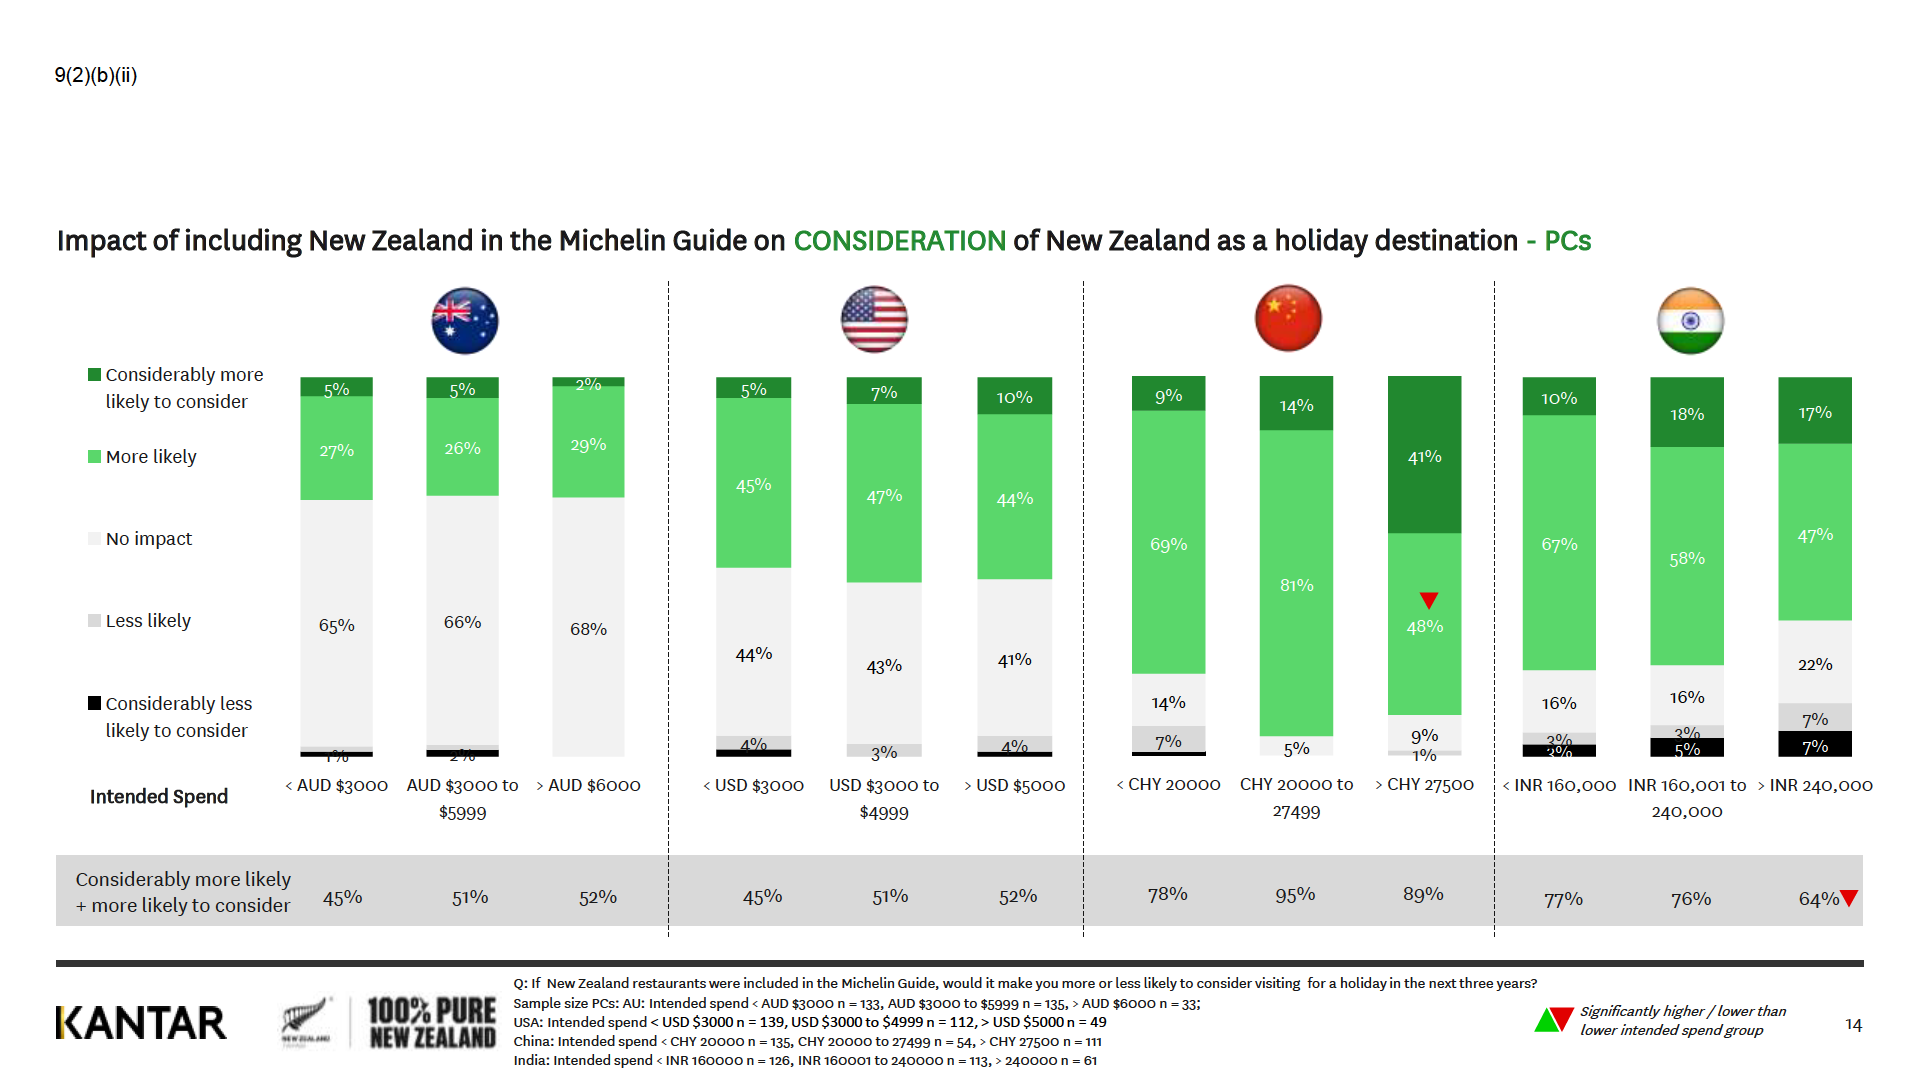
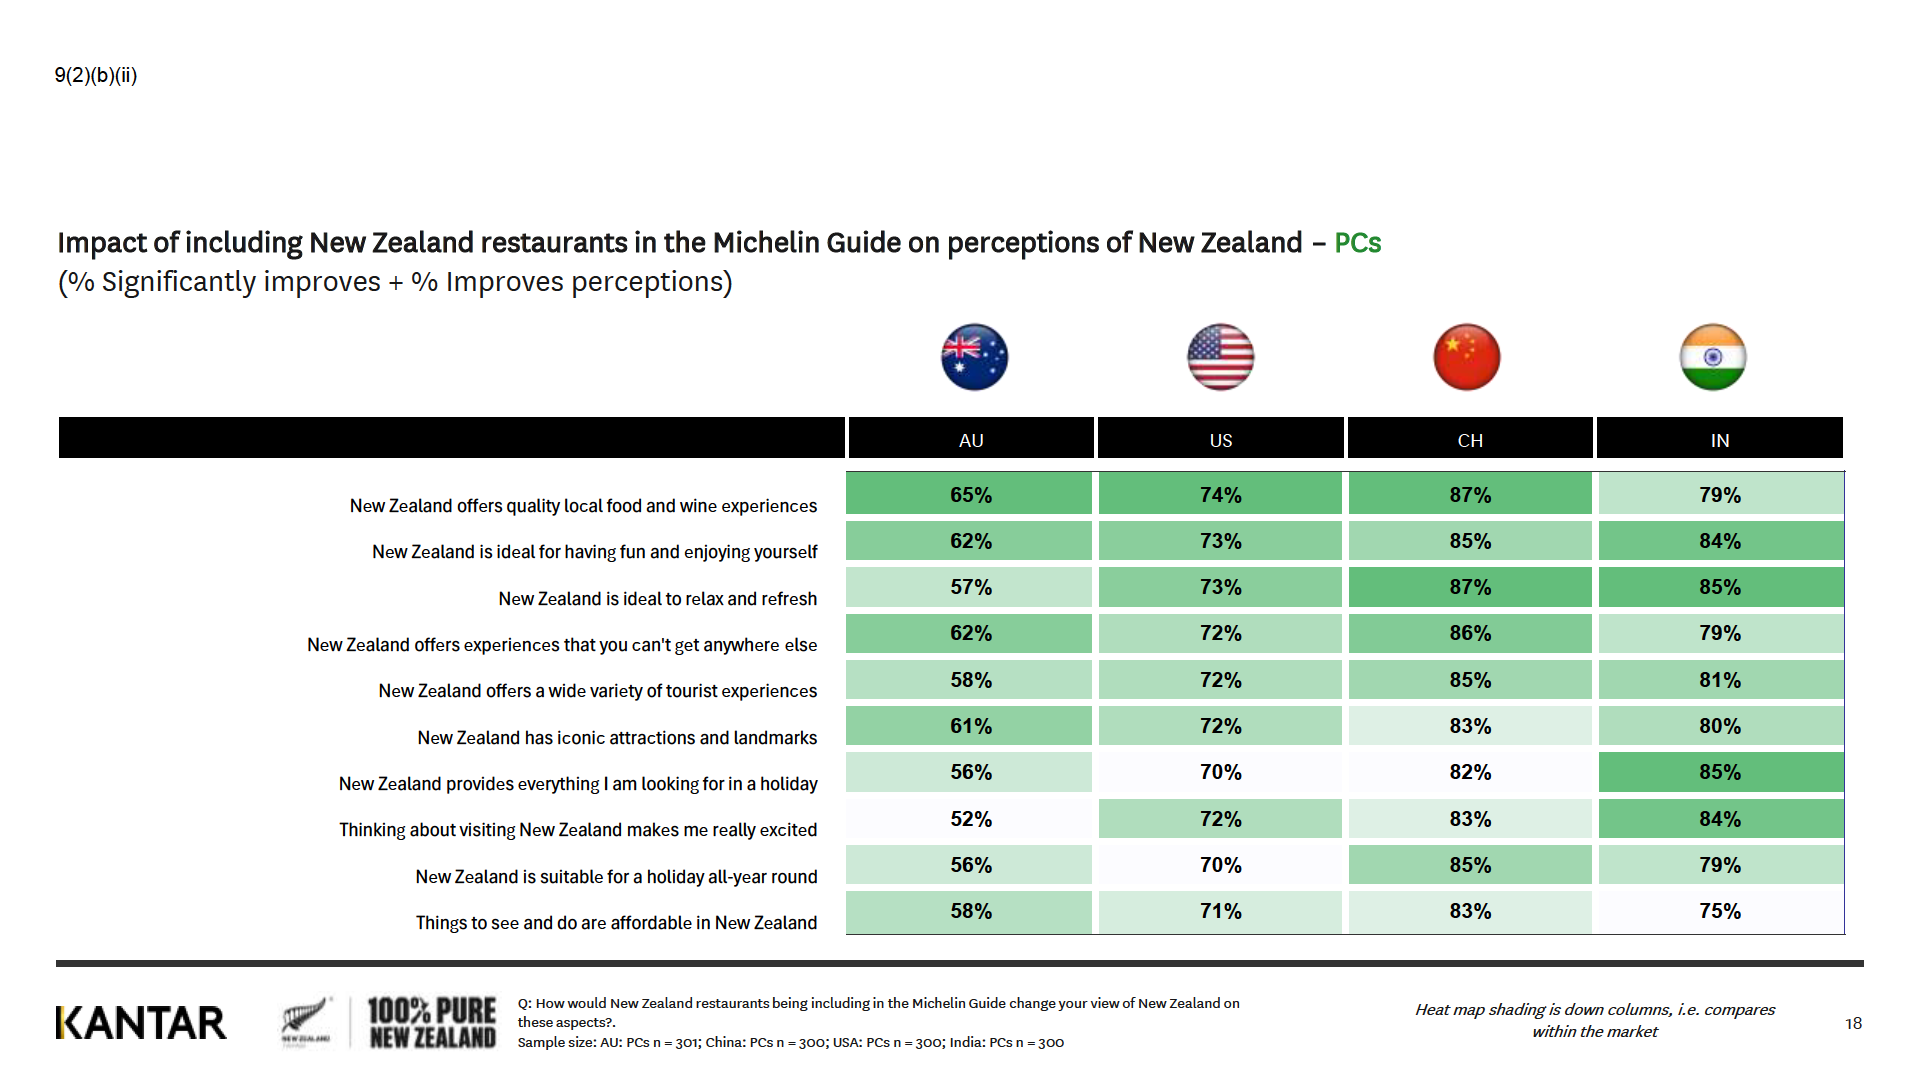
Impact of NZ in the Michelin Guide on
49%
80%
89%
90%
Consideration of NZ as a oliday destination
Australia
USA
China
India
Total
Scenario 1
Number
Conversion
Number
Conversion
Number
Conversion
Number
Conversion
Number
Conversion
Rate
Rate
Rate
Rate
Rate
Consideration lift
1.0%
1.6%
1.8%
1.8%
1.7%
Consider Visiting NZ in the next 3 years
7,
340,703
70.7% 80,
928,184
74.1% 76,
943,020
86.3% 27,
402,610
88.5%
192,614,517
80.3%
NZ a prferred Destination
6,
264,355
85.3% 69,
048,537
85.3% 76,
327,171
99.2% 26,
504,774
96.7%
178,144,837
92.5%
AC Population
4,
545,016
72.6% 50,
856,588
73.7% 63,
544,433
83.3% 15,
115,805
57.0%
134,061,842
75.3%
Holiday Arrivals - 12mths to Jan'25
590,
697
13.0% 246,
916
0.5% 184,
435
0.3%
24,
437
0.2%
1,
046,485
0.8%
Incremental Holiday Arrivals
8,
360
5,
440
3,
883
507
18,
190
Average Holiday Spend
3,
$ 801
5,
$ 637
7,
$ 039
5,
$ 654
$ 5,
093
Incremental Holiday Spend
$31.8M
$30.7M
$27.3M
$2.9M
$92.6M
Australia
USA
China
India
Total
Scenario 2 - Upside
Number
Conversion
Number
Conversion
Number
Conversion
Number
Conversion
Number
Conversion
Rate
Rate
Rate
Rate
Rate
Consideration lift
2.0%
3.3%
3.6%
3.7%
3.4%
Consider Visiting NZ in the next 3 years
7,
444,594
71.7% 82,
711,230
75.7% 78,
563,022
88.1% 27,
971,006
90.4%
196,689,852
82.0%
NZ a prferred Destination
6,
353,013
85.3% 70,
569,846
85.3% 77,
934,207
99.2% 27,
054,546
96.7%
181,911,611
92.5%
AC Population
4,
609,341
72.6% 51,
977,083
73.7% 64,
882,334
83.3% 15,
429,342
57.0%
136,898,100
75.3%
Holiday Arrivals - 12mths to Jan'25
599,
057
13.0% 252,
356
0.5% 188,
318
0.3%
24,
944
0.2%
1,
064,675
0.8%
Incremental Holiday Arrivals
16,
720
10,
880
7,
766
1,
014
36,
380
Average Holiday Spend
3,
$ 801
5,
$ 637
7,
$ 039
5,
$ 654
$ 5,
093
Incremental Holiday Spend
$63.6M
$61.3M
$54.7M
$5.7M
$185.3M
Australia
USA
China
India
Total
Scenario 3 - Downside
Number
Conversion
Number
Conversion
Number
Conversion
Number
Conversion
Number
Conversion
Rate
Rate
Rate
Rate
Rate
Consideration lift
0.5%
0.8%
0.9%
0.9%
0.8%
Consider Visiting NZ in the next 3 years
7,
288,758
70.2% 80,
036,661
73.3% 76,
133,018
85.4% 27,
118,413
87.6%
190,576,849
79.5%
NZ a prferred Destination
6,
220,026
85.3% 68,
287,883
85.3% 75,
523,653
99.2% 26,
229,888
96.7%
176,261,450
92.5%
AC Population
4,
512,854
72.6% 50,
296,341
73.7% 62,
875,483
83.3% 14,
959,036
57.0%
132,643,713
75.3%
Holiday Arrivals - 12mths to Jan'25
586,
517
13.0% 244,
196
0.5% 182,
494
0.3%
24,
183
0.2%
1,
037,390
0.8%
Incremental Holiday Arrivals
4,
180
2,
720
1,
942
253
9,
095
Average Holiday Spend
3,
$ 801
5,
$ 637
7,
$ 039
5,
$ 654
$ 5,
093
Incremental Holiday Spend
$15.9M
$15.3M
$13.7M
$1.4M
$46.3M
(26/11/2025 10:16 am Project M Incremental Arrivals Scenarios)
Project M - Other useful numbers
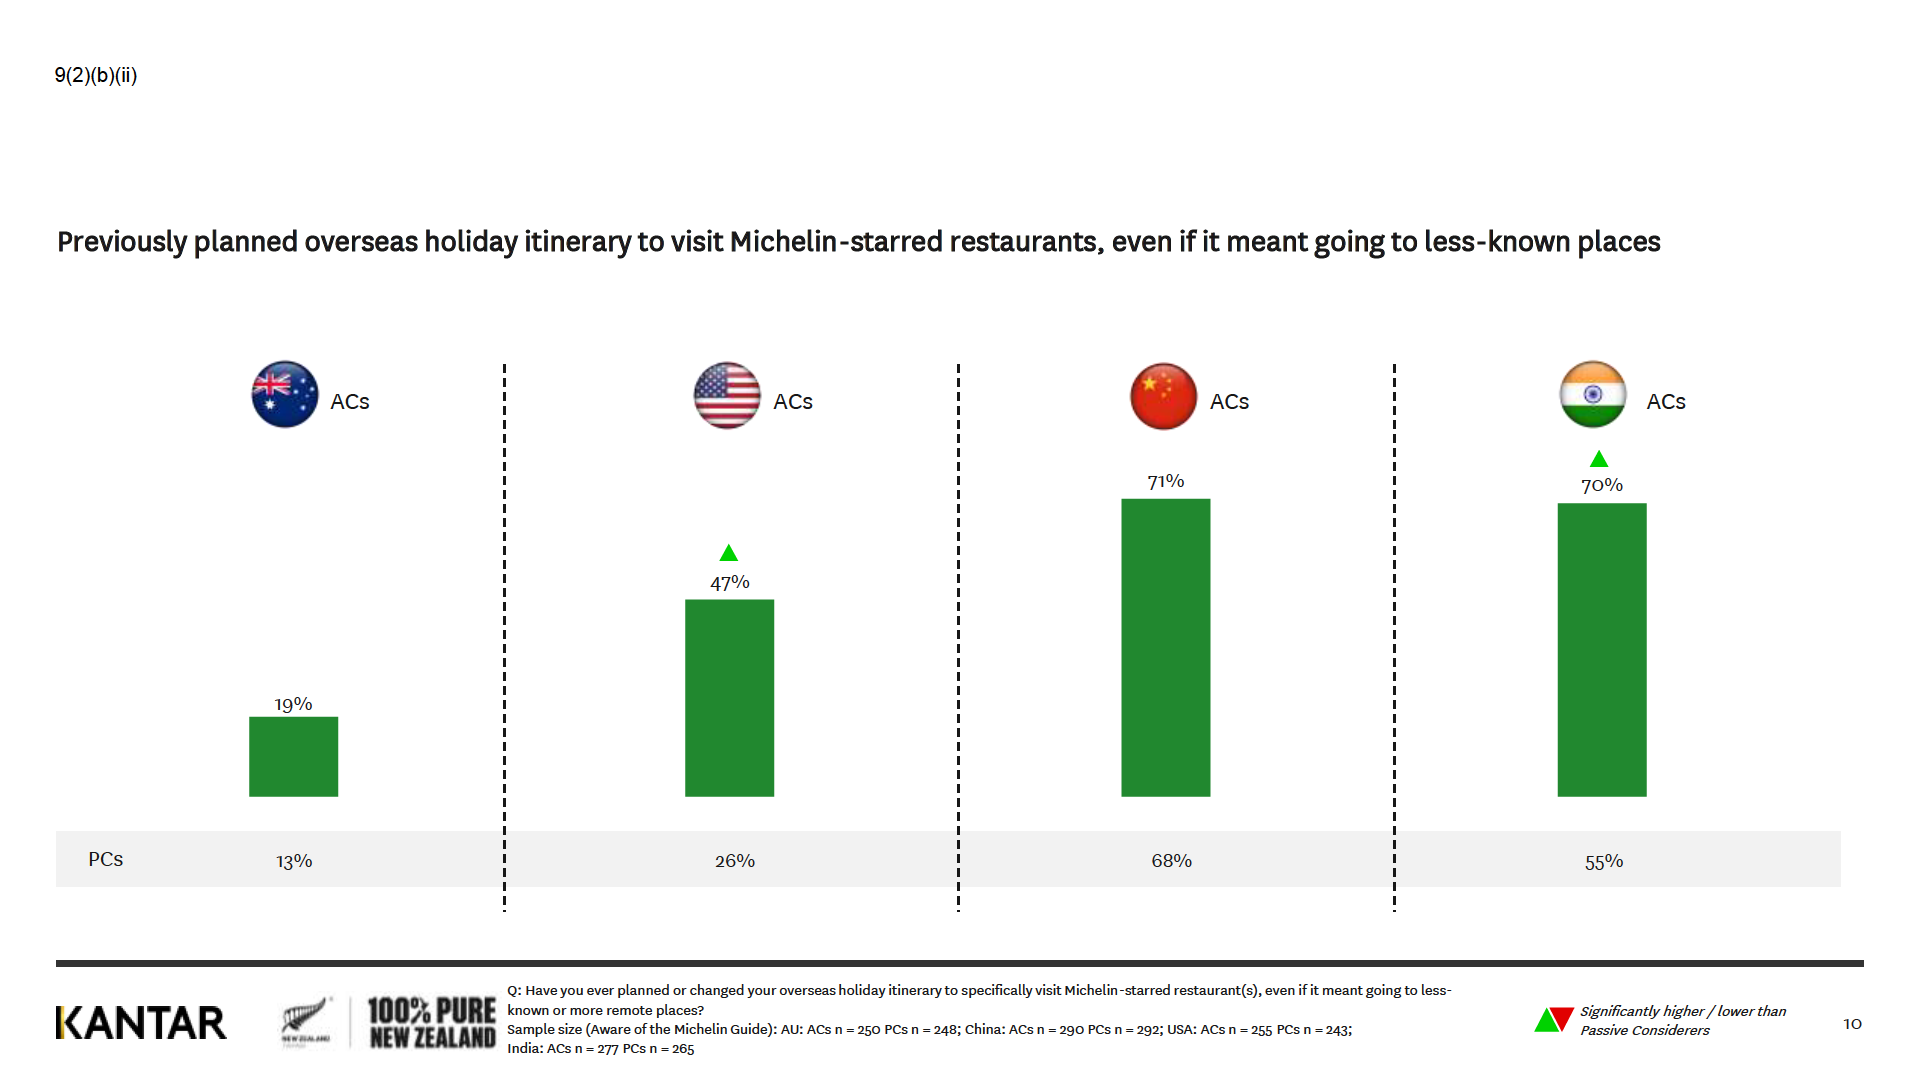
Country
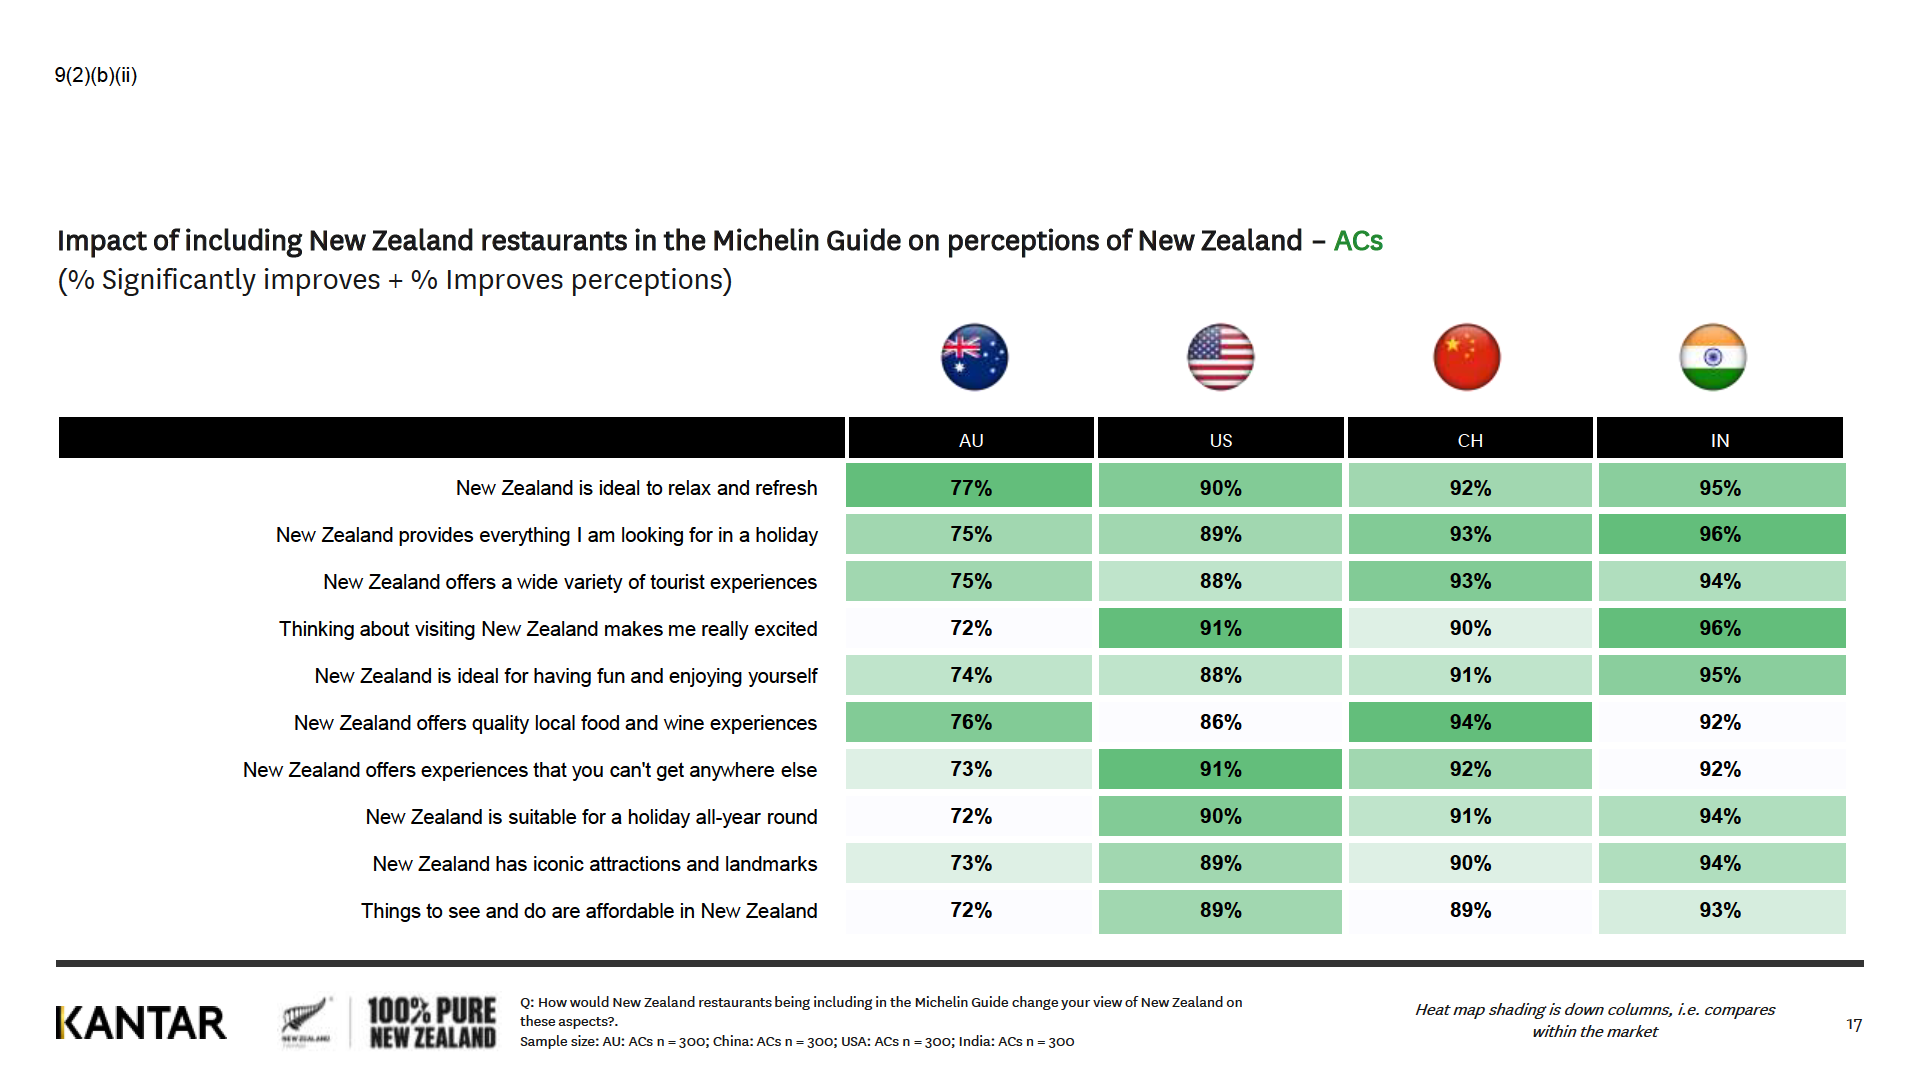
Visited a top end
Offers quality local food &
restaurant
wine experiences
(Holiday Visitors)
Australia
23%
71%
USA
33%
63%
China
41%
52%
India
21%
73%
Total
27%
63%
Source
IVS CY24
ACM Mar'25
Tourism Sattelite Account Mar'24
Domestic demand
International
Total
Total
Business and
Tourism
Product
demand
demand
supply
government demand
Household demand
product
ratio
$(million)
2024P
Food and beverage serving services
685
1,770
2,533
4,988
11,372
0.44
(26/11/2025 10:16 am Project M Incremental Arrivals Scenarios)
Document Outline