


983 ROUTE
BUS INFRASTRUCTURE
STAGE 3
A2415015.09
SAFE SYSTEM AUDIT
R001


DOCUMENT
CONTROL
RECORD
CLIENT
Auckland Transport
PROJECT
983 Route Bus Infrastructure SSA3
HG PROJECT NO.
A2415015.09
HG DOCUMENT NO.
R001
DOCUMENT
Stage 3 Safe Systems Audit
ISSUE AND
REVISION RECORD
DATE OF ISSUE
14 February 2025
STATUS
Final
ORIGINATOR
Sayed Omar
REVIEWED
Gary Black
APPROVED FOR ISSUE
Gary Black
OFFICE OF ORIGIN
Parnell
TELEPHONE
+64 9 917 5000
EMAIL
[email address]
HG PROJECT NO: A2415015.07
link to page 4 link to page 4 link to page 5 link to page 6 link to page 6 link to page 6 link to page 6 link to page 7 link to page 7 link to page 7 link to page 8 link to page 10 link to page 12 link to page 12 link to page 13 link to page 15 link to page 15 link to page 17 link to page 17 link to page 18 link to page 19 link to page 20 link to page 21 link to page 22
CONTENTS
1.0
SAFE SYSTEM AUDITING FOR TRANSPORT PROJECTS .................. 3
1.1
Safe System Audit Procedure .............................................................................. 3
1.2
Report Format ..................................................................................................... 4
2.0
SAFE SYSTEM AUDIT DETAILS ............................................................ 5
2.1
Type of Audit ....................................................................................................... 5
2.2
Audit Team .......................................................................................................... 5
2.3
Meetings and Site Inspections ............................................................................. 5
3.0
PROJECT DESCRIPTION....................................................................... 6
3.1
Project Background and Objective ...................................................................... 6
3.2
Existing Conditions and Context .......................................................................... 6
3.3
Proposed Works .................................................................................................. 7
3.4
Supplied Documents ........................................................................................... 9
4.0
ASSESSMENT OF SAFE SYSTEM ALIGNMENT ................................ 11
4.1
Project Design Safe System Assessment Summary ........................................... 11
4.2
Safe System Assessment Matrix – Existing Condition ....................................... 12
4.3
Safe System Assessment Matrix – Proposed Option (No Change from Existing)
........................................................................................................................... 14
5.0
SAFETY CONCERNS ........................................................................... 16
5.1
VisibilIty Obstructed Due to Trees Minor ..................................................... 16
5.2
Trees Overhanging Carriageway in Vicinity of New Bus Stop Minor .............. 17
5.3
Trip Hazard at Bus Stop Minor .................................................................. 18
5.4
Lighting Design Comment ................................................................................. 19
6.0
CONCLUSIONS .................................................................................... 20
7.0
SAFE SYSTEM AUDIT STATEMENT ................................................... 21
HG PROJECT NO: A2415015.07
1.0
SAFE SYSTEM AUDITING FOR TRANSPORT PROJECTS
A Safe System audit is an independent review of a transport project to identify any safety concerns that may affect the
safety performance and alignment to a Safe System. The audit team considers the safety of all road users and qualitatively
reports on road safety issues or opportunities for safety improvement.
A Safe System audit is therefore a formal examination of a transport project, or any type of project which affects road
users (including cyclists, pedestrians, mobility impaired etc), carried out by an independent competent team who identify
and document Safe System alignment and road safety concerns.
A Safe System audit is intended to help deliver a safe road system and is not a review of compliance with standards.
1.1
SAFE SYSTEM AUDIT PROCEDURE
The primary objective of a Safe System audit is to deliver a project that achieves an outcome consistent with the Safe
System approach, that is, minimisation of death and serious injury. The Safe System audit is a safety review used to
identify all areas of a project that are inconsistent with a safe system and bring those concerns to the attention of the
client in order that the client can make a value judgement as to appropriate action(s) based on the risk guidance provided
by the safety audit team.
The key objective
of a Safe System audit is summarised as:
To deliver completed projects that contribute towards a Safe System by identifying and ranking potential
safety concerns for all road users and others affected by a transport project.
A Safe System audit should be undertaken at project milestones such as:
•
Concept Stage (part of Business Case);
•
Scheme or Preliminary Design Stage (part of Pre-Implementation);
•
Detailed Design Stage (Pre-implementation / Implementation); and
•
Pre-Opening / Post-Construction Stage (Implementation / Post-Implementation).
A Safe System audit is not intended as a technical or financial audit and does not substitute for a design check on standards
or guidelines.
Any recommended treatment of an identified safety concern is intended to be indicative only, and to focus the design
team on the type of improvements that might be appropriate. It is not intended to be prescriptive and other ways of
improving the road safety or operational problems identified should also be considered.
In accordance with the procedures set down in the
“Waka Kotahi NZ Transport Agency Safe System Audit Guidelines” the
audit report should be submitted to the client who will instruct the design team to respond. The design team should
consider the report and comment to the client on each of any concerns identified, including their cost implications where
appropriate, and make a recommendation to either accept or reject the audit report recommendation.
For each audit team recommendation that is accepted, the client shall make the final decision and brief the design team
to make the necessary changes and/or additions. As a result of this instruction the design team shall action the approved
amendments. The client may involve a safety engineer to provide commentary to aid with the decision.
Decision tracking is an important part of the Safe System audit process. A decision tracking table is embedded into the
report format at the end of each set of recommendations to be completed by the design team, safety engineer and client
for each issue documenting the design team’s response, client decision and action taken.

A copy of the report including the design team’s response to the client and the client’s decision on each recommendation
shall be given to the Safe System audit team leader as part of the important feedback loop. The Safe System audit team
leader will disseminate this to team members.
1.2
REPORT FORMAT
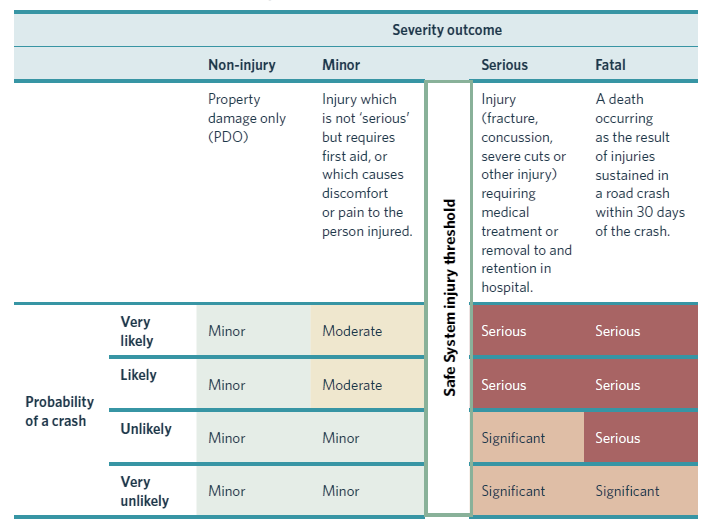
The potential road safety problems identified have been ranked as follows:-
The expected crash frequency is qualitatively assessed on the basis of expected exposure (how many road users will be
exposed to a safety issue) and the likelihood of a crash resulting from the presence of the issue. The severity of a crash
outcome is qualitatively assessed on the basis of factors such as expected speeds, type of collision, and type of vehicle
involved.
Reference to historic crash rates or other research for similar elements of projects, or projects as a whole, have been
drawn on where appropriate to assist in understanding the likely crash types, frequency and likely severity that may result
from a particular concern.
The frequency and severity ratings are used together to develop a combined qualitative risk ranking for each safety issue
using the Safety concern risk rating matrix below. The qualitative assessment requires professional judgement and a wide
range of experience in projects of all sizes and locations.
Figure 1: Safety concern risk rating matrix
2.0
SAFE SYSTEM AUDIT DETAILS
2.1
TYPE OF AUDIT
This is a Stage 3 – Detailed Design Safe System Audit (SSA).
No previous SSAs have been provided to the audit team.
2.2
AUDIT TEAM
The audit team was formed by the following Harrison Grierson Personnel:
•
Gary Black, BEng, CPEng, Transportation Manager, HG
•
Sayed Omar, MEngSt (Transportation) – Senior Transportation Engineer, HG
Both audit team members attended NZTA Safe Systems course. Neither person had an earlier involvement with this
project.
2.3
MEETINGS AND SITE INSPECTIONS
2.3.1
SITE INSPECTION
A site visit was carried out on 10 February 2025 between 13:00 and 15:00. The weather was sunny and dry during the
inspections.
3.0
PROJECT DESCRIPTION
3.1
PROJECT BACKGROUND AND OBJECTIVE
PROMPTS
COMMENTS
What is the reason for the project?
The purpose of the project is to improve safety and
update bus infrastructure in the suburb of Red Beach. The
facility upgrades include addition of new bus stops,
extension of concrete footpaths, bus signage and road
markings. Road markings on two intersections are also
being updated to improve safety.
Is there specific crash type risk?
The recorded crashes within the last 5 years do not show
any specific crash patterns at the study site. However,
there has been one serious (cyclist loss of control) and
one minor injury crashes (vehicle colliding with rear end
of parked car)
3.2
EXISTING CONDITIONS AND CONTEXT
PROMPTS
COMMENTS
What is the function of the road? Consider location,
The proposed changes occur on 3 roads, Taikura Ave, Tyler
roadside land use, area type, speed limit, intersection
Davis Dr and Kukuwai Ave. All 3 roads are currently
type, presence of parking, public transport services and
classified as local roads connecting new housing
vehicle flows. What traffic features exist nearby (e.g.
developments to supporting collector roads.
upstream and downstream)? What alternative routes
exist?
Kukuwai Ave is median separated while raised traffic islands
are present on Taikura Ave. Kukuwai and Taikura Ave also
have integrated cycle lanes.
A preschool exists on the northern end of Taikura Ave.
What is the speed environment? What is the current
The current speed limit is 50 km/h on Taikura and Kukuwai
speed limit? Has it changed recently? Is it similar to other
Ave as well as Tyler Davies Drive.
roads of this type? How does it compare to Safe System
speeds? What is the acceptability of lowering the speed
limit at this location?
What road users are present? Consider the presence of
The primary road users are general traffic and pedestrians
elderly pedestrians, school children and cyclists. Also note
which could include school children, their caregivers,
what facilities are available to vulnerable road users (e.g.
teachers, bus patrons, as well as a small number of
signalised crossings, bicycle lanes, school speed limits,
residents and service vehicles.
etc.)
Cyclists are likely to be present in the cycle lanes.
link to page 8
 PROMPTS
COMMENTS
PROMPTS
COMMENTS
What is the vehicle composition? Consider the presence of
The roads are predominantly by private cars, public
heavy vehicles (and what type), motorcyclists and other
transport buses and by very few heavy vehicles.
vehicles using the roadway.
3.3
PROPOSED WORKS
The project includes the following elements:
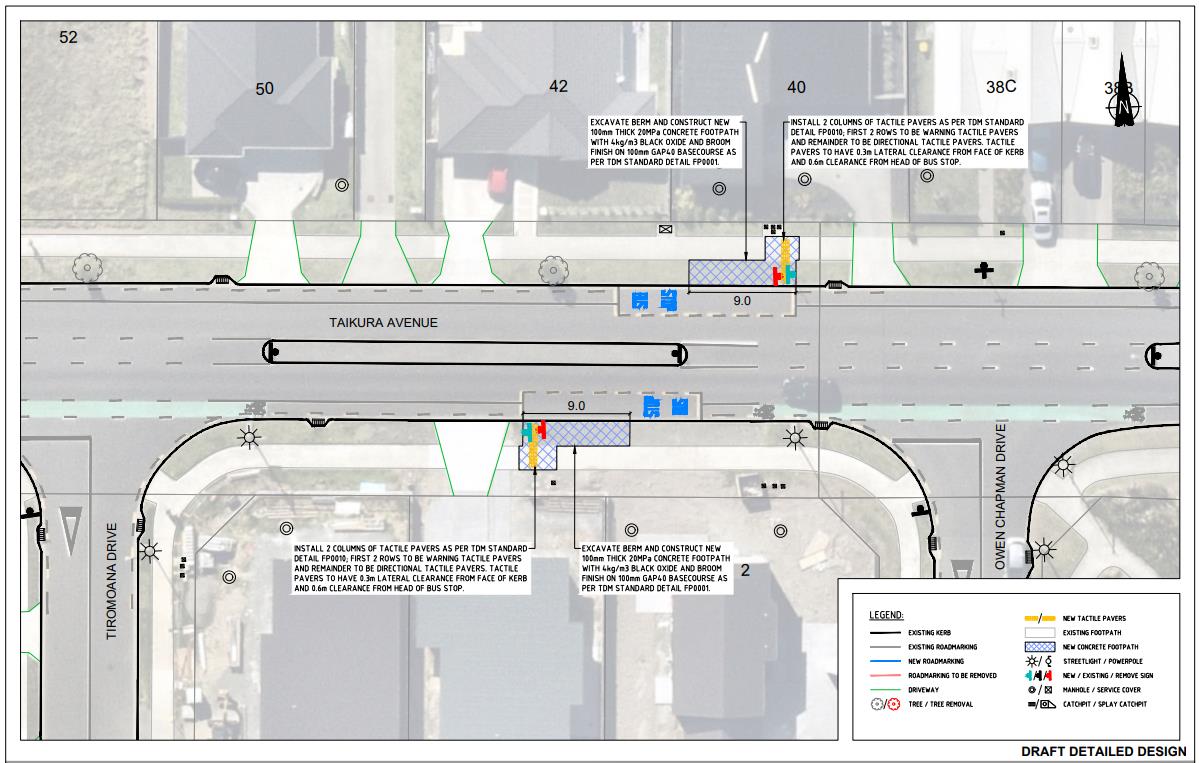
Taikura Avenue (Figure 2)
•
Reconstruction of berm and extension of footpath to accommodate bus stop and tactile pavers.
•
Update relevant bus stop road markings and move bus signage.
FIGURE 2: PROPOSED CHANGES TO TAIKURA AVENUE
Tyler Davies Drive/Taikura Avenue Intersection (Figure 3)
•
Addition of median at intersection.
•
Provision of new bus stops on northern and eastern side of intersection with relevant bus infrastructure and
marking updates.
•
Relocation of streetlights at bus stops.
•
Addition of NSAAT lines around intersection and bus stops.
•
Removal of the bus stop on northern approach of the intersection.
link to page 9
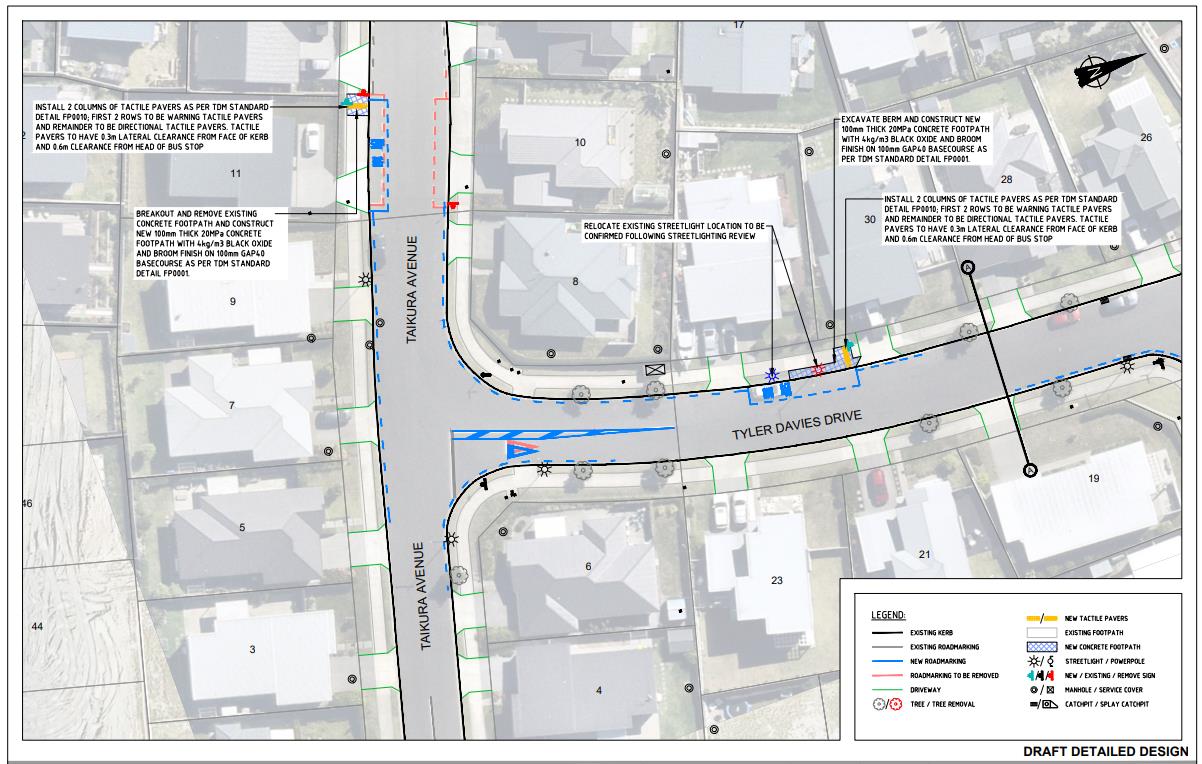
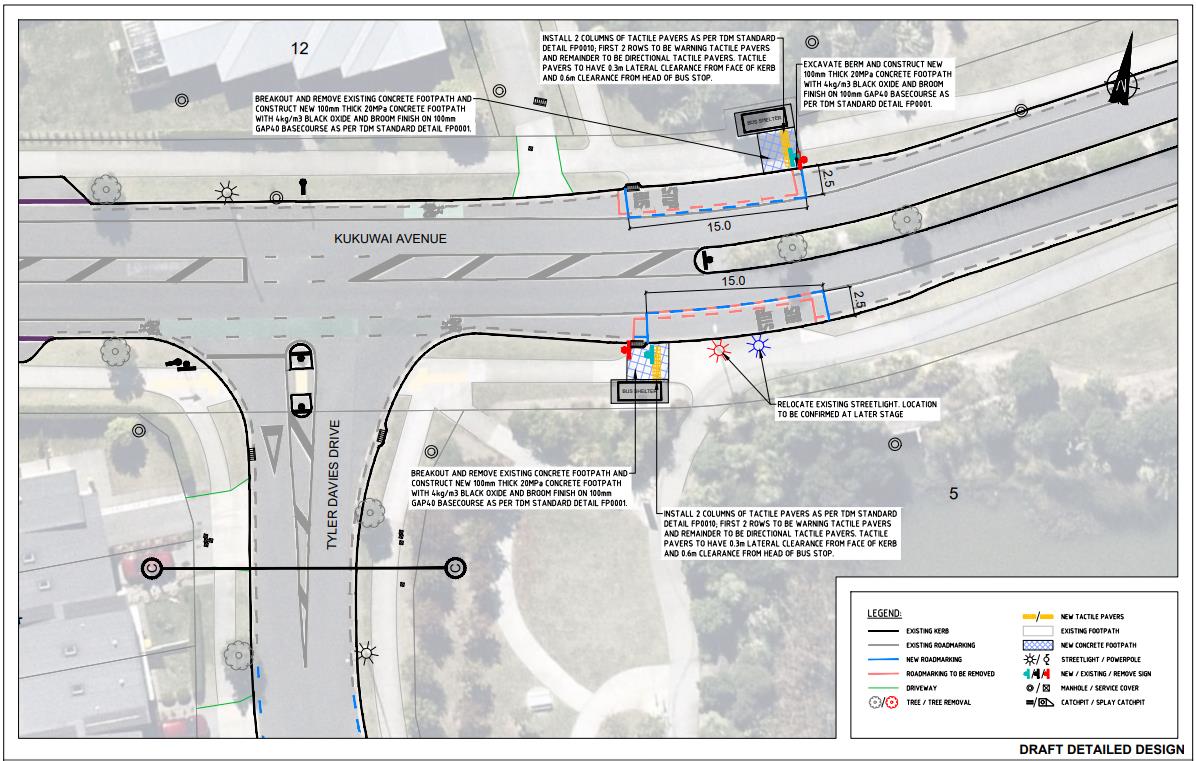
FIGURE 3: PROPOSED CHANGES TO TYLER DAVIES DRIVE/TAIKURA AVENUE INTERSECTION
Kukuwai Avenue (Figure 4)
•
Extension of concrete footpath around bus shelter to accommodate new tactile pavers.
•
Repainting of bus stop markings.
•
Relocation of a streetlight.
FIGURE 4: PROPOSED CHANGES TO KUKUWAI AVENUE
link to page 10
3.4
SUPPLIED DOCUMENTS
Table 1 lists the drawings, prepared by Traffic Engineering Solutions (TES) dated February 2025, which have been
provided for this audit.
TABLE 1: SUPPLIED DOCUMENTS
DRAWING NUMBER AND REVISION
TITLE
T24142- R1 – 001 - A
40 & 41 TAIKURA AVENUE LAYOUT PLAN WITH CRITICAL
DIMENSIONS
T24142- R1 – 002 - A
11 TAIKURA AVE & 30 TYLER DAVIES DR LAYOUT PLAN WITH
CRITICAL DIMENSIONS
T24142- R1 – 005 - A
5 & 6 KUKUWAI AVENUE LAYOUT PLAN WITH CRITICAL
DIMENSIONS
T24142- R2 – 001 - A
40 & 41 TAIKURA AVENUE ROADMARKING AND SIGNAGE
PLAN
T24142- R2 – 002 - A
11 TAIKURA AVE & 30 TYLER DAVIES DR ROADMARKING AND
SIGNAGE PLAN
T24142- R2 – 003 - A
TYLER DAVIES DRIVE ROAD MARKINGS ROADMARKING AND
SIGNAGE PLAN
T24142- R2 – 004 - A
TYLER DAVIES DRIVE ROAD MARKINGS ROADMARKING AND
SIGNAGE PLAN
T24142- R2 – 005 - A
5 & 6 KUKUWAI AVENUE ROADMARKING AND SIGNAGE PLAN
T24142- R5 – 001 - A
STANDARD ENGINEERING DETAILS
T24142- 002-T1 - A
TAIKURA AVENUE & TYLER DAVIES DRIVE TRACKING PLAN
T24142- 002-T2 - A
TAIKURA AVENUE AND TYLER DAVIES DRIVE TRACKING PLAN
T24142- 003-T1 - A
TYLER DAVIES DRIVE TRACKING PLAN
T24142- 003-T2 - A
TYLER DAVIES DRIVE TRACKING PLAN
T24142- 004-T1 - A
TYLER DAVIES DRIVE TRACKING PLAN
T24142- 004-T2 - A
TYLER DAVIES DRIVE TRACKING PLAN
T24142- 003-V1 - A
TYLER DAVIES DRIVE & LEGGETT LANE VISIBILITY PLAN
T24142- 003-V2 - A
TYLER DAVIES DRIVE & IRON LANE VISIBILITY PLAN
T24142- 004-V1 - A
TYLER DAVIES DR & COULDREY CRES VISIBILITY PLAN
T24142- 004-V2 - A
TYLER DAVIES DRIVE & ONEKURA STREET VISIBILITY PLAN
DRAWING NUMBER AND REVISION
TITLE
T24142- I-002 - A
TAIKURA AVENUE & TYLER DAVIES DRIVE UTILITY SERVICES
PLAN
T24142- I-005 - A
KUKUWAI AVENUE & TYLER DAVIES DRIVE UTILITY SERVICES
PLAN
4.0
ASSESSMENT OF SAFE SYSTEM ALIGNMENT
4.1
PROJECT DESIGN SAFE SYSTEM ASSESSMENT SUMMARY
The Safe System Assessment Matrix scores for the existing condition and the proposed design option (detailed design)
are shown below in Table 2.
The traffic volumes taken into consideration are between 1,000 and 5,000 vehicles per day.
The scores for each crash type are shown in Table 2. The detailed assessments are presented in Section 4.2. Due to the
nature of the work the SSA score is the same for both the existing and proposed option.
TABLE 2: SAFE SYSTEM ASSESSMENT SCORE SUMMARY TABLE
OPTION
SCORE
Existing Condition
20 / 448
Proposed Option
20 / 448
4.2
SAFE SYSTEM ASSESSMENT MATRIX – EXISTING CONDITION
RUN-OFF ROAD
HEAD-ON
INTERSECTION
OTHER
PEDESTRIAN
CYCLIST
MOTORCYCLISTS
Total volume of vehicles
Total volume of vehicles
Total volume of vehicles
Total volume of vehicles
Number of pedestrians:
Number of cyclists: Cyclist
Motorcyclists can be
(AADT) using the roads
(AADT) using the roads
(AADT) using the roads
(AADT) using the roads
Pedestrian volumes are
volumes are expected to
assumed to be 1% of total
between 1,000 and 5,000
between 1,000 and 5,000
between 1,000 and 5,000
between 1,000 and 5,000
expected to be between
be between 10 and 50
AADT: between 10 and 50
Exposure Comments:
vehicles per day
vehicles per day
vehicles per day
vehicles per day
50 and 100.
people a day
motorcyclists are expected
in this area.
2/4
2/4
2/4
0/4
3/4
2/4
2/4
Exposure Score:
Factors that increase the
Factors that increase the
Factors that increase the
Factors that increase the
Factors that increase the
Factors that increase the
Factors that increase the
likelihood include:
likelihood include:
likelihood include:
likelihood include:
likelihood include:
likelihood include:
likelihood include:
• N/A
• None
• Bus stops requiring
• Large radius bellmouth
•
Factors that decrease the
• None
No cycle lanes
• Kerbside parking
cars to pass on the
at Taikura Avenue and
• Kerbside parking
Factors that decrease the
likelihood include:
outside of a bus at the
Tyler Davies drive
Factors that decrease the
Factors that decrease the
•
likelihood include:
N/A
bus stop.
intersection
likelihood include:
Factors that decrease the
likelihood include:
• Residential low -speed
•
•
Existing street trees
None
likelihood include:
Likelihood Comments:
•
environment
Factors that decrease the
Residential low-speed
restricting visibility to
• Residential low-speed
likelihood include:
environment
approaching cars
environment
• Residential low- speed
environment
Factors that decrease the
likelihood include:
• None.
1/4
1/4
1/4
0/4
1/4
1/4
1/4
Likelihood Score:
Factors that increase the
Factors that increase the
Factors that increase the
Factors that increase the
Factors that increase the
Factors that increase the
Factors that increase the
severity include:
severity include:
severity include:
severity include:
severity include:
severity include:
severity include:
• None
• Roadside hazards such
• None
Factors that decrease the
• N/A
• None
• None
•
as parked cars
Fallen riders may strike a
severity include:
Factors that decrease the
Factors that decrease the
Factors that decrease the
Factors that decrease the
roadside hazard – parked
•
Factors that decrease the
severity include:
None
severity include:
severity include:
severity include:
cars
severity include:
• None
• N/A
• Residential low -speed
Severity Comments:
•
•
Residential low -speed
environment
Residential low -speed
Factors that decrease the
environment
environment
severity include:
• Residential low -speed
environment
1/4
1/4
1/4
0/4
1/4
2/4
2/4
Severity Score:
2/64
2/64
2/64
0/64
3/64
4/64
4/64
Product
TOTAL
17/448
4.3
SAFE SYSTEM ASSESSMENT MATRIX – PROPOSED OPTION (NO CHANGE FROM EXISTING)
RUN-OFF ROAD
HEAD-ON
INTERSECTION
OTHER
PEDESTRIAN
CYCLIST
MOTORCYCLISTS
Total volume of vehicles
Total volume of vehicles
Total volume of vehicles
Total volume of vehicles
Number of pedestrians:
Number of cyclists: Cyclist
Motorcyclists can be
(AADT) using the roads
(AADT) using the roads
(AADT) using the roads
(AADT) using the roads
Pedestrian volumes are
volumes are expected to
assumed to be 1% of total
between 1,000 and 5,000
between 1,000 and 5,000
between 1,000 and 5,000
between 1,000 and 5,000
expected to be between
be between 10 and 50
AADT: between 10 and 50
Exposure Comments:
vehicles per day
vehicles per day
vehicles per day
vehicles per day
50 and 100.
people a day
motorcyclists are expected
in this area.
2/4
2/4
2/4
0/4
3/4
2/4
2/4
Exposure Score:
Factors that increase the
Factors that increase the
Factors that increase the
Factors that increase the
Factors that increase the
Factors that increase the
Factors that increase the
likelihood include:
likelihood include:
likelihood include:
likelihood include:
likelihood include:
likelihood include:
likelihood include:
• N/A
• None
• Bus stops requiring
• Large radius bellmouth
•
Factors that decrease the
• None
No cycle lanes
• Kerbside parking
cars to pass on the
at Taikura Avenue and
• Kerbside parking
Factors that decrease the
likelihood include:
outside of a bus at the
Tyler Davies drive
Factors that decrease the
Factors that decrease the
•
likelihood include:
N/A
bus stop.
intersection
likelihood include:
Factors that decrease the
likelihood include:
• Residential low -speed
•
•
Existing street trees
None
likelihood include:
Likelihood Comments:
•
environment
Factors that decrease the
Residential low-speed
restricting visibility to
• Residential low-speed
likelihood include:
environment
approaching cars
environment
• Residential low- speed
environment
Factors that decrease the
likelihood include:
• None.
1/4
1/4
1/4
0/4
1/4
1/4
1/4
Likelihood Score:
Factors that increase the
Factors that increase the
Factors that increase the
Factors that increase the
Factors that increase the
Factors that increase the
Factors that increase the
severity include:
severity include:
severity include:
severity include:
severity include:
severity include:
severity include:
• None
• Roadside hazards such
• None
Factors that decrease the
• N/A
• None
• None
•
as parked cars
Fallen riders may strike a
Factors that decrease the
severity include:
Factors that decrease the
Factors that decrease the
Factors that decrease the
roadside hazard – parked
•
Factors that decrease the
severity include:
None
severity include:
severity include:
severity include:
cars
severity include:
• None
• N/A
• Residential low -speed
Severity Comments:
•
•
Residential low -speed
environment
Residential low -speed
Factors that decrease the
environment
environment
severity include:
• Residential low -speed
environment
1/4
1/4
1/4
0/4
1/4
2/4
2/4
Severity Score:
2/64
2/64
2/64
0/64
3/64
4/64
4/64
Product
TOTAL
17/448
5.0 SAFETY CONCERNS
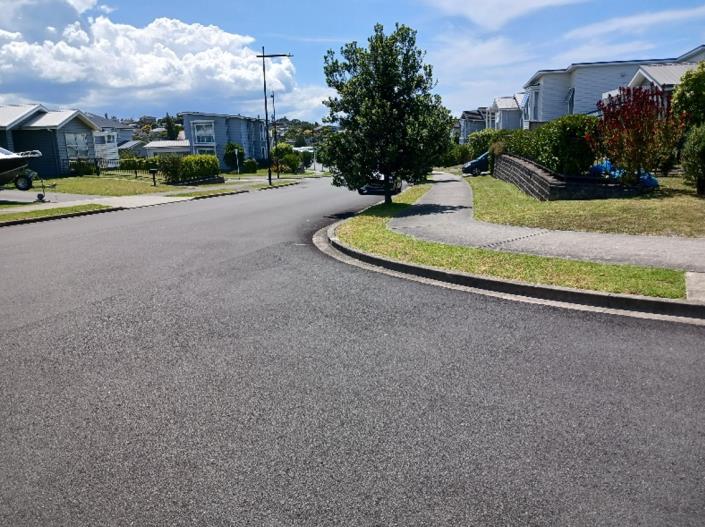
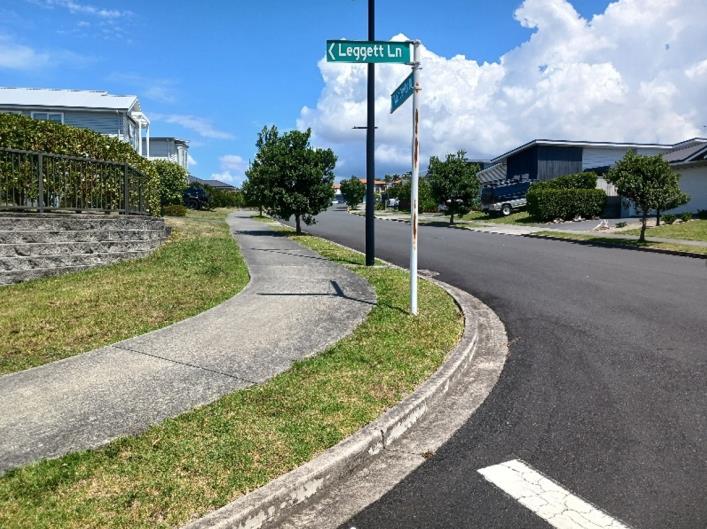
5.1
VISIBILITY OBSTRUCTED DUE TO TREES
MINOR
A check at the following intersections identified three trees either limiting or obscuring visibility towards cars approaching
the intersection at the following locations:
•
Tyler Davis Avenue and Leggett Lane Intersection, looking left and right
•
Tyler Davis Avenue, Onekura Street and Couldrey Crescent Intersection, looking right from Onekura Street
The SSAT acknowledges this is an existing situation.
FIGURE 5: LEGGETT LANE LOOKING RIGHT
FIGURE 6: LEGGETT LANE LOOKING LEFT
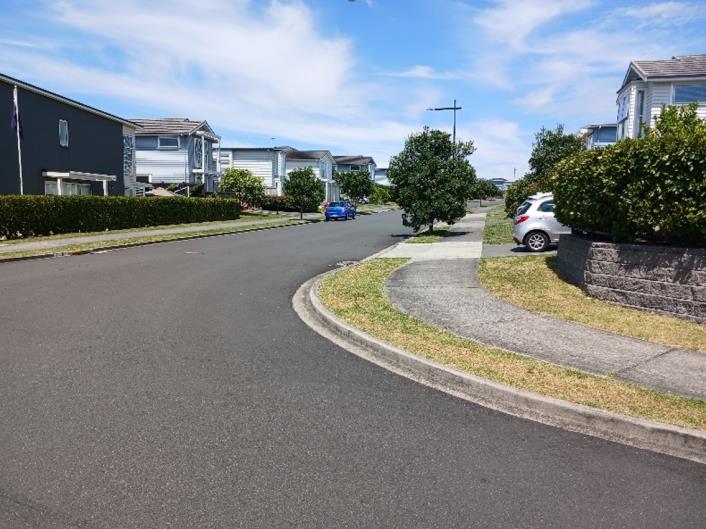
FIGURE 7: ONEKURA STREET LOOKING RIGHT
Recommendation
Consider trimming of the trees to improve visibility.
PROBABILITY RATING:
SEVERITY OUTCOME RATING:
CRASHES ARE LIKELY TO BE UNLIKELY
DEATH OR SERIOUS INJURY IS MINOR
Design Team Response: This is considered outside the scope of works. AT Project Manager to decide if additional
pruning can be taken on as part of this project.
Safety Engineer: Agree with SAT, project team may consider limbing up trees and trimming to improve visibility as
part of project works. Otherwise refer to maintenance.
Client Decision:
Click here to enter text.
Action Taken:
Click here to enter text.
5.2
TREES OVERHANGING CARRIAGEWAY IN VICINITY OF NEW BUS STOP
MINOR
A new bus stop is shown on Tyler Davis Drive and there is a tree located 11m in advance of the bus stop markings which
has branches overhanging the carriageway. There is a risk that the trees could impede the buses from safely entering the
bus stop markings, or the buses colliding with the trees.
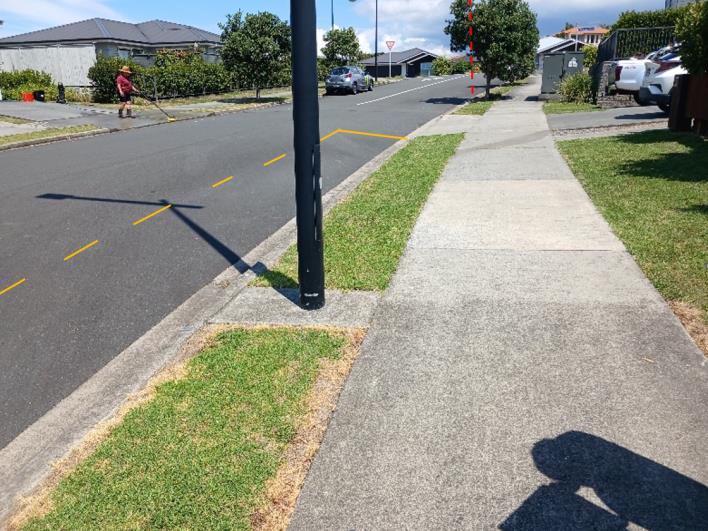
FIGURE 8: OVERHANGING TREE IN CARRIAGEWAY
Recommendation
Consider trimming of trees to improve safety
PROBABILITY RATING:
SEVERITY OUTCOME RATING:
CRASHES ARE LIKELY TO BE UNLIKELY
DEATH OR SERIOUS INJURY IS MINOR
Design Team Response: The tree is positioned near the start of the entry taper into the bus stop where buses
typically start moving towards the kerb. AT Project Manager to liaise with the arborist to confirm whether pruning at
this location can be done as paret of this scope of works.
Safety Engineer: Agree this a minor concern. Designer should review the bus tracking and consider vegetation
trimming as necessary.
Client Decision:
Click here to enter text.
Action Taken:
Click here to enter text.
5.3
TRIP HAZARD AT BUS STOP
MINOR
There is a minor trip hazard in the footpath near to the bus shelter on Kukuwai Avenue, northern side. See Figure 9.
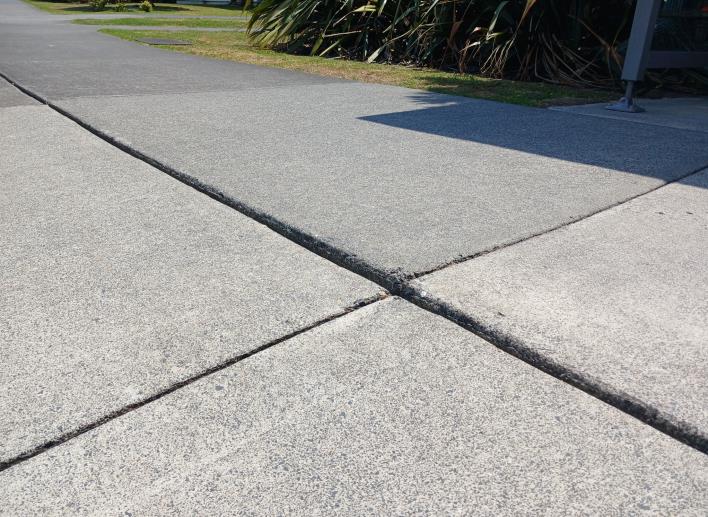
FIGURE 9: EXISTING TRIP HAZARD
Recommendation
Remove trip hazard as part of the construction works.
PROBABILITY RATING:
SEVERITY OUTCOME RATING:
CRASHES ARE LIKELY TO BE UNLIKELY
DEATH OR SERIOUS INJURY IS MINOR
Design Team Response: Agree, reinstating the concrete footpath to remove the hazard could be undertaken as part
this project, particularly as we are reinstating footpath at this location.
Safety Engineer: Agree with SAT and the difference in level presents a tripping hazard and appears to be within the
project extents. As a minimum consider concrete grinding to level off and make smooth the abrupt level difference.
Recommend Designer consider options to remove tripping hazards within project extents.
Client Decision:
Click here to enter text.
Action Taken:
Click here to enter text.
5.4
LIGHTING DESIGN
COMMENT
No lighting design plans were provided. If required, we assume that the lighting design will be carried out by a lighting
design engineer and peer reviewed accordingly.
6.0
CONCLUSIONS
The detailed design review of the passenger transport facilities in the vicinity of the project highlights three minor issues
to be reviewed and addressed to ensure safety of all road users. Concerns include visibility at intersections due to existing
trees (an existing situation), overhanging trees on the approach to a new bus stop and a trip hazard in the footpath (an
existing situation).


7.0 SAFE SYSTEM AUDIT STATEMENT
We certify that we have used the available plans, and have examined the specified roads and streets to assess the Safe
System alignment and identified any safety concerns that could be changed, removed or modified in order to improve
road safety outcomes. The safety concerns identified have been noted in this report.
Signed: ……………………………………………………………….. Date: 14/02/2025
Sayed Omar, MEngSt (Transportation)
Senior Transportation Engineer, Harrison Grierson
Signed: ……………………………………………………………… Date: 14/02/2025
Gary Black, Beng, CPEng,
Transportation Manager, Harrison Grierson
Design Team:
Name…Matthew Arnerich…………
Position…Principal Transportation Engineer
Signature………………………………..
Date…19/02/2025…………….
Safety Engineer: Name : Vaughn Scott MEngSt (Hons) Position : Senior Transportation Engineer.
Signature…
Date…20/02/2025
Project Manager: Name……………………………………
Position………………………..
Signature………………………………..
Date…………………………….
Action Completed: Name……………………………………
Position………………………..
Signature………………………………..
Date…………………………….
Project Manager to distribute audit report incorporating decision to design team, Safety Audit Team Leader, Safety Engineer
and project file.
Date: ……………………