Scenario 1; High Infill, Low Greenfields (Indicated preferred option):
■
No Southern Growth Area
■
No Gillespies.
Scenario 2; Low Infill, High Greenfields:
■
Half (approximately) the infill rate of Scenario 1
■
All greenfield developments included.
Scenario 3; Low Infill, High Greenfields:
■
Identical to Scenario 2, but St Pats & Southern Growth Area start development 4 years earlier.
Table 1: Dwelling assumptions by key development area and Scenario
Greenfield
Capacities:
Scenario 1
Scenario 1
Scenario 2
Scenario 2
Scenario 3
Scenario 3
Projects:
Start Year
End Year
Start Year
End Year
Start Year
End Year
Trentham
860
2028
2032
2028
2032
2028
2032
PDA
St Patricks
600
2030
2037
2030
2037
2026
2033
Kingsley
250
2032
2036
2032
2036
2032
2036
Heights
Canon Point
400
2029
2036
2029
2036
2029
2036
Gabites
220
2025
2034
2025
2034
2025
2034
Southern
1500
x
x
2030
2053
2026
2049
Growth Area
Gillespies
1000
x
x
2034
2053
2034
2053
Dwelling Assumptions by Scenario
9000
8000
7000
6000
5000
Dwellings
4000
3000
2000
1000
0
2033
2033
2033
2043
2043
2043
2053
2053
2053
Scenario Scenario Scenario Scenario Scenario Scenario Scenario Scenario Scenario
1
2
3
1
2
3
1
2
3
Infill
Greenfield
Figure 1: Dwelling assumptions over time, by Scenario
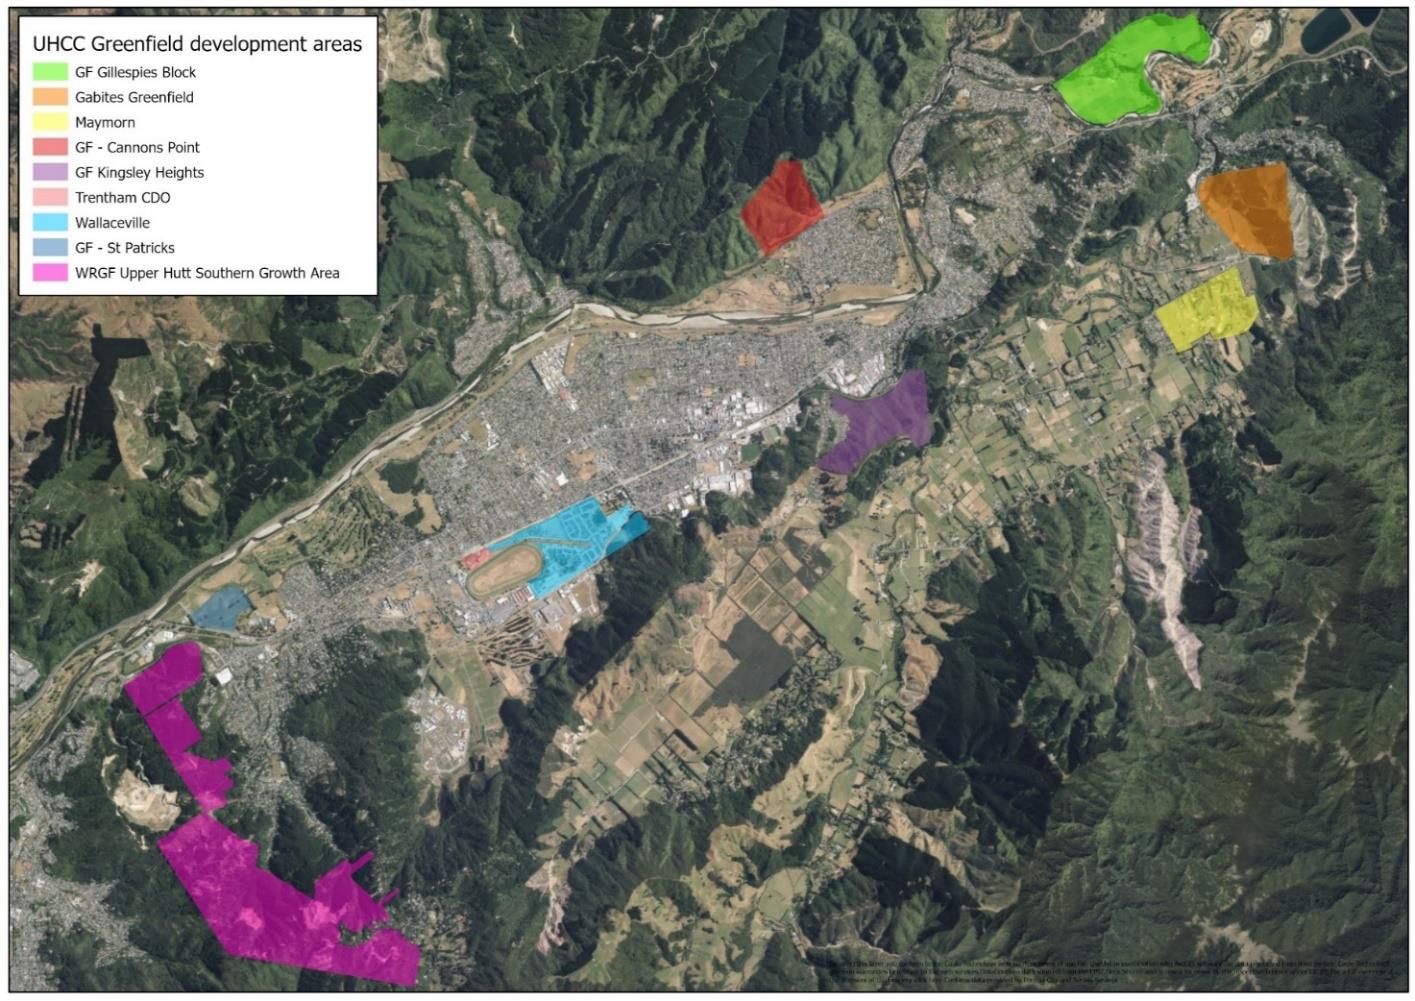
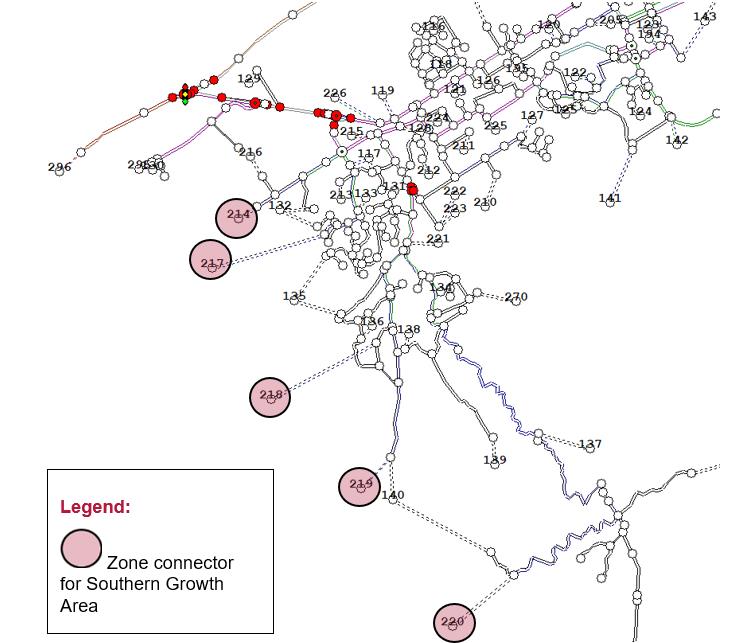 Figure 2: Growth locations
Figure 3: TRACKS model network, showing zone connectors for Southern Growth Area
Figure 2: Growth locations
Figure 3: TRACKS model network, showing zone connectors for Southern Growth Area