 technical note
PROJECT
WAITEMATĀ HARBOUR WALKING AND CYCLING CONNECTION
DEMAND AND ECONOMIC BENEFITS ASSESSMENT OF FERRY AND BUS
SUBJECT
OPTIONS
technical note
PROJECT
WAITEMATĀ HARBOUR WALKING AND CYCLING CONNECTION
DEMAND AND ECONOMIC BENEFITS ASSESSMENT OF FERRY AND BUS
SUBJECT
OPTIONS
Out of scope
(WAKA KOTAHI), Section 9(2)(a)
TO
(COMMUTE)
FROM
Section 9(2)(a)
REVIEWED BY
Section 9(2)(a)
DATE
18 FEBRUARY 2022 (UPDATED 22 MARCH 2022)
Flow Transportation Specialists (Flow) has been commissioned by Waka Kotahi the New Zealand
Transport Agency (Waka Kotahi) to assess a number of walking and cycling connection options across
Auckland’s Waitematā Harbour. Our assessment has focused on
each option’s potential for cycling trips across the harbour
each option’s economic benefits
benefit cost ratio, for select options.
The options being investigated include 3 potential new ferry/bus connections, 2 options that improve
existing ferry services, in addition to 1 option that makes use of the existing Auckland Harbour Bridge
(AHB). Each of these investment options would better link the lower North Shore to central Auckland,
connecting Waka Kotahi’s proposed Northern Pathway walking and cycling path to the city centre. The
need for these connections has arisen since the previous proposal of a dedicated walking and cycling
bridge across the Waitematā Harbour is no longer being considered.
Importantly, our assessment has focused on the potential for each investment option to cater to cycling
trips. Our assessment does not consider the impacts each option may have on public transport trips1.
1 THE FERRY AND BUS OPTIONS ASSESSED
under the Official Information Act 1982
Our assessment has considered 6 walking and cycling connection options provided by Waka Kotahi. Each
of the 6 connection options includes the Akoranga to Sulphur Point section of Northern Pathway, in
addition to a new or improved connection across the Waitematā Harbour
Option 2F: a new ferry service between Sulphur Point (the southern extent of Waka Kotahi’s
proposed Northern Pathway) and Westhaven
Option 2G: a new ferry service between Sulphur Point and North Wharf in the Wynyard Quarter
Released
1 Each of the 5 bus/ferry investment options may result in changes to the number of people walking, driving and/or
busing to the ferry/bus terminals.

2
Option 2H: increased frequencies of the existing Northcote to Downtown ferry service, as well as
improved cycle-ferry transfer facilities
Option 3D: increased frequencies of the existing Devonport to Downtown ferry service, as well as
improved cycle-ferry transfer facilities
Option 5E: a new bus service between the toll plaza on the Northern Motorway (close to the
southern extent of Waka Kotahi’s proposed Northern Pathway) and the Shelly Beach Road/Curran
Street ramps (assumed to turn around via Onewa Road and Jervois Road)
1982
Option AHB: a new shared use path across the existing Auckland Harbour Bridge (AHB). Space for
this facility is expected to be made by removing one or more traffic lane on the bridge. The
resulting shared path is expected to be in the order of 3 m wide, which is relatively narrow given
Act
the level of demand anticipated. This width, and the proximity to motorway traffic, will have an
impact on the quality of service provided to users, and on the capacity of the path.
2 HOW WE HAVE ASSESSED THE OPTIONS
We have used the Auckland Cycle Model (ACM) to estimate cross-harbour cycling trips for each of the
options. The ACM estimates future cycling and e-bike demands, and responds to anticipated future
changes in
Information
Infrastructure – the ACM recognises that people are more likely to ride bikes and e-bikes if quality
cycle infrastructure is provided along their route
Future e-bike uptake – the ACM assumes that over time, the accessibility of e-bikes will increase,
giving more people the option to cycle more often, and greater distances
Trip characteristics – the ACM recognises that shorter trips are more likely to be carried out on a
Official
bike, as are trips to work and school, and trips without steep gradients
The underlying demand for travel – the ACM is informed by the regional transport model, being
the
Auckland’s Macro Strategic Model (MSM)
Land use growth – the ACM is informed by Auckland Council’s land use forecasts.
We have assessed each of the 6 options by considering the “generalised cost” of cross harbour cycling
trips with each option. Generalised costs sum the monetised and non-monetised costs of a journey, and
under
include the financial cost (fare) for the journey, waiting time, loading/unloading time, the actual journey
time, as well as a “transfer penalty”. The transfer penalty is a perceived time penalty due to the
inconvenience of transferring between modes. The ACM uses time as a measure of generalised costs,
with monetised costs converted to time using standard Waka Kotahi values of time2.
The financial fare of each trip is the most significant component of the generalised cost, accounting for
around 50%-70% of the total for each bus or ferry connection option. This is because our default
assessment assumes the current ferry and bus fares would apply to the new/improved services: $5.66
Released
2 We have applied a weighted average of Waka Kotahi’s standard values of time for cyclists of $12.52/hour, based on
80% commuting to work ($6.60/hr), 10% work travel purposes ($21.70/hr) and 10% other ($4.25/hr), and the December
2021 update factor of 1.59 (Monetised Benefits and Costs Manual, table 13)
1982
Act
Information
Official
the
under
Released

4
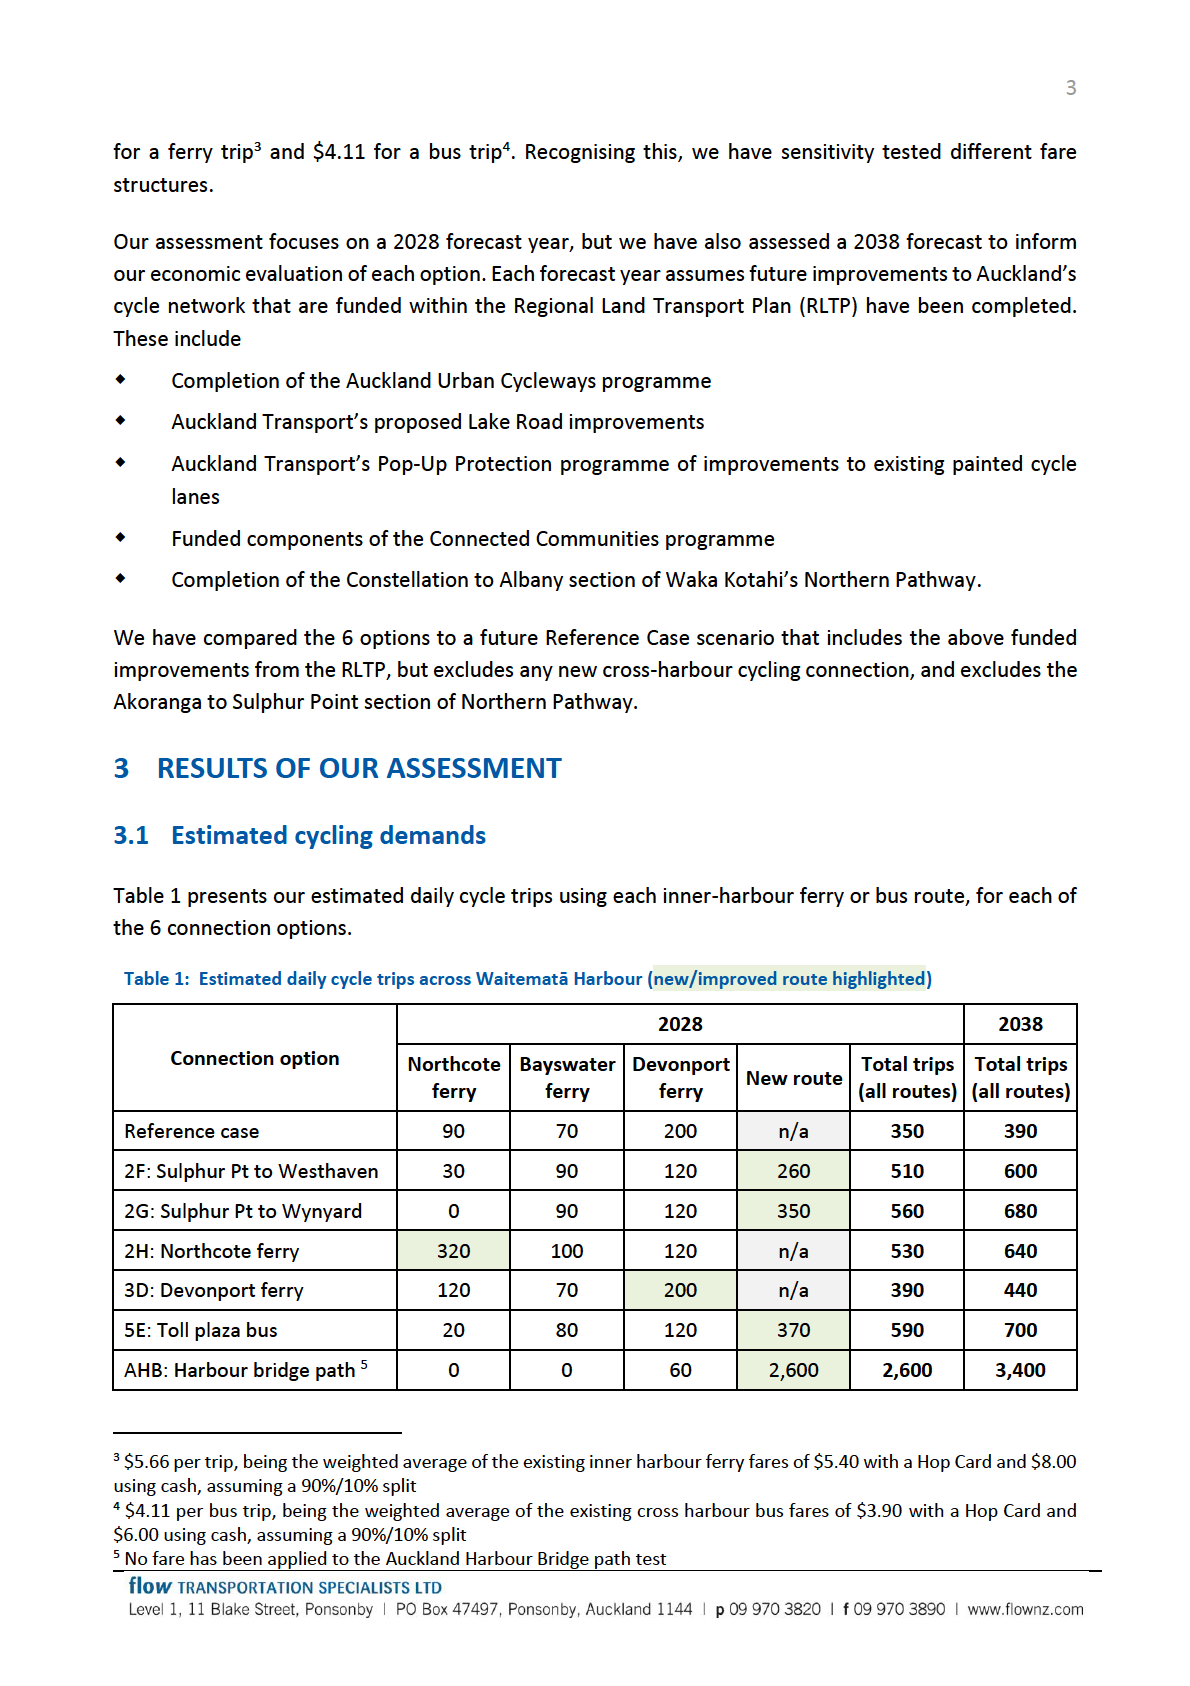
Four of the investment options (2F, 2G, 2H and 5E) are predicted to result in very comparable outcomes,
with 510-590 daily cycle trips across the harbour in 2028. Option 3D however (improvements to the
Devonport ferry terminal and services), is not predicted to result in any significant increase in cyclists
using the Devonport ferry. A small increase in cyclists using the Northcote ferry is predicted however –
a result of the improved connections to this ferry terminal provided by the Akoranga to Sulphur Point
section of Northern Pathway.
Our assessment of each option has relied on a series of assumptions for each cross-harbour connection
1982
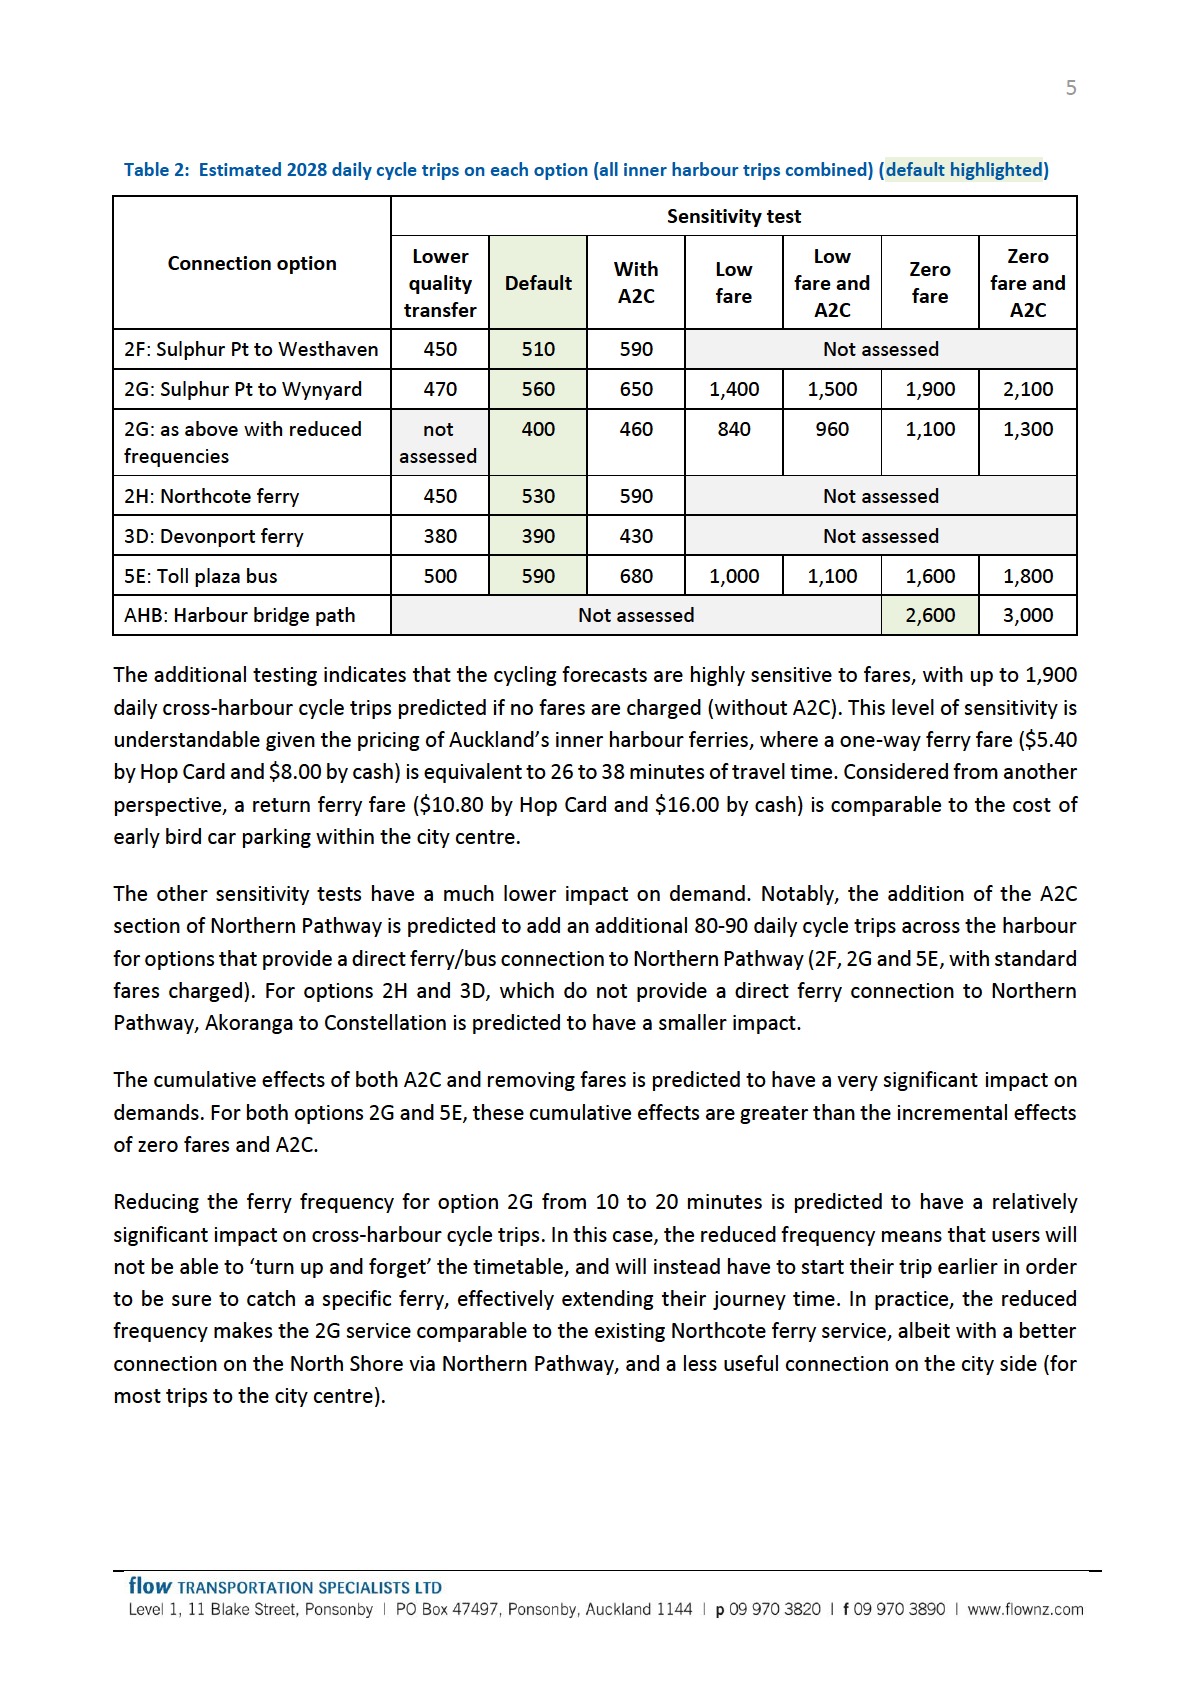
option. We have sensitivity tested some of those key assumptions, including
A lower quality transfer: the default assessment assumes a seamless integration between cycle
and ferry, at a purpose built facility. This test considers the effects of a lower standard of transfer
Act
facility
Akoranga to Constellation (A2C): the default assessment includes the Akoranga to Sulphur Point
section of Northern Pathway with each new connection option, but not the onward connection
from A2C. This sensitivity test considers the impact of including this section of Northern Pathway
(completing the route from Sulphur Point to Albany)
Low fare: the default assessment assumes the new connection will have a fare matching the
existing inner harbour ferry/bus route fares. This sensitivity test considers the effects of reducing
this fare to $2 per trip
Information
A combination of low fare and including A2C
Zero fare: this sensitivity test considers the impact of a fare-free trip across the harbour
A combination of zero fare and including A2C
For option 2G, a range of sensitivity tests that additionally assume reduced, 20 minute ferry
Official
frequencies (all other options assume 10 minute frequencies).
The results are presented in Table 2. We note that the default assumptions and first 3 sensitivity tests
the
all include a fare component for the ferry and bus options. This component is not relevant for the AHB
path option, which is expected to be free.
under
Released
1982
Act
Information
Official
the
under
Released
1982
Act
Information
Official
the
under
Released

7
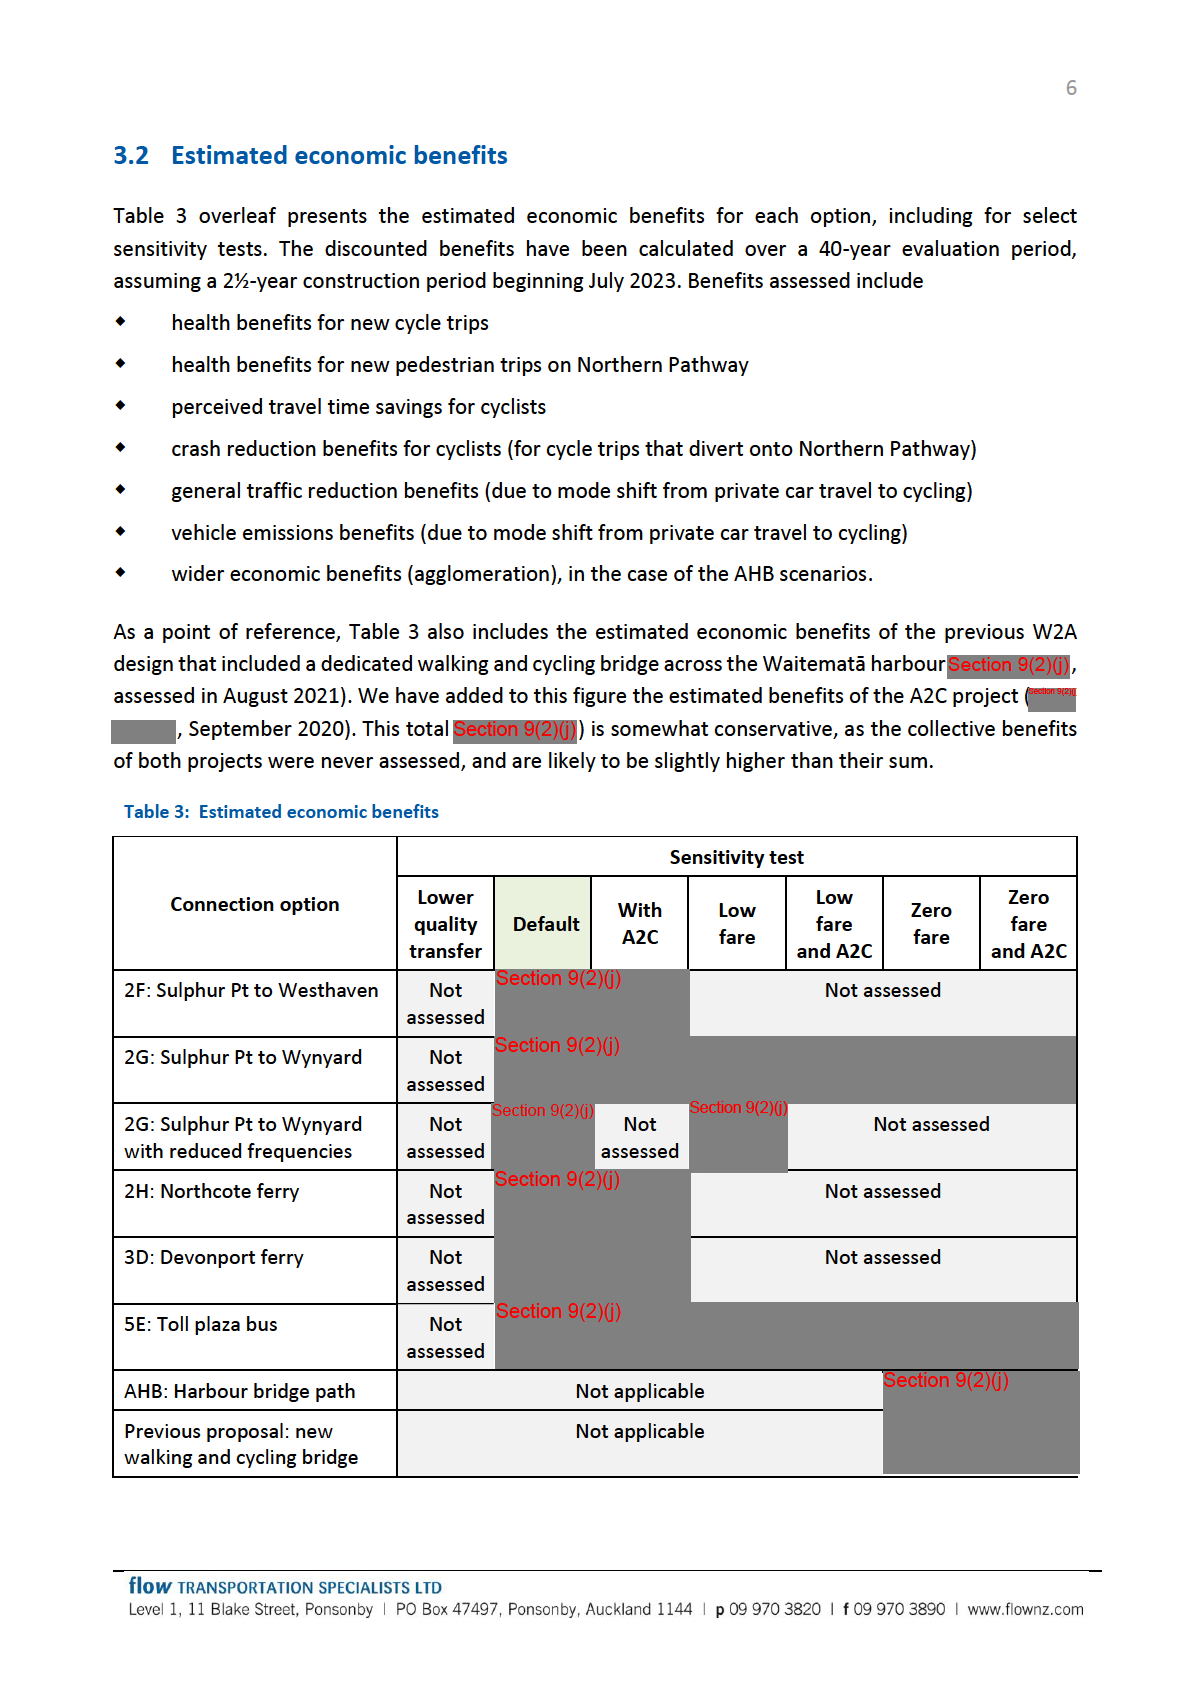
We note that option 3D (Devonport ferry) has estimated discounted benefits of Section 9(2)(j). This benefit
is the result of completing the Akoranga to Sulphur Point section of Northern Pathway, rather than the
result of any improvements to the Devonport ferry.
The estimated benefits for each of the other options can then be viewed in light of this Section 9(2)(j)
benefit. Option 2F for example is predicted to result in Section 9(2)(j) in benefits: Section 9(2)(j) associated
with the Akoranga to Sulphur Point section of Northern Pathway, and a further Section 9(2)(j) associated
with the additional ferry link.
1982
The economic benefits presented in Table 3 point to the incremental benefits of a series of potential
investment steps. In the case of Option 2G (Sulphur Point to Wynyard Quarter), these incremental steps
Act
are:
Section 9(2)(j) in benefits for the Akoranga to Sulphur Point section of Northern Pathway
a further Section 9(2)(j) in benefit, should the new option 2G ferry route be provided (with standard
fares charged but low ferry frequencies)
a further Section 9(2)(j) in benefit, should the new ferry route have increased ferry frequencies
a further Section 9(2)(j) in benefit should the new ferry route also be fare free
a further Section 9(2)(j) in benefit, should the A2C section of Northern Pathway also be provided
Information
a further Section 9(2)(j) in benefit, should a constrained shared path be provided using an existing
traffic lane on the existing harbour bridge, rather than the ferry route
at least a further Section 9(2)(j) in benefit, should a high quality, dedicated walking and cycling
connection be provided, rather than the above constrained shared path on the existing bridge.
Official
The Section 9(2)(j) now assessed for a shared path on the existing harbour bridge, plus the remaining
sections of Northern Pathway, falls comfortably below the estimated Section 9(2)(j) for the previously
proposed dedicated bridge. Lower benefits are expected in this case due to the narrower path width
the
now proposed, and the close proximity to motorway traffic. This is expected to result in less use overall,
relative to the previously proposed new bridge.
3.3 Estimated benefit cost ratios
under
Table 4 presents the BCRs for select investment scenarios, based on the following cost estimates
provided by Commute:
Section 9(2)(j) capital costs for Wynyard to Akoranga. We have assumed a further 1% annual
maintenance costs Section 9(2)(j) per year)
Section 9(2)(j) capital costs for the Option 2G ferries and terminals, with a further Section 9(2)(j)
annual operating and maintenance costs. These operating costs have been offset by the estimated
fare revenue, for relevant scenarios
Released
Section 9(2)(j) capital costs for A2C. We have assumed a further 1% annual maintenance costs
Section 9(2)(j) per year).

8
Table 4: Estimated benefit cost ratios – Option 2G (Sulphur Pt to Wynyard)
Standard fare
Low fare
Zero fare
Without A2C
0.14
0.61
0.78
With A2C
0.30
0.56
0.67
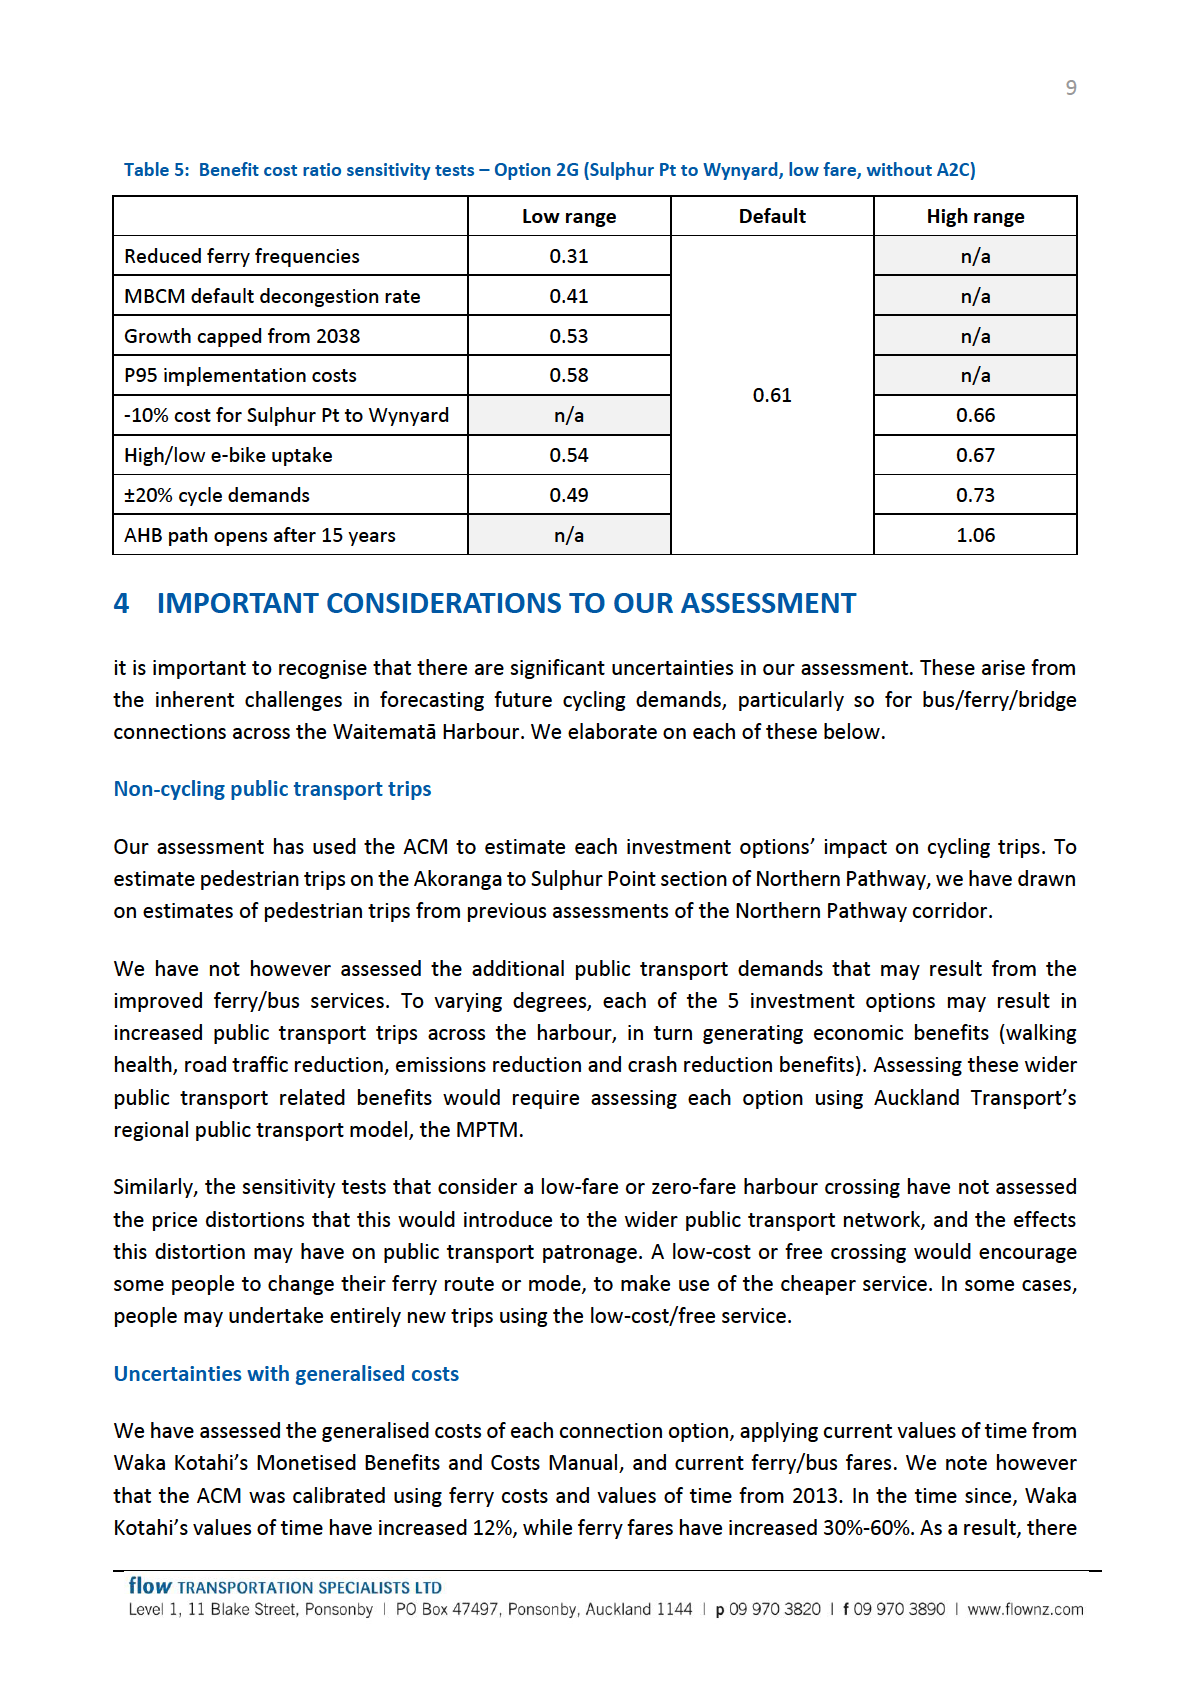
We have assessed a range of sensitivity tests on the above BCRs, based on the low fare, without A2C
scenario. Those sensitivity tests have included the implications of:
1982
reduced ferry frequencies (20 minute frequencies applied), allowing for 1 fewer ferry purchase
and reduced operating costs
Act
10% lower implementation costs for Sulphur Point to Akoranga, reflecting a value-engineered
design
P95 implementation costs for Sulphur Point to Akoranga Section 9(2)(j)
a scenario where future changes to travel demands and/or infrastructure allows 2 lanes of the
existing AHB to be dedicated to walking and cycling. This has been assumed to occur after the
ferries have been operating for 15 years, when:
o ferry and terminal operating and maintenance costs cease
Information
o ferry service benefits cease
o ferry fare revenues cease
o Section 9(2)(j) in capital costs are incurred to retrofit the existing AHB and its approaches
o a wide, high quality walking and cycling path is provided. We have assumed annual
benefits will be equal to those calculated previously for the dedicated walking and cycling
Official
across the Waitematā harbour (assessed in August 2021). Ie not the narrower, single-
lane shared path assessed previously in this document
the
this sensitivity test does not account for the cost of any wider intervention(s) needed to enable
the 2 AHB lanes to be repurposed.
capping growth in demand at 2038 (the final forecast year)
lower/higher uptake in e-bikes and other forms of micro-mobility
under
applying MBCM standard benefit rates for reductions in private vehicle travel. Our default
assessment uses area-specific benefit rates for cross-harbour and lower North Shore car trips,
developed using the Northern Corridor Improvements (NCI) SATURN models. The MBCM rate
does not reflect the traffic congestion experienced locally on the approaches to the AHB, or how
this congestion is expected to change over time
higher/lower cycle demand estimates, reflecting wider levers that may affect cycle demands
across the harbour, including changes to future fuel costs, car parking availability, car and/or
Released
public transport infrastructure, congestion charging, and extended investment in the wider cycle
network, among other levers.
1982
Act
Information
Official
the
under
Released

10
is some uncertainty about how the ACM responds to changes in generalised costs for ferry and bus trips
across the harbour.
Wider changes that affect cycling
ACM is unable to reflect changes to other modes of travel that indirectly affect the uptake of cycling.
These include future changes in fuel costs, car parking costs or availability, general traffic congestion,
public transport fares or road pricing. Each of these wider regional levers has the potential to affect the
numbers of people who chose to cycle across the harbour, and elsewhere.
1982
Tourism and recreational trips
Act
Previous assessments of the walking and cycling potential across the Waitematā Harbour have
considered the tourism and recreational potential. This has been necessary because previous proposals
have been bridge connections across the harbour, which were expected to be fare free, but to also offer
elevated views of the harbour and city, on a high-quality facility. A future ferry or bus connection is
unlikely to have the same level of appeal, and the transfers required are unlikely to be used by sports-
recreational cyclists. As a result, we have assumed there would be no significant recreation or tourist
trips on any of the bus and ferry options assessed. This may not be the case should the ferry/bus
connection be fare free, but our assessment has maintained this assumption to be consistent across all
Information
bus/ferry scenarios, and due to the uncertainty in estimating the recreational and tourist potential of a
ferry or bus service.
Large scale behaviour change
There is greater uncertainty in the scenarios where higher demand potential is forecast. For the lowest
Official
demand scenarios, the bus and ferry demands predicted are not significantly different to the existing
numbers of cyclists using ferries across the Waitematā Harbour, so there is a fair level of confidence that
these forecasts are achievable. The highest demand forecasts however require widespread behaviour
the
change among existing car and public transport users throughout the North Shore. There is a greater
level of uncertainty in these scenarios, due to the large scale changes in travel behaviours required.
Off-peak bus/ferry frequencies
under
The ACM develops estimates of daily cycle trips based on modelled commuter peak periods, scaling
these up to account for off-peak and weekend trips. In the case of the bus and ferry options, interpeak
frequencies may be lower than the modelled, peak frequencies. As a result, off-peak and weekend
bus/ferry demands may be proportionally lower than estimated. The scaling factors used to estimate
daily cycle demands do not account for any off-peak reduction in quality of service.
Interchange facilities
Released
Our modelling has assumed a very high quality of interchange facilities between cycling and bus/ferry
services. This would typically include indoor waiting areas, seating, toilets, and facilities to top up Hop
cards if fares are to be charged. Any lesser standard may result in lower demands than those forecast
above.

11
Wider economic benefits
The 2021 economic evaluation of a new walking and cycling bridge across the Waitematā harbour
included Section 9(2)(j) in annual agglomeration benefits. These benefits were associated with bringing
the Takapuna Metropolitan Centre and Auckland City Centre ‘closer together’, and were developed by
MRCagney in 2018.
We have not allowed for any agglomeration benefits for the bus/ferry options. For the AHB shared path
option however, we have allowed for 50% of these agglomeration benefits
1982
Section 9(2)(j) per year, after
applying current update factors). This acknowledges that the lower standard of path proposed will have
reduced agglomeration effects, relative to the previously proposed dedicated bridge.
Act
For the scenario where 2 AHB traffic lanes are removed after 15 years of operation, we have applied the
full annual agglomeration benefit, reflecting the higher quality and capacity of this link.
Information
Official
the
under
Released
Reference: P:\NZTA\207 Waitemata Harbour W&C Connection Options\4.0 Reporting\TN1C220321 Waitemata W&C Connection Assessment.docx -
Section 9(2)(a)