
 Project:
Auckland Cycle Model
Title:
Model Development Report
Document Reference:
P:\Aeco\004 SeaPath\4.0 Reporting\R2D180907 Auckland Cycle
Project:
Auckland Cycle Model
Title:
Model Development Report
Document Reference:
P:\Aeco\004 SeaPath\4.0 Reporting\R2D180907 Auckland Cycle
Model Development Report.docx
Prepared by:
Reviewed by:
Revisions:
Date
Version
Reference
Approved by
Initials
16 August 2018
A
R1A180816
3 September 2018
B
R1B180903
6 September 2018
C
R1C180906
7 September 2018
D
R1D180907
The drawings, information and data recorded in this document (the information) are the property of Flow Transportation Specialists
Ltd. This document and the information are solely for the use of the authorised recipient and this document may not be used, copied
or reproduced in whole or part for any purpose other than that for which it was supplied by Flow Transportation Specialists Ltd. Flow
Transportation Specialists Ltd makes no representation, undertakes no duty and accepts no responsibility to any third party who may
use or rely upon this document or the information.

Auckland Cycle Model
Model Development Report
i
CONTENTS
1
INTRODUCTION ................................................................................................................................ 1
2
INPUT DATA USED ............................................................................................................................ 1
3
MODELLED NETWORK ...................................................................................................................... 2
4
2013 BASE MODEL ........................................................................................................................... 5
4.1
Methodology .......................................................................................................................... 5
4.2
Matrix Estimation ................................................................................................................... 7
4.3
Model Validation .................................................................................................................... 8
5
FORECAST MODEL DEMANDS .......................................................................................................... 9
5.1
Methodology .......................................................................................................................... 9
5.2
Accounting for Land Use Growth ......................................................................................... 10
5.3
Accounting for Mode Shift ................................................................................................... 11
5.3.1 General Methodology ................................................................................................ 11
5.3.2 Potential Cycle Trip Matrices ..................................................................................... 11
5.3.3 Distance Conversion Factor ....................................................................................... 12
5.3.4 Improvement Conversion Factor ............................................................................... 14
5.3.5 Network Effects .......................................................................................................... 17
5.3.6 Initial Development of Elasticity Factors .................................................................... 15
5.4
2016 Forecast Model Calibration ......................................................................................... 18
6
MODEL LIMITATIONS ..................................................................................................................... 21
APPENDICES
APPENDIX A
MATRIX ESTIMATION
APPENDIX B
MODEL VALIDATION

Auckland Cycle Model
Model Development Report
1
1 INTRODUCTION
This report has been prepared by Flow Transportation Specialists (Flow) to document the development
of the Auckland Cycle Model. The Auckland Cycle Model was initially developed in 2014 to support the
Indicative Business Case for the NZ Transport Agency’s SeaPath shared use path project, and has been
substantially extended and revised since. It has subsequently been used to evaluate cyclist demands for
cycle infrastructure projects across Auckland, on behalf of both Auckland Transport and the NZ Transport
Agency, including:
SeaPath shared use path
Wynyard Quarter cycle infrastructure
New Lynn to Avondale shared path
Quay Street cycleway
Auckland Urban Cycleways Programme
Glen Innes and New Lynn Cycle Links to Public Transport
Mangere Inlet shared path
Auckland Cycling Programme Business Case
Te Whau Pathway
Burnley Terrace cycle link
The Pt Chevalier, Westmere and Grey Lynn package of cycle routes
Ti Rakau Drive cycleway component of AMETI project
The Hingaia South cycle network
The cycling infrastructure component of the Northern Corridor Improvements project
Glen Innes to Tamaki Drive shared path
Inner East and West cycle routes
This report documents the model as it stands in August 2018, including:
The model’s extent, periods represented and level of detail
The 2013 base model, including its calibration and validation processes
The forecast demand methodology and the calibration of this process
The model’s limitations.
2 INPUT DATA USED
The development of cyclist demands has relied on inputs from multiple sources, including:
The 2013 New Zealand Census:
Journey to work cycling trips within the model area (some 5,680 daily cycling trips, representing
96% of the Auckland regional journey to work cycle trip total);
The trip length profile for cycling journeys to work in the Auckland region.

Auckland Cycle Model
Model Development Report
2
The Auckland Regional Transport (ART) model:
Morning and evening peak period person trips for non-active modes, by trip type, for the 2026
and 2046 forecast years.
Auckland Council Land Use Forecasts:
Projected population and employment forecasts for the Auckland region, by ART model zone.
The UK Department for Transport’s (DoT) National Travel Survey Statistics:
The proportion of daily journey to work trips that took place between 7 and 9 am (60%), and the
proportion of work trips to home between 4 and 6 pm (49%).
Strava cycle data:
Heat maps of routes used by Auckland cyclists using smartphone apps and fitness equipment
linked to Strava.
Auckland Transport cycle count data:
Manual count data collected on a single weekday, generally on a fine day in March 2013 but
from a variety of sources and dates, and
Automatic count data from the 54 cycle counters that Auckland Transport monitors across the
region; this automatic data has provided average cyclist numbers over a period of months, or
longer.
Where appropriate, count data has been seasonally adjusted, and has been corrected for weather using
the procedures in the NZ Transport Agency’s Research Report 340 “Estimating Demand for New Cycling
Facilities in New Zealand” (McDonald, et at., 2007).
The automatic cycle counters provide continuous data throughout the day, and the analysis of this data
has found that weekday cyclist numbers across these count sites have typically fluctuated ±65% from
the annual average in 2016. Similarly, weekly counts have fluctuated typically ±25% from the average.
This illustrates the considerable fluctuation in cycle volumes, not only seasonally but also weekly and
daily.
This fluctuation has also been evident in the manual count data obtained; multiple manual counts were
often available for single locations, or for adjacent locations, with these counts fluctuating significantly.
This inherent variability in cyclist numbers has made the development of the Auckland Cycle Model
particularly challenging, and the evaluation of the model that follows must therefore be considered in
light of this variability.
3 MODELLED NETWORK
The Auckland Cycle Model was originally developed to include only central Auckland and the lower North
Shore, but has subsequently been extended to represent all major cycling routes within urban Auckland,
with a greater level of detail within the city centre, Auckland’s Metropolitan centres, and within the
inner suburbs that have the target of increased cycle investment in recent years. The model generally

Auckland Cycle Model
Model Development Report
3
includes all arterial and collector type routes, cycleways and shared paths, some ferry routes as well as
footpaths through parks and reserves that are significant to cycle trips.
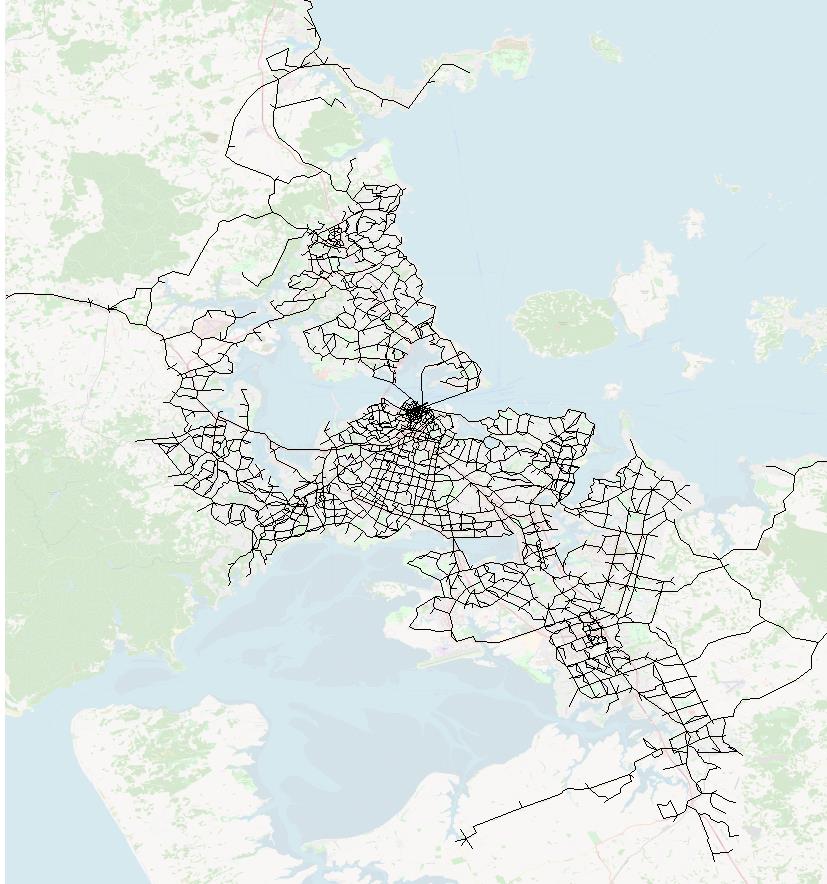
Figure 1 below illustrates the extent of the model.
Figure 1: Extent of the Auckland Cycle Model
The model represents two-hour morning (7 to 9 am) and evening (4 to 6 pm) peak periods. Insufficient
cycle count data was available for the additional development of an interpeak model.
Estimates of daily cyclists have been derived by summing and factoring the morning and evening peak
period models. The daily factors used in this process have been obtained from automated cycle count
sites across Auckland, and range from 1.4 (am + pm) for routes that are used predominantly by

Auckland Cycle Model
Model Development Report
4
commuter users during the peak periods, to 2.4 or more for routes which experience a high use by
recreational users outside the peak periods. The Auckland average is 1.9 (am + pm).
Zones within the modelled area relate to the ART model zone structure, but have been disaggregated
into a finer zone structure within the Auckland city centre, Metropolitan Centres, and within Central
Auckland and the lower North Shore. There are presently 695 zones within the modelled network.
The model interface uses traditional SATURN1 traffic modelling software, however the majority of the
model mechanism is through a series of spreadsheet based matrices and algorithms. The network has
been coded using what SATURN refers to as ‘buffer’ network. This form of coding excludes capacity
considerations and omits all detail at intersections; it allows a large network to be quickly and simply
developed and is suitable for cycling networks where capacity constraints are not commonly an issue.
Links within the network have been categorised according to the link categories defined in Table 1. Each
link category has then been assigned a ‘Relative Attractiveness’ (RA) index value, based on the relative
level of comfort, safety and inclusiveness that each type of link provides to people on bicycles.
Table 1: Link Categories
Relative
Infrastructure Type
Attractiveness Index
Iconic (for example LightPath and SkyPath)
19
High standard – cyclist only, or shared path uninterrupted by vehicle
15
crossings or side streets
Cycleways
and off road
Average standard – shared use path interrupted by vehicle crossings
14
cycle paths
or side streets
Low standard – a pedestrian footpath
13
Very low standard – a poor quality pedestrian footpath
12
Protected cycle lanes
15
On road cycle Painted cycle lanes on a minor/two-lane arterial
14
infrastructure
Painted cycle lanes on a major/multi-lane arterial
13
Transit mall
14
Transit lanes
Arterial road with bus lanes
13
Quiet route with local area traffic management – Greenways
14
No specific
Quiet route
13
cycle
infrastructure Minor/two-lane arterial
12
Major/multi-lane arterial
11
Rural roads
Rural road
11
1 A traffic modelling program for the Simulation and Assignment of Traffic to Urban Road Networks developed by Atkins-
ITS Transport Software. http://www.saturnsoftware.co.uk

Auckland Cycle Model
Model Development Report
5
As a general rule, a Relative Attractiveness rating of 15 has been applied to routes that meet current
best practice. The iconic rating has been developed to represent the LightPath cycleway, which due to
its combination of colourful design, interactive lighting, harbour and city views, width and media
attention, has received an exceptionally high number of cyclists since opening (see forecast model
calibration, Section 5.4).
Modelled routes have also been assigned a Relative Attractiveness rating one classification higher where
they are considered to be scenic routes that attract significant numbers of recreational cyclists, such as
Tamaki Drive. Conversely, routes have been shifted down on classification where they are considered
to be of a lower standard or less safe than other facilities of the same type, or where they climb a
significant uphill gradient.
Broadly, the Relative Attractiveness scale of 10 to 19 aligns with the Relative Attractiveness scale applied
in Simplified Procedures 11 (SP11) of the NZ Transport Agency’s Economic Evaluation Manual (EEM), of
1.0 for a route with no dedicated cycle infrastructure to 2.0 for an off-road route.
Relative Attractiveness has been represented within the model by the speed on each modelled link. It
is important to recognise that this is not an actual speed, as the model does not consider travel times,
delays or congestion. It does however allow the Relative Attractiveness classification assigned to each
link to affect route assignment within the model: modelled trips assign not necessarily via the most
direct route, but via an optimal route based on a weighting of each route’s comfort, safety, inclusiveness
and gradient (its Relative Attractiveness) and its distance. This reflects known cyclist behaviour, where
user tend to be willing to cycle a slightly longer distance in order to access a safe and comfortable route,
or to avoid a particularly dangerous route.
It is noted that the assignment within the model is ‘all or nothing’, rather than stochastic distribution.
The Relative Attractiveness classification is also important in the derivation of forecast demands for each
route (refer Section 5).
In addition to physical cycling infrastructure, links have been included within the model representing the
Devonport, Bayswater and Birkenhead/Northcote ferries. These links have been assigned lengths that
correspond to a $5 ferry fare2, plus the respective journey times and wait/transfer times (depending on
the frequency of sailings), converted to distance by assuming a 15 km/h average cycle speed and
standard EEM values for travel time3.
4 2013 BASE MODEL
4.1 Methodology
A base model has been developed to represent March 2013 network conditions. March 2013 has been
used as it aligns with both:
The 2013 Census, carried out in March that year, and
2 Noting that the 2013 adult cash fare for each ferry was $6 and the AT Hop fare was $4.20
3 $22.78/hour, including EEM update factors appropriate in 2013

Auckland Cycle Model
Model Development Report
6
Auckland Transport’s annual cycle count programme, also carried out in March.
The number of cyclists within the base model has been derived from the 2013 census journey to work
data. This data includes 5,904 one-way bicycle trips to work within the Auckland region that was first
reduced to 5,679 trips by removing trips in areas outside the model extent. This has been transposed
to develop a matrix of the journeys home from work, used to develop evening peak demands.
The census data represents daily trips to work (or from work when transposed). These matrices were
factored down to represent two-hour peak periods using the UK DoT’s National Travel Survey statistics
for commute trip types. Factors applied were 0.6 and 0.49 in the morning and evening peaks,
respectively4, resulting in a morning peak matrix total of 3,407 trips and 2,783 evening peak trips.
These matrices represented only those cycle trips that were undertaken as trips to or from work, so have
been factored up to reflect all trip types undertaken by bicycle. For the morning peak, this factor (1.25)
has been obtained by comparing data from the Household Travel Survey, which provided the number of
cycle-to-work trips undertaken per person in Auckland with the number of cycle trips per person for all
purposes. The resulting all-trip matrix contained 4,259 morning peak trips. A higher factor (1.43) was
applied to the evening peak, reflecting the higher proportion of trips being undertaken for purposes
other than commuting in the evening period, and resulting in 3,975 evening peak trips.
The above procedures have been used as a part of the calibration process, to scale the March 2013
cycling demands to match observed March 2013 cycle count data.
The census travel to work data contains a small number of cycle trips across the Waitemata Harbour,
despite there being no existing cross harbour walking or cycling facility. This corresponds to cyclists who
cycle to ferry (or bus) terminals or those who cycle ‘the long way around’ via the Upper Harbour Bridge.
Cross harbour census trips have been calibrated to better reflect the observed cycle counts on the
Devonport, Bayswater and Northcote/Birkenhead ferries, as well as those across the Upper Harbour
Bridge.
While the census home-to-work trip data was manipulated as above to include all trip types, the
modelled number of cyclists predicted to educational institutions and major schools was notably lower
than observed. To correct for this, school trips have been manually added to the model for schools that
recorded 50 or more daily cycle trips according to 2013 Auckland Transport cycle count data5. These
trips have been distributed equally among residential zones within each school’s enrolment area. This
correction has been made to the morning peak period model only, as the return school trips will
generally occur before the evening peak period. Similarly, inbound cycle trips into the University of
Auckland and Auckland University of Technology city campuses in the morning peak, and outbound cycle
trips in the evening peak, have been factored up to better reflect observed count data.
4 Factors of 0.50 and 0.45 could alternatively have been applied, using data from the NZ Transport Agency’s Research
Report 340. This would have then required higher factors when building the matrices to include all trip types, in order
to achieve appropriate matrix calibration outcomes.
5 Nine schools included, being: Belmont Intermediate, Takapuna Intermediate, Takapuna Grammar, Remuera
Intermediate, Orewa College, St Cuthbert’s, Western Springs College, Auckland Grammar and Westlake Boy’s. All other
Auckland schools had surveyed cycle volumes of less than 50 students

Auckland Cycle Model
Model Development Report
7
The final pre-estimation matrices contained 4,856 and 3,952 trips, in the morning and evening peak
periods, respectively.
Recreational cyclists are a noticeable occurrence on the network, particularly during daylight saving
months (typically October to March). It was noted that the model was under-representing cyclist trips
on key recreational corridors along Auckland’s waterfront, particularly Tamaki Drive, and particularly in
the contra-peak directions (away from the city in the morning, and the reverse in the evening). To
account for these trips, a series of fixed route trips have been manually added to the model between
various inner west suburbs (such as Pt Chevalier and Westmere) and various inner east suburbs (Orakei,
St Heliers and Glen Innes), via Quay Street and Tamaki Drive. This calibration factor has allowed a more
acceptable comparison of observed and modelled cyclist numbers on Tamaki Drive, Quay Street and
through the Wynyard Quarter.
The recreational trip process above is supported by Strava cycle heat maps for Auckland, which show
trips undertaken by cyclists using smartphone apps and fitness equipment that logs their trips. The
Strava data is not a representative sample of all cycle trips, being instead weighted towards
recreational/fitness cyclists. The heat maps however show a concentration of such trips on Auckland’s
central waterfront that the base model did not fully represent without the above corrections.
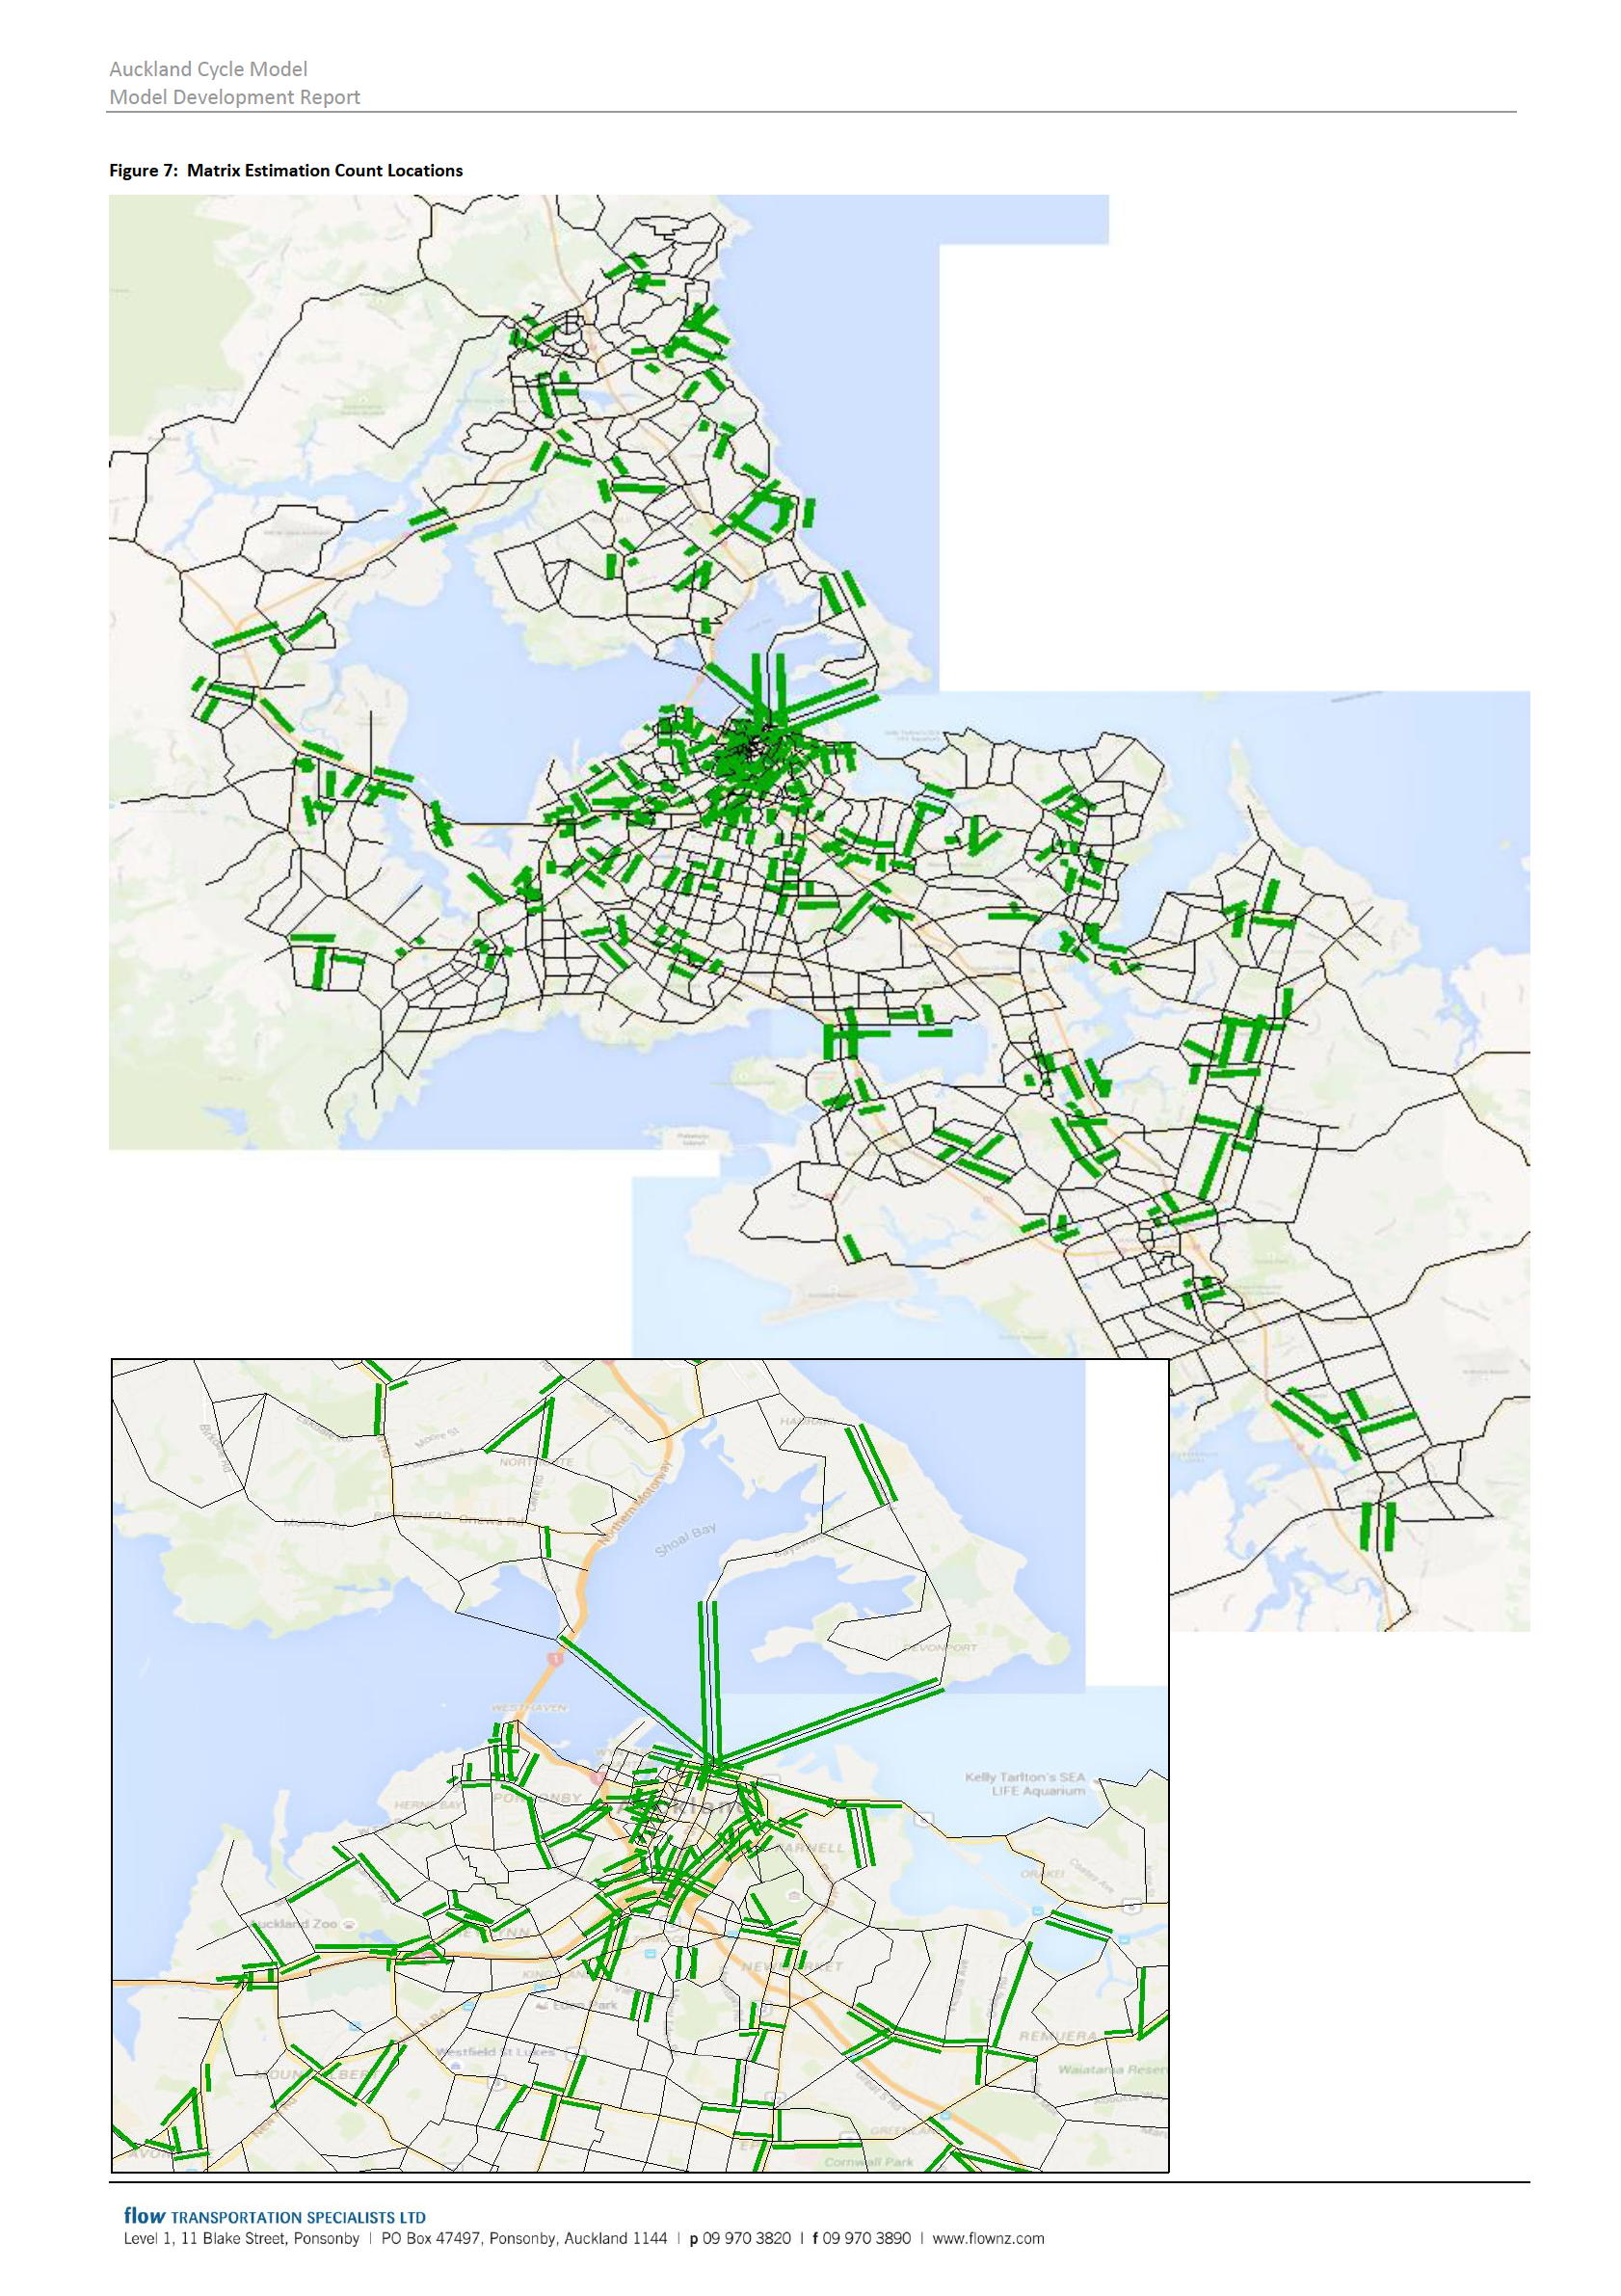
4.2 Matrix Estimation
The process above has developed a ‘prior’ matrix for each peak period that was a fairly coarse
approximation of actual cycle trips in March 2013, and which did not align with cycle count data from
that period as well as it could. To better improve this fit, the prior matrices were run through a matrix
estimation process. This process used approximately 410 cycle count data points from across Auckland,
for each modelled period. The process used predominantly data from fine days in March 2013, but
additional data collected in 2012, 2013 and 2014 were used, with these latter data points corrected for
seasonality and annual growth as appropriate. Individual counts have also been corrected for weather
as appropriate.
The estimation process was tempered by applying the following controls:
Preventing the estimation process from ‘seeding’ demands in origin-destination pairs that had
zero trips in the prior matrix. This prevented the estimation process from generating cycle trips
to and from unlikely origin-destination pairs, such as Albany to Manukau.
Limiting the factoring that the estimation process could apply to individual origin-destination
pairs, and to each link, to five times the value in the prior matrix.
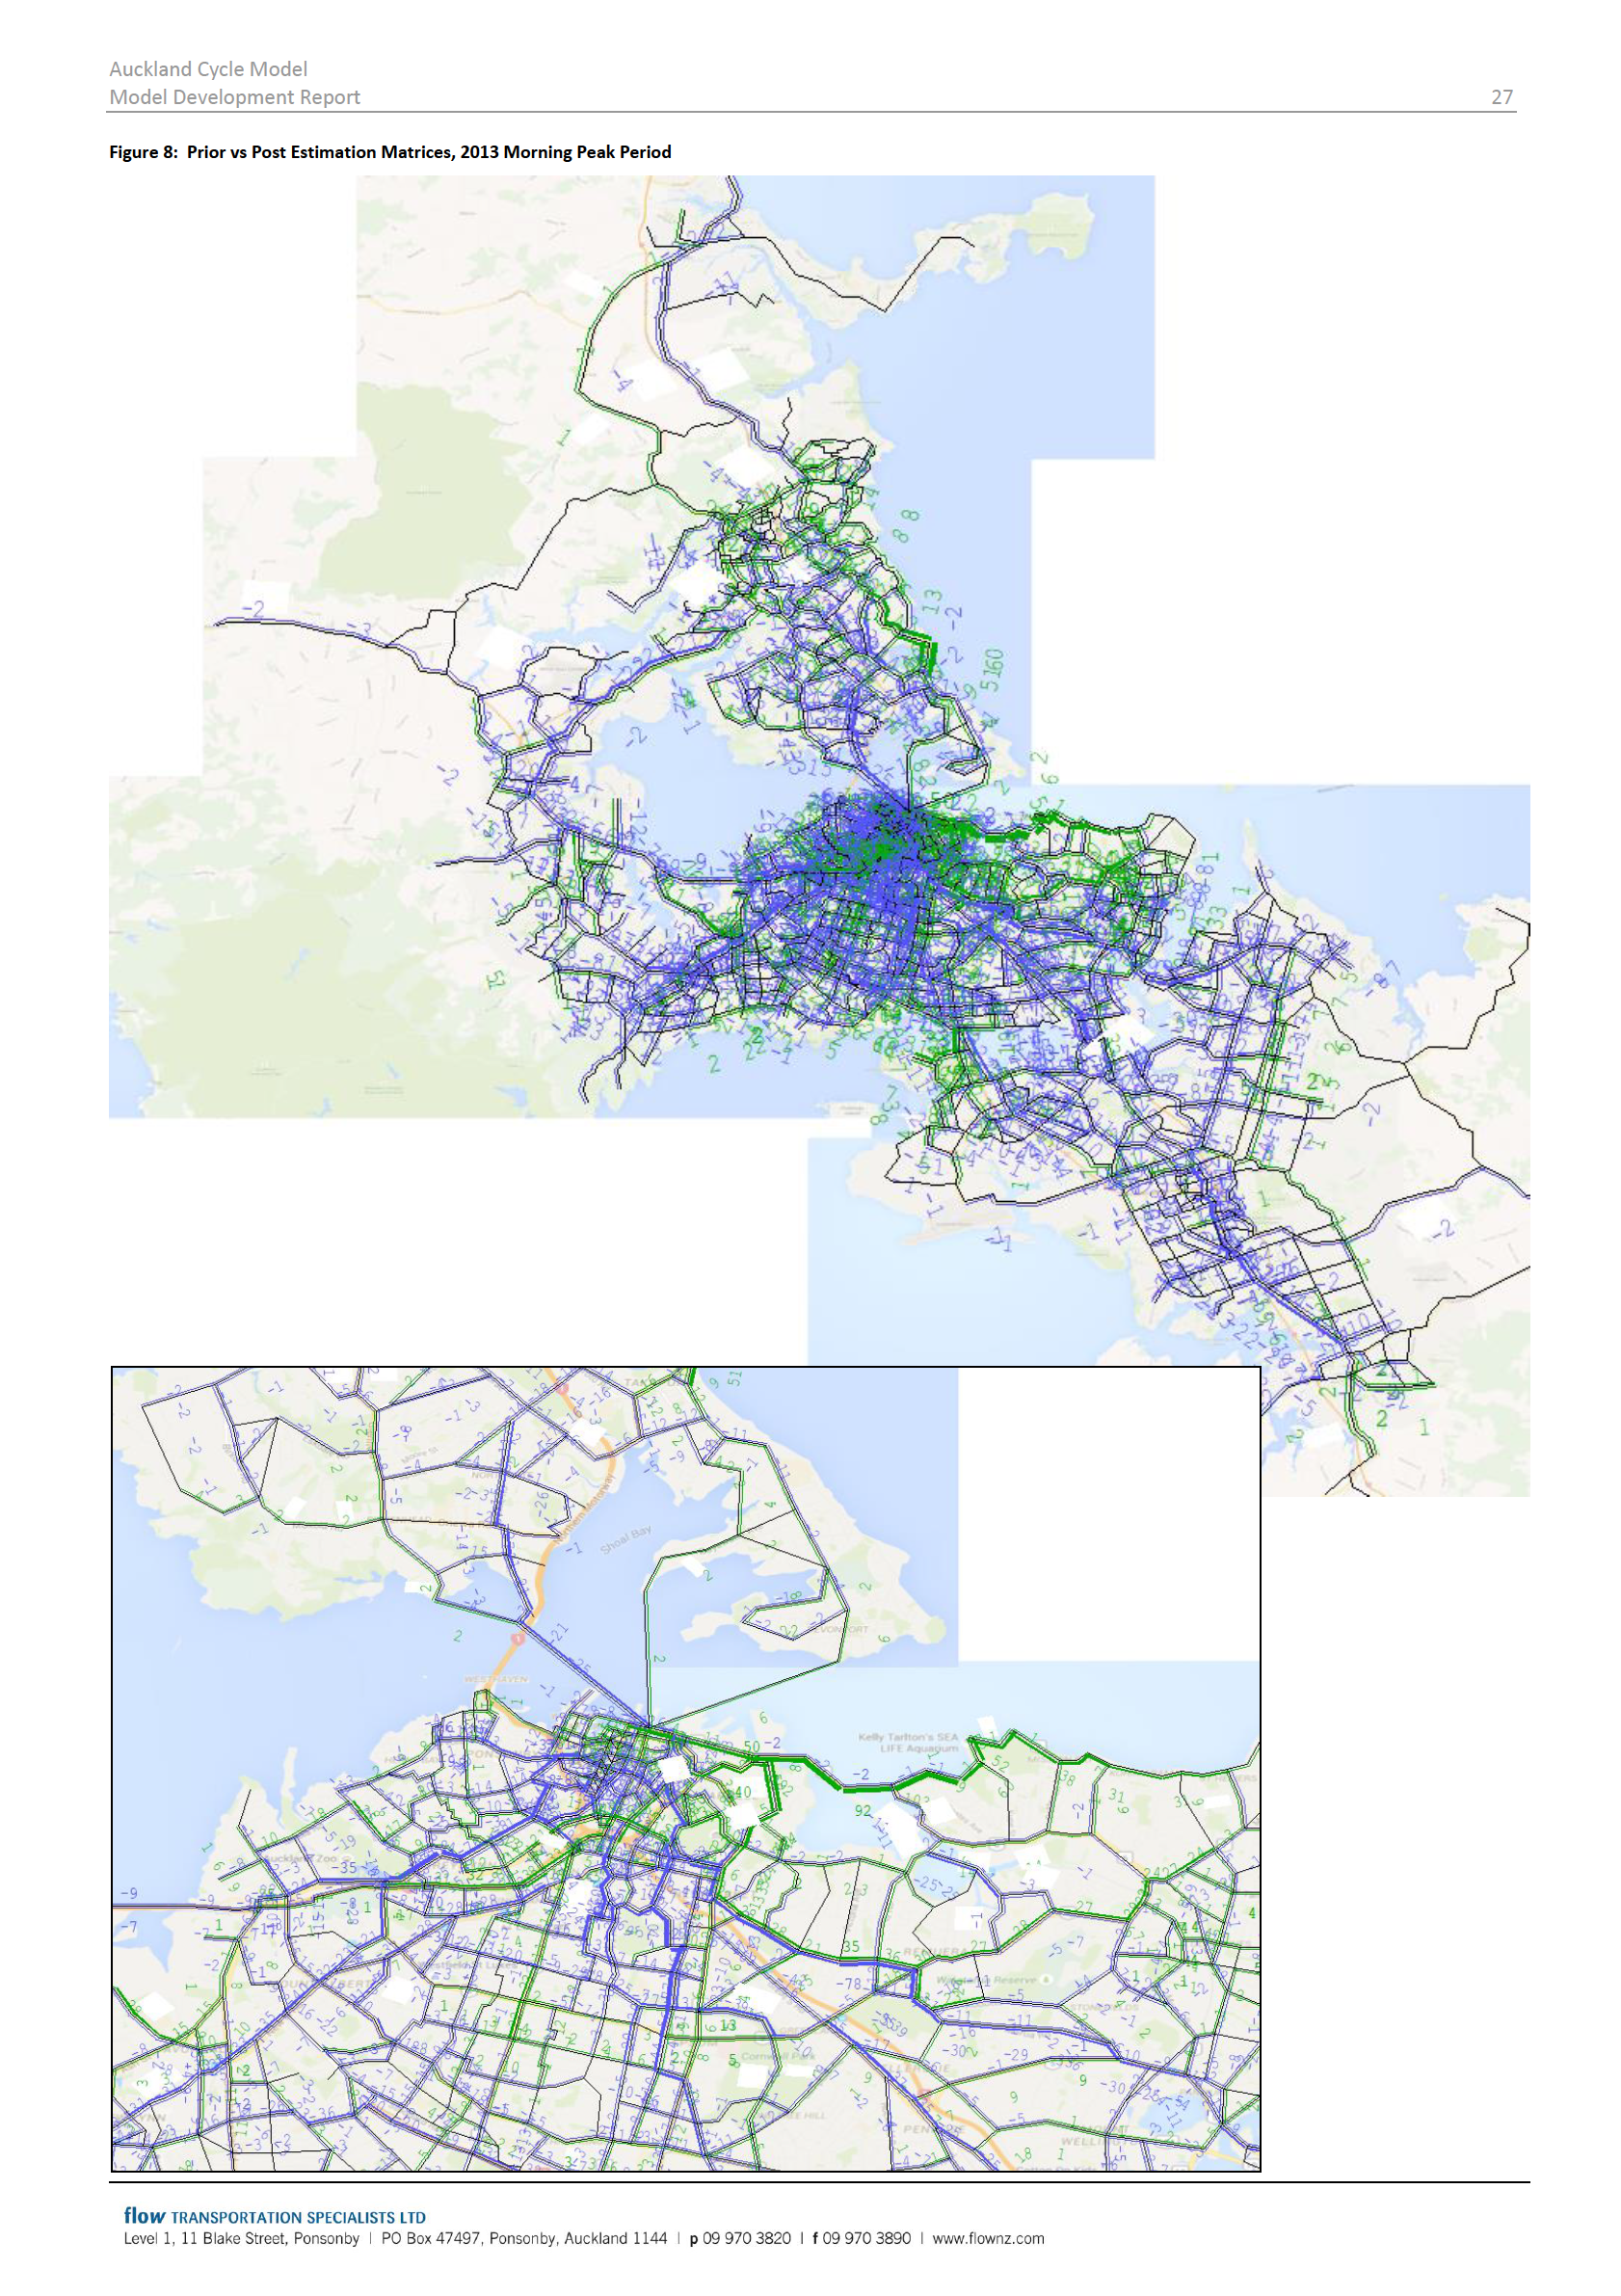
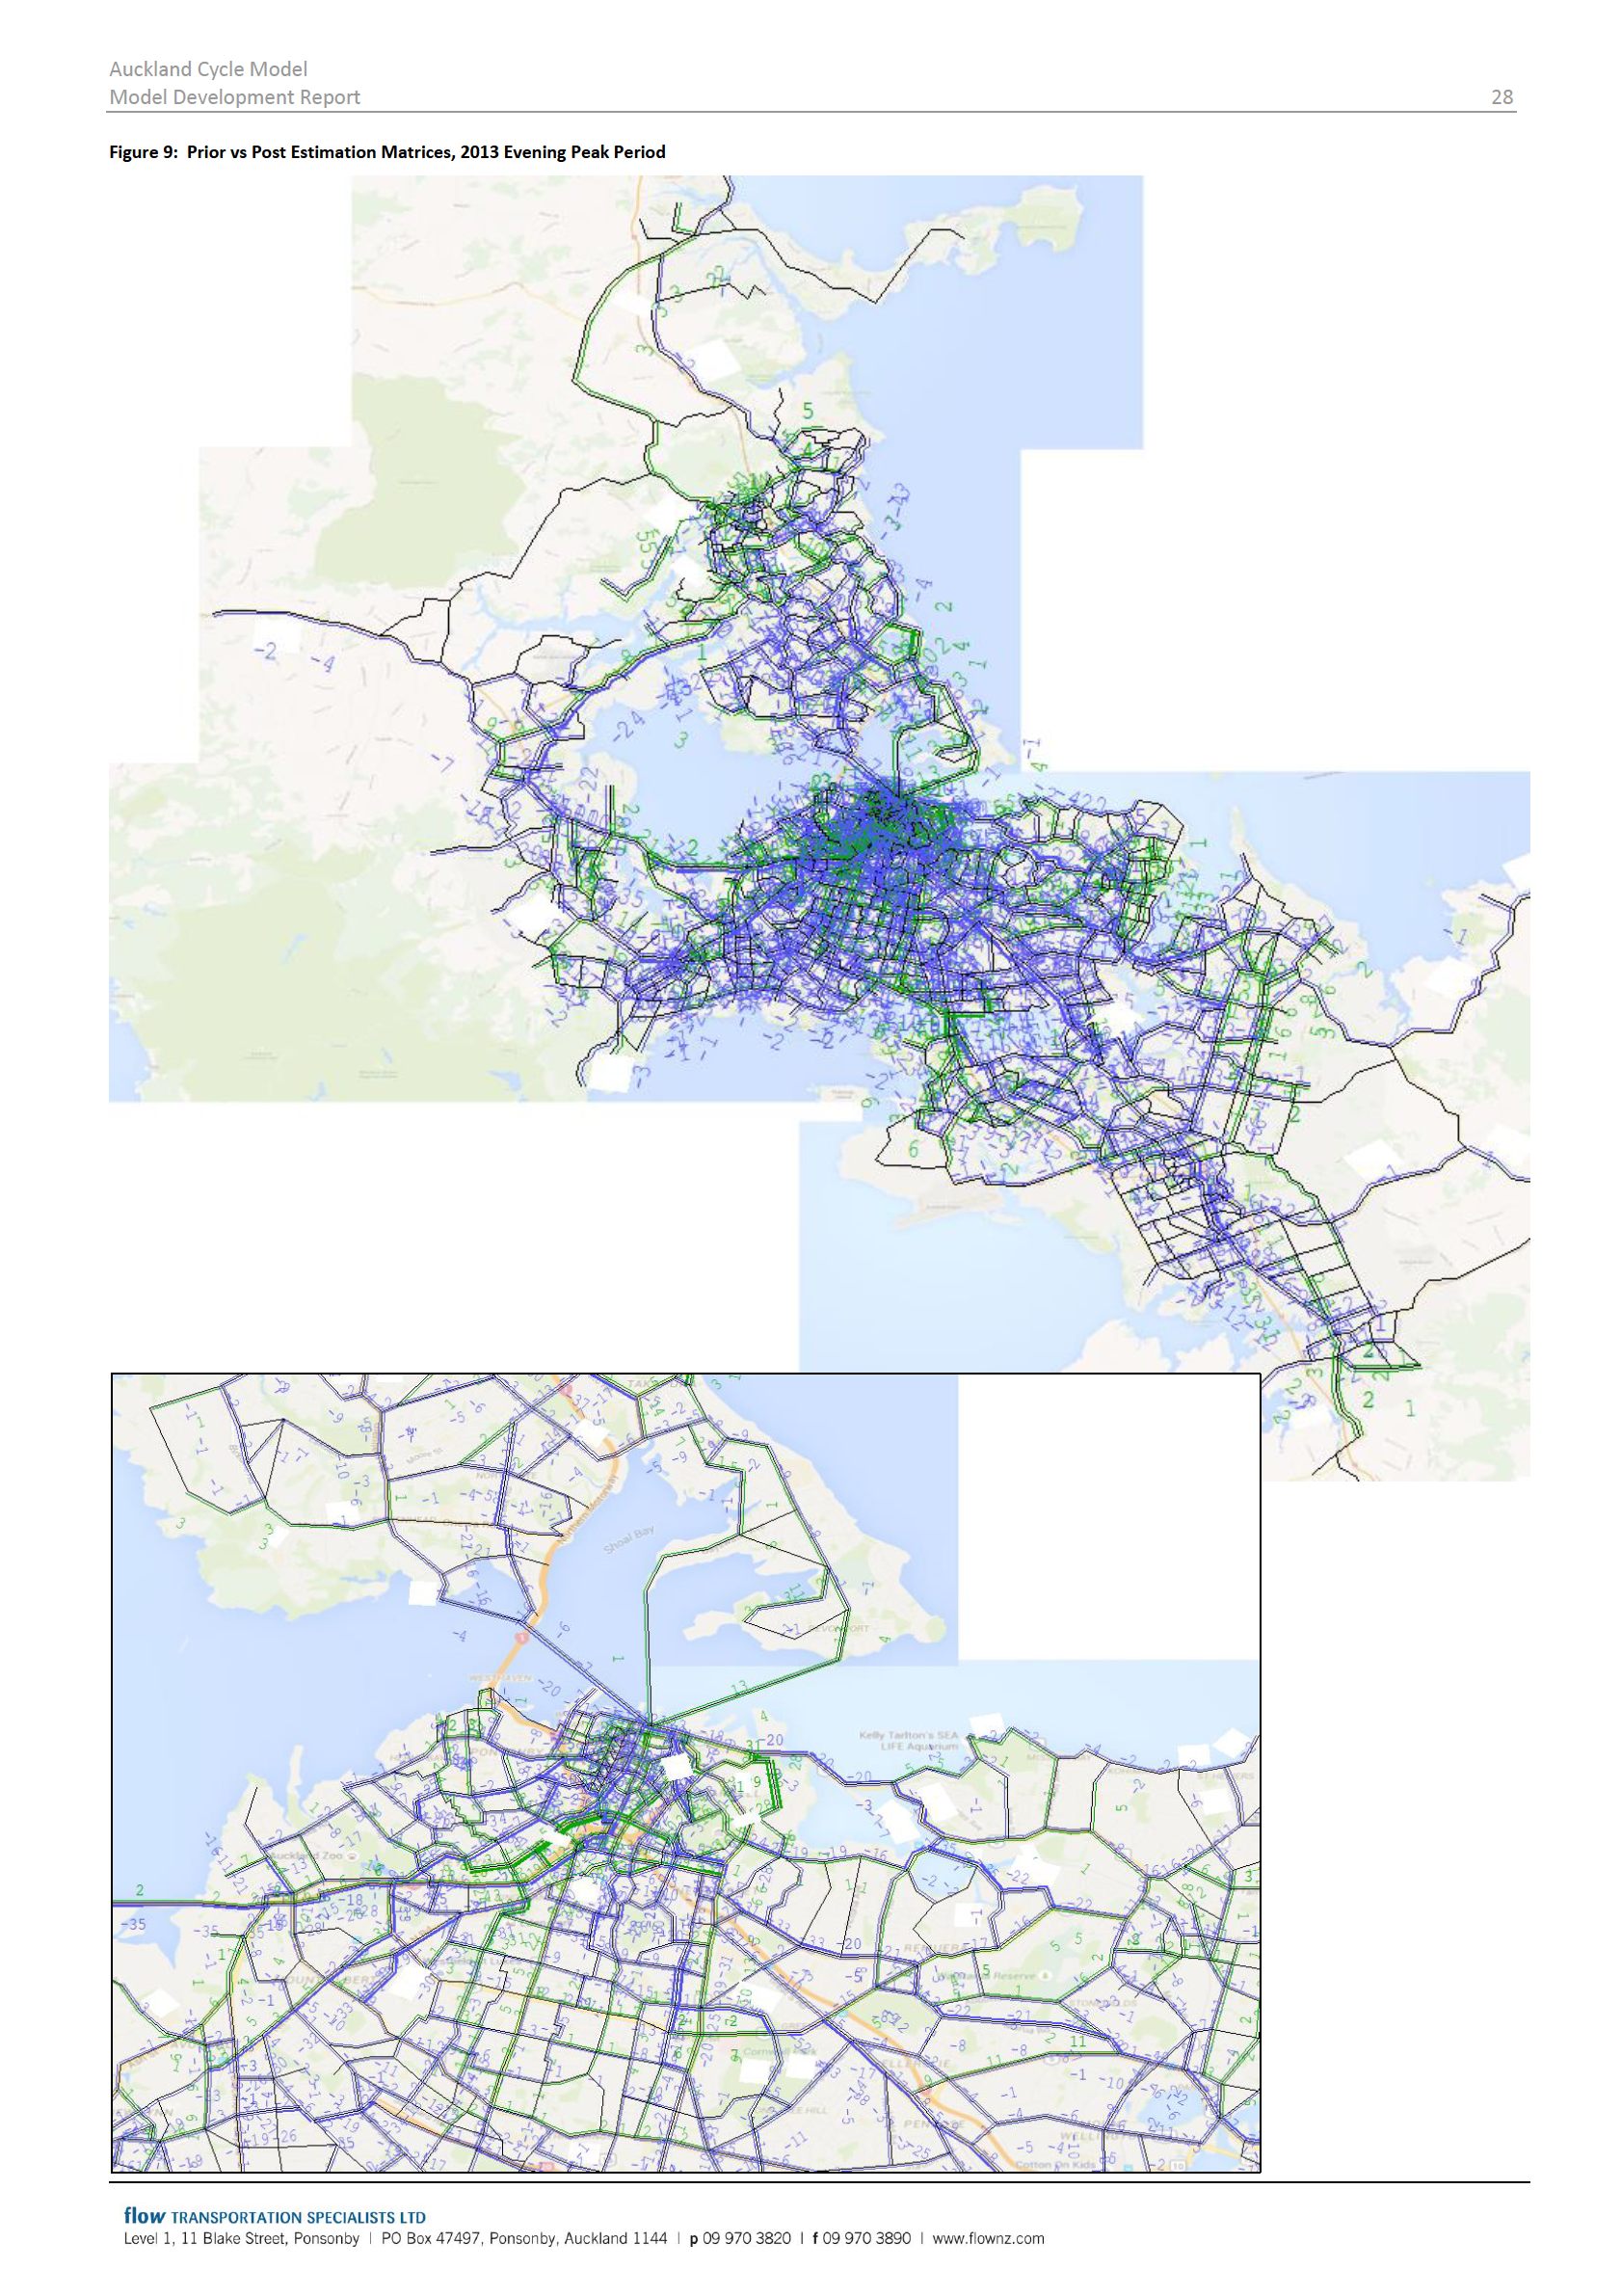
The changes in trip totals due to the estimation process are shown in Table 2, which details the total
cycling demands in the prior matrices and the final estimated matrices.
Table 2: Matrix Totals, Before and After Estimation
Morning Peak Period
Evening Peak Period
Prior Matrix Demand
4,856
3,952
Final Estimated Matrix Demand
4,644 (-4%)
3,739 (-5%)
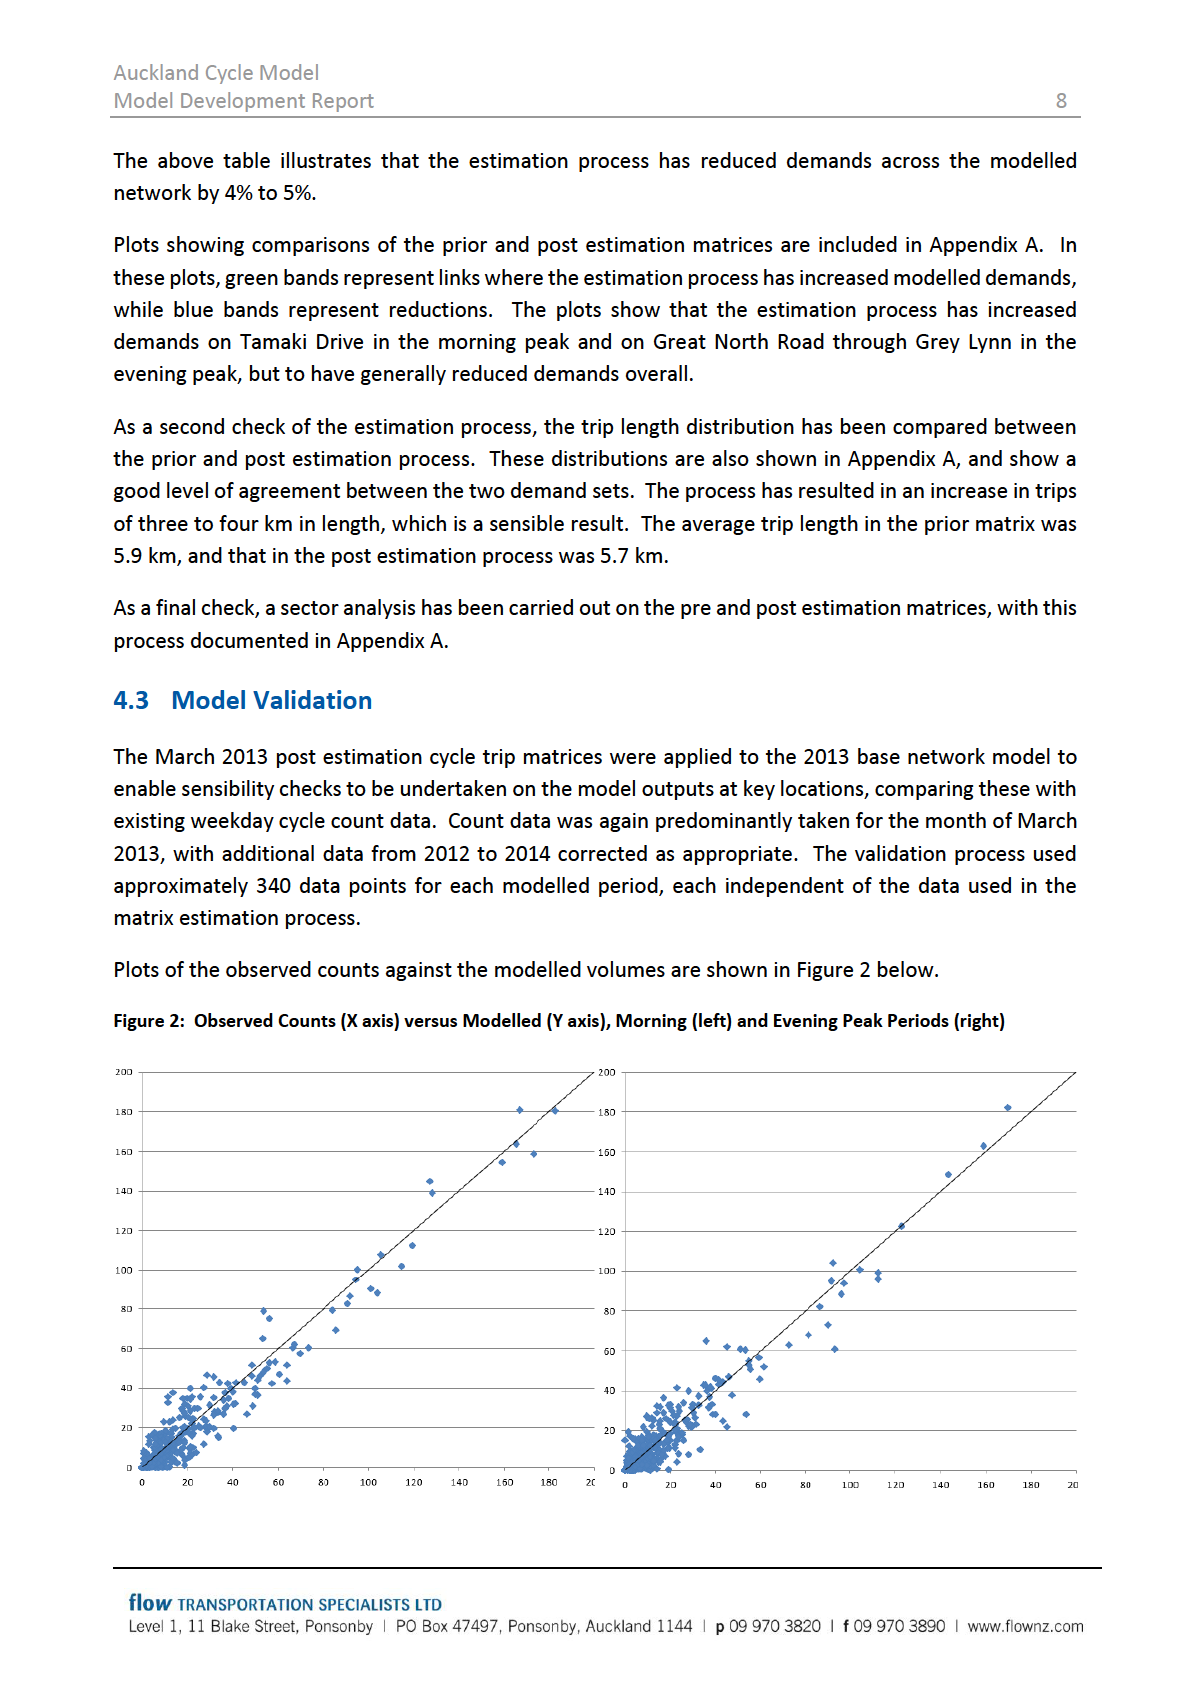

Auckland Cycle Model
Model Development Report
9
It is noted at this stage that a traditional traffic model would be validated against criteria from the NZ
Transport Agency’s Transport Model Development Guidelines. The criteria within this document were
developed for application to traditional traffic models and have not generally been found to be
appropriate to the cycle model. The criteria relating to GEH statistics6 for example were found to be a
poor measure of cycle model validity, as GEH criteria are too easy to meet when dealing with low value
data points (over 40% of counts used in the validation are under 10 cyclists per two-hour period).
Model validation criteria applied to the model include those listed below. The Transport Agency’s
validation criteria relate to the ‘Type B – Strategic Network Traffic Assignment Model’ classification,
which the Auckland Cycle Model most resembles. The Percent Mean Absolute Error is also provided in
the table below, which is not a validation criterion documented in the NZ Transport Agency’s Transport
Model Development Guidelines.
Table 3: Link Count Validation Criteria
Link Count Criteria
Transport Agency Model
Auckland Cycle Model
Auckland Cycle Model
Validation Guidelines
Morning Peak Period
Evening Peak Period
Coefficient of
0.90
0.94
0.93
determination (R2)
Line of best fit
Y = 0.9x to 1.1x
Y = 0.96x
Y = 0.97x
Percentage-Root-Mean-
Acceptable: <25%
35%
39%
Square Error (RMSE)
Requires clarification:
25-35%
Unlikely to be
appropriate: >35%
GEH statistic
>75% GEH <5.0
99% GEH <5.0
99% GEH <5.0
>80% GEH <7.5
100% GEH <7.5
100% GEH <7.5
>85% <10.0
100% GEH <10.0
100% GEH <10.0
Percent Mean Absolute
n/a
27%
30%
Error
The comparisons for R2 and the line of bets fit are generally very good, while the RMSE and GEH criteria
are considered potentially unsuitable for cycle models.
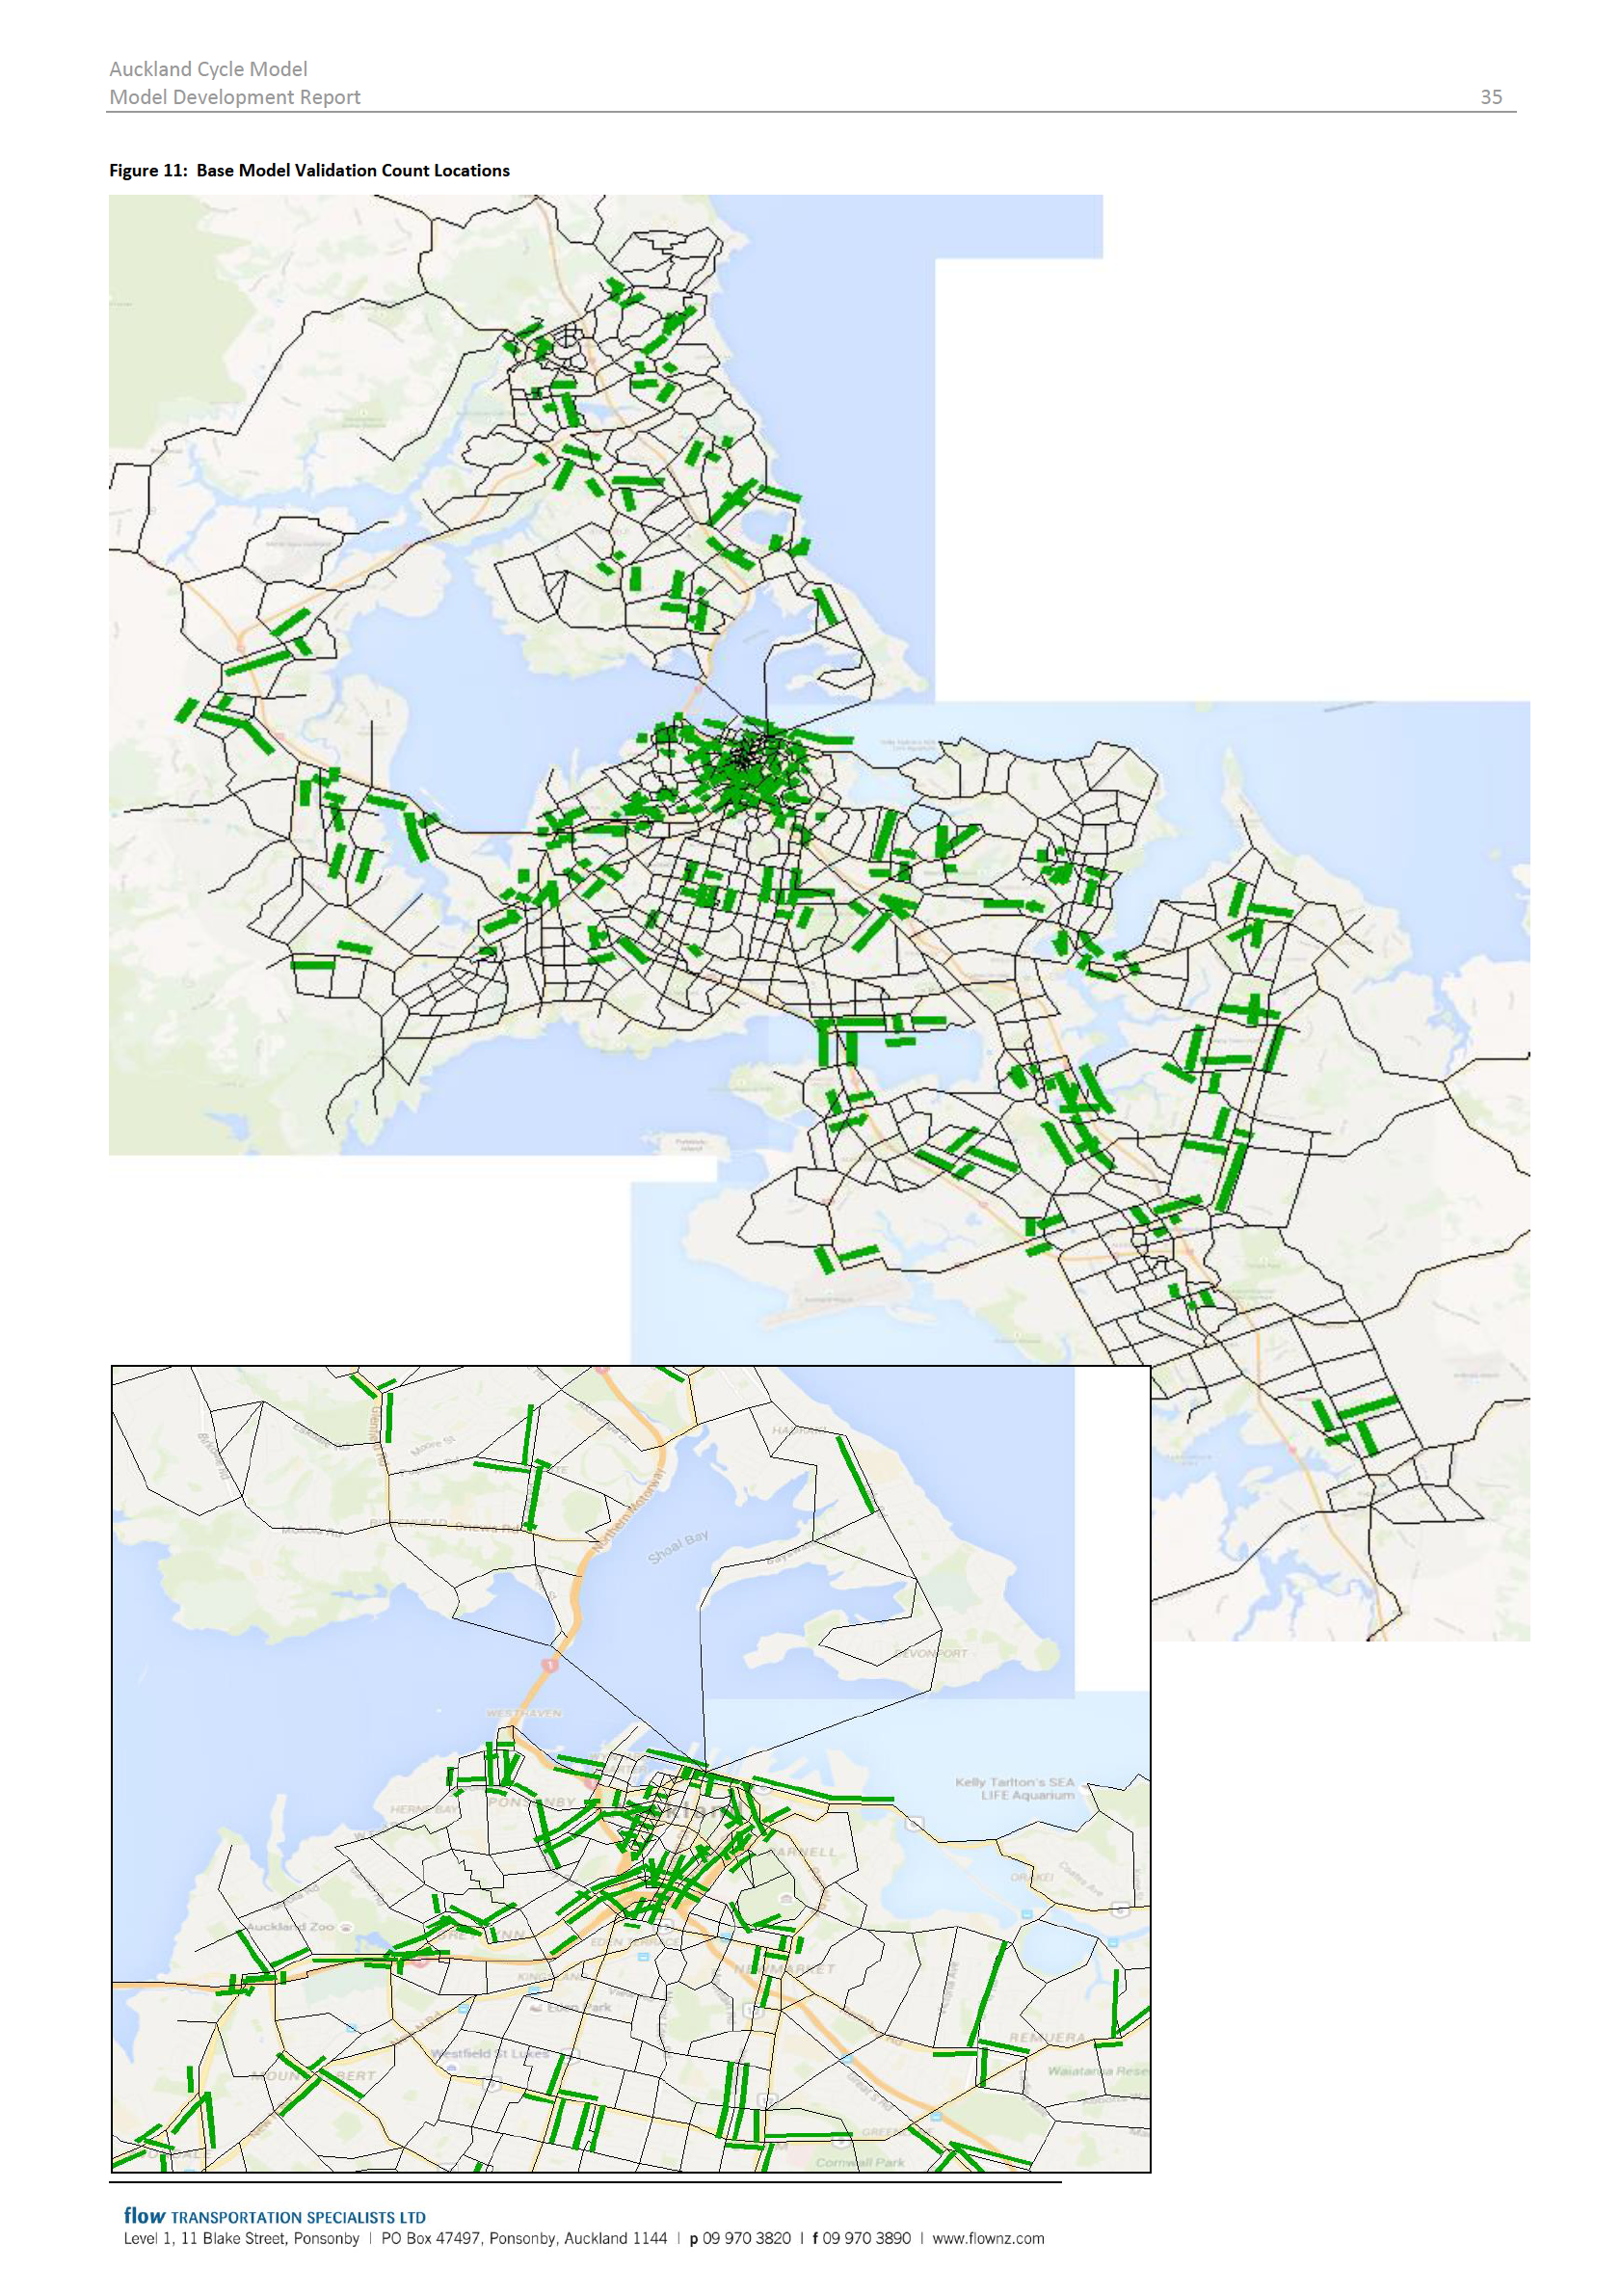
Plots showing the locations of validation count data are included in Appendix B, as is a full tabulation of
count data versus model outputs.
5 FORECAST MODEL DEMANDS
5.1 Methodology
The forecast demand methodology has considered two fundamental drivers of increases (or decreases)
in cycle demands between any two zones:
6 The GEH statistic is a form of Chi-squared statistic, commonly used to compare observed and modelled count data.

Auckland Cycle Model
Model Development Report
10
Changes in cycle demands as a result of future changes in land use, and
Changes in cycle demands as a result of future cycle infrastructure improvements.
The first of the above may be considered ‘organic’ growth that would occur if the physical cycle network
remained unchanged from its March 2013 state (ie the base model). The second relates to mode shift
and behaviour change resulting from investment. This process is summarised in Equation 1 below.
Equation 1: Future Demand Calculation
Future
Existing demands, factored
Mode shift in response to cycle
=
+
demands
to reflect land use growth
infrastructure investment
Each of the factors used in the above equation are explained in more detail below.
5.2 Accounting for Land Use Growth
The base model’s demand set represents March 2013 cycle demands, while each of the forecast years
represent annual average daily cyclists. To correct this, the base model demand set has been factored
down by 26%, to convert to average annual daily cyclists. This factor was obtained by comparing March
2013 count data to annual count 2013 data from six Auckland automated cycle count locations7.
The annualised 2013 demand sets were then factored up to account for land use growth from Auckland
Council’s most recent land use forecasts (Scenario I11). This factoring has been carried out on a zonal
basis, to ensure the growth has an appropriate geographic distribution. For the morning peak demand
set, the growth applied to each origin-destination pair is the average of the forecast population growth
for the origin zone and the forecast employment growth for the destination zone. The reverse has been
applied to the evening peak demand set.
The fixed recreational trips documented in Section 4.1 have been factored up at this stage, by the
forecast regional population growth.
This process of factoring base model demands has in effect developed future ‘Do Nothing’ demand sets
that represent a hypothetical future scenario where there is no improvement in cycle infrastructure
compared to the March 2013 network.
Some manual corrections have been made to the resulting future ‘Do Nothing’ demand sets, most
notably in the Whenuapai area. This area had a large number of cycle trips in the 2013 base model, due
to a high cycle to work mode share among employees of the Whenuapai Airforce Base. This semi-rural
area is currently being urbanised however, with very high land use growth predicted. If the high cycle
mode share was factored up by the high land use growth, disproportionately high cyclist demands would
result. Existing cycle demands within the Whenuapai area have been zeroed accordingly.
The ‘Do Nothing’ demands consider the background growth in cyclist numbers through population and
employment growth, and inherently assume that cycle mode share will remain the same; that is, they
7 Lagoon Drive, SH20 cycleway at Dominion Road, Upper Harbour Bridge, Tamaki Drive, Northwestern Cycleway at Te
Atatu and Northwestern Cycleway at Kingsland

Auckland Cycle Model
Model Development Report
11
do not reflect any increased cycle trips due to people choosing to change mode, particularly where new
infrastructure is introduced. Taking cross-harbour trips as an example, the March 2013 demand
matrices include relatively few cross-harbour cycling trips, as currently these trips are difficult, being via
the Upper Harbour Bridge or requiring a transfer to ferry. Upon completion of SkyPath however, there
will clearly be some existing cross-harbour trips by non-cycling modes converting to cycling trips. It
would not be appropriate to factor up the existing cross-harbour cycling trips to represent this mode
shift, as their distributions would likely differ significantly. These mode shift trips have been added in to
the ‘Do Nothing’ forecast trips, and the methodology used to estimate these trips is documented below.
5.3 Accounting for Mode Shift
5.3.1 General Methodology
The methodology for representing future mode shift resulting from investment in cycle infrastructure
has followed the process summarised in Equation 2:
Equation 2: Future Mode Shift Calculation
Mode shift in response
‘Potential Cycle
Distance Conversion
Improvement Conversion Factor,
to cycle infrastructure = Trips’ from ART x Factor, based on distance x based on improvements to cycle
investment
model
between O-D pairs
network between O-D pairs
Each term is addressed in turn below.
5.3.2 Potential Cycle Trip Matrices
Future ‘potential cycle trip’ matrices have been developed by summing forecast person trips from each
of the ART forecast models. The ART model is based on seven trip types however, and not all of these
are suitable for conversion to cycle trips (such as heavy vehicle trips). Accordingly, only some trip types
have been included in the process. Table 4 documents those trips types that have been included within
this process, for the 2026 morning peak period. The same proportions have been applied to the evening
peak period, but the trip totals differ.
Table 4: Trip Types Included in Pool of ‘Potential Cycle Trips’, 2026 Morning Peak Period
Trip Types
Total Trips
Proportion Included
Trips Included
Home-based work trips
221,500 car trips
100% of car trips
280,900 trips
59,400 public transport trips
100% of public transport trips
Home-based education
96,500 car trips
1000% of car trips
125,000 trips
trips
28,500 public transport trips
100% of public transport trips
Home-based shopping
28,300 car trips
25% of car trips
12,600 trips
trips
5,500 public transport trips
100% of public transport trips
Home-based other trips
198,500 car trips
25% of car trips
61,200 trips
11,600 public transport trips
100% of public transport trips
Employer’s business trips 82,400 car trips
0% of car trips
2,500 trips
2,500 public transport trips
100% of public transport trips

Auckland Cycle Model
Model Development Report
12
Table 4: Trip Types Included in Pool of ‘Potential Cycle Trips’, 2026 Morning Peak Period
Trip Types
Total Trips
Proportion Included
Trips Included
Non home-based other
102,400 car trips
0% of car trips
5,600 trips
trips
5,600 public transport trips
100% of public transport trips
Medium/heavy
35,300 heavy commercial
No trips
0 trips
commercial vehicle trips
vehicle trips
Totals
878,000 trips
487,700 trips
(56% of all trips)
While trips associated with employers’ business may be an area where short trips could be made by
bicycle, the likely change is not considered to be significant compared to the other types of trips and
therefore for this modelling has not been included. Similarly, cargo bicycles may replace certain heavy
vehicle movements given appropriate future conditions, but this has been assumed not to be
significantly so.
The resulting future morning and evening period trip matrices include most of the car and public
transport person trips within the modelled area that might potentially convert to cycling. Their
likelihood of shifting to bicycle depends however on a number of factors, most significantly the distance
between each origin and destination, and the provision of cycle infrastructure between each origin and
destination.
5.3.3 Distance Conversion Factor
As noted above, the likelihood of each potential trip being converted to cycling will depend on the
distance between each origin-destination pair, with shorter trips being more conducive to cycling than
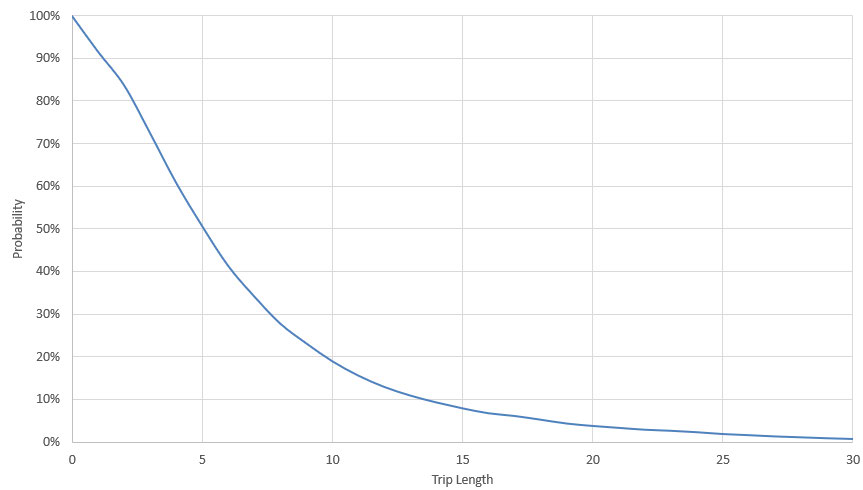
longer distance trips. To account for this, a trip length probability function has been applied to the future
potential cycle trips.
To estimate this underlying function, the census data trip length distribution has been converted to a
probability function, which is best illustrated by way of an example. Taking the census cycle trip length
distribution, 84% of cycle trips are of 2 km length or longer. It has been assumed then that 84% of trips
of length 2 km might potentially be converted to bicycle. Similarly, 72% of cycle trips are 3 km or longer,
so by extension a 72% conversion factor has been applied to each trip of 3 km length. This function is
shown in Figure 3.

Auckland Cycle Model
Model Development Report
13
Figure 3: Trip Length Probability Function
This process has been applied to the ‘potential trip’ matrices, based on the distance between each origin-
destination pair within the modelled network. This has in effect dampened down trips between more
distant pairs of zones, while trips between two very close zones have remained relatively unchanged.
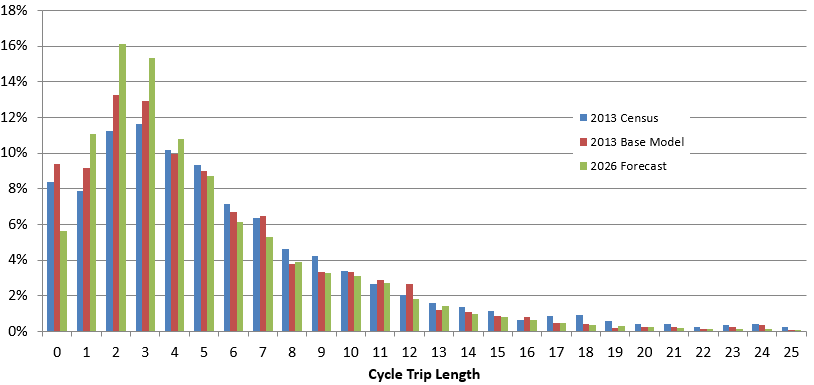
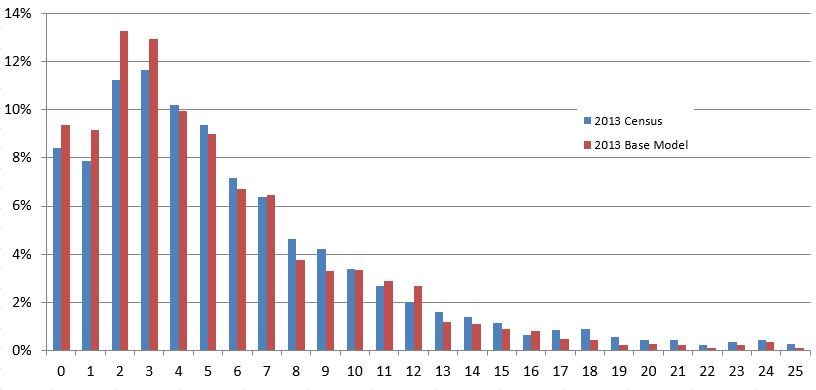
As a sensibility check, the final 2026 modelled morning period cycle trip length distribution has been
plotted alongside the 2013 census data in Figure 4 below. The comparison shows that the forecast 2026
trip length distribution follows the census data distribution appropriately.
Figure 4: Cycle Trip Length Distribution

Auckland Cycle Model
Model Development Report
14
5.3.4 Improvement Conversion Factor
An improvement conversion factor has been applied to the future potential cycle trip matrices. This
acknowledges that conversion from motorised modes to bicycle will only occur in areas where cycle
infrastructure is improved, either in terms of reduced cycle distance or improved Relative Attractiveness.
This conversion factor has been based on demand elasticity principles, and has been determined
according to Equation 3.
Equation 3: Improvement Conversion Factor
Change in distance
Change in average Relative
between O-D pair
Attractiveness between O-D pair
Improvement
(due to infrastructure
Relative
Distance
(due to infrastructure
Conversion
=
improvements)
x
+
Attractiveness
Elasticity
improvements)
x
Factor
Elasticity
Distance between
Average Relative Attractiveness
O-D pair
between O-D pair
Elasticity factors of 0.35 have been applied in relation to distance changes, and 0.65 in terms of Relative
Attractiveness changes. These factors were calibrated during the initial 2014 model build to result in
forecast demands that align with international research and result in a sensible long term mode share
should the full Auckland Cycle Network (ACN) be built. They were then recalibrated in 2016 against post-
implementation data from several major cycleway projects. This calibration process is documented
further in Section 5.3.5.
As a simple example, the route between a particular origin-destination pair may be 10 km long via a
minor arterial road without cycle infrastructure in 2013; this would correspond to a Relative
Attractiveness of 12 if applying the Relative Attractiveness scale documented in Section 3. If a new
dedicated cycleway of Relative Attractiveness 15 was built along this route, additionally shortening the
distance to 8 km, the resulting Improvement Conversion Factor would be 0.23, as shown below:
Equation 4: Example Improvement Conversion Factor
Factor = (10-8)/10 x 0.35 + (15-12)/12 x 0.65
= 0.23
Conversely, an origin-destination pair with an unimproved route (in terms of both distance and Relative
Attractiveness) would be assigned an Improvement Conversion Factor of zero.
In reality, trips between any given origin-destination pair will generally assign via a series of different
roads with varying levels of cycle infrastructure, and a weighted average of the Relative Attractiveness
along the route has been used to reflect this. This means that most origin-destination pairs are only
partially affected by improvements by a given project. As a result, most conversion factors applied to
the model are very low, typically in the order of 0.01 to 0.05.
This process has been applied to each origin-destination pair, resulting in non-cycle trips from the ART
model being converted to cycle trips only if that trip has been improved by new or improved
infrastructure. Further, the level of conversion is proportional to the degree of improvement on that
route (in terms of shortened distance, improved route attractiveness, or both).

Auckland Cycle Model
Model Development Report
15
5.3.5 Initial Development of Elasticity Factors
As documented above, elasticity factors of 0.35 and 0.65 have been adopted, with regard to changes in
route distance and Relative Attractiveness, respectively. The higher latter rate acknowledges that
improvements in route attractiveness (eg cycle route safety) are likely to have a greater impact on cyclist
demands than reductions in cycle distances. This reflects cyclists’ priorities for more safe cycle routes8,
and aligns with the fundamental premise of the model network build, which assumes cyclists are willing
to cycle somewhat greater distances in order to use a more favourable route.
The elasticity factors were originally developed for the evaluation of the Auckland Urban Cycleways
Programme (UCP) in 2015, and were set at 0.35 for distance and 0.75 for Relative Attractiveness. These
values were calibrated to result in sensible cycle demand predictions, and this calibration is documented
in the following section. It should be recognised that the current elasticity factor for Relative
Attractiveness of 0.65 results in more conservative demand estimates than those documented below
from the 2015 process. It should also be appreciated that the international experience referenced below
may no longer represent the most up to date research, as it did during the model’s early development
in 2015.
The first means of determining values for the elasticity factors compared the modelled effects of the
Auckland UCP to international case studies on the effects of cycle infrastructure improvements on cycle
mode share. Studies reviewed have included:
Research from 35 US cities with populations over 250,000, which concluded that every mile of
on road bicycle lane per square mile of city corresponds to a 1% increase in cycle mode share
among commuters9
In Montreal, improved cycle infrastructure investment including 67 km of separated cycle
facilities has been matched by a 35 to 40% increase in cycle use between 2008 and 201010
The Minneapolis Greenway project, which is an 8.8 km shared path on a former rail corridor
linking employment and residential areas, resulted in an 89% increase in cycle trips among
residents living within three miles, and a 33% increase among those living within six miles11
Sydney recorded a 132% increase in the number of cycling trips in the city centre, between 2010
and 2014, led by separated cycleway and shared path infrastructure improvements.
Table 5 below compares the outputs from the 2026 Auckland UCP model (relative to a 2026 Reference
Case without the Auckland UCP) with the relevant international study.
8 Auckland Transport Cycling Research, 2013 https://at.govt.nz/media/981846/AT-Active-Modes-Research-Report-
June-2013.pdf
9 Dill, J and Carr, T. Bicycle Commuting and Facilities in Major US Cities: If You Build Them, Commuters Will Use Them –
Another Look. Portland State University. 2003
10 http://old.cycleto.ca/protected-bike-lanes/safety-ridership
11
http://www.prnewswire.com/news-releases/study-shows-bicycle-friendly-city-infrastructure-in-us-significantly-
increases-cycling-to-work-by-residents-which-can-improve-health-of-locals-281451471.html

Auckland Cycle Model
Model Development Report
16
Table 5: Comparison of Model Outputs and International Experience
Measure
Modelled Outcome from 2026
International Comparison
Auckland UCP Model
0.16% increase expected if applying research from 35 US
cities where a 1% increase in mode share was seen for
every mile of bicycle lane per square mile of city. This
research is thought to underestimate the effects of the
Auckland
0.32% increase predicted as a
Project as it:
cycle to
result of the 28 km of Project
1) Relates to on-road cycle lanes, whereas the Project
work mode
infrastructure
generally consists of facilities separated from traffic
share
2) Represents the average effects of cycle infrastructure
across an urban area, whereas the Project is focussed
on the CBD, where a greater effect on mode share per
mile of bicycle facility can be expected.
Increases in 16% increase in cycle trips across
cycle trips
35 to 40% increase in cycle trips in Montreal, due to
the Auckland urban area
across
significant investment including 67 km of separated cycle
predicted due to the 28 km of
Auckland
facilities
cycle infrastructure assessed
urban area
51% increase in cycle trips
Local
predicted among origin-
89% increase in cycle trips among those living with three
increases in destination pairs with improved
miles of Greenway project, Minneapolis; 33% increase
cycle trips
routes (generally within 3 km of
among those living within six miles
infrastructure improvements)
City centre
51% increase in cycle trips
increases in
132% increase in cycle trips within Sydney city centre
to/from the city centre predicted
cycle trips
The second means of determining values for the elasticity factors involved developing a hypothetical set
of 2026 cycle demands that represent a scenario where a complete cycle network has been constructed
Auckland wide. This has been approximated by converting all urban arterials into routes with separated
cycle facilities, and it represents a network similar to a completed ACN. The resulting ACN demand set
resulted in an Auckland wide cycle mode share for commute to work trips of 6.5% (compared with 1.2%
in 201312). This is considered an appropriate, if conservative, estimate of Auckland’s long term cycling
potential, should a complete network be built (see comparator cities, following section5.3.6).
Finally, the model outputs were compared to the forecast reference case 2026 model demands across
SkyPath documented in the Transportation Assessment Report for this project13. This document gives
an annual demand for SkyPath of 1.385 million trips in its fifth year of operation, counting both cyclists
and pedestrians, corresponding to a daily average of 3,800 trips. Many of these trips are predicted to
12 New Zealand Census data
13 Traffic Design Group. SkyPath Transport Assessment Report. October 2014

Auckland Cycle Model
Model Development Report
17
be outside the commuter peaks however, and the SkyPath Patronage Research14 upon which SkyPath
demands are based on estimates that 60% of weekly SkyPath use will be on weekends, with weekday
making up 8% each. This 8% factor has been applied to result in a weekday daily demand on SkyPath of
2,130 trips. The SkyPath Transportation Assessment goes on to estimate that 85% of SkyPath users will
be cyclists, giving a total weekday daily cycle demand of 1,810 trips.
The elasticity factors assumed in the model have resulted in modelled 2026 demands on SkyPath of
1,840 weekday daily cyclists15, which agrees well with the estimated 1,810 daily cyclists derived from
the SkyPath Transportation Assessment.
A discussion on elasticity factors can be found in the US National Cooperative Highway Research
Program’s “Estimating Bicycling and Walking for Planning and Project Development: A Guidebook”. This
study refers to distance elasticities for cycling trips of between 0.41 and 0.75. These elasticities are
higher than the 0.35 applied to the Auckland Cycle Model, and would result in significantly greater
forecast demands if they were applied. The Guidebook offers no suitable elasticities for application to
route quality (ie Relative Attractiveness).
The elasticity factors and overall demand process have resulted in a maximum conversion of non-bicycle
mode trips to cycling trips of 29%. This has been achieved in the case of closely spaced origin-destination
pairs with the greatest improvement in distance and infrastructure. This ‘trader factor’ agrees well with
the Christchurch Strategic Cycle Model16, where a factor of 30% was applied, following a review of
international stated preference literature quoting factors between 9% and 80%.
5.3.6 Network Effects
It is important to recognise that the demand forecast process documented above is linear. For a given
cycle infrastructure improvement, say a cycleway, the demand process will generate a number of new
cycle trips, say x. For a second piece of connecting infrastructure, the demand process may generate y
new trips and if the two cycleways are assessed collectively, the demand process will generate x+y new
trips.
This differs from expectations however, where the effects of cycle network investment are thought to
be non-linear: the demand responses from incremental improvements to the cycle network are
expected to accelerate as the network approaches completion. This ‘network effect’ phenomenon is
related to the ‘safety in numbers’ and ‘critical mass’ effects, where increasing numbers of visible cyclists
encourage more users to take up cycling, and is documented by Macmillan et al (2014)17.
As such, provision of a complete cycle network would likely generate more new trips than the sum of its
individual parts, and the cycle demand elasticities are unlikely to be linear. Recognising this, a ‘Network
14 Angus & Associates. Patronage Research for the Auckland Harbour Bridge Pathway Project. June 2014
15 Applying a weekday Annual Daily Traffic (ADT) factor of 2.8 to the morning and evening peak period demands
(summed), based on automated cycle count data across six Auckland locations
16 Quality Transport Planning; Christchurch Strategic Cycle Model Background Report, August 2012
17 The Societal Costs and Benefits of Commuter Bicycling: Simulating the Effects of Specific Policies Using System
Dynamics Modelling;
Macmillan, Connor, Witten, Kearns, Rees and Woodward; April 2014

Auckland Cycle Model
Model Development Report
18
Factor’ has been applied to the demand elasticities documented in Section 5.3.4. This Network Factor
has been developed by:
Assessing the average Relative Attractiveness from each zone to all other zones with a cycle-able
distance of 5 km
Where the above average Relative Attractiveness is 12 or less, the Network Factor has been set
at 1.0 (ie. There are no network effects at this level of network development)
Where the above average Relative Attractiveness is 15 or more, the Network Factor has been set
at 2.0 (ie. Where all possible trips within a 5 km trip length from a given zone can be carried out
on ‘best practice’ cycle infrastructure, ‘network effects’ are assumed to apply to that zone)
For average Relative Attractiveness ratings of 12 to 15, a sliding scale has been used.
In practice, the above process has no effect on forecast cycle demands when applied to Auckland’s
existing cycle network, as there are no areas of Auckland where the average Relative Attractiveness
threshold of 12 to 15 is met. That is to say, the existing demand response to cycle infrastructure
investment in Auckland continues to be linear. Similarly, when evaluating individual future cycle
investment projects, such as SkyPath or the Glen Innes to Tamaki Drive cycleway, the Network Factor
has no effect. Only when evaluating a significant long term investment programme such as the
completed Auckland Cycle Network, does the Network Factor have an impact.
It has not been possible to calibrate the Network Factor process, as this is not a phenomenon currently
experienced on Auckland’s existing cycle network, and nor is it a process that has been well documented
internationally. However, when assessing a ‘complete network’ of ‘best practice’ cycle infrastructure
across the extent of Auckland (eg separated cycle infrastructure on all Auckland arterial roads), the
model predicts an approximate 14% mode share for cycle trips to work. In terms of comparator cities
against which this forecast may be benchmarked:
Christchurch has an existing cycle to work mode share of 7%18, despite having a far from
complete network
Portland has a comparable geography, climate and land use density and has a 6% cycle mode
share, with a target mode share of 25%19
Munich and Tokyo have comparable climates, partially complete cycle networks, and 17% and
14% mode shares20, respectively.
5.4 2016 Forecast Model Calibration
The initial development of the elasticity factors applied in the Auckland Cycle Model were developed in
2015, but subsequent modifications have been made to the process to better align the model’s
performance with observed trends. Chiefly among these, a model calibration process was carried out
in February 201721.
18 Sustainable Cities; Benchmarking Cycling and Walking in Six New Zealand Cities, Pilot Study; 2015
19 Portland 2035 Transportation System Plan; May 2018
20 Auckland Transport; Auckland Cycling Programme Business Case; 2017
21 Michael Jongeneel; Evaluating the Auckland Cycle Model; February 2017

Auckland Cycle Model
Model Development Report
19
In the three years since the network represented by the 2013 base model, a significant investment had
been made in cycle infrastructure in Auckland to the end of 2016, including the:
Grafton Gully and Beach Road cycleways
Westhaven Promenade
Nelson Street cycleway and Te Ara I Whiti (LightPath)
Carlton Gore Road protected/buffered cycle lanes
Improvements to the existing Northwestern cycleway
Upper Harbour Drive buffered cycle lanes
Mt Roskill Safe Routes
Dominion Road parallel cycle route
Quay Street cycleway.
The calibration process allowed outputs from the 2016 Auckland Cycle Model to be compared to post
implementation count data on the above routes, and others. In total, data was available from 21
automated cycle count sites across Auckland, providing 41 separate data points with which to compare.
The comparison sites included a mixture of new routes, improved routes, and routes that had remain
unchanged.
As a result of the forecast calibration process, three adjustments were made to the model process to
better align the model forecasts with the observed trends:
The Relative Attractiveness elasticity was reduced from 0.75 to 0.65
Evening peak period growth was dampened down by 10%
A new Relative Attractiveness category was applied to routes that have an exceptionally high
appeal to cyclists, such as LightPath.
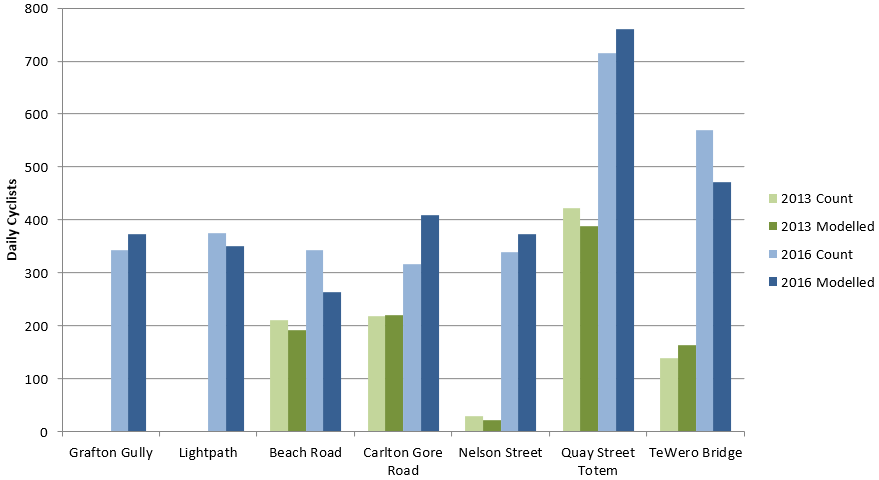
Figure 5 and Figure 6 show comparisons of the Auckland Cycle Model’s 2016 forecasts (after the
above adjustments were made) against the observed 2016 data, for new/improved routes and
unimproved routes, respectively. A comparison of 2013 observed and modelled cyclists is also
shown for completeness.

Auckland Cycle Model
Model Development Report
20
Figure 5: Observed vs Modelled Daily Cyclists, New and Improved Routes
The above comparison shows how daily cycle demands on Auckland’s improved cycle routes had
increased significantly between 2013 and 2016, with for example 300 more daily cyclists recorded on
Nelson Street after the completion of stage 1 of this facility. The model forecasts generally agree well
with these increases. In the case of the new routes, again the model agrees well with the observed data.
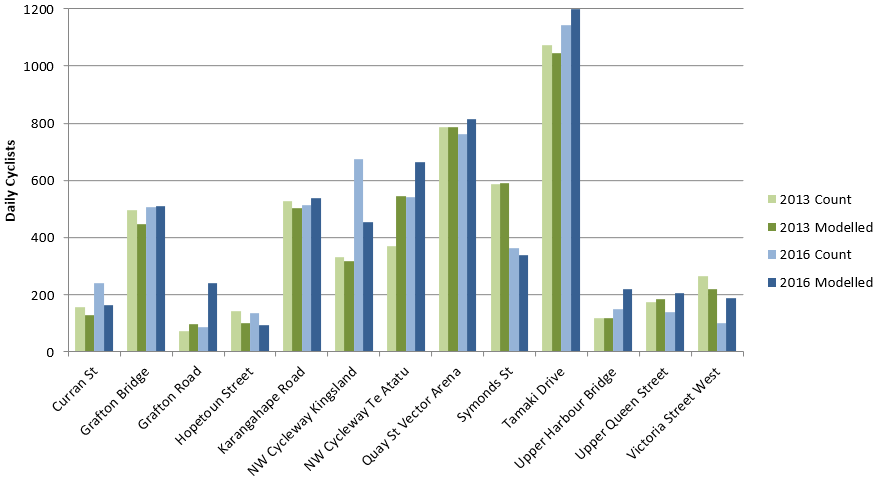
Figure 6: Observed vs Modelled Daily Cyclists, Unimproved Routes
In the case of the above routes that were not improved between 2013 and 2016, again the model
generally agrees well with the observed data. Notably in the case of Symonds Street where the

Auckland Cycle Model
Model Development Report
21
construction of the parallel Grafton Gully cycleway has resulted in a 38% reduction in daily cyclists, the
model has produced a comparable reduction.
A final stage in the 2017 model calibration was to compare the Auckland Cycle Model’s 2016 forecasts
to the two alternative existing methods of forecasting cycle demands. This comparison is summarised
below.
Table 6: Comparison of 2016 Cycle Demand Predictions – Three Methods (two-way, average annual daily cyclists)
Observed
2016 Auckland Cycle
Research Report 340
EEM Simplified
Route
Cyclists
Model
Procedures 11
(2016)
Cyclists
Error
Cyclists
Error
Cyclists
Error
Beach Road
343
263
-23%
392
+14%
1,158
+237%
Carlton Gore Road
317
410
+29%
423
+33%
1,067
+237%
Grafton Gully
344
373
+8%
465
+35%
1,660
+383%
Nelson Street
340
373
+10%
64
-81%
1,535
+352%
LightPath
375
351
-6%
248
-34%
1,594
+325%
Quay Street
715
761
-6%
628
-12%
956
+34%
Average Error
±14%
±35%
±261%
6 MODEL LIMITATIONS
The Auckland Cycle Model represents a broad range of cycle trip types including commuter trips, trips
to education (schools and higher education), shopping trips and ‘other trips’. This final trip type category
in particular will include some reasonable number of future recreational trips. However, the model is
unable to represent any significant future change in recreational use on key routes, such as those that
may be specifically drawn to future infrastructure such as SeaPath, SkyPath or improvements to Tamaki
Drive. While the daily effect of these recreational trips can be estimated by using an appropriate daily
cyclist factor (refer Section 3), the routes used by these recreational cyclists are unable to be accurately
forecast.
Similarly, while the fixed recreational routes that have been manually added to the 2013 base model
have been factored up to reflect forecast population growth, the model does not reassign these trips to
new routes following infrastructure change.
SkyPath in particular is expected to attract a very high proportion of both recreational and tourist trips,
with many of these trips taking place outside of the commuter peak periods. As a result, care must be
taken when factoring the commuter peak model outputs to generate estimates of daily demands on this
facility.
The model includes background growth in cyclist numbers reflecting both forecast population growth
and also future infrastructure improvements. It does not however predict other factors that may
influence road users’ future travel choices, such increasing general traffic congestion, fuel costs, road
pricing, or the impact of increasing uptake in electric bicycles.

Auckland Cycle Model
Model Development Report
22
The mode shift component of forecast cycle trips within the model are developed using person-trips
from the ART model. The zones within the ART model are relatively large and many short trips such as
trips to primary schools and to local shops will be intra-zonal trips in this regional model. These short,
intra-zonal trips will not be accurately represented within the Auckland Cycle Model, and consideration
should be given to manually evaluating these trips for projects where the focus is short trips to schools
or local destinations.
The ART model version on which the Auckland Cycle Model is based does not exclusively consider trips
to park and ride facilities; as a result, the current version of the Auckland Cycle Model will also exclude
possible short cycle trips to public transport. It should be noted however that a recent update to the
ART model (now the Macro Strategic Model, MSM) does incorporate car trips to park and ride facilities.
Should the Auckland Cycle Model be updated to reflect the MSM’s outputs, it too will incorporate these
trips accordingly (at least in the case where the public transport facility has a park and ride component).

Auckland Cycle Model
Model Development Report
23

Auckland Cycle Model
Model Development Report
25

Auckland Cycle Model
Model Development Report
Figure 10: Prior vs Post Estimation Trip Length Distribution, 2013 Evening Peak Period

Auckland Cycle Model
Model Development Report
30
Table 7: 2013 Morning Peak Pre-Estimation Matrix Sectors
North
West
Central
CBD
East
South
North
992
9
54
42
1
9
West
40
304
169
71
7
5
Central
9
46
1,611
722
36
83
CBD
0
7
31
36
0
0
East
0
0
49
11
137
45
South
0
2
75
10
28
215
Table 8: 2013 Morning Peak Post-Estimation Matrix Sectors
North
West
Central
CBD
East
South
North
1,043
10
42
47
0
3
West
13
281
143
43
1
0
Central
12
49
1,530
693
27
70
CBD
1
12
31
62
0
0
East
0
0
30
5
127
45
South
0
0
95
5
16
209
Table 9: 2013 Morning Peak Estimation Sector Changes
North
West
Central
CBD
East
South
North
51
1
-12
6
-1
-6
West
-27
-23
-26
-28
-6
-4
Central
3
3
-81
-29
-9
-13
CBD
1
5
-1
26
0
0
East
0
0
-19
-6
-10
-1
South
0
-2
20
-5
-12
-6

Auckland Cycle Model
Model Development Report
31
Table 10: 2013 Evening Peak Pre-Estimation Matrix Sectors
North
West
Central
CBD
East
South
North
565
37
9
0
0
0
West
8
284
43
6
0
2
Central
50
158
1,283
29
45
70
CBD
39
66
674
34
10
9
East
1
6
34
0
128
26
South
8
4
78
0
42
200
Table 11: 2013 Evening Peak Post-Estimation Matrix Sectors
North
West
Central
CBD
East
South
North
546
11
9
1
0
0
West
14
288
39
18
0
1
Central
41
144
1,255
60
27
93
CBD
47
34
585
56
1
2
East
0
4
16
0
123
17
South
4
0
65
0
38
197
Table 12: 2013 Evening Peak Estimation Sector Changes
North
West
Central
CBD
East
South
North
-20
-26
0
0
0
0
West
6
4
-4
12
0
-1
Central
-9
-14
-28
30
-18
23
CBD
8
-32
-89
23
-9
-7
East
-1
-3
-18
0
-5
-9
South
-4
-4
-12
0
-4
-3

Auckland Cycle Model
Model Development Report
32

Auckland Cycle Model
Model Development Report
34