Wellington City
Parking and Retail Spend
Dec 2021 analysis
Terms of Reference
• Thorndon
• Retail spend/parking (night, day, week, W/E)
• CBD
• Retail spend/parking (night, day, week, W/E)
• Clifton car-park
• Occupancy (Week and W/E)

Context
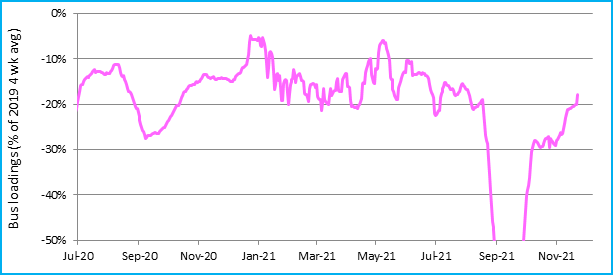
Public transport use
Z
e: GW
urc
So
• COVID-19 Lockdowns and health sensitivity
• High % are persistently working from home
Parking
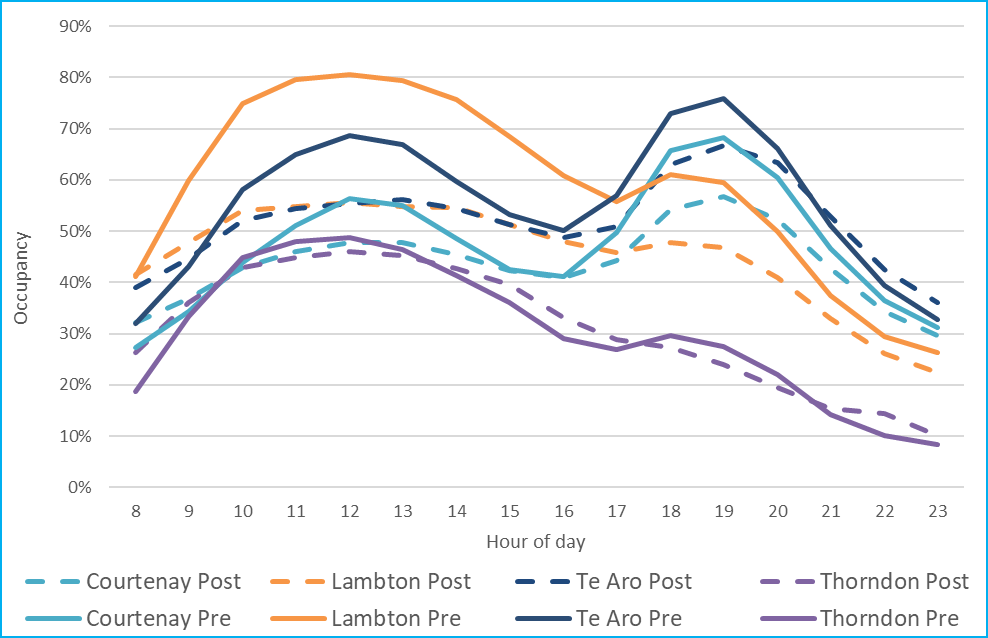
Occupancy: Pre vs Post tariff increase
• Background
• Compares July/Aug 2020(Pre)
with Jul/Aug 2021 (Post)
• Lambton and Thorndon are
mid-morning intensive
• Te Aro and Courtenay are
afternoon intensive
• Change in occupancy
• Thorndon grows!
• Rest decline by 15%-5%
• Lambton has the largest decline
Source: WCC
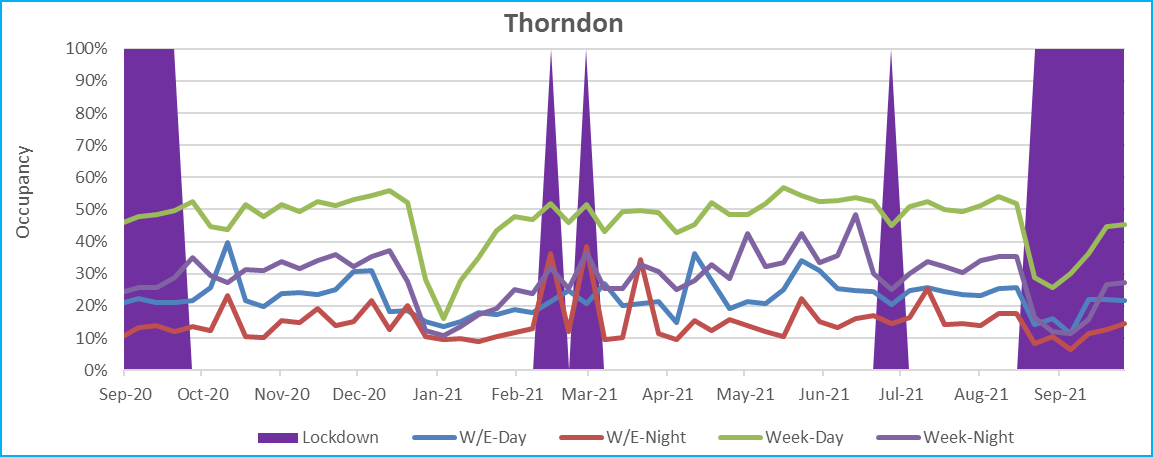
Thorndon
C
C
W
ce:
Sour
• Low occupancy (especially at W/E)
• No decline post July
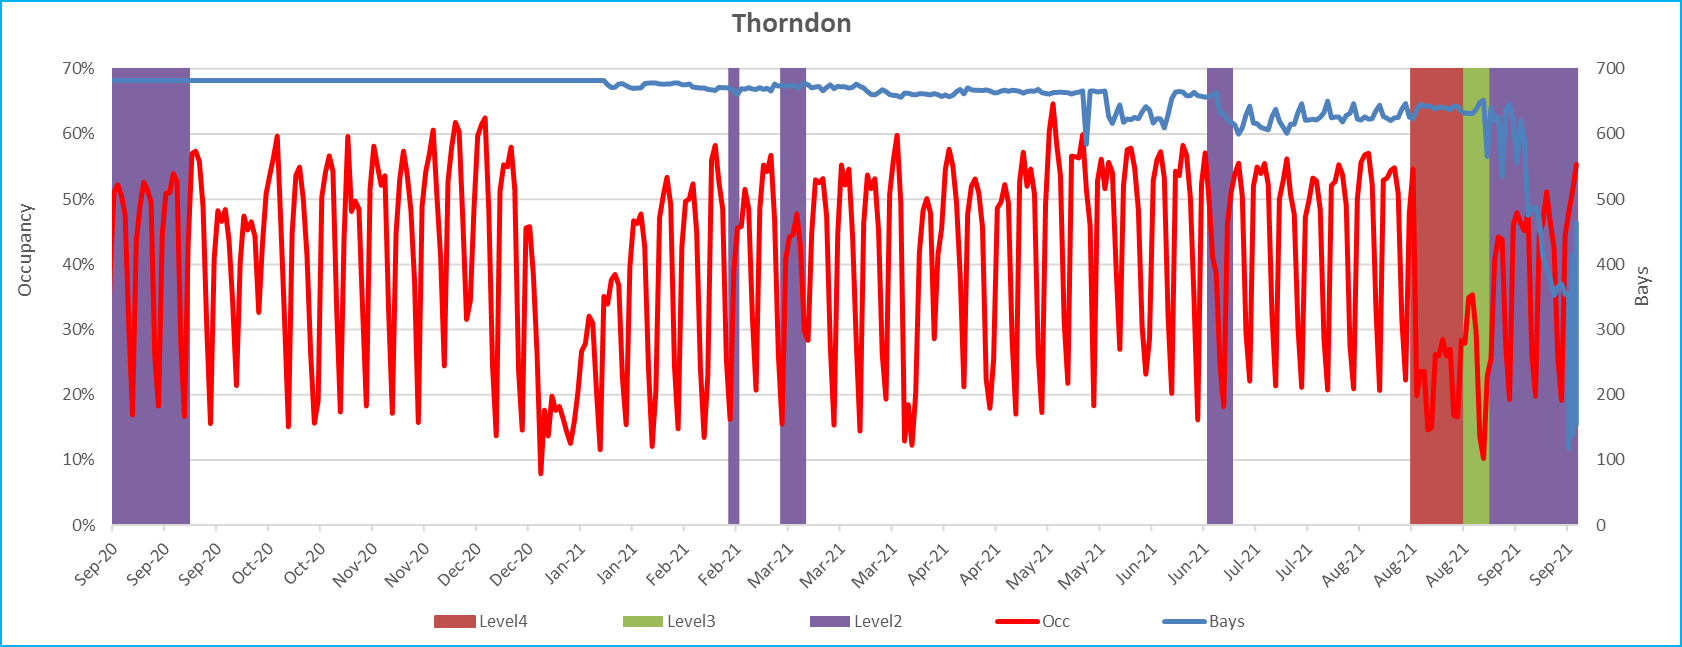
Thorndon loss of bays
C
C
W
ce:
Sour
• Stable occupancy July to Aug
• NOTE: Loss of bays (-15%) in Sep PLUS increase in occupancy
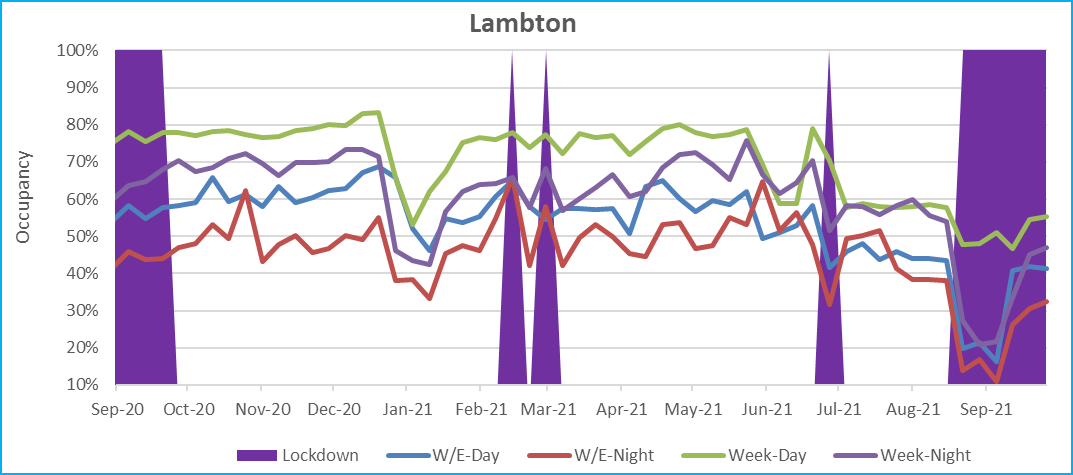
Lambton
C
C
W
ce:
Sour
• High occupancy in day
• Dramatic decline post July
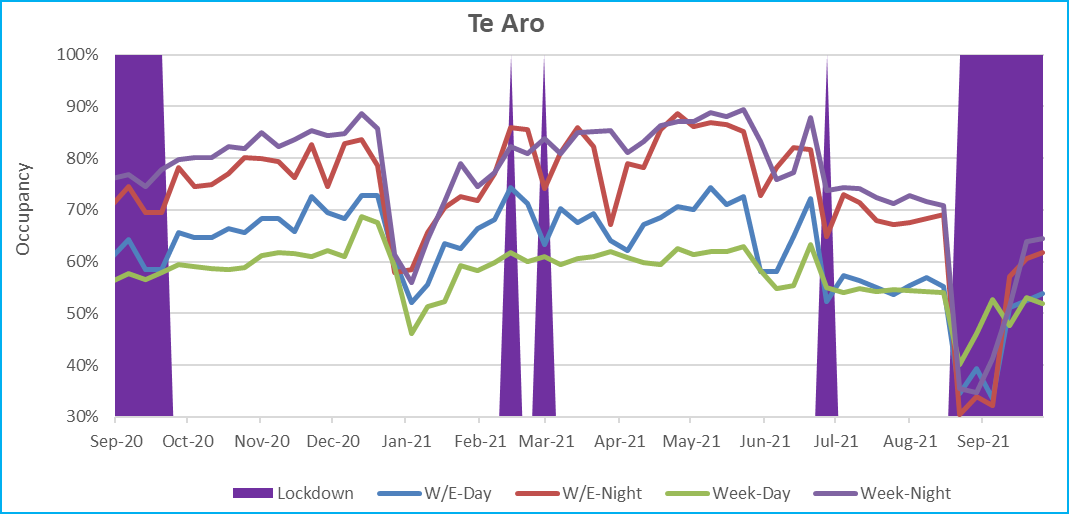
Te Aro
C
C
W
ce:
Sour
• High occupancy in day and night
• Dramatic decline post July
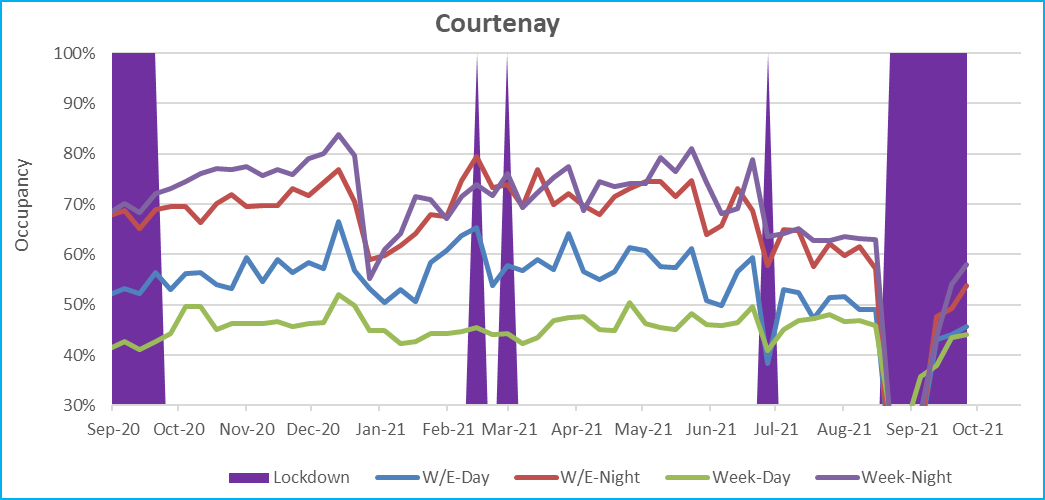
Courtenay
C
C
W
ce:
Sour
• High occupancy at night (week and W/E)
• Dramatic decline post July
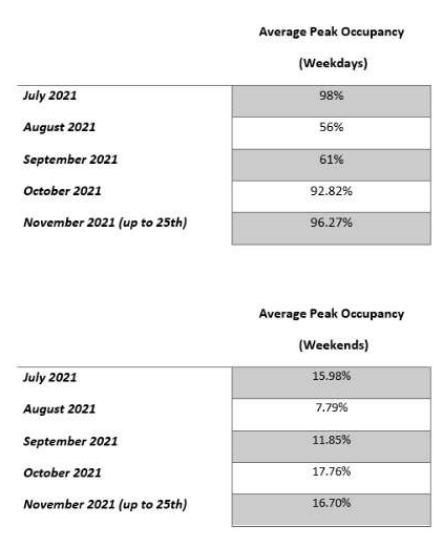
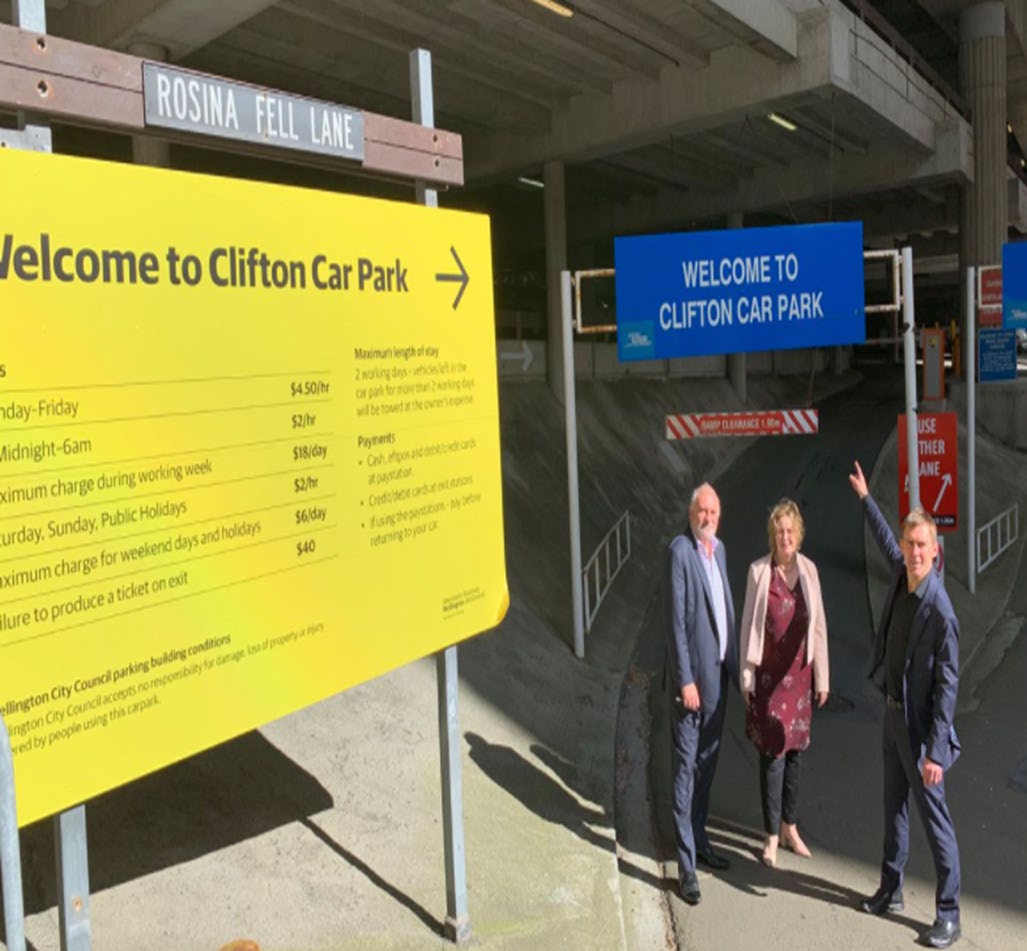
Clifton carpark
C
C
W
ce:
Sour
• Week:
Full (95%+ post-Lockdown)
• W/E:
Underutilised (16%)
Parking summary
• Context
• City wide car-parks:
• 3,200 (approximately) WCC control ed carparks
• 23,000 total car-parks (private + public)
• Public parking charges increased:
• 50c/hour for al tariffs on July 5th 2021 (i.e. 20% increase during W/E)
• Weekend hours went from 8am-6pm to 8am to 8pm
• Observed trends
• CBD occupancy dropped approximately 15% post-tariff change
• Thorndon
• 2% increase in occupancy post-tariff change
• Reduction in bays increases occupancy in Sep+ 2021
• Lockdown delays expected ‘recovery’ after tariff increase
• There is anecdotal evidence that occupancy drops as tariffs are increased, but then return to normal after
around 6 weeks
Retail and Hospitality
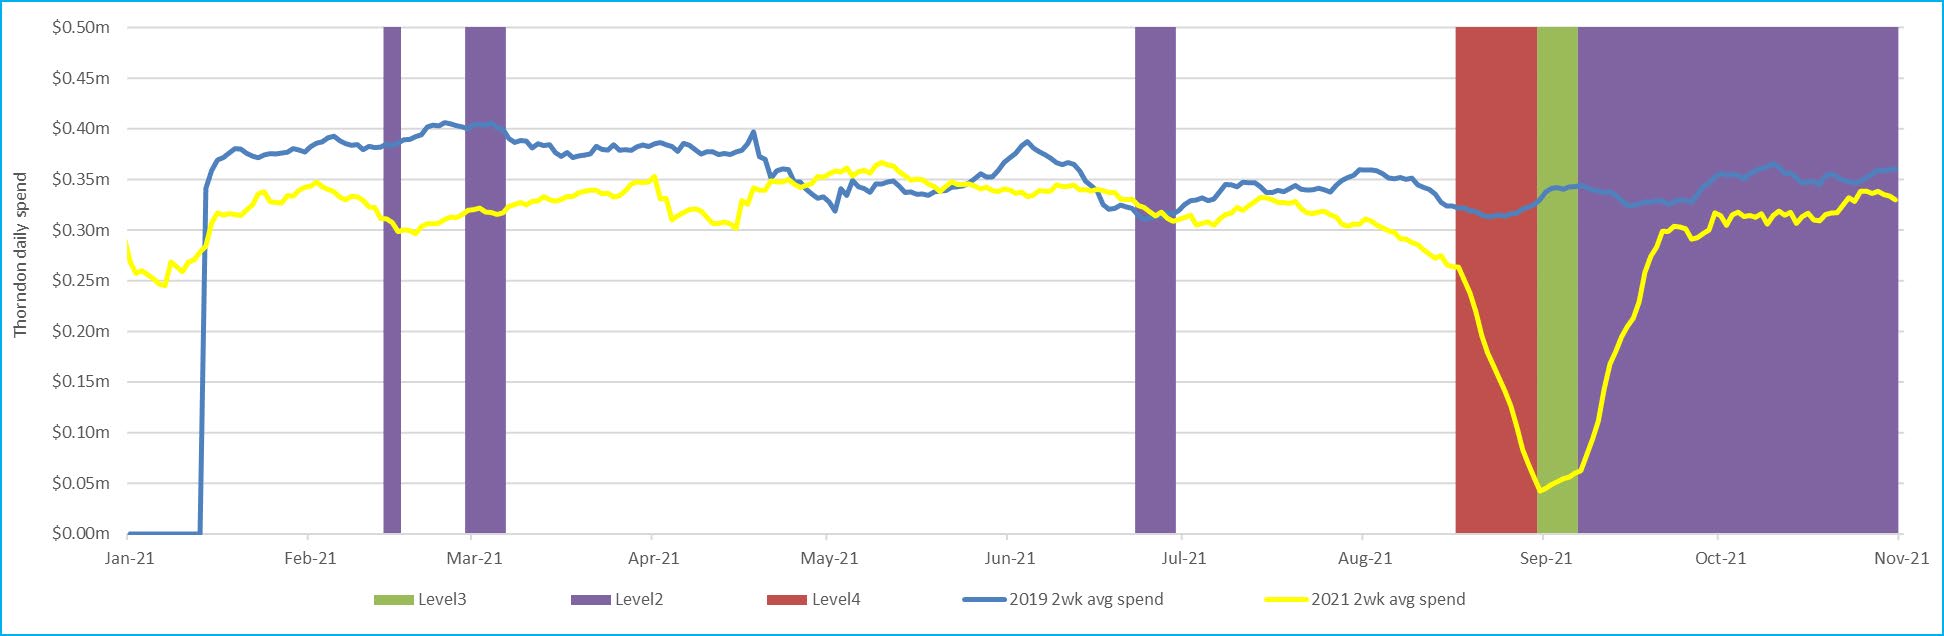
Thorndon: spend by day (8am-6pm)
View
ket
ar
M
ce:
Sour
• Spend is $0.35m average
• Trend: declines Jul/Aug but recovers in Oct (despite changes to parking)
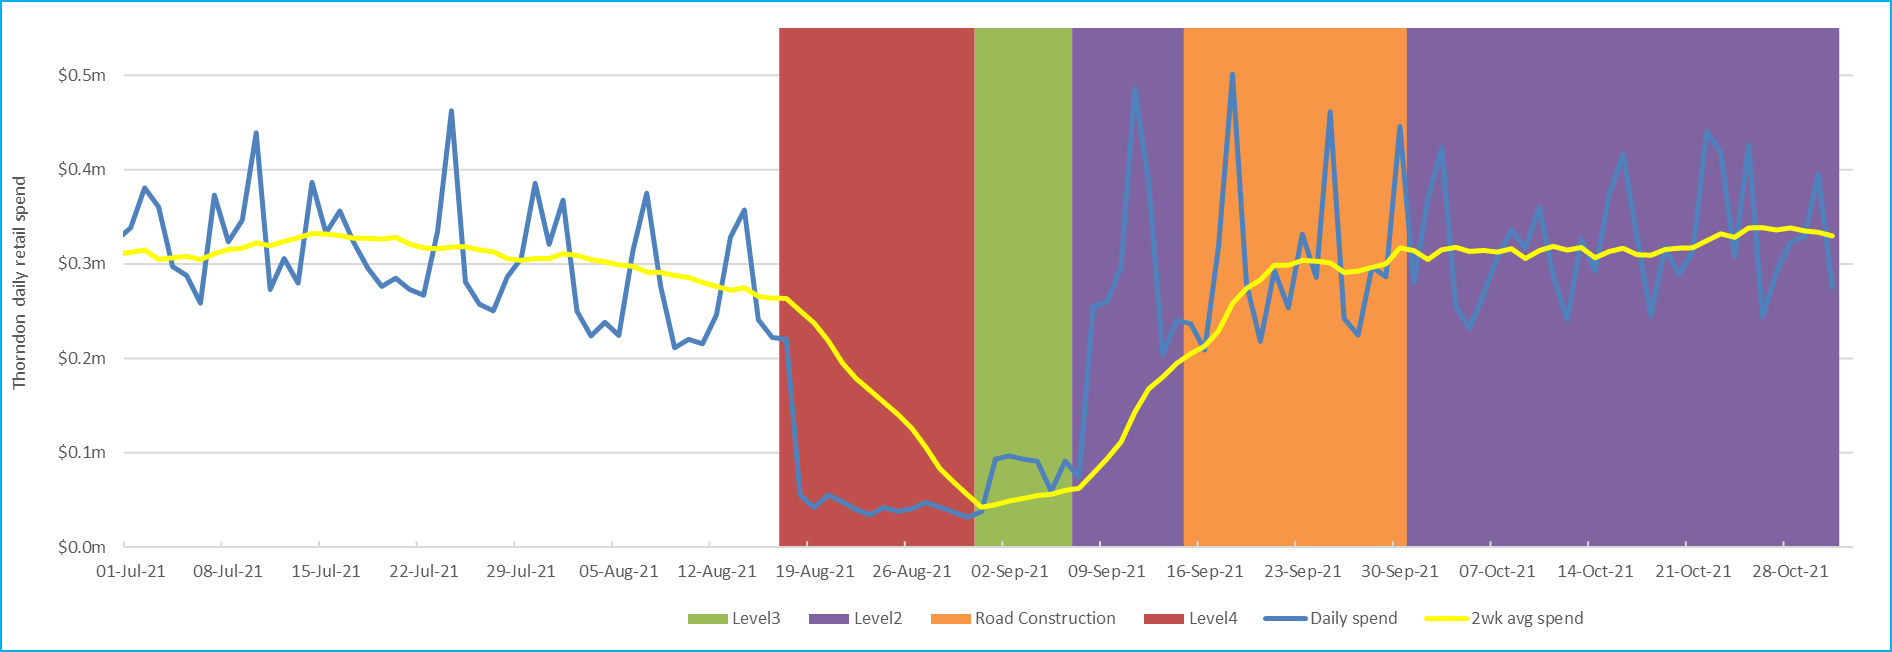
Thorndon: spend by day (8am-6pm) detail
View
ket
ar
M
ce:
Sour
• Road construction to convert angle bays to parallel
• Bounce in spend post-Level4/3 lockdown
• Consistent with home/hardware nature of merchants (consumer travel budget being spent on home improvements)

CBD: spend by day (8am-6pm)
View
ket
ar
M
ce:
Sour
• Daily spend of $2.5m
• Trend: post-lockdown not quite recovered (WfH + lockdown anxiety?)
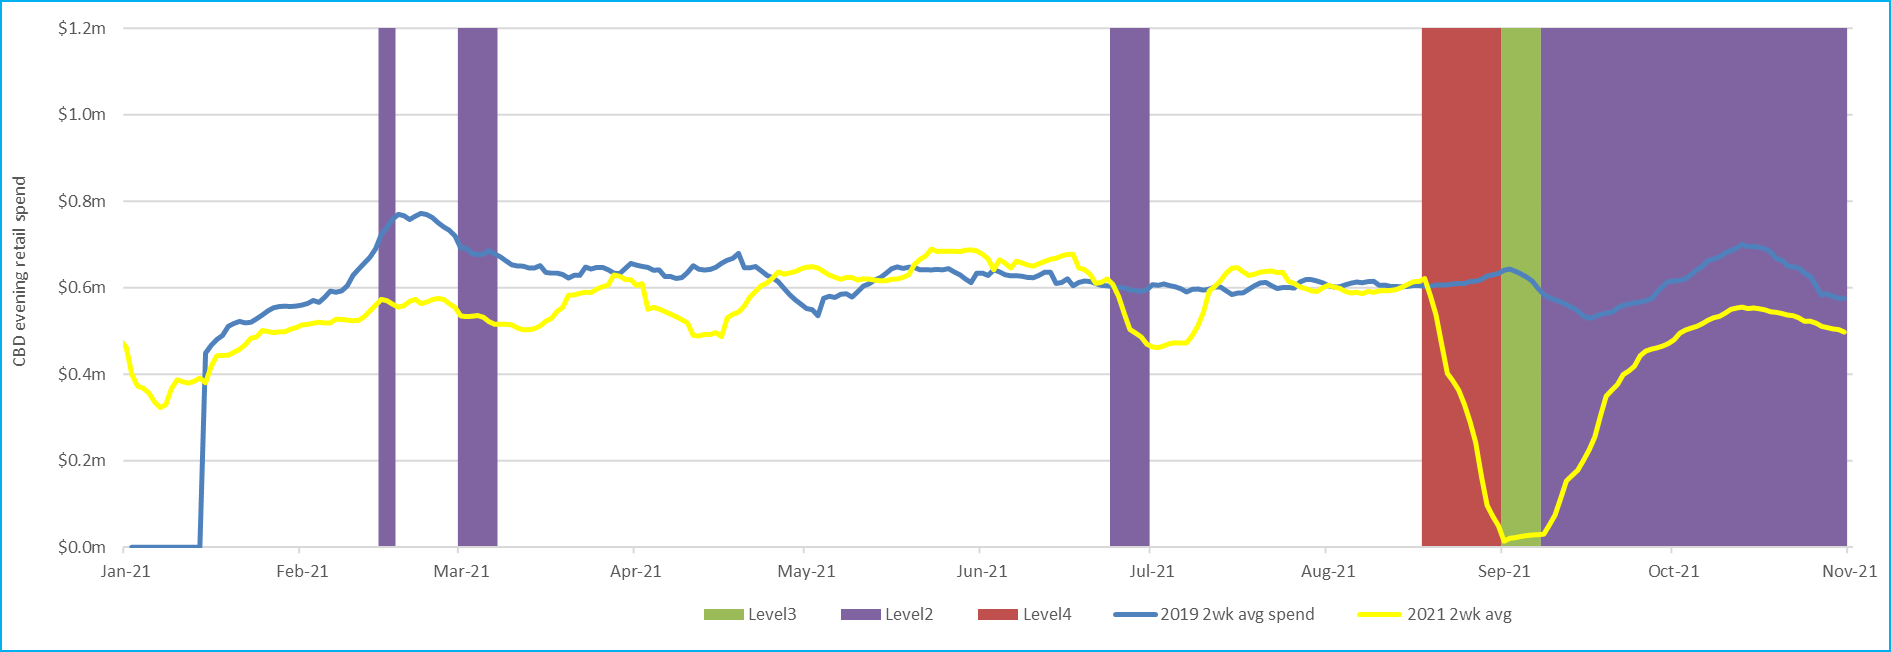
CBD: spend by night (6pm-10pm)
View
ket
ar
M
ce:
Sour
• Daily spend of $0.6m average
• Trend: similar to day spend
Retail summary
• Retail+hospo excludes groceries and fuel
• Recovering to 2019 levels prior to latest lockdown
• Change in spend brought on by
• COVID-19 lockdown
• Working from Home (WfH)
• CBD foot-fal down by 15%+
• But spend is not down by the same factor
• Online spend increase
• Increases in apparel and groceries by approximately 10%
• Parking is a small cost in the overall CBD Experience
• I.e. the average merchant spend is $40 per transaction
• The typical consumer has many transactions in their visit
CBD parking and retail (final thoughts)
• Working from Home
• Likely to be persistent
• Likely to reduce demand for parking and to some extent CBD spend for retail/hospo
• Parking occupancy
• Lockdown: has had a significant impact
• Tariff changes: too early to tell the long-term impact due to COVID-19
Document Outline