
COMMERCIAL IN CONFIDENCE
FEASIBILITY STUDY
Opportunities for Export Log Movement on Rail in
Taranaki -Whanganui
June 2020
1 | © KiwiRail
Opportunities for Export Log Movement on Rail in Taranaki-Whanganui
link to page 3 link to page 5 link to page 6 link to page 7 link to page 12 link to page 16 link to page 21 link to page 21 link to page 22 link to page 25 link to page 28 link to page 29 link to page 29 link to page 29 link to page 31
COMMERCIAL IN CONFIDENCE
Opportunities for Export Log Movement on Rail in Taranaki-
Whanganui
CONTENTS
1.
Background .................................................................................................. 3
2.
Logs on rail ................................................................................................... 5
3.
Taranaki- Whanganui forestry - currently ..................................................... 6
4.
Future sources of logs in Taranaki-Whanganui ............................................ 7
5.
Resources needed to transport logs by rail ................................................ 12
6.
Potential rail log hub sites .......................................................................... 16
7.
Estimates ................................................................................................... 21
8.
Haulage costs ............................................................................................ 21
9.
Externalities: costs borne by the communities ........................................... 22
10.
Stakeholders .............................................................................................. 25
11.
Risks .......................................................................................................... 28
12.
Summary .................................................................................................... 29
13.
Conclusions ................................................................................................ 29
14.
Recommendations and next steps ............................................................. 29
Appendix 1: Stakeholder Engagement ................................................................. 31
2 | © KiwiRail
Opportunities for Export Log Movement on Rail in Taranaki-Whanganui
COMMERCIAL IN CONFIDENCE
1. Background
The purpose of this report is to investigate the feasibility of establishing a log handling facilities and
rail services for logs in Taranaki. Its conclusion is that there is scope for such rail services in
Taranaki. It recommends that KiwiRail confirms a site at Waverley, and that it works with forest
owners to confirm its viability, and develops detailed operational plans. KiwiRail should apply to the
Provincial Growth Fund for funding to develop the hub.1
Haulage of logs is a significant part of the total freight task in New Zealand. The National Freight
Demand Study 2017/182 shows that in that year they made up 13% of the total tonnes hauled, and
14% of the total net tonne kilometres.3 Rail’s share of that log market was 10% (in ntkm). Then rail
carried 3.2m tonnes of logs, principally in the Bay of Plenty, and generated 423m ntkm.
The volume of logs cut has risen significantly since the second NFDS in 2012, and so has log
transport. As a result of past planting patterns, the so called “wall of wood” is now with us. The NFDS
shows a plateau of log availability until 2032, followed by a 10 year decline before newer plantings
become available (see Figure 1).
Figure 1: 2015 Wood availability forecast by region.
40.0
Southland
35.0
Otago
s) 30.0
Canterbury
e
n
n
West Coast
to 25.0
(m
TNM
st
e 20.0
Wellington
v
ar
h
Manawatu
g 15.0
o
Taranaki
tal l 10.0
To
Hawke’s Bay
Gisborne
5.0
Bay of Plenty
0.0
Waikato
2017
2022
2032
2042
2052
Source: Ministry of Transport, National Freight Demand Study 2017-18 (“NFDS 3”), Fig 7.5, p 84
Note that there is no growth in the years after 2042 in the Manawatu - Whanganui and Taranaki
regions. The data in Figure 1 for these regions is shown more clearly in Figure 2.
1 See further detail in Section 12.
2 Ministry of Transport,
National Freight Demand Study 2017-18, (NFDS3)
3 Based on an unpublished estimate of 40.08 bn ntkm of logs
3 | © KiwiRail
Opportunities for Export Log Movement on Rail in Taranaki-Whanganui
COMMERCIAL IN CONFIDENCE
Figure 2: Wood availability in western NI
Taranaki, Whanganui-Manawatu wood availability
3.0
2.5
2.0
m,s 1.5
e
Manawatu-Whanganui
n
n
Taranaki
to 1.0
0.5
0.0
2017
2022
2032
2042
2052
Source: R Paling, inputs to NFDS3, Fig 7.5
The Manawatu-Whanganui region is large in area, and its average figures may not represent the
specific pattern in the Whanganui District, part of which is the source for the logs that would use a
south Taranaki log hub. The Whanganui patterns will be discussed below.
The wood availability figures are however based on plantings and growth; harvest levels can vary
for several years around the availability date, to match demand and the availability of harvesting
resources. This is illustrated in Figure 3.
Figure 3: Alternative log harvesting scenarios4
60000
Scenario 1
Scenario 3
50000
Actual
40000
NFDS forecast
3
m 30000
000
20000
10000
0
14
16
18
20
22
24
26
28
30
32
34
36
38
40
42
44
46
48
50
52
20
20
20
20
20
20
20
20
20
20
20
20
20
20
20
20
20
20
20
20
Source: NFDS3, Fig 7.4, p 84.
Most of the increased log movement during the period will be for export, with exports falling off even
more sharply in the 2030s, as preference is given to supplying local processing plants. The current
4 ”Scenario 1” and “Scenario 3” are scenarios from the MPI Wood Availability Forecasts. There are 4 scenarios in this report, and
Scenario 1 was chosen in the NFDS as an unconstrained scenario, when the smaller forest owners are assumed to harvest their
forests when these reach an optimum age, and scenario 3 as a more stable one constrained by harvesting and transport
resources. See NFDS3, above n 2, pp 81-82
4 | © KiwiRail
Opportunities for Export Log Movement on Rail in Taranaki-Whanganui
COMMERCIAL IN CONFIDENCE
growth in log exports is the difference between a rapidly increasing harvest and a relatively constant
local demand.5 While the balance between exports and local demand is also influenced by price, it
is expected that at least major plants will still need supply and their willingness to pay will reflect
that.6
The current wood availability is driving new value-add processing such as is proposed at Marton,
which is likely to have a longer planning horizon that 2032 and so will expect to be supplied in the
lower-volume years.
KiwiRail has opened new locations for log haulage in recent years, especially in the southern North
Island7 and could open more with the increase in log availability. These have shown substantial
growth, and one has had to be extended. One of the new areas currently and with significant growth
potential is Taranaki-Whanganui.
2. Logs on rail
Rail has had extensive experience in hauling logs in many parts of the country throughout its history,
with significant recent growth. In the year ending 30 June 2019 it hauled 3.6 million tonnes of logs,
principally in the Bay of Plenty, but also to the ports of Napier, Wellington, and Lyttelton. Most logs
hauled by rail are for export.
Table 1: Logs by rail in 2018-19
Route
Tonnes (m)
Waikato and Bay of Plenty to Tauranga
2.759
Southern North Island to Napier and
0.740
Wellington
West Coast to Lyttelton
0.064
Other
0.043
Total
3.606
Source: KiwiRail
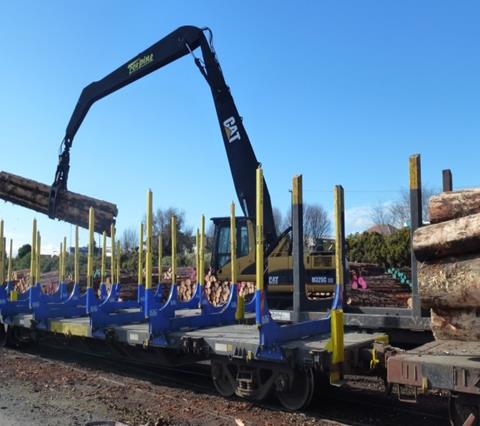
For most flows outside the Bay of Plenty KiwiRail has been using former 50ft container flat wagons
converted to log wagons by the addition of cradles.
They will be replaced with new container wagons fitted with
“cassettes”8 and cradles, the FIH class. These can carry up to 52.5 tonnes of logs, but they are likely
to be limited to one truck and trailer load, 32t,9 to enable log traceability, at least initially. 32t tonnes
is the load per wagon assumed in this study. These wagons and cassettes are underway and are
expected to be delivered during 2020.
5 NFDS3, above n 2, Figure 4.5, p 15
6 Local supply will also be encouraged under the Forest (Regulation of Log Traders and Forestry Advisers) Amendment Bill,
currently before the House.
7 Waingawa (Masterton) 2012, East Town (Whanganui) 2015, Feilding 2020 and Wairoa 2020.
8 Bases to adapt cradles and cradle spacing to the standard container twistlocks on the wagon, and to provide walkable decking
for scaling etc.
9 Typical HPMV log load
5 | © KiwiRail
Opportunities for Export Log Movement on Rail in Taranaki-Whanganui
COMMERCIAL IN CONFIDENCE
3. Taranaki- Whanganui forestry - currently
Within the southern North Island forest group are substantial flows of logs already moving from
Whanganui to Napier and Wellington, totalling 112,400 tonnes in 2018-19.10 These logs are loaded
at KiwiRail’s forestry hub at East Town (Whanganui)11, and move on daily trains to the respective
ports, in equal volumes to each of them. Since September 2019 a new route from East Town to New
Plymouth has been established, with relatively low volumes.12
The growth in forestry in the Whanganui District and Taranaki Region in the next three years and
beyond offers the potential to substantially grow this business.
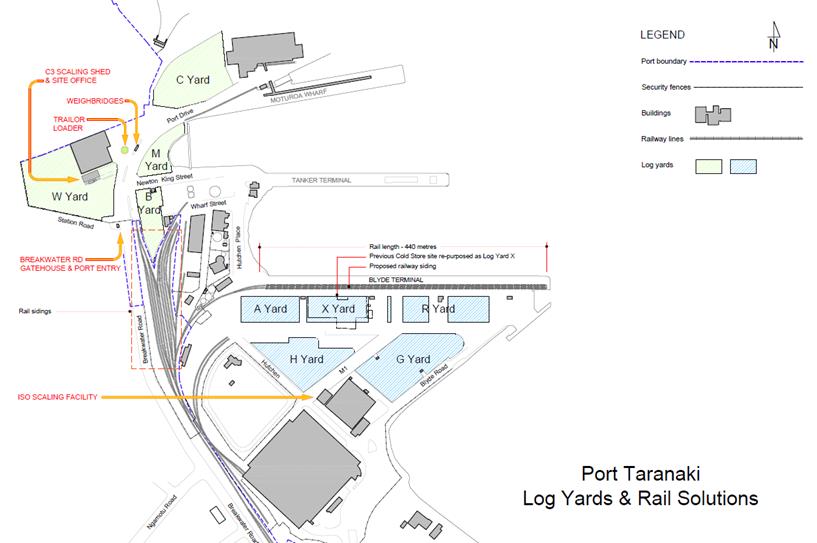
Movement of logs through Port Taranaki has grown strongly in recent years.
Table 2: Export Logs via Port Taranaki
Calendar Year
Export logs (tonnes)
2013
295,998
2014
232,896
2015
280,735
2016
406,439
2017
593,522
2018
785,183
2019
881,879
Source: Statistics NZ International trade data, commodity 4403. 2019 is provisional.
The proportion sourced from the Whanganui area is currently about a third. This is likely to grow as
Port Taranaki is closer to Whanganui than is Napier or Wellington.13 Port Taranaki has re-organised
its Blyde Wharf to cope with the log traffic,14 and has adequate room and facilities to handle the
growth in logs. However, when there are two ships on the berth, rail operations impede loading and
have to cease. An expansion of the adjacent rail grid, to separate rail and shipping, is part of this
proposal.
Only a small fraction of these logs have so far been carried to Port Taranaki by rail; up to September
2019 all came by truck, and most continue to do so. There is thus an opportunity for rail to increase
its share of the trade. The forest distribution in the region (see map, Figure 4 below) indicates that
virtually all of these logs would have been hauled through New Plymouth to get to the port, and
through other communities as well.
Local communities are concerned with the disruption that significant logging truck movements are
likely to cause, to amenity values like safety and environment, including greenhouse gases, to
congestion, and to the impact on local road maintenance.15 These “externalities” are not borne by
the log owner or transporter, but by the community as a whole. Haulage by rail will avoid having log
trucks pass through some urban areas, particularly central New Plymouth. The externalities are
quantified later in this report.
10 The remainder of the southern NI logs in Table 1 move from Palmerston North and Waingawa.
11 See Figure 12.
12 6 wagons/day pre Covid-19
13 Port Taranaki is 171km from East Town by rail, Napier 237km, and Wellington 220km.
14 “New daily log service to Port Taranaki”,
Taranaki Daily News 7 October 2019
15
Taranaki Daily News, above n 14.
6 | © KiwiRail
Opportunities for Export Log Movement on Rail in Taranaki-Whanganui
COMMERCIAL IN CONFIDENCE
KiwiRail’s experience in hauling logs is that it is difficult to be competitive with road transport over
distances below about 75km by rail. For both road and rail haulage, the logs are taken out of the
forest by truck, up to 50 km from the rail transfer point. Rail is competing against the marginal cost
for a truck to continue its journey to the port. In addition there are transfer costs for rail, but not road,
which are independent of distance, and thus form a greater proportion of the cost of short distance
journeys.16
That means that the logs from New Plymouth District are unlikely to be hauled by rail, but some in
the Stratford and South Taranaki Districts could be. A distance of 75km from Port Taranaki includes
the Marton-New Plymouth line as far south as Normanby; and the Stratford-Okahukura line
(currently mothballed) as far inland as Huiroa.17 Any movement of logs sourced north or west of the
75km line on Figure 4, and as well forests near that line, is not likely to be competitive by rail. All of
the Whanganui District is well beyond 75km from a port. Even at distances beyond 75km, the margin
over road is slender, especially if the cost of establishing a terminal has to be included.
4. Future sources of logs in Taranaki-Whanganui
The likely sources of logs that are open to rail haul are in 3 groups: the Te Wera forest inland from
Stratford; the southern South Taranaki District and the western part of Whanganui District; and the
eastern part of Whanganui District.18 A further 240,000t pa from the Taumarunui area could move
to Port Taranaki by rail if the Stratford-Okahukura line was reopened fully, but this traffic is outside
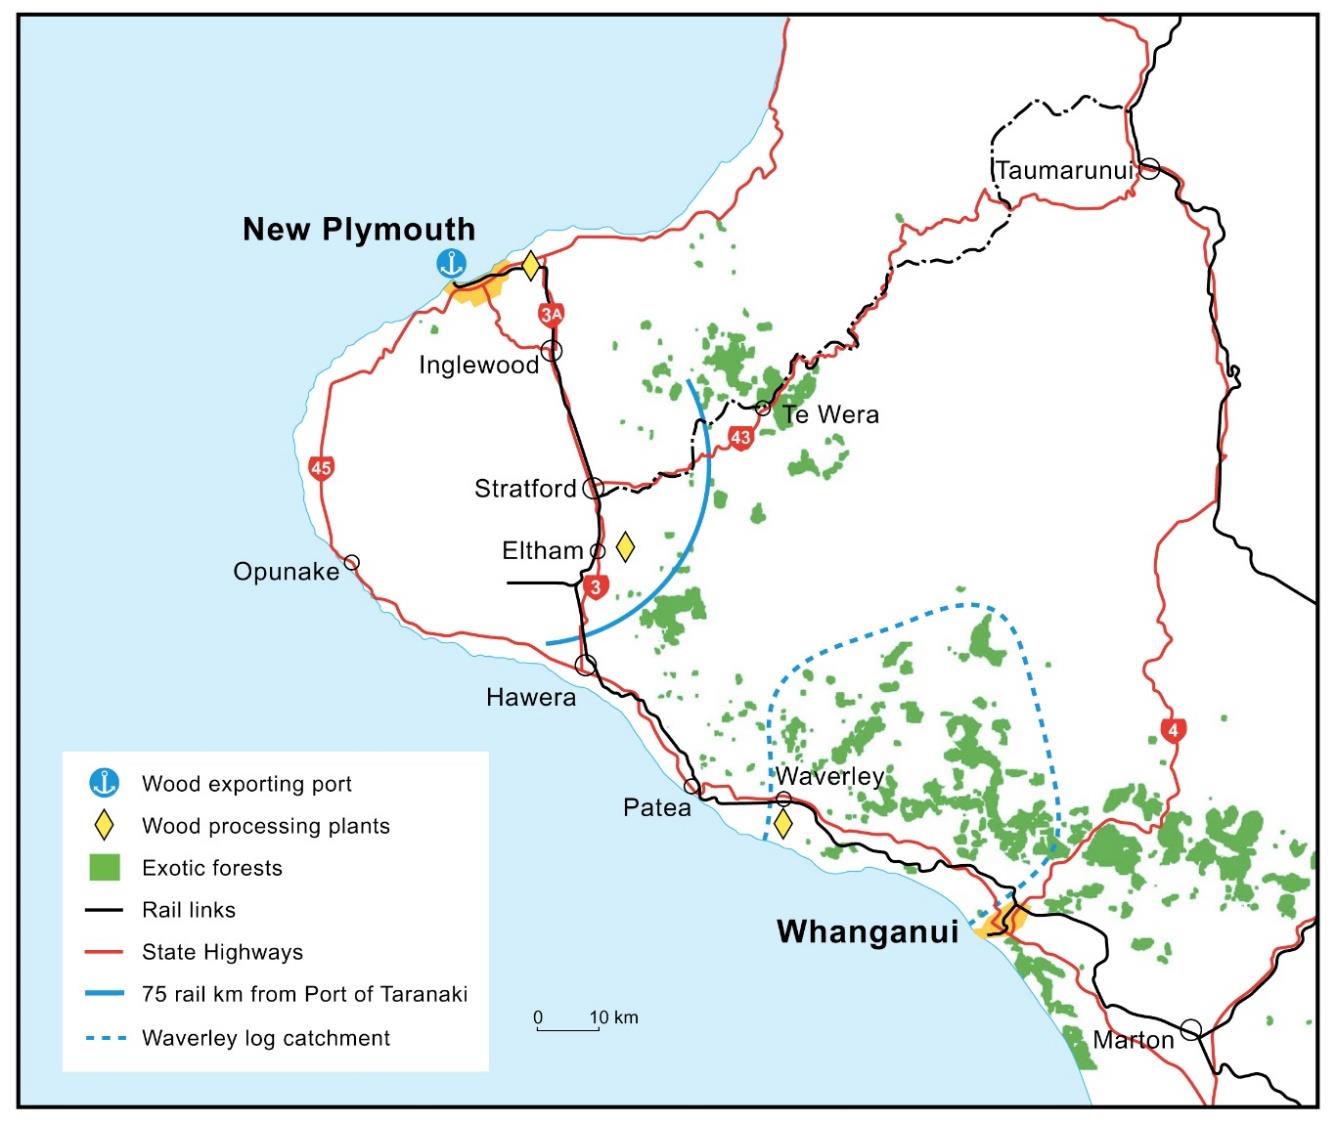
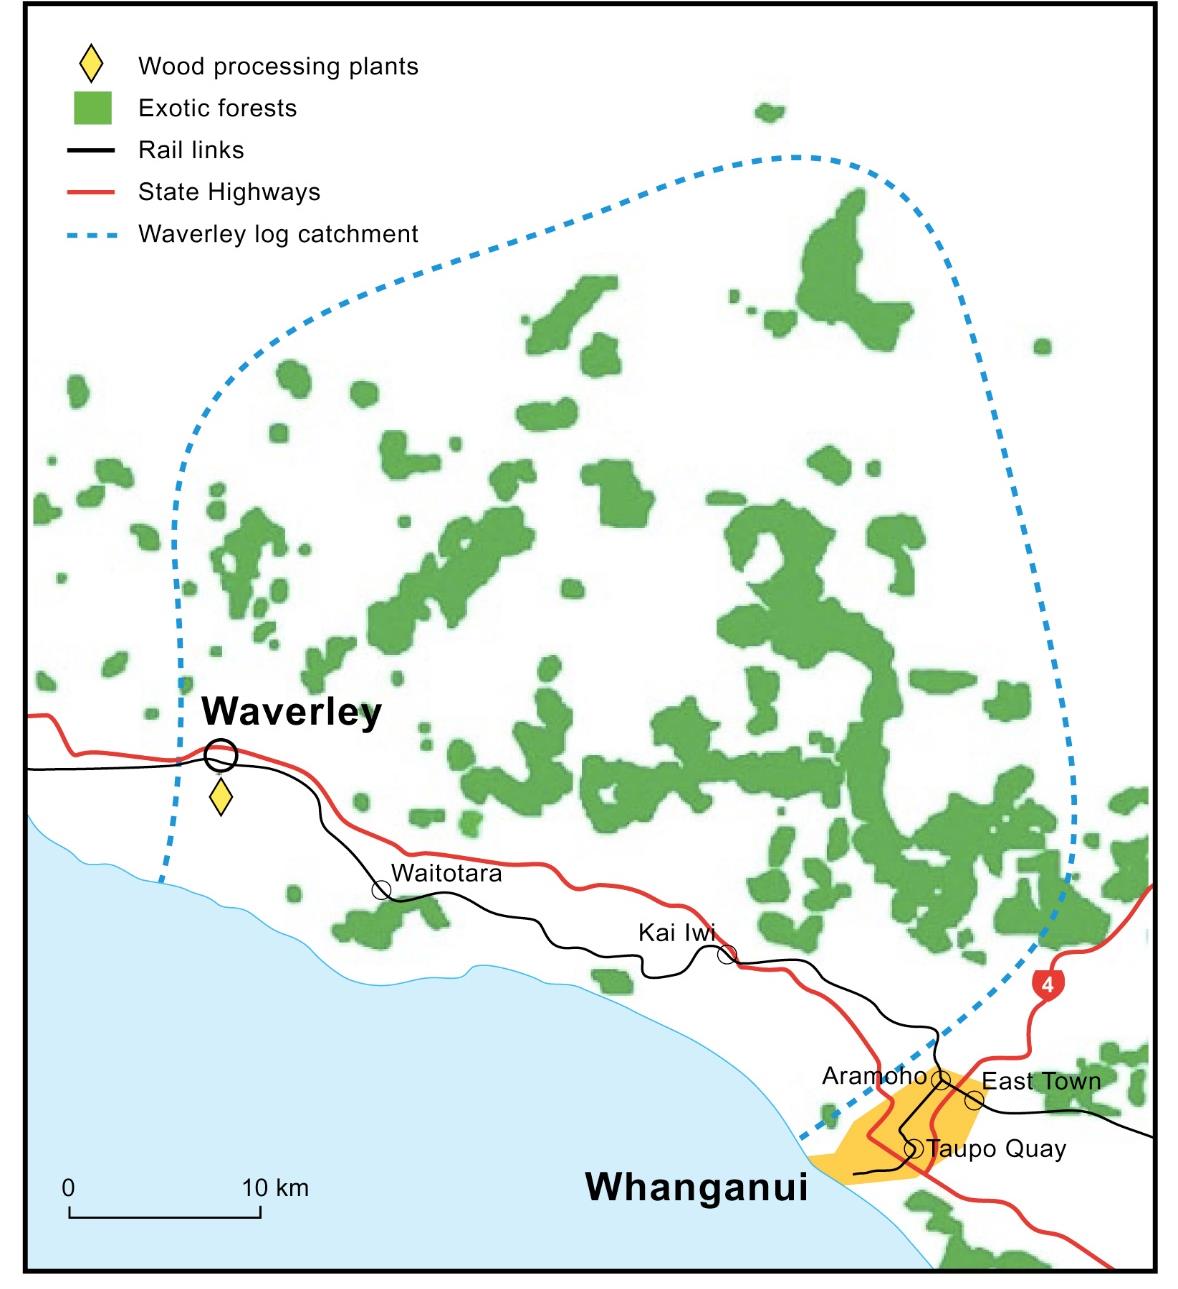
the scope of this report. Figure 4 shows the location of exotic forests in Taranaki-Whanganui, rail
lines, and 75km from the port by rail. It also shows the estimated catchment area for a Waverley log
loading point.
16 See also Figure 16. The shortest rail haul for logs in New Zealand at present is Kawerau-Mt Maunganui, 84km. This is however
an easily graded route which allows highly efficient trains of 2400t gross each (potentially about 1700t of logs, or 53 truck and
trailer loads.)
17 75km by State Highway extends slightly further, to Hawera and Strathmore respectively
18 The division of Whanganui into two groups is to identify those logs that would be more effectively served by a western
Whanganui log yard. The dividing line between Whanganui west and east is essentially the Whanganui River, though Moore’s
Kauarapoao Group on the true right (west) bank of the river is included in eastern Whanganui as the roading patterns make East
Town the logical loading place. See Moore and Associates, “Review of wood availability and related roading implications on
Whanganui District Roads 2018-2047” (2017)
7 | © KiwiRail
Opportunities for Export Log Movement on Rail in Taranaki-Whanganui
COMMERCIAL IN CONFIDENCE
Figure 4: Taranaki and Whanganui exotic forests
Source: Based on MPI: Southern North Island Wood Supply Region. Excludes forests outside Taranaki/Whanganui.
The Te Wera forest is on the cusp of the 75km competitive distance. It is 88km by rail to the port
from the former rail siding at Te Wera, but only 80km by state highway. Further forest blocks near
Strathmore are likely to be under 75km from the port.
The owners of the Te Wera forest announced in 2018 their intention to cut at least 100,000t a year
for 7 years.19 Approximately 20% of this is earmarked for Taranaki Pine’s Bell Block mill, leaving
some 80,000t pa for export. While it could be physically possible to haul the Te Wera logs by rail,
the low volumes and short life make it unlikely to be uneconomic, especially since it would require
the reopening of 37km of the Startford-Okahukura line. It is not planned to reopen the whole line, so
reopening to Te Wera would be a charge to the project.
The Whanganui west/southern South Taranaki volumes are greater, and at a more competitive
distance from the port (about 120km by rail). There is a much stronger case for hauling these by rail
than for the Te Wera logs.
19 China Forestry Group, press release 16 November 2018. We have no information on further cut, but age structure information
suggests further years’ cut would be low.
8 | © KiwiRail
Opportunities for Export Log Movement on Rail in Taranaki-Whanganui
COMMERCIAL IN CONFIDENCE
The raw data for logs becoming harvestable is shown in Figure 5, in three-year groups. The available
volume is very sharply peak in the years 2024-2029. These figures are net of the allowance for local
processing.
Figure 5: Raw data for log availability west of the Whanganui River
Western Whanganui log harvest
1000000
900000
800000
700000
s
600000
e
n
500000
n
oT 400000
300000
200000
100000
0
Source: Moore20 and NFED, consultant analysis
Forestry harvesters seek to smooth such peaks to make more efficient use of resources, including
labour and equipment. In addition, prices and international demand will fluctuate.21 In table 3, the
raw data for the 12 years 2024-2035 has been smoothed to indicate the likely actual harvest.
Table 3: Available export log volumes in southern South Taranaki, and western Whanganui
Districts with smoothed peak
Year
Available volume (tonnes) Volume per year
2018-2020
109,213
36,404
2021-2023
122,304
40,768
2024-2026
539,022
179,674
2027-2029
539,022
179,674
2030-2032
539,022
179,674
2033-2035
539,022
179,674
2036-2038
186,699
62,233
2039-2041
268,213
89,404
2042-2044
322,697
107,566
2045-2047
624,273
208,091
Source: Moore and NEFD; consultant analysis
These figures have been adjusted for the expected local processing volume, assessed at 12.5%22
of the initial (2018-2020) volumes, every year. We are not aware of any significant new processing
plants in the area which could absorb 12.5% of the later years’ peak cut, except possibly a proposed
Marton plant. However, we believe this is likely to draw its supplies from forests closer to the plant.
20 See n 18
21 Moore, above n 18, p5
22 Advice from I Moore, (10-15%)
9 | © KiwiRail
Opportunities for Export Log Movement on Rail in Taranaki-Whanganui
COMMERCIAL IN CONFIDENCE
The figures also do not take account of the current intensive planting programme organised by the
Government (“one billion trees”). We have consulted with Te Uru Rākau/ NZ Forestry over the
possible impact of this programme. At present no Crown forestry commercial joint ventures for such
plantings has been signed in this area.23 In any case the logs would not be available until the very
end of the time frame in the table, and beyond. They can form no basis for investment in transport
for at least 25 years.
It is evident that there is going to be a sharp spike in demand from 2023 to 2035, even with
smoothing, after which there will be relatively low volumes until 2045. This is due to the planting
dates of the forest (in the early to mid-1990s) and is consistent with national predictions of a sharp
fall-off in available logs in total shown in Figure 1. In particular, on a national level, because of the
need to supply domestic processing plants, the volume of export logs is expected to halve.24
This in effect means that facilities developed and wagons converted to cope with export traffic will
have a relatively short economic life of about 12 years. However, the base wagons proposed are
new container wagons which can be readily repurposed over their expected 30 year life. There are
thus 3 years for planning, consenting and constructing the hub. The cutting of the peak is unlikely
to be brought forward, but there is about 40,000t pa available to carry before then if the hub is
completed early.
The existing log handling facilities at East Town in Whanganui are likely to be full with logs
generated south of the river, as discussed below.
23 Email from Sam Keenan, GM Crown Forestry, MPI, 12 May 2020
24 Ministry of Transport
National Freight Demand Study, March 2014 (NFDS2), p 255
10 | © KiwiRail
Opportunities for Export Log Movement on Rail in Taranaki-Whanganui
COMMERCIAL IN CONFIDENCE
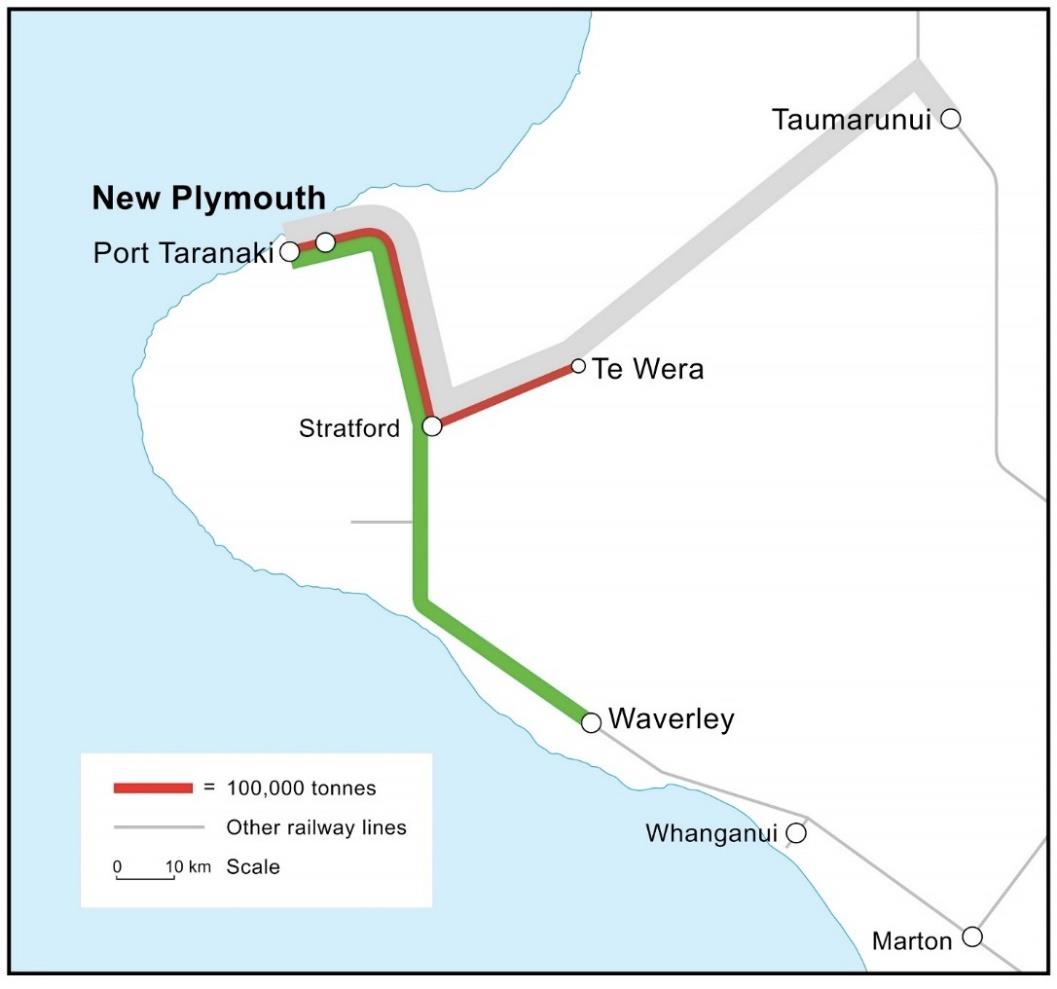
Figure 6: Potential logs flows by rail to Port Taranaki
At present the East Town facility, as expanded, can handle all the Whanganui traffic to Port
Taranaki. But volumes east of the Whanganui River, the primary purpose of the facility, are likely
also to expand rapidly, with a similar peak but with volumes 70% greater than those to the west.25
Figure 7: Raw data for logs available east of the river
Logs available east of the Whanganui River
1800000
1600000
1400000
1200000
se 1000000
n
n
800000
to
600000
400000
200000
0
25 East Whanganui volumes include the logs on the true right bank of the Whanganui, which are logically served by East Town
11 | © KiwiRail
Opportunities for Export Log Movement on Rail in Taranaki-Whanganui
COMMERCIAL IN CONFIDENCE
Again the peak 12 years have been smoothed to give a better indication of the actual harvest, as
set out in Table 4
Table 4: Available export log volumes in eastern Whanganui District, with smoothed peak
Year
Available volume (tonnes)
Volume per year
2018-2020
387,866
129,289
2021-2023
127,866
42,622
2024-2026
1,058,556
352,852
2027-2029
1,058,556
352,852
2030-2032
1,058,556
352,852
2033-2035
1,058,556
352,852
2036-2038
194,489
64,830
2039-2041
403,572
134,524
2042-2044
477,962
159,321
2045-2047
627,876
209,292
Source: Moore and NEFD, consultant analysis
These figures have also been smoothed during the peak years (over 12 years), and have been
adjusted for local supply. In addition a further adjustment of 12.5% has been made to reflect
diversion of wood to supply the Karioi pulp mill, which will draw on Whanganui wood in preference
to supplies further away to the north. This adjustment is made on every year’s projected tonnage.
The strong growth especially after 2023 means that the current East Town facility is likely to be fully
loaded with traffic originating east of the river, with a potential threefold increase in throughput, and
indeed probably needing further expansion or additional sites. Thus there is unlikely to be room for
traffic originating west of the river, and a further site needs to be found to handle that traffic. Some
of this wood may also feed the proposed Marton plant, although there is a substantial volume of
local supply available to it.26
Because the East Town hub is up and running, it is not focussed on in this report.
5. Resources needed to transport logs by rail
To transport logs by rail needs a loading site, loading equipment (with staff or contractor),
locomotives (and drivers), wagons, and unloading facilities. The unloading is at the port and
assumed to be the port company’s responsibility, just as it would be for a logging truck.
At the forest end, KiwiRail has a number of former station sites that could be developed relatively
cheaply. These typically need adjustments to existing trackwork, possibly new trackwork, and a
drained metalled surface.27 Lighting would be needed for any night work. Based on Waverley, we
estimate that the cost of a hub is around
Given the profile of the log cut, the cost of these
26 Moore and Associates, “Wood availability and related roading implications on Rangitikei District roads 2018-2047”, final draft
report for Rangitikei District Council, 2017
27 Feedback from the forestry sector is that former rail yards require less drainage and surfacing work than greenfield sites
12 | © KiwiRail
Opportunities for Export Log Movement on Rail in Taranaki-Whanganui
COMMERCIAL IN CONFIDENCE
needs to be recovered 12 years. At 6% discount rate28 the annual capital cost is
As
discussed later in this report, it may be possible for local or national bodies to pay for (or contribute
to) the siding costs, reflecting the benefits they receive from rail use.
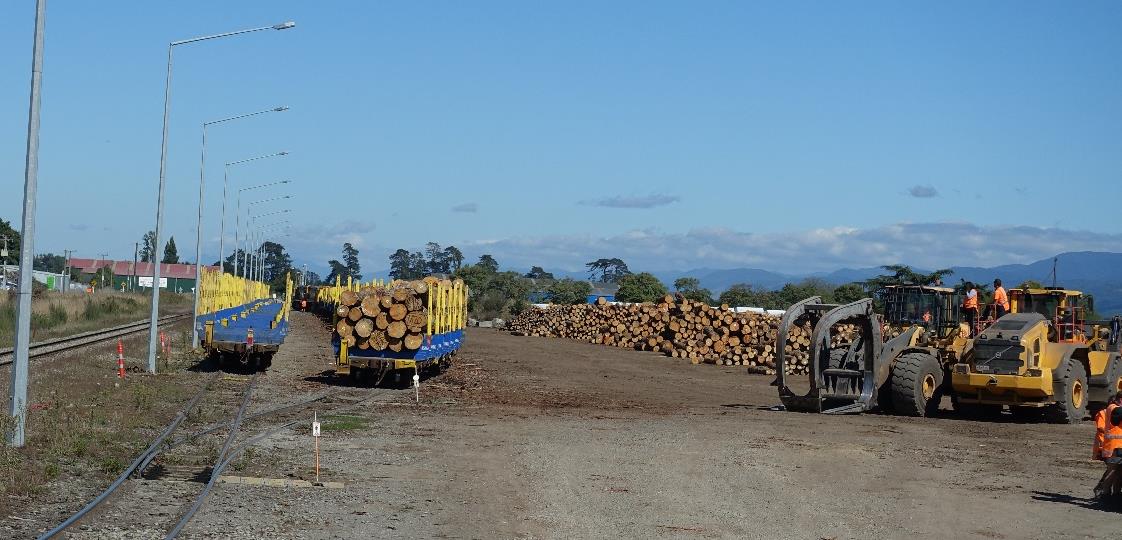
A typical log yard and siding is shown in Figure 8. This is at Waingawa in the Wairarapa. It consists
basically (right to left) of a log storage area, loading area, siding for loading rail wagons, another for
empty wagons, and the main line used by the locomotive to change ends on the train.
Figure 8: Waingawa log yard
28 Treasury transport project ra
te https://treasury.govt.nz/information-and-services/state-sector-
leadership/guidance/financial-reporting-policies-and-guidance/discount-rates
30 Source (cost and life): McCarthy Transport Ltd
31 KiwiRail’s current costs.
13 | © KiwiRail
Opportunities for Export Log Movement on Rail in Taranaki-Whanganui
COMMERCIAL IN CONFIDENCE
Figure 9: Loading logs at Palmerston North
As noted, the traffic would use FIH type wagons. These are new container flat wagons, adapted for
use in log traffic. The wagons cost
each, with the cassettes and cradles another
per wagon. While the wagons will have the normal 30 year life, there are unlikely to be any other
uses for the cassettes and cradles when no longer used for logs in this area as the same steep
decline in the cut will be experienced nationally at about the same time. For a 30 year life, the annual
capital charge at 6% would be
per wagon; with the 12 year charge for the cassettes and
cradles at
, making a total of
This is the equivalent of just over
per day per wagon. Operational constraints will mean that two
rakes of wagons34 will be required, effectively each wagon carrying a load every two days. On this
basis the capital cost is
New locomotives cost
each and have a life of 25 years. For them, an alternative use past 2032
can be assumed so their annual capital cost can be based on a 25 year life. The annual charge at
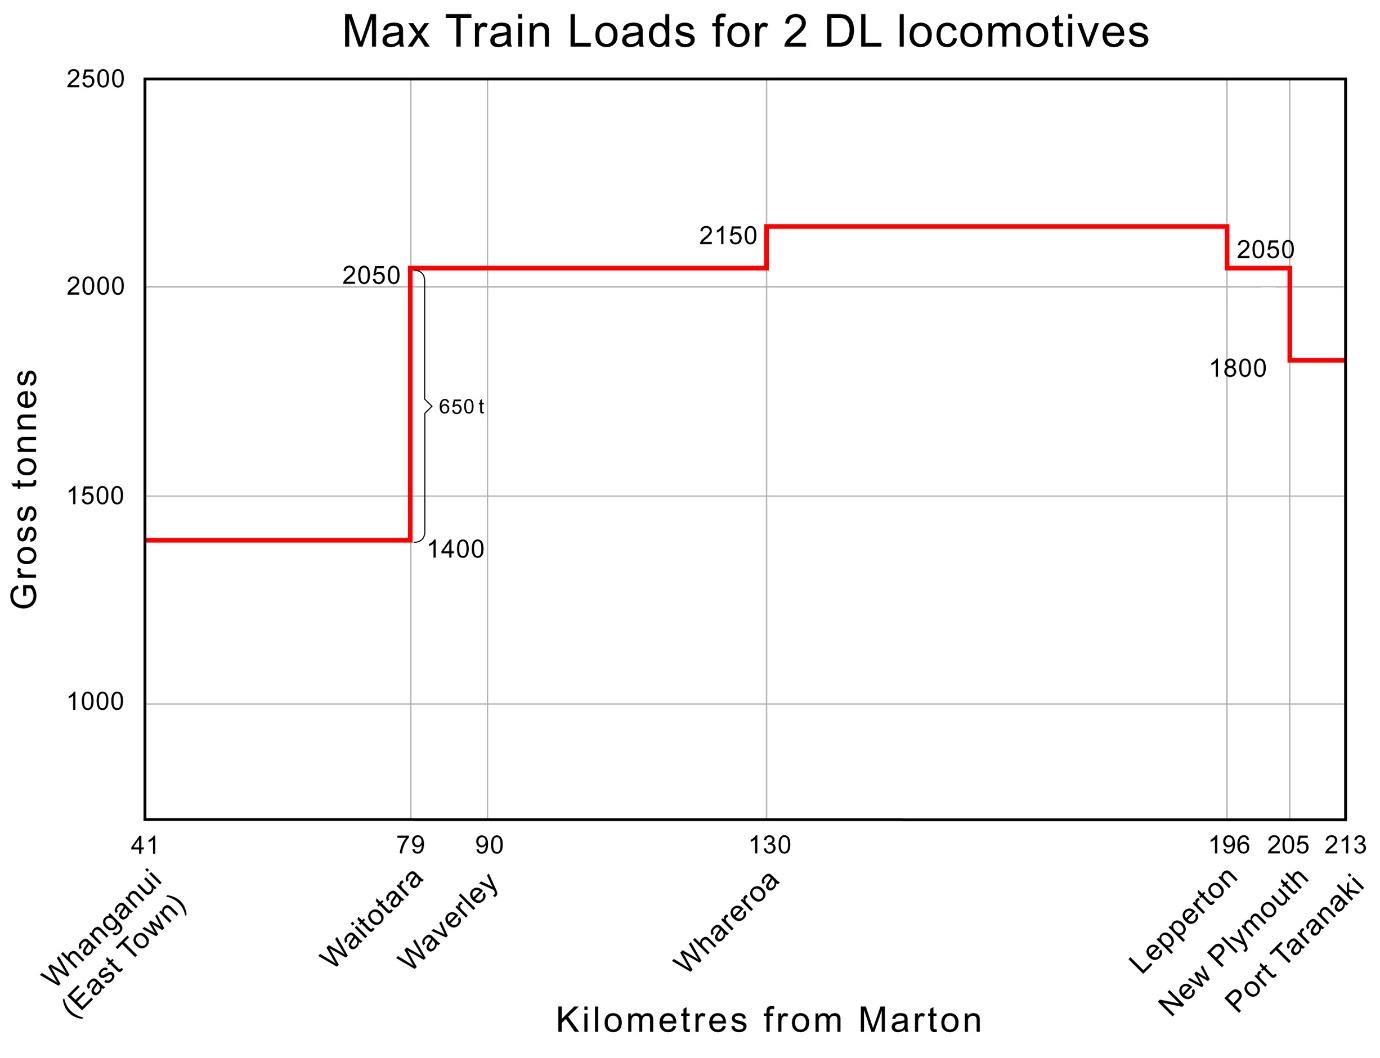
The locomotive would be one of the larger capital item in the mix, and so operational patterns have
been considered which make better use of existing locomotives. In the particular case of the line
north of Whanganui, the section from Aramoho to Waitotara has severe grades which limit the load
that can be hauled. From any location from Waitotara north to New Plymouth an additional 650t per
32 Source: Kiwirail (Alan Hill).
33
34
.
35
14 | © KiwiRail
Opportunities for Export Log Movement on Rail in Taranaki-Whanganui
COMMERCIAL IN CONFIDENCE
train36 can be carried (up to 12 loaded FIH wagons) with the same locomotive power, assuming the
normal power is two DL locomotives (see figure 8). In this cases significant efficiencies can be
achieved by more intensive use of the assets, and the capital cost for locomotives for the log traffic
is effectively nil. Their additional operating costs also close to nil (there is no increase in driver costs,
and extra fuel would be marginal). An alternative dedicated train was investigated but a competitive
price could not be reached with the forest owners.37 It would have required a new locomotive and
an additional driver.
Waverley is the nearest feasible existing yard.
Figure 10:
Offsetting the rail equipment costs will be a reduction in the number of trucks otherwise needed. A
truck and trailer can haul the same volume as an FIH wagon, so there would be a reduction of 22
truckloads a day, each way, between Waverley and the port. However, trucks will still be needed
from the forest to Waverley, some 50km. Given the likely proportion of the haul carried by rail (about
88%), and taking account of the continuing need for trucks at the forest end of the haul, the reduction
36 With a further 100t between Whareroa and Lepperton, of no use to the log traffic.
37 For discussion on competitive pricing, see section 8.
15 | © KiwiRail
Opportunities for Export Log Movement on Rail in Taranaki-Whanganui
COMMERCIAL IN CONFIDENCE
in the number of trucks needed for the traffic considered in this paper could be as much as 50%.38
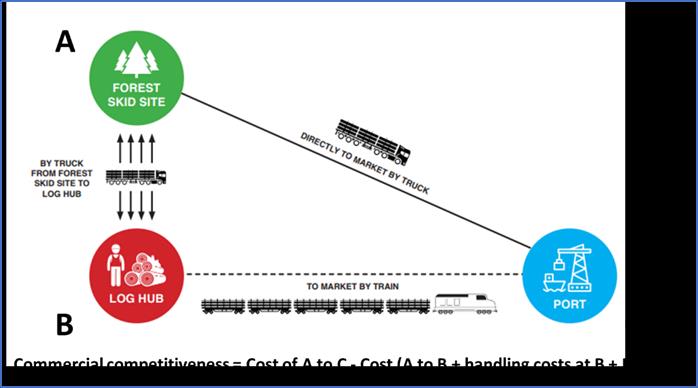
Logging operators value the improved management of trucks made possible by shorter, local hauls.
By prioritising truck journeys between the forest skid site39 and a log hub, with line haul by rail,
greater volumes of logs can be transported to market while allowing truck operators to maximise
use of their vehicles. This offsets the additional costs of handling on to rail.
6. Potential rail log hub sites
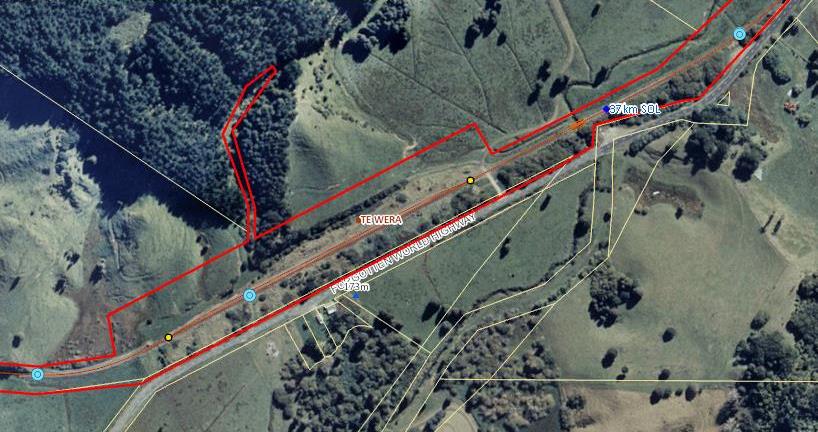
Te Wera
The former Te Wera rail siding is adjacent to the Te Wera forest. It is 37 km from Stratford on the
mothballed Stratford-Okahukura line. Both the line and the siding could be redeveloped to handle
the log traffic from the adjacent forest.
Figure 11: Former Te Wera station site
Source: KiwiRail
However, the volumes are small and are expected over a short time frame (7 years), making an
investment in wagons, locomotives, and a log yard marginal. As well, the cost of carrying this traffic
would need to include the upgrading the 37km of the former Stratford-Okahukura line from Stratford,
which is estimated to cost
.
For these reasons, the traffic is likely to be uneconomic, and so the possible log yard at Te Wera
has not been considered further.
39 A ‘skid site’ or a ‘deck’ is the designated area in the forest used to further process stems or trees extracted from the forest,
store them, and then load out the logs (http://www.nzffa.org.nz/farm-forestry-model/the-essentials/roads-and-
harvesting/timber-harvesting-in-new-zealand/)
16 | © KiwiRail
Opportunities for Export Log Movement on Rail in Taranaki-Whanganui
COMMERCIAL IN CONFIDENCE
West of Whanganui River
On the basis that there is no long term room in existing East Town facilities, a new site needs to be
found for handling the western logs. All potential sites in the Whanganui city area are likely to be
needed for the traffic originating south of the river (and on the west bank of the river).
There are several former rail station sites in the area west of the river and north of the rail grades
that could be used as a log loading site. These include Waitotara itself, Waverley, and Patea.
Waitotara appears to be too small, but there is a reasonable amount of land available at both
Waverley and Patea (see figure 4). Both are only a short distance off SH3. Patea is on the banks of
the Patea River and may pose a pollution risk. It is also 14km closer to the port, making the rail
component a lower proportion of the total trip, which would be less economic for rail. This report has
used Waverley as the preferred site.
Figure 12 shows the area between Waverley and Whanganui in more detail.
Figure 12: Waverley – Whanganui locations
17 | © KiwiRail
Opportunities for Export Log Movement on Rail in Taranaki-Whanganui
COMMERCIAL IN CONFIDENCE
The volumes available from this area spread over 12 years imply a site able to handle up to 25
wagon loads per day (on a 225 day per year basis, ie 5 days/week).40 A Waverley siding would
provide for 22 wagons.41 The two daily trains would handle 11 wagons each.
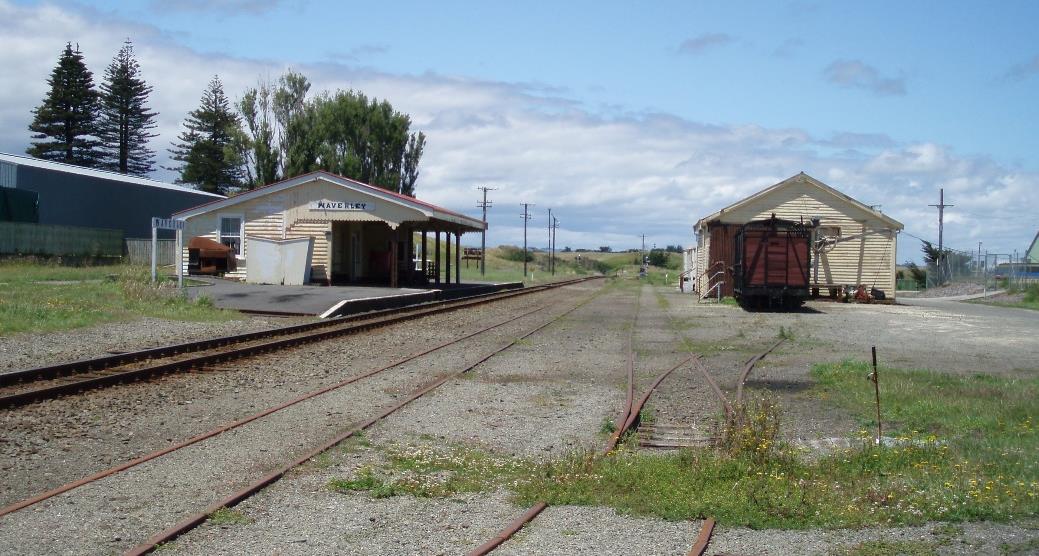
Figure 13: Waverley, looking south
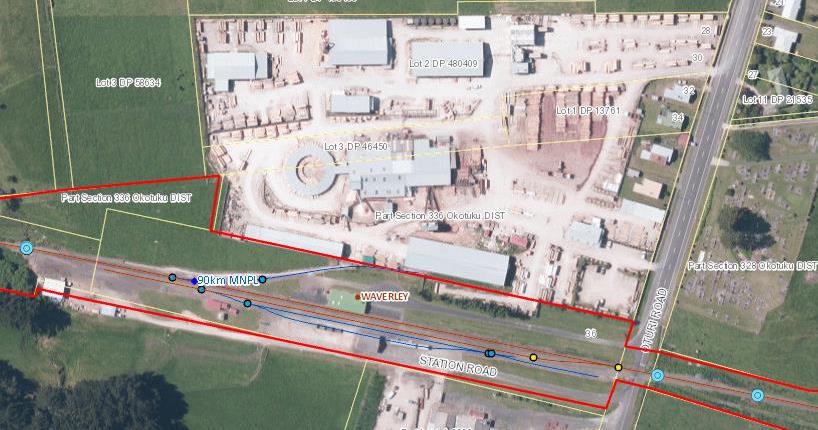
Figure 14: Aerial view of Waverley station
Source: KiwiRail
It is likely that two sets of 22 wagons will be required, to allow the through train to quickly swap a
loaded for a full rake. These rakes can be unloaded at the port in time to get them back for loading
in one day, and a third rake is not required. Two sets will cost
40 A typical HPMV log truck and trailer has the same 32t load as is assumed for a wagon
41 The remaining 3 wagons loads would remain for road transport. This is consistent with the practice of logging operators using
road transport directly to the port for a small number of trips per day.
42 44 wagons, 30 year life; 12 year life for cassettes and stanchions.
18 | © KiwiRail
Opportunities for Export Log Movement on Rail in Taranaki-Whanganui
COMMERCIAL IN CONFIDENCE
Preliminary work on timetabling indicates that loading two 11-wagon rakes together at Waverley is
practicable. To allow loading during the day, the empty wagons will be delivered and the loaded
wagons picked up at night on the existing trains’ schedule.43 The empty wagons will need to be
staged through Waitotara to minimise the need for trackwork at Waverley.
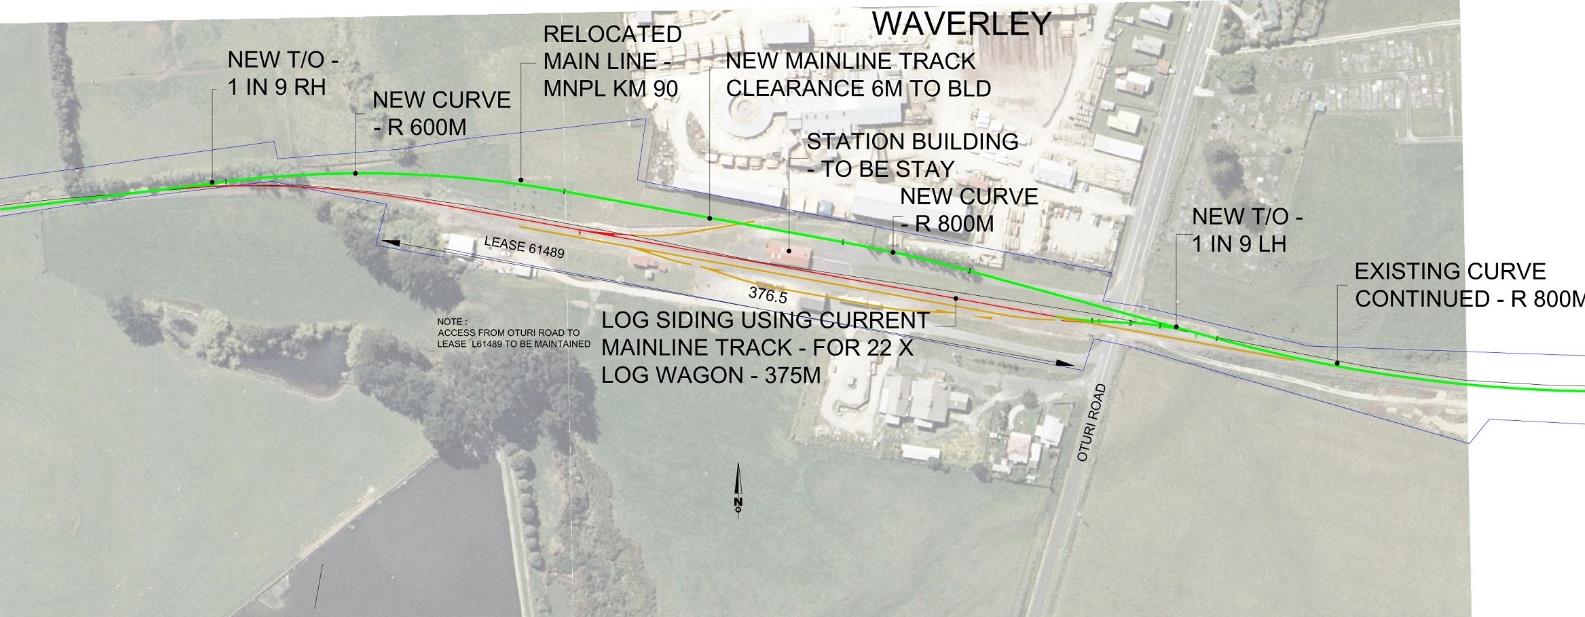
There is one primary proposal for Waverley, and a lesser alternative
The primary proposal is to re-route the main line further north, closer to the sawmill site. This lines
avoids the historic station building, but log loading would then take place adjacent to it, and arguably
put it at some risk. It would be isolated within the log yard, with no public access.44 This proposal
would cost
. It involves construction over the
sewer line to the treatment facility to the south of the station. About 300m of the sewer would need
to be replaced. As well, the main line would be more complex than the current one, with more curves.
The other proposal involves constructing a new main line 5.2m to the north of the existing main line
(to give adequate clearances for loading). The log yard would still be to the south, on the existing
yard. This proposal would mean the existing station building would need to be relocated 5.2m north,
adjacent to the new main line. Without the cost of shifting the station building this proposal is cheaper
than the other, but at an estimated
for shifting the station, the total cost is dearer at
The station building is a historic structure, built in 1881. It is one of the only two stations remaining
that were built to the standard “class 4” plan47, albeit extended and modified. The system of standard
plans dates from the Vogel era.48 The station is registered with Heritage New Zealand as a Category
1 historic place, and is listed in the District Plan as a category 1 Historic Heritage site.49
Figure 15 shows the primary proposal.
43 Their schedule is set by the needs of existing major Taranaki customers.
44 It technically has no public access now but there is a road leading to it from Oturi Rd giving de facto access.
45
46
.
47 The other is at Inglewood. Waverley is in better condition, but Inglewood is the oldest station in New Zealand still on its
original site.
48 Se
e http://www.railheritage.org.nz/Register
49 South Taranaki DC, Proposed District Plan 2015, Schedule 1, site H71.
19 | © KiwiRail
Opportunities for Export Log Movement on Rail in Taranaki-Whanganui
COMMERCIAL IN CONFIDENCE
Figure 15: Alterations to Waverley for a log yard.
Source: KiwiRail
The area available for log marshalling is limited, and may be constrained at the peak of the wood
flow.50 Existing log yards can be used as an indicator of the land required. At Waingawa a site of
about 1.5ha has a throughput of some 325,000t a year, in 10,900 wagons, 35 per day on a 7-day
basis.51 This amounts to 220,000t throughput per hectare per year. Wairoa has a yard of 1.2ha,
which has a capacity of 250,000t throughput a year, about 210,000t/ha. For the peak 12 years on
this basis the southern Taranaki log yard would need about 0.85 ha. Waverley has about 0.8 ha on
the south (goods shed) side.
These figures suggest that with appropriate realignment of the main line Waverley could cope with
the volume. If extra land is required, it would only cost about
There may also be
greenfield opportunities in the area, with land at that price not being a critical factor.
As a designated site under the RMA, an outline plan of works is required for the proposal.
Discussions with the South Taranaki District Council53 suggest that this need not be an extensive
document. They noted however that the land to the south of the station building, at least, would be
regarded as potentially contaminated, and compliance with the national standard for contaminated
land may be required (and potentially a resource consent issued).54 However, if there was no
disturbance to the soil in the area, or no spoil taken off the site, this would not be a significant hurdle.
Resource consents are also likely to be required from the Taranaki Regional Council (eg for
drainage).
South of the Whanganui River
The volumes being generated from forests in this area suggest that log handling sites will have to
cater for over three times the current volume handled, with a maximum of over 350,000t a year. The
existing site at East Town has handled about 140,000t pa in past years, and with extension could
50 Some operators work by directly loading wagons from their trucks, which means less land is required.
51 And a 45-week year, the industry standard.
52 KiwiRail Property estimate, March 2019
53 Meeting with Jessica Sorenson, Planning Manager, STDC, and other officers, 21 May 2020
54 National Environmental Standard for Assessing and Managing Contaminants in Soil to Protect Human Health (NESCS).
20 | © KiwiRail
Opportunities for Export Log Movement on Rail in Taranaki-Whanganui
COMMERCIAL IN CONFIDENCE
handle over twice that. Extending days of operation from 5 to 7 would add another 40% to the
available throughput. All that would give just under 400,000t capacity. Beyond that there is a possible
site at Taupo Quay.55 It is clear however that the East Town site will be close to capacity, and is
likely to need supplementation. It is unlikely to cope with logs from west of the river as well as those
from the east.
7. Estimates
The estimates of the operating patterns of the hubs, and their costs, are indicative only at this stage.
While they indicate that development of hubs is feasible, progressing them will require detailed
assessment of actors such as:
• Scheduling ; impacts on existing programmes
• Workforce planning
• Terminal capacity and land availability
• Landside requirements; yard size, land availability, capital investment, operation
• Asset availability and management
• Commercial factors.
8. Haulage costs
Harvested logs are a commodity product and given the time to maturity, forest owners are very price
sensitive, particularly the small-scale owners. Their price sensitivity coupled with availability of
harvesting crews affects the timing of their harvest and what they are willing to pay to transport their
logs to market. Transport decisions are largely made based on the cost of ‘stump to port’ with the
lowest cost preferred.
Traditionally the New Zealand forestry industry has relied heavily on the road transport industry to
transport harvested logs from forests to market. In many regions, road transport has been the only
option or there has been no compelling reason to choose rail given double handling costs and the
establishment costs of regional log hubs. The reason to rely on road transport is purely a commercial
decision.
Nevertheless the establishment of strategically located log hubs enables rail to be price competitive,
and overcome the disadvantage of having to transfer from one mode to the other. This model,
illustrated in the following figure, is successfully used by KiwiRail at a number of southern North
Island sites.56
55 A further site at Aramoho has been used in the past, but the District Council refused permission to reopen it for road traffic
reasons.
56 See above, n 7.
21 | © KiwiRail
Opportunities for Export Log Movement on Rail in Taranaki-Whanganui
COMMERCIAL IN CONFIDENCE
Figure 16: Commercial issues for a rail hub
Source: KiwiRail
For the South Taranaki logs, the road haul from forest to port is 170km, and costs
From the forest to the rail yard is 50km (along the same route), and costs
. For the combined road/rail journey, the total needs to be the same or better
than the direct road cost, so the amount available for rail is the difference between these numbers,
namely
a tonne km.
From this has to be deducted the cost of handling
which leaves
for the actual rail haul.
KiwiRail’s current prices for hauling logs are
, net of handling and fuel adjustment
factor, giving revenue for this proposal of approximately
. Direct costs will be low with the
use of spare capacity on existing trains, and the traffic will cover them and make a contribution to
overheads and track (excluding the cost of developing the log yard).
9. Externalities: costs borne by the communities
As log volumes have increased, the frequency and cost of maintaining the regional road networks
has significantly increased and road safety has been negatively impacted with greater numbers of
heavy trucks on the roads. These costs will detrimentally impact the communities within those
regions (see section 10, below).
Compared with trucks, rail provides a sustainable solution will help reduce road and port congestion,
reduce the frequency and cost of road maintenance, will improve regional road safety and will reduce
carbon emissions58.
The following table with estimates of the externality costs for road and rail is adapted from Table 5-
10 in a report prepared for Environment Canterbury and SI Regional Transport Committee Chairs
by Stantec.59
57 KiwiRail, from confidential log operator source.
58 https://pro.newsroom.co.nz/articles/3728-4-are-we-ready-for-the-walls-of-wood
59 Stantec,
South Island Freight Study: Identification of the opportunity for mode shift and preparation of a mode shift
Implementation Plan 2019
22 | © KiwiRail
Opportunities for Export Log Movement on Rail in Taranaki-Whanganui
COMMERCIAL IN CONFIDENCE
Table 5: Externality costs per 000 tonne kilometres
Externality costs for road and rail movements of Taranaki logs
Cost item
Road transport costs ($
Rail transport costs ($
per 1000 net tonne-km)
per 000
net tonne-km)
Urban
Rural
Urban
Rural
Greenhouse gases
3.0
3.0
0.75
0.75
Other Emissions
10.4
1.0
3
0
Other environmental
4.8
1.3
3
0
costs
Accidents
14.9
2.4
Total exc congestion
33.1
20.2
9.15
3.15
Congestion
Main
Other major
centres
urban
centres
NA
Peak
38.9
30.3
Off-peak
17.8
14.7
Rural - all areas
2.5
Source: Stantec: GHG scaled by 25% to update to 2019 levels, using EEM factors
The tonne kilometres for logs from Waverley, by road and rail, are in Table 5. The routes by rail are
slightly longer.
Table 6: Annual Tonne kilometres for log traffic from Waverley
Waverley-Port
Urban/
Taranaki
rural, %
Tonnes pa (peak years) (by rail) 158400
Kilometres (road)
119
Tonne kilometres (000) (road)
18,850
22/78
Kilometres (rail)
123
Tonne Killometres (000) (rail)
19,483
15/85
23 | © KiwiRail
Opportunities for Export Log Movement on Rail in Taranaki-Whanganui
COMMERCIAL IN CONFIDENCE
Applying the factors in Tables 5 and 6 for Waverley:
Table 7: Annual Externality costs for Waverley log traffic for the 12 peak years
Externality costs for road and rail movements of Waverley logs. pa
Cost item
Road transport costs ($)
Rail transport costs ($)
Urban
Rural
Urban
Rural
Greenhouse gases
12,355
44,194
2,257
12,355
Other Emissions
42,831
14,731
9,029
0
Other
19,768
19,151
9,029
0
environmental
costs
Accidents
61,364
219,495
7,223
39,537
Total excl
136,418
297,924
27,556
51,991
congestion
Congestion
Other major
Rural
urban
centres
NA
Peak
12,479
Off-peak
54,486
Rural - all areas
36,828
Totals
203,284
334,398
27,538
51,892
Total urban and
537,682
79,430
rural
The difference between road and rail, $458,253, is the annual externality benefit of the proposal. In
principle, local and national bodies should be willing to help fund the project to gain this benefit, but
contributions from local bodies are unlikely.
In addition the Stantec report identified a contribution to the cost of roads that is not matched by
revenue from Road User Charges. This is specific to logging trucks, and relates to their practice of
loading the empty trailer on to the truck on the return from the port. Road User Charges are charged
for all vehicles, regardless of load, based on an average loading out and back, and loading the trailer
on the truck means the trailer pays the average when full, and nothing when empty. The report
calculated the revenue shortfall at 14.3 cents per vehicle km.60 There will be 22 loaded trucks/day,
225 days/year, over 119 km, and empty returns, which is just under 1.18 million vehicle km per year,
or $168,000 pa in unmet costs. These would be avoided by the use of rail
.
The net environmental and roading benefits of railing logs from Waverley are thus $626,000 a year,
for the 12 peak years. The Waverley benefits offset the annual capital costs of providing the siding
($620,000),61 and over three quarters of the total cost of Waverley and the additional capital costs
at the port ($810,000 pa in total).62.
60 Stantec, above n 59, p 26
61 Above, p 20
62 Including the port works, $0.19m pa. See below
24 | © KiwiRail
Opportunities for Export Log Movement on Rail in Taranaki-Whanganui
COMMERCIAL IN CONFIDENCE
10. Stakeholders
KiwiRail engaged with a number of stakeholders in the region. A list is in Appendix 1. KiwiRail is
grateful for their very useful inputs.
Port Taranaki
Port Taranaki has been in discussions with KiwiRail for the past 24 months about initiatives to
develop a rail option for log exports.
With greater log volumes forecasted, the Port sector generally is likely to face some constraints in
the future. The constraints will be due in part to:
- major road access corridors being through built up residential and industrial areas
- the availability and scarcity of on port land for receiving and marshalling logs
- the inability of the stevedoring and marshalling companies to man both vessel loading
operations as well as increasing road and rail log deliveries, could also impact negatively.
Ports in New Zealand aggressively compete for cargo outside their natural catchment areas to be
exported from their port. This means that at the margin, the individual growth and development
strategies around forestry and logs in particular, are commercially sensitive, and not available or
shared publicly. Port Taranaki recognise the need for investment in rail to support New Zealand’s
forestry supply chain. They supported KiwiRail’s recommendation to invest in a log hub at Aramoho
(unsuccesful) as it aligns with their strategy to extend their reach to new export customers in other
regions. They are also in support of this proposal.
Port Taranaki has upgraded its on-port infrastructure to accommodate increased volumes of logs
and in particular provide for logs arriving at the port via rail. Bringing more logs to the port through
rail would result in increased ship visits and also ease the pressure on the region's roads63.
Cost of developing a rail yard at Port Taranaki
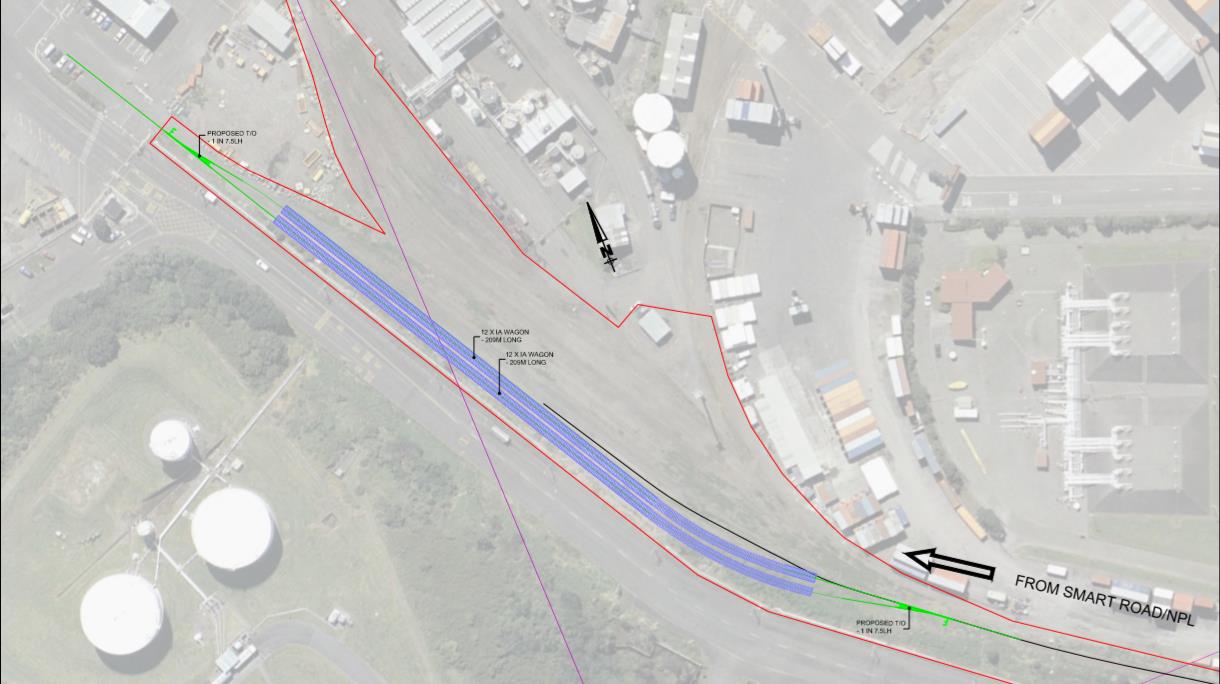
Figure 18 outlines Port Taranaki’s planned footprint for provisioning for these increased log volumes.
The costs of preparing Blyde wharf for logging traffic are being met by Port Taranaki. Kiwirail will
also have to adapt its yard at the port to handle the log traffic, at a cost of
64 as
shown in Figure 13.
63
https://www.stuff.co.nz/business/101763651/port-and-road-groups-support-taranaki-rail-network-feasibility-study
64 At 6% for 50 years. This makes the reasonable assumption that these sidings will be used for other traffics after the log peak. If
it taken just over the life of the traffic from Waverley, it is
25 | © KiwiRail
Opportunities for Export Log Movement on Rail in Taranaki-Whanganui
COMMERCIAL IN CONFIDENCE
Figure 17: Alterations to rail yard at Port Taranaki
Source: KiwiRail
Figure 18: Port Taranaki Log Infrastructure Developments
Source: Port Taranaki
Taranaki Regional and local authorities
Regional and local authorities are concerned about the impact of the increased log volume by
road, in terms of public safety and deterioration of their roading assets. WSP Opus note that “By
reducing on road freight trips, a rail siding would reduce the maintenance requirements on the
26 | © KiwiRail
Opportunities for Export Log Movement on Rail in Taranaki-Whanganui
COMMERCIAL IN CONFIDENCE
surrounding road network as road condition tends to deteriorate in proportion to heavy commercial
vehicle volumes.”65
Taranaki Regional Council is aware of rising harvest volumes and is concerned about the impact
that an increased number of trucks travelling to the Port will have on regional roads and road safety.
The Council has confirmed to KiwiRail that it will strongly support any improvements to rail provision
within and to/from the Taranaki region and it notes that the current Regional Land Transport Plan
for Taranaki makes several references to the importance of maintaining and improving rail
infrastructure and services within the region.
The District councils in Taranaki and Whanganui are already seeing an increase in road
maintenance costs as a result of logging activity. Typically, in the Stratford District it usually costs
approximately $1,500 per kilometre to maintain an unsealed road. As a result of logging, that cost
can go up to about $10,000 dollars per kilometre66. However, the location of the rail network means
that it offers few alternatives to local roads; the diversion of traffic will be mainly from State Highways.
Local roads will continue to be used from forest to rail hub.
An issue of particular concern for the New Plymouth District Council is the movement of logging
trucks through urban New Plymouth en route to Port Taranaki. As volumes of logs exported via
Taranaki increases this is likely to become more problematic for the District Council and NZTA67.
The council is “highly supportive” of taking trucks off the road through the city.68 Growth in the oil
and gas and agriculture sectors is likely to place added pressure on the district’s infrastructure such
as Port Taranaki and the airport as well as the roading network that connects them with production
sites and northern and southern corridors69.
The Stratford District Council is strongly supportive of logs moving on rail.70 It is considered that
this would have a positive impact upon the impost of providing and maintaining roads with
associated environmental and safety benefits. Stratford District is part of the route from the
Whanganui forests. Similarly the South Taranaki District Council supports taking logging trucks of
the road. They too are on the route from the Whanganui forests. Heavy trucks even on the State
Highway are especially a concern in small communities like Patea and Eltham.71
The Whanganui District Council in their ‘Long Term Plan 2018-2028’ identified that the transportation
of timber associated with these harvest profiles is one of their key issues. Within this plan they have
forecast significant road maintenance and pavement renewal cost increases. The Council have
resolved to work with the forestry industry to manage their impacts on the district’s roading network
to minimise costs to be borne by ratepayers.
Industry participants
KiwiRail has consulted with several logging industry operators.
65 Traffic Impact Assessment, Rangitikei District Council Industrial Plan Change, 2019
66 https://www.nzherald.co.nz/nz/news/article.cfm?c_id=1&objectid=11873074
67 Statement by District Planning Lead, NPDC
68 Meeting with Craig Stevenson (CEO) and Liam Hodgetts (Group Mgr Strategy), 2 April 2020
69 NZTA : “Keeping New Plymouth Moving and Growing” Report of December 2016.
70 Discussions with CEO, 2018
71 Meeting with Waid Crockett (CEO) and Liam Dagg,( Group Mgr, Environmental Services), 2 April 2020
27 | © KiwiRail
Opportunities for Export Log Movement on Rail in Taranaki-Whanganui
COMMERCIAL IN CONFIDENCE
Forest360, a harvesting and marketing company, supports KiwiRail’s study, and is likely to be an
active participant in rail developments in Taranaki and Whanganui. It already operates a log yard at
KiwiRail’s East Town hub.
Forest Management NZ (FMNZ) support in principle any initiatives which either provide for greater
efficiency and resilience within the country’s export supply chains, or conversely contribute to
removing inefficiency.
FMNZ consider that it is counter-intuitive to be transporting logs (via any mode) from the Taranaki /
Whanganui regions for exit via other ports when a “perfectly fit for purpose port with ample capacity
is on the back door at New Plymouth.” FMNZ is encouraged that rail solutions for movement of
logs to Port Taranaki are being developed.
John Turkington Ltd (JTL) is also a forest management and marketing firm. They also use rail hubs
at East Town, Palmerston North, and Waingawa. JTL feels there are huge opportunities with rail. It
is not presently a cheaper option but offers much greater efficiencies for their road transport network.
“We would be interested in supporting an option to Taranaki provided Kiwi Rail can support it with
infrastructure, rolling stock, and people, and it does not affect our current rail business.”
11. Risks
The potential risks for the project include both construction/operational risks, and market risks.
Construction and operation
• The cost of altering Waverley exceed the contingencies. The 30% allowance should be
adequate
• Unforeseen planning issues raise the price of alterations at Waverley. The biggest planning
hurdle, the historic station, has been avoided by leaving it in situ.
• The cost of developing a log yard, especially surfacing and drainage, are more than minor,
so log operators will not pay for them. The typical experience is that former railway stations
have an adequate surface for log yard activities.
• The train operations require more sidings than allowed for. This is mitigated by the use of
Waitotara to hold empty wagons as part of the process.
• Changing exchange rates impact on wagon prices
• Changing train patterns on the Marton - New Plymouth line (which could reduce the
availability of spare capacity on trains, or could improve the wagon turnround and reduce the
number required).
Market
• The international log market, or prices, will significantly reduce
• Major new local processors take up the peak wood. This is unlikely because of the relatively
short duration of the peak (such plants need a continuous supply)
• Logging operators will not use the hub. This is unlikely, as KiwiRail has already had enquiries
about it from logging operators
28 | © KiwiRail
Opportunities for Export Log Movement on Rail in Taranaki-Whanganui
COMMERCIAL IN CONFIDENCE
12. Summary
The costs and benefits of the proposal are set out in Table 9. KiwiRail invest in new wagons, and
part of the commercial revenue goes toward paying for them. Trucks worth
are avoided.
For the PGF, an investment of $8.2m (0.81m pa) is largely offset by the community benefit of
$0.63m.72
Table 9: Summary of costs and benefits
Kiwirail
Cost
Benefit
Purchase of wagons
$8.8 m (0.71m pa)
Truck Operators
Avoided truck purchase
PGF
Alterations to Waverley
$5.2m ($0.62m pa)
Alterations at port
$3.0m ($0.19m pa)
Community benefits
$0.63m pa
13. Conclusions
The key objective of this study was to identify if opportunities exist for rail services in Taranaki (and
Whanganui) for the movement of export logs to Port Taranaki - and if so where the logical location(s)
were for the establishment of enabling rail log hubs.
There are significant forest areas due to be harvested in the area, close to rail, and over 75km from
the port.
On the basis of these forest locations and likely harvest patterns, reviews of reports, and its own
knowledge of what can be viably hauled by rail, supplemented by stakeholder engagement,
the
conclusion is that there is scope for rail services in Taranaki.
Likely sites for aggregating and transferring logs have been identified in southern South Taranaki.
The favoured site of Waverley is operationally feasible, and can be created at relatively low cost.
We have also assessed the likely benefits to communities from moving logs by rail instead of road.
These strongly support the development of a south Taranaki hub.
14. Recommendations and next steps
1. KiwiRail and industry partners to confirm Waverley as the site for a South Taranaki rail hubs,
and the rail facilities required.
2. KiwiRail to work with forestry industry parties to confirm the viability of establishing the hub, and
develop detailed plans for train operations.
3. KiwiRail to apply to the Provincial Growth Fund for funding to develop the hub in the light of its
relatively low cost, and the regional benefits that will flow from it.
72 These costs have been also calculated at discount rates of 4%pa and 8% pa as a sensitivity test. The range is about 10% either
side of the 6% rate for the short life assets like Waverley, rising to over 25% for the long life, eg at the port. At 4% the wagon
costs are
pa. The respective
; for the
alterations at Waverley $0.55m pa and $0.69m pa, and for the port $0.14m pa and $0.25m pa. The lower discount rate narrows
the gap between the PGF costs and the community benefits, and the higher one raises it.
29 | © KiwiRail
Opportunities for Export Log Movement on Rail in Taranaki-Whanganui
COMMERCIAL IN CONFIDENCE
4. KiwiRail will fund the required rolling stock and operating costs.
5. KiwiRail to engage with Waka Kotahi NZTA over the implications of developing a rail hub at
Waverley for their State Highway programme in Taranaki.
30 | © KiwiRail
Opportunities for Export Log Movement on Rail in Taranaki-Whanganui
COMMERCIAL IN CONFIDENCE
Appendix 1:
Stakeholder Engagement
Port Taranaki
CEO
Head of Commercial (2020)
CFO and Head of Commercial (2018)
Customer Relationship Manager
Cargo Services Manager
Taranaki Regional Council
Transport Services Manager
Policy Analyst
New Plymouth District Council
Craig Stevenson
CEO
Group Manager Strategy
Senior Policy Adviser
District Planning Lead
GM Innovation & Strategic Projects, Venture Taranaki
Stratford District Council
Svenne Hanne
Chief Executive
Roading Asset Manager
South Taranaki District Council
Waid Crockett
CEO
Group Manager Environmental Services
Planning Manager
Group Manager Engineering Services
Roading Manager
And other officers
Whanganui District Council
GM Infrastructure
Senior Roading Engineer
31 | © KiwiRail
Opportunities for Export Log Movement on Rail in Taranaki-Whanganui
COMMERCIAL IN CONFIDENCE
32 | © KiwiRail
Opportunities for Export Log Movement on Rail in Taranaki-Whanganui