
LOWER NORTH ISLAND LONGER-DISTANCE
ROLLING STOCK BUSINESS CASE
PREPARED FOR GREATER WELLINGTON REGIONAL COUNCIL
26 September 2019
1987
under LGOIMA,
Released
link to page 2
All redactions are made under
s 7(2)(i) of the LGOIMA, 1987
QUALITY STATEMENT
PROJECT MANAGER
PROJECT TECHNICAL LEAD
Doug Weir
Doug Weir
PREPARED BY
Doug Weir, Andrew Liese
………………………………...............
26/09/19
CHECKED BY
Jamie Whittaker, Doug Weir, Deepa Seares ………………………………...............
26/09/19
1987
REVIEWED BY
Jamie Whittaker, Phil Peet
………………………………...............
26/09/19
APPROVED FOR ISSUE BY
Doug Weir
………………………………...............
26/09/19
LGOIMA,
WELLINGTON
Level 13, 80 The Terrace, Wel ington 6011
PO Box 13-052, Armagh, Christchurch 8141
TEL +64 4 381 6700
under
REVISION SCHEDULE
Authorisation
Rev
No.
Date
Description
Prepared
Checked
Reviewed Approved
by
by
by
by
Released
1
27/07/18 First Draft Final
DW, AL
JW
JW
DW
2
24/10/18 Updated First Draft Final
DW
JW
JW
DW
3
05/08/19 Revised Draft Final (Sustainable
Transport Committee)
DW
DW
PP
DW
3
20/08/19 Updated Revised Draft Final
DW
DS
PP
DW
4
26/09/19 Amended Draft Final
DW
DW
PP
DW
Stantec │ Lower North Island Longer-Distance Rolling Stock Business Case │ 26 September 2019
Status: Draft │ Project No.: 310200204 │ Our ref: 310200204 190926 Lower North Island Longer-Distance Rol ing Stock Business Case -
Amended Draft Final.docx
Executive Summary
Introduction This business case has been prepared by Stantec New Zealand and Greater Wellington Regional Council
(GWRC), with input from key stakeholders including KiwiRail, Transdev, Horizons Regional Council and the
NZ Transport Agency (NZTA), and economic peer review by Transport Futures Limited. It assesses the case
for replacing the rol ing stock fleets that provide longer-distance rail passenger services on the Wairarapa
and Manawatu lines, and using the replacement fleet to improve service levels and increase the overal
capacity of GWRC’s Metlink rail network to address serious and urgent capacity constraints. It follows a
2017 business case that assessed the case for continued short-term public investment in the Palmerston
North-Wellington rail passenger service, and two 2017 infrastructure-focused business cases that assessed
the case for catch-up track renewals and capacity and resilience enhancements on the Wel ington metro
rail network, which includes the Wairarapa Line and the southern end of the Manawatu Line. These will
be supported by and incorporated into a new Wellington Regional Rail Plan (WRRP), which is currently
under development.
Background
1987
The Wairarapa and Manawatu lines are an established, integral and wel -utilised component of the lower
North Island transport system. They serve areas that are experiencing significant ongoing population
growth, which is forecast to continue in the future, and the longer-distance services that operate on the
lines fulfil very important transport system access and capacity roles.
The Wairarapa Line links Masterton and Wellington. It is one of only two transport links between the
Wairarapa sub-region and the rest of the Wel ington region, and it has a critical role connecting Wairarapa
residents to many employment, educational and other opportunities and services that are not available
locally. Its direct route under the Remutaka Range is safer, more efficient and more resilient than paral el
State Highway 2, which crosses the range via a steep, winding and narrow route that is very busy at peak
times and has a high crash risk, low average speed and susceptibility to weather-related closure. Rail
LGOIMA,
passenger services on the line consequently have an important road substitute role and a high mode
share of commuting trips, including a very high 60% share of trips to the Wellington CBD, which is around
half of the journey to work trips between Wairarapa and the entire Wel ington region. This provides
consequent congestion, parking and environmental benefits in the Hutt Val ey and Wel ington city.
Wairarapa Line services also provide access and vital extra capacity to supplement the electrified metro
rail services in the Hutt Val ey, where they are an integral part of the rail service offering.
under
The Wairarapa Line is operated as part of the Metlink public transport network. It is currently served by
three peak direction services in each weekday peak, two weekday off-peak services in each direction, an
additional service in each direction on Friday nights, and two in each direction on weekend days. These
carried approximately 625,000 peak passengers and 154,000 off-peak passengers in the 2019 financial
year. Peak services are close to capacity, and changes were made to carriage allocation to provide
short term relief on the most-crowded afternoon service in April 2019. Further options to improve asset
utilisation are being investigated but are limited.
Wairarapa Line services are provided by a mixed fleet of conventional locomotive-hauled rolling stock
consisting of two types of rebuilt ex-British Rail carriages that date from the 1970s. GWRC is about to
Released
commence a light mid-life refurbishment of both types, which wil extend the carriages’ life to the mid-
2020s. This could be expanded to al ow the fleets to remain in service for a longer period if required. All
carriages will be life-expired and require replacement by 2032.
The Manawatu Line links Palmerston North and Wellington. It serves a large catchment in the northwest of
the Wellington region and south of the Horizons region, and connects residents to many employment,
educational and other opportunities and services that are not available elsewhere on the corridor.
Services also provide vital extra capacity to supplement the electrified metro rail services south of
Waikanae. The line parallels State Highway 1 for much of its length, which carries large traffic volumes and
is geographical y constrained, making it vulnerable to congestion and resilience events. The road is
currently being upgraded to expressway to north of Otaki, which is expected to both al eviate these
problems along some of the corridor in the short to medium term and increase population and general
transport demand on the corridor.
The Manawatu Line is currently served by the Capital Connection, a weekday commuter train operated
by KiwiRail, which runs a single peak direction service in each weekday peak. This carried approximately
Stantec │ Lower North Island Longer-Distance Rolling Stock Business Case │ 26 September 2019
Status: Draft │ Project No.: 310200204 │ Our ref: 310200204 190926 Lower North Island Longer-Distance Rol ing Stock Business Case -
Amended Draft Final.docx │ Page i
134,000 passengers in the 2019 financial year and is increasingly operating at capacity on some days of
the week. Capacity is constrained by rol ing stock availability and cannot be increased.
Manawatu Line services are provided by a fleet of conventional locomotive-hauled rolling stock, similarly
to the Wairarapa Line. Although the Manawatu Line carriages were rebuilt from the same 1970’s-era ex
British Rail carriage source as the Wairarapa Line carriages, they differ from and are incompatible with
them. Critical y, the carriages are close to the end of their service life and require either extensive
refurbishment or replacement prior to mid-2021 to enable continued operation of services after that point.
A decision on whether to proceed with refurbishment wil be required within six months.
Regional and National Context Investment in longer-distance rail passenger rol ing stock, and reliability, capacity, frequency and journey
time improvements is foreshadowed and supported by Wel ington and Horizons transport plans and
supported by spatial planning and regional economic development programmes in both regions.
Regional Land Transport Plans (RLTPs) are especial y relevant as they provide the strategic context and
investment programme for land transport (including public transport) in each region. Both RLTPs prioritise
investment in the improvements noted in this business case. Both RLTPs are also due for review, which is
timely as this business case can be used to confirm the investment programme for rail long distance rail in
both regions.
1987
Regional Public Transport Plans (RPTPs) are also integral to this discussion. The existing Wellington RPTP sets
out the key elements of the existing WRRP, including Rail Scenario 1 with a focus on unlocking capacity
across the network. This business case builds on current initiatives and foreshadows longer term ideas and
plans to increase supply. As with the reviews of RLTPs, the current review of the WRRP and upcoming
reviews of both RPTPs provide an ideal opportunity to set out the key delivery components of this business
case in much greater detail.
Investment in improvements is consistent with the NZTA’s strategic view and investment priorities for each
corridor in both regions, where the rail modal option is seen as being an important component of the multi-
modal transport mix. It is also consistent with the Government’s higher-level land transport priorities as
LGOIMA,
expressed in the Government Policy Statement on Land Transport, addressing objectives associated with
the key ‘Access’ strategic priority, which commits to increased investment in urban and inter-regional
public transport in both peak and off-peak periods, and the supporting ‘Environment’ strategic priority,
which commits to increased investment in lower emission modes of transport such as public transport.
Investment in longer-distance rol ing stock and services achieves these objectives by enhancing
connectivity, capacity, reliability and resilience at several critical points on the network, on existing
commuter rail services that support housing and employment and, in the case of the Wairarapa Line, are
under
close to capacity. Investment in rail services that are at capacity or support housing and employment is a
specific GPS focus.
Investment in improvements is also likely to meet al key requirements for the Provincial Growth Fund (PGF),
including sustainable economic development, social inclusion and participation, climate change and
environmental sustainability, and resilience objectives. The Horizons Region and Wairarapa and Kapiti
areas of the Wel ington Region are eligible for PGF funding.
Problem Definition A stakeholder assessment at an October 2017 workshop found that there are three clear problems
Released
associated with the existing longer-distance rail rol ing stock fleet, which need to be addressed with some
urgency. These relate to train condition, fleet capacity, and operational (in)efficiencies.
Train Condition
All existing longer-distance rail rol ing stock dates from either the early 1970s (carriages) or late 1970s
(luggage / generator vans). Although al have been subsequently rebuilt to varying degrees and are
equipped to current amenity and safety standards, the bulk of the fleet is now approaching 50 years in
age and nearing the end of its service life.
The Manawatu Line carriages are of most concern. These have been in continuous post-rebuild service for
nearly 20 years and increasing age-related maintenance costs are reflected in a current
mil ion short-
term funding gap. The carriages wil either require full refurbishment at an estimated cost of
million,
replacement, or withdrawal from service prior to mid-2021. This timeframe places some urgency on an
investment decision and subsequent implementation of the chosen option.
The Wairarapa Line carriages are less of an immediate concern. However, they are looking increasingly
tired due to their heavy use, are increasingly unable to cope with demand, and several components are
Stantec │ Lower North Island Longer-Distance Rolling Stock Business Case │ 26 September 2019
Status: Draft │ Project No.: 310200204 │ Our ref: 310200204 190926 Lower North Island Longer-Distance Rol ing Stock Business Case -
Amended Draft Final.docx │ Page ii
link to page 5
approaching end of life. GWRC is about to commence a light mid-life refurbishment, which wil enable
them to continue operating until the mid-2020s as previously noted, but a more extensive refurbishment to
enable them to operate until 2032 wil be avoided if they are replaced at that point.
Fleet Capacity
Wairarapa Line patronage has grown substantial y over the last decade, increasing by 15% to 780,000
boardings in the decade ending in the 2019 financial year. Peak patronage increased by 24% over the
same period, and it has been close to or greater than seated capacity over much of the decade, despite
the introduction of additional capacity in 2013.
Figure 1-1 shows that peak services are again
approaching seated capacity and indicates that crowding can be expected to become an increasing
problem unless significant capacity improvements are made to cater for future demand, particularly if the
recent four-year average annual peak growth rate of 3.3% is sustained. This rate is well above the current
forecast.
Current
Seated Capacity
Forecast
Population (1.3%)
Recent (3.3%)
2,400
1987
nage
2,200
atro
2,000
1,800
eak P
1,600
ing P
rn
1,400
1,200
1,000
LGOIMA,
ge Daily Mo
800
vera
600
400
pa Line A
ra
200
under
aira
0
W
09
14
19
24
29
34
39
Jun-
Jun-
Jun-
Jun-
Jun-
Jun-
Jun-
Figure 1-1: Wairarapa Line morning peak patronage and projected demand
Manawatu Line patronage fluctuated over the decade ending in the 2019 financial year, reflecting the
Released
impact of electrification of the Paraparaumu-Waikanae section of the Kapiti Line in early 2011, the existing
service’s low frequency, worn rol ing stock and uncertain future, and fare increases necessitated by its
commercial nature. However, traffic congestion and increased urban development and population
growth are again driving strong patronage growth, resulting a recent four-year average annual growth
rate of 3.1%. The existing service carried 136,000 passengers in the 2019 financial year and is increasingly
operating at capacity on some days.
Patronage on the electrified Hutt, Johnsonvil e and Kapiti Lines has grown substantial y over the last
decade, similarly to the Wairarapa Line, increasing by 21% to 13.5 mil ion boardings in the 2019 financial
year. This growth reflects population growth on the corridors that the lines serve, and investment in
improvements in infrastructure, rol ing stock and services that have improved service quality, frequency
and reliability, including the complete replacement of the previous obsolete electric fleet by the new
Matangi fleet between 2010 and 2016.
Electrified area patronage growth has been most significant at the peak, with Hutt Line, Johnsonvil e Line,
and Kapiti Line average daily morning peak patronage increasing by 16%, 11% and 29% respectively
Stantec │ Lower North Island Longer-Distance Rolling Stock Business Case │ 26 September 2019
Status: Draft │ Project No.: 310200204 │ Our ref: 310200204 190926 Lower North Island Longer-Distance Rol ing Stock Business Case -
Amended Draft Final.docx │ Page iii
link to page 6 link to page 7
between mid-2009 and mid-2019.
Figure 1-2 shows that the peak period increase has been most acute
since mid-2015, reflecting similar trends to the Wairarapa and Manawatu lines since that point, and it
indicates that capacity improvements are likely to be required to cater for future demand, particularly if
recent the recent four-year average annual peak growth rate of 5.5% is sustained. This rate is well above
forecast.
Current
Seated Capacity
Forecast (with LGWM)
Population (1.0%)
Recent (5.5%)
45,000
nage 40,000
atro 35,000
eak P
30,000
ing P
orn 25,000
1987
20,000
ge Daily M 15,000
vera
a A 10,000
5,000
LGOIMA,
0
Electrified Are
09
14
19
24
29
34
39
Jun-
Jun-
Jun-
Jun-
Jun-
Jun-
Jun-
Figure 1-2: Electrified area morning peak patronage and projected demand
under
Figure 1-3 shows that the capacity issue is particularly acute between 7:30 and 8:30, where ideal capacity
could be exceeded by 2024, and standing capacity by 2029, if there are no further initiatives beyond
proposed RS1 timetable changes, which wil maximise utilisation of the Matangi fleet once associated
infrastructure is in place. This wil require additional peak capacity if crowding and mode shift away from
public transport is to be avoided.
Rolling stock lead times place urgency on resolution of this problem, but a small metro EMU order is
expected to be unattractive to rol ing stock manufacturers. However, there is an opportunity to address
this capacity issue efficiently and promptly through resolution of the longer-distance capacity issue, since
Released
longer-distance services are an integral part of the metro service offering and are already used to provide
much needed capacity within the electrified area.
Stantec │ Lower North Island Longer-Distance Rol ing Stock Business Case │ 26 September 2019
Status: Draft │ Project No.: 310200204 │ Our ref: 310200204 190926 Lower North Island Longer-Distance Rol ing Stock Business Case -
Amended Draft Final.docx │ Page iv
link to page 7
Seated Capacity
Ideal Capacity
Standing Capacity
Forecast (with LGWM)
Current - All (5.7%)
Current - Peak (7.3%)
18,000
30 16,000
o 8:
30 t 14,000
12,000
eekdays 7: 10,000
als -W 8,000
rriv 6,000
n A
Change
4,000
able
1987
et
im
2,000
gton Statio
1 T
RS
ellin
0
W
19
24
29
34
39
Jun-
Jun-
Jun-
Jun-
Jun-
Figure 1-3: Projected Wel ington Station morning peak hour demand and capacity (al Metlink lines)
LGOIMA,
Operational Efficiencies
The Wairarapa and Manawatu lines are run as separate operations, which is inflexible and inefficient.
There is no ability to manage operations between the two lines, nor is there the ability to manage rol ing
stock fleet al ocation and maintenance in an effective way. Maintenance is further complicated by a
complex set of contractual relationships. under
The mixed rolling stock fleet of three different and incompatible carriage types across the two lines is also
an issue. This limits interoperability and does not provide the economies of scale that might be available if
the fleet was composed of a single type.
Existing services on both lines are locomotive hauled and consequently expensive to operate. The
locomotives require special safety features that limits the pool that are available run services, which in turn
necessitates extras to provide redundancy to cover failures, increasing fleet requirements. The locomotive
hire cost is consequently a sizeable proportion of the cost of running services on both lines and the cost of
providing additional services is therefore high.
Released
Locomotive-hauled trains are also very operational y limiting. They require long turnaround times that are a
considerable constraint, particularly in Wellington where there is conflict with other services that limits the
efficient operation of al services at peak times, and they are consequently a barrier to frequency
enhancements that might otherwise help to address capacity issues. The locomotive turning requirement
also necessitates that two locomotives must be used instead of one when a train runs for only part of a
line’s length, which has consequent cost impacts.
Benefits of Investment A stakeholder assessment found that investing to address the problems is expected to provide four major
benefits: enhanced regional connectivity, improved rail service quality, a more resilient transport network,
and investment value for money. These benefits link closely to the objectives of key central and local
government strategies and plans, and provide strategic justification for investing in a rolling stock solution,
as summarised in
Table 1-1. Table 1-1: Links between investment benefits and relevant strategies and plans
Stantec │ Lower North Island Longer-Distance Rolling Stock Business Case │ 26 September 2019
Status: Draft │ Project No.: 310200204 │ Our ref: 310200204 190926 Lower North Island Longer-Distance Rol ing Stock Business Case -
Amended Draft Final.docx │ Page v
link to page 9 link to page 7
Enhanced
Improved
More
Value for
Regional
Rail Service
Resilient
Money
Connectivity Quality
Transport
Network
Wellington Regional Rail Plan
Wel ington Regional Public Transport Plan
Wel ington Regional Land Transport Plan
Wairarapa Economic Development Strat
Horizons Regional Public Transport Plan
Horizons Regional Land Transport Plan
Horizons Accelerate25 Growth Programme
NZTA Long Term Strategic View
1987
NZTA Investment Proposal
Govt Policy Statement on Land Transport
Provincial Growth Fund
Enhanced Regional Connectivity
Investment wil maintain existing connectivity into the future and then further strengthen it if used to
improve capacity and service levels in the growth areas served by the two lines. This wil improve liveability
LGOIMA,
and quality of life and help to drive local economic activity and growth in the areas served by them, as
identified in the regional economic development plans. Additional capacity wil also strengthen the
capacity of Metlink’s core electrified rail corridors by providing additional capacity and travel options at
key stations, helping to manage connectivity on those lines as demand increases.
Improved Rail Service Quality
Investment wil ensure that the services remain running and running reliably into the future, that they can
under
cope with current and ongoing growth, and that they remain attractive to and a preferred choice for
users, the majority of whom spend two to four hours a day travelling by train.
More Resilient Transport Network
Investment wil offer transport system-level resilience benefits by providing a modal and route alternative to
the road network, and public transport network-level resilience benefits by utilising a different power
source from the electrified network if the chosen option does not solely rely on an overhead power source.
This benefit wil be enhanced if the fleet can be managed between the two lines to al ow resilience-
related capacity issues to be managed.
Released
Value for Money
Direct value for money benefits from investment are likely to come from the elimination of some impending
heavy maintenance, maintenance and operational economies of scale, and if chosen in an option, from
replacement of locomotive haulage with a more-efficient motive power source. These would al ow the
same level of service to be provided at lower cost, or more service to be provided at the same level of
investment, with either scenario providing better value for money than at present.
Value for money will also be provided at the public transport network level, by al owing patronage growth
to be accommodated without requiring other additional capacity, and transport system level, by al owing
transport system growth to be accommodated without additional road capacity.
Figure 1-4 shows how
investment in an expanded longer-distance rol ing stock fleet and associated services might address the
morning peak hour capacity issue shown in
Figure 1-3, delaying the requirement for additional EMU
capacity until the Matangi fleet is replaced and so offering network level value for money.
Stantec │ Lower North Island Longer-Distance Rolling Stock Business Case │ 26 September 2019
Status: Draft │ Project No.: 310200204 │ Our ref: 310200204 190926 Lower North Island Longer-Distance Rol ing Stock Business Case -
Amended Draft Final.docx │ Page vi
link to page 10
Seated Capacity (with LD)
Ideal Capacity (with LD)
Standing Capacity (with LD)
Forecast (with LGWM)
Current - All (5.7%)
Current - Peak (7.3%)
30 18,000
o 8: 16,000
30 t
14,000
eekdays 7: 12,000
10,000
als -W
pact
rriv
8,000
n A
6,000
Change
1987
4,000
able
et
gton Statio
im
2,000
ellin
1 T
ling stock capacity im
W
RS
Ro
0
19
24
29
34
39
Jun-
Jun-
Jun-
Jun-
Jun-
LGOIMA,
Figure 1-4: Projected Wel ington Station morning peak hour demand and extra capacity (al Metlink lines)
Finally, value for money may be gained from joint procurement of a replacement fleet with other regions
and/or the ability the use a new Wellington fleet to run trials in other parts of the country.
Option Selection
under
Six investment options have been identified from a long list of sixteen potential mode/fleet and nine
potential service level responses by stakeholders. These are:
•
Option 1: maintain the existing Wairarapa Line fleet and services and al ow Manawatu Line services to
cease operating (the do-minimum option);
•
Option 2: improve the Wairarapa Line fleet and service levels by purchasing additional used rol ing
stock and maintain the existing Manawatu Line fleet and service levels (the enhanced status quo
option);
•
Option 3: electrify to Featherston and Otaki, extend electric multiple unit (EMU) operations to those
Released
points and improve service levels, with bus connections from outer points;
•
Option 4: replace existing fleets with a diesel multiple unit (DMU) fleet at the earliest opportunity and
improve service levels;
•
Option 5: replace existing fleets with a dual-mode multiple unit (DMMU) fleet at the earliest opportunity
and improve service levels; and
•
Option 6: electrify to Masterton and Palmerston North, extend EMU operations to those points at
earliest opportunity and improve service levels.
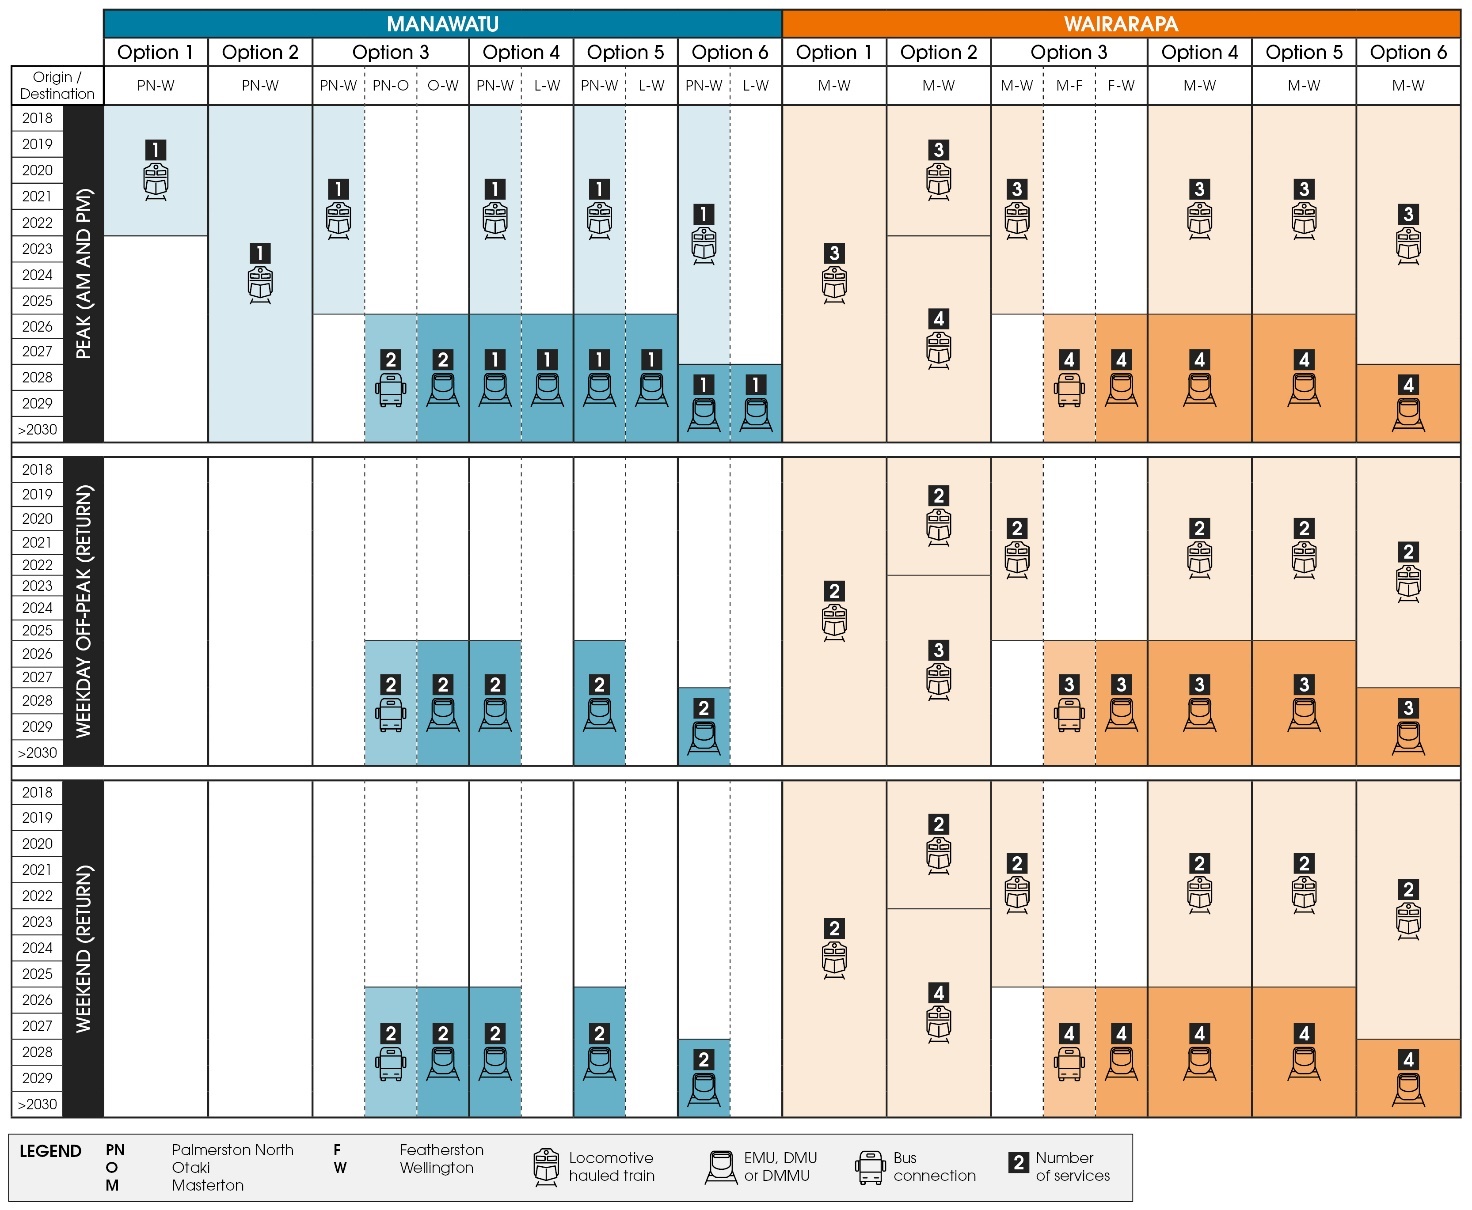
Figure 1-5 summarises and compares the timing (financial year) and level of service provided by the
operational elements of the options.
Stantec │ Lower North Island Longer-Distance Rolling Stock Business Case │ 26 September 2019
Status: Draft │ Project No.: 310200204 │ Our ref: 310200204 190926 Lower North Island Longer-Distance Rol ing Stock Business Case -
Amended Draft Final.docx │ Page vii
link to page 11
1987
LGOIMA,
under
Figure 1-5: Summary of the timing and level of service provided by each option at key periods
The options have been assessed against the assessment framework shown i
n Table 1-2, which consists of:
•
Four investment objectives identified by stakeholders, which show the options’ likely response to the
problems and benefits, relating to service capacity, customer satisfaction, operational flexibility (which
includes resilience) and whole of life costs;
•
Seven critical success factors identified by stakeholders, which are essential to the successful
implementation of any option, relating to strategic alignment, affordability – capital costs, affordability
– operational costs, technical achievability, resilience, environmental sustainability, and public
Released
acceptability (which includes timeframe and environment); and
•
Four option characteristics, which al ow the options to be compared further, relating to indicative cost,
indicative economics, implementation timeframe, and key risks.
The DMU and DMMU options have been found to be best performing across al three aspects of the
assessment. The DMU option is more affordable and provides a slightly better economic return, but the
DMMU option best meets the scored assessment criteria, with better scores against the investment
objectives and crucial Strategic Alignment critical success factor. The DMMU option is consequently
ranked ahead of DMU, although both options are viable.
Stantec │ Lower North Island Longer-Distance Rolling Stock Business Case │ 26 September 2019
Status: Draft │ Project No.: 310200204 │ Our ref: 310200204 190926 Lower North Island Longer-Distance Rol ing Stock Business Case -
Amended Draft Final.docx │ Page viii
link to page 11 link to page 11 link to page 11
Table 1-2: Option assessment summary
t
st
t
et
ts
Flee
t
Flee
Boo e
e
g
a
U Fle
1: n
le
U Fleet
ap
2: in & F
3:
M
MMU
U Fle
htin
g
l EM
ig
D
D
tion ntai rar
tion inta tin
tion
tion 4:
tion 5:
tion 6: EM
p ai ai
p a
p rtia
p ew
ew
p
We
O M W
O M Exis
O Pa
O N
Op N
O Full
Investment Objectives
Increase service capacity
25%
L
M
M
H
H
H
Improve customer
15%
satisfaction
L
L
L
H
H
H
Maximise operational
10%
flexibility
L
L
L
M-H
H
M
Minimise whole of life costs
10%
1987
per passenger
H
M
M-H
H
H
L
1
Critical Success Factors
Strategic alignment
10%
L
L-M
M
M-H
H
M-H
Affordability - capital
5%
H
M
M
M
M
L
Affordability - operational
5%
H
L-M
M-H
M
M
M
Technical achievability
5%
H
H
H
H
M-H
H
Resilience
5%
L
M
M-H
H
H
M-H
LGOIMA,
Environmental sustainability
5%
L
L
M
L-M
M-H
H
Public acceptability
5%
L
L-M
L
M
M-H
M
Characteristics2
Indicative 30-year net cost
$200 -
$176 -
$202 -
$454 -
under
over do-minimum (2018 $m)
-
$227 -
$386
$364
$343
$381
$754
Indicative 30-year BCR over
do-minimum
3
-
0.9 - 2.2
0.9 - 2.2
1.2 - 3.3
1.1 - 2.9
0.5 - 1.2
Indicative 60-year BCR over
do-minimum
-
1.1 - 3.1
1.1 - 3.3
1.4 - 5.0
1.3 - 4.2
0.7 - 2.0
Indicative implementation
timeframe
13 years
3 years
7 years
7 years
7 years
9 years
Key Risks
t
t
t
Released en e en
ty
en
gy
ture
er
e er xi e er
lo
m th
m th
le
p
m th
ironm ilienc to
ironm ilienc to
ilienc to
ironm
hno
t struc
us ow
us ow
om
us ow
os
Env Res C Gr
Env Res C Gr
C Res C Gr
Env
Tec
C Infra
MCA score
100%
2.0
2.3
2.7
4.4
4.7
3.9
Overal Ranking
6
5
4
2
1
3
1 Based on the discounted net cost per passenger over a 60-year assessment period.
2 Costs, benefits and BCR ranges are based on 80% of the model ed costs and high patronage and revenue growth
(see Section 5.4.1), 120% of costs and low growth, and a 4% discount rate.
3 BCRs are indicative high-level ‘first cut’ BCRs, which were used to test the options at the option selection stage. They
differ from those that support the recommended option, which were the result of detailed analysis of benefits and costs.
Stantec │ Lower North Island Longer-Distance Rolling Stock Business Case │ 26 September 2019
Status: Draft │ Project No.: 310200204 │ Our ref: 310200204 190926 Lower North Island Longer-Distance Rol ing Stock Business Case -
Amended Draft Final.docx │ Page ix
Recommended Option The investment proposal entails the replacement of al existing longer-distance rail rol ing stock with a fleet
of 15 four-car DMUs or DMMUs, which wil be owned by GWRC and enter service in the 2025 financial year.
The new rolling stock will operate all services on the Wairarapa and Manawatu lines, which wil run at
improved frequencies to provide better access and capacity between Masterton/Palmerston North and
Wellington, including much needed additional capacity at key stations within the electrified area.
Supporting improvements wil be made to maintenance facilities, stations and network infrastructure.
Existing rolling stock will be maintained in acceptable operating condition until the introduction of the new
rol ing stock and then be retired.
The DMMU option is the primary preferred and recommended option due to its better alignment with the
investment objectives and key success factors. A detailed assessment has found that this has:
•
medium growth 30-year discounted benefits of $551.7m compared to costs at the same level of
$291.2m, and a projected BCR range of 1.3 to 2.6 (compared to a DMU BCR range of 1.5 to 3.0); and
•
a higher BCR range of 2.2 to 4.1 (compared to a DMU BCR range of 2.5 to 5.1) if the cost of network
infrastructure, which is required to restore infrastructure that was previously removed and catch up for
past underinvestment, is excluded.
1987
Assessment against the NZTA’s 2018-21 Investment Assessment Framework gives a recommended results
alignment rating of Very High and a BCR rating of Low, which give both options a priority order rating of 1,
the highest priority for NLTP funding. The Very High rating relates to the ongoing improvement in access
that the investment proposal enables for large numbers of passengers on the Wellington region’s main
northern corridors.
GWRC would lead implementation and be responsible for procuring the new DMMU rol ing stock fleet and
station-related infrastructure improvements, along with overal programme management. GWRC would also
be responsible for long-term operation of services on both lines, including Manawatu Line services, which
would be incorporated into its existing rail contract and operated on behalf of HRC north of the regional
LGOIMA,
boundary. KiwiRail would be responsible for network-related infrastructure improvements in accordance with
the Metropolitan Rail Operating Model. Key risks around timeframe, funding, KiwiRail’s commercial interests,
costs and revenue would be managed through the project management process and contractual
mechanisms.
The investment proposal includes expected project capital expenditure of $415.3m, with a
confidence
under
estimate of $449.2m. It is proposed that network infrastructure wil be funded by the NZTA at a
FAR,
rol ing stock, maintenance facility and station improvements receiving a special
FAR, and ongoing
maintenance and operations receiving a standard
FAR. Cost and revenue wil be shared between
GWRC and HRC based on the share of vehicle service km in each region. An urgent funding decision is
required to enable the specification and procurement process to commence in mid-2020 and ensure that
sufficient capacity is in place when required to meet projected demand pressures, given the long lead times
for rol ing stock and supporting infrastructure.
In conclusion, the investment proposal has been shown to clearly respond to significant problems and offer
significant benefits to the lower North Island. These link closely with national transport and economic
development priorities and provide a strong case for investment. It is therefore recommended that
Released
investment decision makers:
•
approve this proposal to replace existing Wel ington longer-distance rail rol ing stock with a fleet of 15
four-car dual-mode DMMU units, and associated infrastructure and service enhancements;
•
approve funding through appropriate channels at appropriate FAR rates by June 2020; and
•
prioritise these approvals, to al ow project planning to commence and enable the new rol ing stock to
be brought into service in the 2025 financial year and service improvements to be implemented the
fol owing financial year.
Decision Sought •
Agree that Option 5 - replace existing fleets with a dual-mode multiple unit fleet at the earliest
opportunity and improving service levels once the fleet is in place is the best outcome for this business
case;
Stantec │ Lower North Island Longer-Distance Rolling Stock Business Case │ 26 September 2019
Status: Draft │ Project No.: 310200204 │ Our ref: 310200204 190926 Lower North Island Longer-Distance Rol ing Stock Business Case -
Amended Draft Final.docx │ Page x
•
Agree funding of the preferred option’s capital investment of $415.3m (or the
confidence
estimate of $449.2m), ful y or partial y co-funded through the NLTP at a full FAR (network infrastructure)
and special FAR rate (other capital investment), or potential y through another source such as the PGF,
subject to funding approval;
•
Agree that GWRC procure and deliver the new DMMU rol ing stock fleet and above-track
infrastructure, along with overal programme management; and
•
Agree that KiwiRail to procure and deliver network infrastructure-related improvements
•
Confirm funding arrangements by June 2020, to enable specification, design and procurement
processes to commence immediately and ensure that the rol ing stock is in place when required to
help manage demand.
1987
LGOIMA,
under
Released
Stantec │ Lower North Island Longer-Distance Rolling Stock Business Case │ 26 September 2019
Status: Draft │ Project No.: 310200204 │ Our ref: 310200204 190926 Lower North Island Longer-Distance Rol ing Stock Business Case -
Amended Draft Final.docx │ Page xi
Abbreviations
DMMU
Dual Mode Multiple Unit
DMU
Diesel Multiple Unit
EDMU
Electro-Diesel Multiple Unit
EEM
Economic Evaluation Manual
EMU
Electric Multiple Unit
FAR
Funding Assistance Rate
FY
Financial Year
GPS
Government Policy Statement on Land Transport
1987
GWRC
Greater Wellington Regional Council
HRC
Horizons Regional Council
LGWM
Let’s Get Wellington Moving
LTMA
Land Transport Management Act
LGOIMA,
MOT
Ministry of Transport
NLTF
National Land Transport Fund
NLTP
National Land Transport Programme
NZRP
New Zealand Rail Plan
under
NZTA
New Zealand Transport Agency
PGF
Provincial Growth Fund
RGF
Regional Growth Framework
RIC
Rail Infrastructure Consultants
RLTP
Regional Land Transport Plan
Released
RPTP
Regional Public Transport Plan
RNIP
Rail Network Investment Plan
RS1
Rail Scenario 1
TAIP
Transport Agency Investment Proposal
WMUP
Wel ington Metro Upgrade Programme
WRRP
Wellington Regional Rail Plan
Stantec │ Lower North Island Longer-Distance Rol ing Stock Business Case │ 26 September 2019
Status: Draft │ Project No.: 310200204 │ Our ref: 310200204 190926 Lower North Island Longer-Distance Rol ing Stock Business Case - Amended
Draft Final.docx │ Page xi
link to page 7 link to page 11 link to page 29 link to page 30
Greater Wellington Regional Council
Lower North Island Longer-Distance Rolling Stock Business Case
CONTENTS
Executive Summary ........................................................................................................................................................ i
Abbreviations ............................................................................................................................................................... xii
1.
Introduction ...................................................................................................................................................... 1
2.
Strategic Context ............................................................................................................................................ 2
2.1
Background ...................................................................................................................................................... 2
2.2
Regional Context ............................................................................................................................................. 7
2.3
National Context............................................................................................................................................ 11
1987
2.4
Conclusion ...................................................................................................................................................... 14
3.
Strategic Assessment .................................................................................................................................... 16
3.1
Problem Definition ......................................................................................................................................... 16
3.2
Benefits of Investment ................................................................................................................................... 24
3.3
Investment Objectives .................................................................................................................................. 26
3.4
Conclusion ...................................................................................................................................................... 27
LGOIMA,
4.
Option Selection ............................................................................................................................................ 29
4.1
Options Development ................................................................................................................................... 29
4.2
Options Description ....................................................................................................................................... 29
4.3
Option Assessment ........................................................................................................................................ 42
under
4.4
Conclusion ...................................................................................................................................................... 47
5.
Recommended Option ................................................................................................................................ 48
5.1
Description ...................................................................................................................................................... 48
5.2
Benefits ............................................................................................................................................................ 53
5.3
Costs ................................................................................................................................................................ 55
5.4
Economic Analysis ......................................................................................................................................... 58
5.5
Assessment Profile .......................................................................................................................................... 62
Released
5.6
Commercial Case .......................................................................................................................................... 64
5.7
Financial Case ................................................................................................................................................ 68
5.8
Management Case ....................................................................................................................................... 70
5.9
Conclusion and Final Recommendation ................................................................................................... 71
LIST OF TABLES
Table 1-1: Links between investment benefits and relevant strategies and plans .............................................. v
Table 1-2: Option assessment summary ..................................................................................................................... ix
Table 2-1: Relevant activity class investment priorities and opportunities .......................................................... 12
Table 2-2: GPS access and environment strategic priorities, objectives and applicable results .................... 13
Stantec │ Lower North Island Longer-Distance Rol ing Stock Business Case │ 26 September 2019
Status: Draft │ Project No.: 310200204 │ Our ref: 310200204 190926 Lower North Island Longer-Distance Rol ing Stock Business Case - Amended
Draft Final.docx
link to page 45 link to page 46 link to page 47 link to page 48 link to page 50 link to page 52 link to page 54 link to page 56 link to page 58 link to page 59 link to page 60 link to page 63 link to page 68 link to page 69 link to page 70 link to page 73 link to page 74 link to page 75 link to page 77 link to page 77 link to page 78 link to page 78 link to page 79 link to page 80 link to page 83 link to page 85 link to page 86 link to page 86 link to page 87 link to page 88 link to page 5 link to page 6 link to page 7 link to page 9 link to page 10 link to page 19 link to page 21 link to page 22
Table 3-1: Links between the investment benefits and relevant strategies and plans ..................................... 28
Table 4-1: Potential options ........................................................................................................................................ 29
Table 4-2: Option 1 operational and fleet and infrastructure requirements ...................................................... 30
Table 4-3: Option 2 operational and fleet and infrastructure requirements ...................................................... 31
Table 4-4: Option 3 operational and fleet and infrastructure requirements ...................................................... 33
Table 4-5: Option 4 operational and fleet and infrastructure requirements ...................................................... 35
Table 4-6: Option 5 operational and fleet and infrastructure requirements ...................................................... 37
Table 4-7: Option 6 operational and fleet and infrastructure requirements ...................................................... 39
Table 4-8: Summary of the fleet and infrastructure requirements and completion financial year................. 41
Table 4-9: Assessment framework scoring system ................................................................................................... 42
Table 4-10: Option assessment summary ................................................................................................................. 43
Table 4-11: Mid-range and incremental BCRs ......................................................................................................... 46
Table 5-1: Current and proposed service levels - Wairarapa Line ....................................................................... 51
1987
Table 5-2: Current and proposed service levels - Manawatu Line ...................................................................... 52
Table 5-3: Links between the problem response, and investment benefits and objectives ............................ 53
Table 5-4: 30-year discounted cost of DMU cost elements over the do-minimum ........................................... 56
Table 5-5: 30-year discounted cost of DMMU cost elements over the do-minimum ........................................ 57
Table 5-6: Cost confidence ........................................................................................................................................ 58
Table 5-7: Results of DMU cost benefit appraisal .................................................................................................... 60
Table 5-8: Results of DMMU cost benefit appraisal ................................................................................................. 60
LGOIMA,
Table 5-9: Results of cost sensitivity testing with network infrastructure cost included ..................................... 61
Table 5-10: Results of cost sensitivity testing with network infrastructure cost excluded .................................. 61
Table 5-11: Results of benefit sensitivity testing ....................................................................................................... 62
Table 5-12: GPS results alignment .............................................................................................................................. 63
under
Table 5-13: Key risks ...................................................................................................................................................... 66
Table 5-14: Capital investment components without and with additional contingency ................................ 68
Table 5-15: DMMU capital investment cash flow .................................................................................................... 69
Table 5-16: DMMU loan repayment cashflow and funding split .......................................................................... 69
Table 5-17: DMMU change in operational costs (revenue, operating/maintenance/renewal costs)........... 70
Table 5-18: Key milestones .......................................................................................................................................... 71
Released
LIST OF FIGURES
Figure 1-1: Wairarapa Line morning peak patronage and projected demand.................................................. iii
Figure 1-2: Electrified area morning peak patronage and projected demand ..................................................iv
Figure 1-3: Projected Wel ington Station morning peak hour demand and capacity (al Metlink lines) ......... v
Figure 1-4: Projected Wel ington Station morning peak hour demand and extra capacity (al Metlink lines)vii
Figure 1-5: Summary of the timing and level of service provided by each option at key periods ................. viii
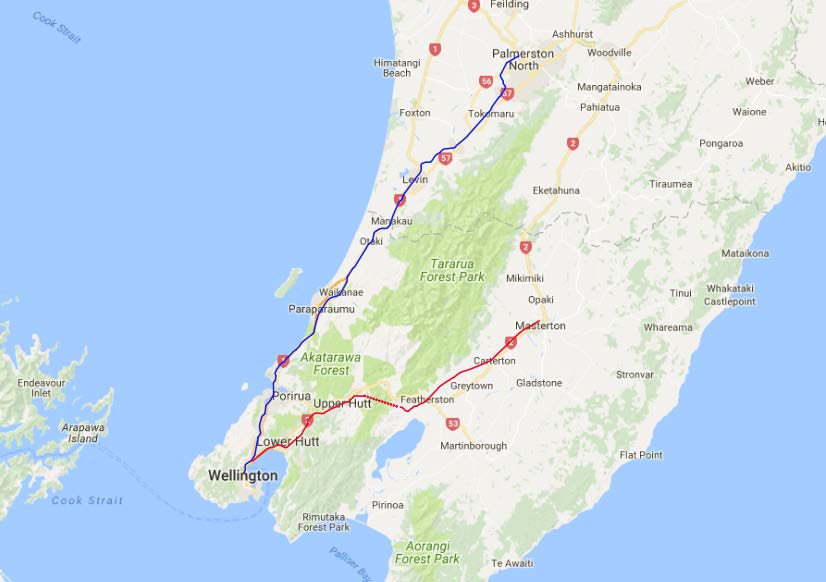
Figure 2-1: Wel ington longer-distance rail lines - Wairarapa (red) and Manawatu (blue) ............................... 2
Figure 2-2: SW carriage type ........................................................................................................................................ 4
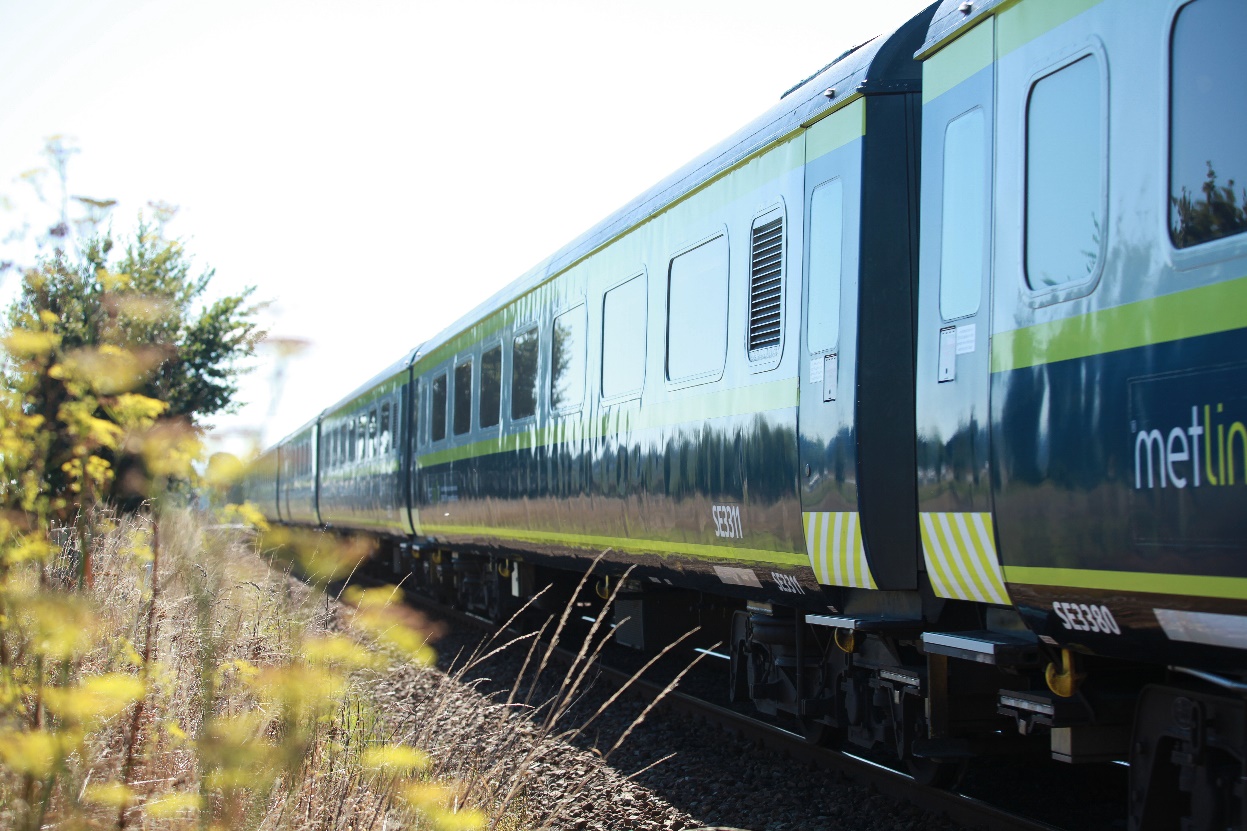
Figure 2-3: SE carriage type.......................................................................................................................................... 5
Stantec │ Lower North Island Longer-Distance Rol ing Stock Business Case │ 26 September 2019
Status: Draft │ Project No.: 310200204 │ Our ref: 310200204 190926 Lower North Island Longer-Distance Rol ing Stock Business Case - Amended
Draft Final.docx
link to page 23 link to page 34 link to page 35 link to page 36 link to page 37 link to page 38 link to page 39 link to page 39 link to page 43 link to page 43 link to page 57 link to page 65 link to page 66
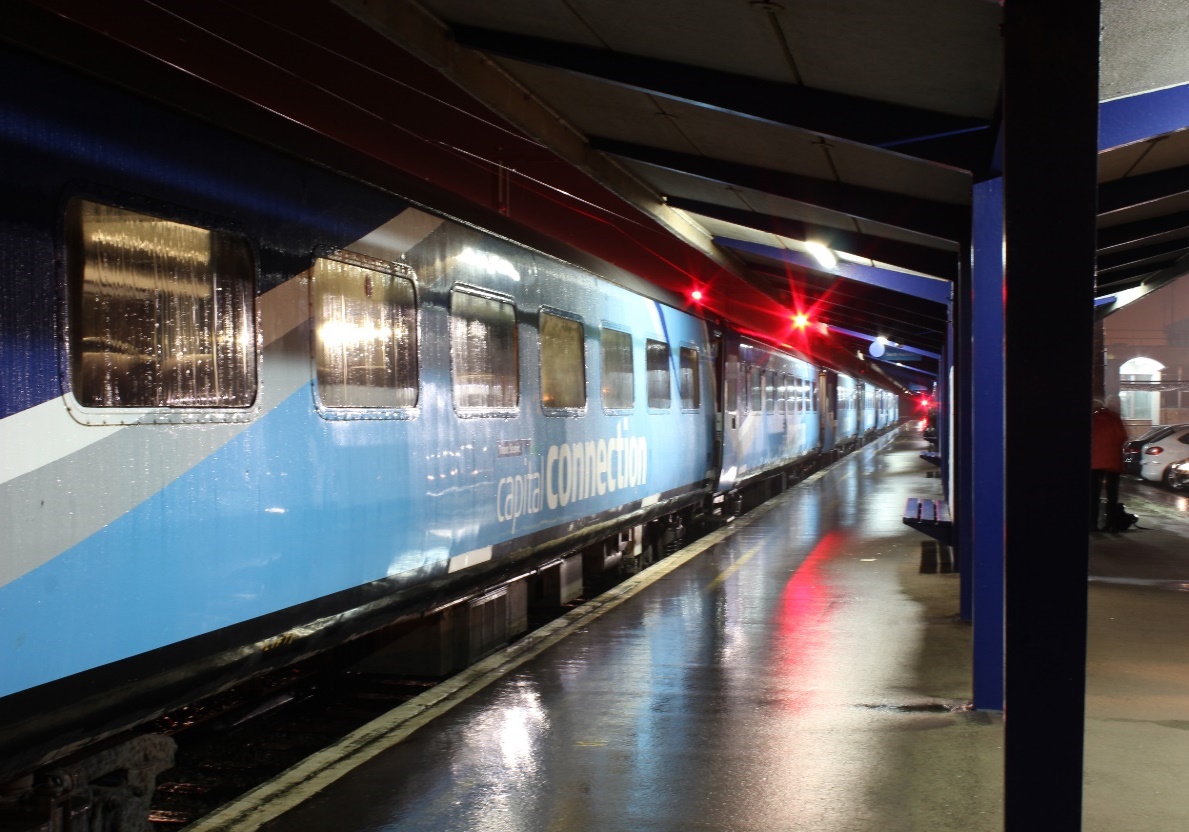
Figure 2-4: S carriage type (source: nzrailphotos.co.nz) .......................................................................................... 6
Figure 3-1: Wairarapa Line morning peak patronage and seated capacity .................................................... 17
Figure 3-2: Wairarapa Line morning peak patronage and projected demand................................................ 18
Figure 3-3: Manawatu Line morning peak patronage and seated capacity ................................................... 19
Figure 3-4: Manawatu Line morning peak patronage and projected demand ............................................... 20
Figure 3-5: Electrified area morning peak patronage .......................................................................................... 21
Figure 3-6: Electrified area morning peak patronage and projected demand ................................................ 22
Figure 3-7: Projected Wel ington Station morning peak hour demand and capacity (al Metlink lines) ....... 22
Figure 3-8: Projected Wel ington Station morning peak hour demand and extra capacity (al Metlink lines)
26
Figure 4-1: Summary of the timing and level of service provided by each option at key periods ................. 40
Figure 5-1: Characteristics of a DMU with diesel-hydraulic transmission ............................................................. 48
Figure 5-2: Characteristics of an EDMU .................................................................................................................... 49
1987
APPENDICES
Appendix A Investment Logic Map
Appendix B Benefits Realisation Plan
Appendix C Summary of Long List Options
Appendix D Investment Cash Flow
LGOIMA,
under
Released
Stantec │ Lower North Island Longer-Distance Rol ing Stock Business Case │ 26 September 2019
Status: Draft │ Project No.: 310200204 │ Our ref: 310200204 190926 Lower North Island Longer-Distance Rol ing Stock Business Case - Amended
Draft Final.docx
link to page 19 link to page 33 link to page 46 link to page 65
1.
Introduction
This business case has been prepared by Stantec New Zealand and Greater Wellington Regional Council
(GWRC), with economic peer review by Transport Futures Limited. It assesses the case for replacing the
rol ing stock fleets that provide longer-distance rail passenger services on the Wairarapa and Manawatu
lines, which are nearing end of life, and using the replacement fleet to improve service levels and increase
the overall capacity of GWRC’s Metlink rail network to address serious and urgent capacity constraints. It
fol ows a 2017 business case that assessed the case for continued short-term public investment in the
Palmerston North-Wellington rail passenger service, and two 2017 infrastructure-focused business cases
that assessed the case for catch-up track renewals and capacity and resilience enhancements on the
Wel ington metro rail network, which includes the Wairarapa Line and the southern end of the Manawatu
Line. These wil be supported by and incorporated into a new under-development Wellington Regional
Rail Plan (WRRP), which wil provide a future investment pathway for the Metlink network.
The business case takes the form of a single-stage business case fol owing the NZ Transport Agency (NZTA)
Business Case Approach. It therefore combines elements of the activity Strategic, Indicative and Detailed
business cases into a single document, which has the fol owing structure:
•
Chapter
2 describes the strategic context;
1987
•
Chapter
3 presents the strategic assessment, which combines with the strategic context to form the
Strategic Case;
•
Chapter
4 assesses the option selection process that forms the basis of the Indicative Case; and
•
Chapter
5 details the recommended option, completing the overal Detailed Case for investment.
The business case has been developed col aboratively by stakeholders. These include GWRC, which has a
key interest as the organisation that is responsible for planning and funding public transport in the
Wellington Region, Horizons Regional Council (HRC), which is responsible for planning and funding public
transport in the Horizons Region (Manawatu-Whanganui), and the NZTA, which has an interest both as the
LGOIMA,
Government’s transport investor and as the state highway network operator. Input has also been provided
by Transdev, the Wellington rail passenger service operator, KiwiRail, the network operator and operator of
the existing Palmerston North-Wellington service, and local councils on both corridors, al of whom
participated in one or more of the previous business cases. Additional input has been sought from other
parties as required.
under
Released
26 September 2019 │ Status: Draft │ Project No.: 310200204 │ Our ref: 310200204 190926 Lower North Island Longer-Distance Rolling Stock
Business Case - Amended Draft Final.docx
Page 1
link to page 19 link to page 19 link to page 19
2.
Strategic Context
2.1
Background
The lower North Island is served by an extensive network of public transport services, which include
Wel ington urban area bus, rail and ferry services, Wairarapa bus services, Palmerston North bus services,
and longer-distance rail services. The latter extend Wel ington’s core public transport corridors beyond the
Wel ington electrified area rail termini of Upper Hutt and Waikanae, to link Masterton on the Wairarapa
Line, and Palmerston North on the Manawatu Line, with Wel ington. Both lines have had continuous rail
passenger service since they were completed in the 1880s and are consequently an established and
integral part of the transport system in the communities that they serve, and the services that operate on
them are well-patronised.
The two lines are shown i
n Figure 2-1 and are described further in the following sections.
1987
LGOIMA,
under
Released
Figure 2-1: Wel ington longer-distance rail lines - Wairarapa (red) and Manawatu (blue)
2.1.1 Wairarapa Line
The Wairarapa Line is located on the eastern side of and entirely within the Wellington Region, and
primarily serves the Wairarapa sub-region, which is a predominantly rural area that encompasses 73% of
the region’s land area. Its population of 45,500
4 (approximately 9% of the region’s population) is
experiencing significant ongoing growth, which is forecast to continue in the future. The line links
Masterton (three stations), Carterton, Matarawa, Woodside (Greytown), and Featherston (with connecting
bus services from Martinborough), and surrounding areas of the Masterton, Carterton and South Wairarapa
districts, with each other and Wellington. Services also cal at Maymorn (where they are the only form of
public transport), Upper Hutt, Waterloo and Petone in the Hutt Val ey, to provide access to local
destinations and vital extra capacity to supplement the electrified metro rail services that serve the
population of 149,6
004 there, and are an integral part of the rail service offering.
4 Statistics New Zealand subnational population estimate as at 30 June 2018.
26 September 2019 │ Status: Draft │ Project No.: 310200204 │ Our ref: 310200204 190926 Lower North Island Longer-Distance Rolling Stock
Business Case - Amended Draft Final.docx
Page 2
link to page 21 link to page 22 link to page 20 link to page 20 link to page 20 link to page 20 link to page 20 link to page 20
The link is very important to Wairarapa residents, given that the Hutt Val ey and Wellington provide many
employment, educational and other opportunities and services that are not available locally.
Approximately one quarter of Wairarapa residents commute to other parts of the region for work.
The Wairarapa Line has a critical role as one of only two transport links between the Wairarapa and the
rest of the Wellington region. Its direct route under the Remutaka Range via the 8.8 km Remutaka Tunnel is
safer, more efficient and more resilient than paral el State Highway 2, which crosses the range via a steep,
winding and narrow route over a 555-metre summit. This road is very busy at peak times and has a high
crash risk
5, low average speed
6 and susceptibility to weather-related closure
7. Rail passenger services on
the line consequently have an important road substitute role, which is exemplified by the high rail mode
share of commuting trips, including a very high 60% share of trips to the Wellington CBD
8, which is around
half of the journey to work trips between Wairarapa and the entire Wel ington region. This provides
consequent congestion, parking demand and environmental benefits in the Hutt Valley and Wel ington
city.
The Wairarapa Line is currently served by three peak direction services in each weekday peak, two
weekday off-peak services in each direction, an additional service in each direction on Friday nights, and
two in each direction on weekend days. Each takes between 1 hour and 40 minutes and 1 hour and 50
minutes to travel the 90.96 km between the line’s end points, which is competitive with the car alternative.
In total, they carried approximately 625,000 peak passengers and 154,000 off-peak passengers in the 2019
1987
financial year
9 (FY), which equated to an average of around 420 peak passengers and 100 off-peak
passengers per trip. Peak services are close to capacity, and changes were made to carriage al ocation
to provide short term relief on the most crowded afternoon service in April 2019. Further options to improve
asset utilisation are being investigated but are limited.
Wairarapa Line services are currently operated as part of the Metlink public transport network by Transdev,
under contract to GWRC, using a mixed fleet of GWRC-owned
10 conventional locomotive-hauled rolling
stock. Hyundai Rotem provides rol ing stock maintenance as a subcontractor to Transdev through an
Operator Maintenance Partnering Contract. KiwiRail provides locomotives and locomotive crews through
a hook and tow arrangement.
The rolling stock fleet is made up of the fol owing carriage types:
LGOIMA,
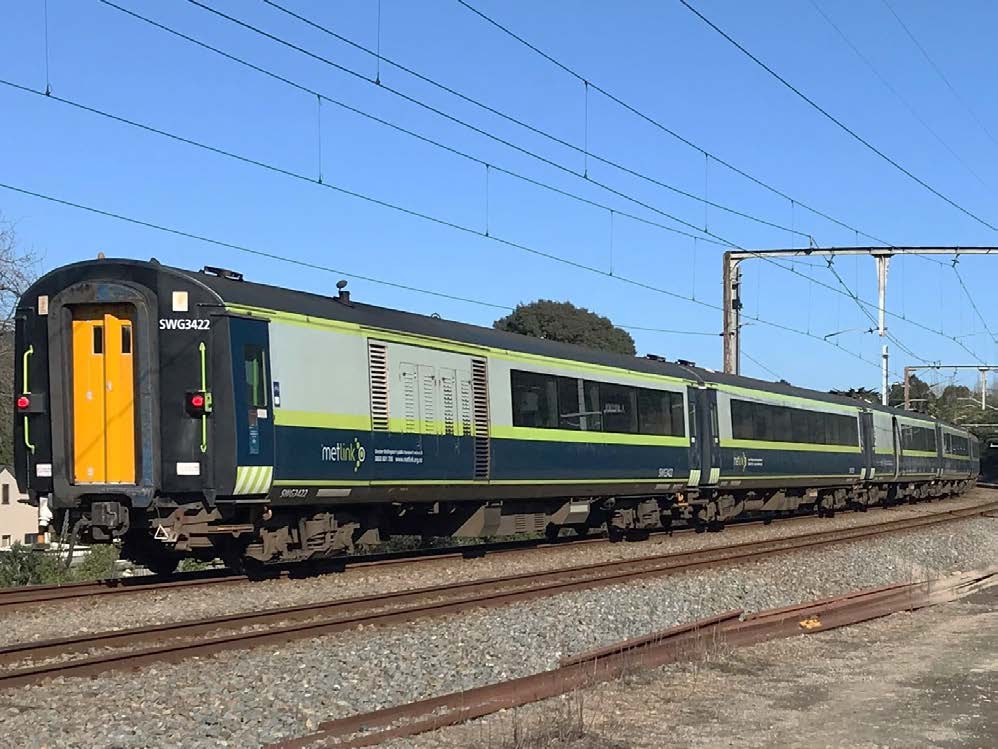
•
The SW type, il ustrated in
Figure 2-2, which were remanufactured specifical y for Wairarapa Line
service from ex-British Rail Mark 2 carriages dating from the early 1970s prior to entering New Zealand
service in 2007. The carriages can be identified by their large windows and modern seating and
interiors, and they feature a mix of airline style and table seating, at-seat power outlets, air
conditioning, automatic doors and a public-address system. The type consists of:
under
12 SW class carriages, which have 64 seats and a single toilet;
3 SWS class carriages, which have 37 seats, a servery (unused), a wheelchair hoist on each side, an audio
induction loop system and an accessible toilet; and
3 SWG class carriages, which have 37 seats, a luggage compartment and a diesel generator to power the
carriages.
•
The SE type, il ustrated in
Figure 2-3, which were refurbished from ex-British Rail Mark 2 carriages dating
from the early 1970s prior to entering New Zealand service in 2009, although much less extensively than
the SW type. Further modifications were made prior to their introduction on Wairarapa Line services in
Released
2013. The carriages can be identified by their original smal windows and British Rail-based seating and
interiors, and they feature general y similar amenities to the SW carriages, although they were initial y
5 New Zealand Road Assessment Programme KiwiRAP) collective and personal risk scores for this section of road have
varied between Medium High and High over the last decade. Both scores are at the high end of the five-point risk
scale.
6 The 2016 NZ Transport Agency SH2 Te Marua to Masterton Programme Business Case notes that this section of State
Highway 2, which has a nominal 100 km/h speed limit, has an average speed of 58 km/h.
7 The 2016 NZ Transport Agency SH2 Te Marua to Masterton Programme Business Case notes that State Highway 2 had
19 closures due to unplanned natural events (snow/ice, wind, slip) in the prior five-year period. Each closure had an
average duration of 36 hours, indicating that the road is closed for an average of 5.7 days a year (i.e. nearly a week)
due to weather related events.
8 This compares to between 44% and 50% in Kapiti, Hutt Val ey and Porirua. Based on Statistics New Zealand journey to
work data from the 2013 Census.
9 Financial years in this document denote the 12-month period ending on 30 June of the year stated, so the 2019
financial year refers to the period between 1 July 2018 and 30 June 2019.
10 The carriages are owned by Greater Wellington Rail Ltd, which is a subsidiary of Greater Wel ington Regional Council.
26 September 2019 │ Status: Draft │ Project No.: 310200204 │ Our ref: 310200204 190926 Lower North Island Longer-Distance Rolling Stock
Business Case - Amended Draft Final.docx
Page 3
used to provide additional capacity in the electrified area and have a higher-density seating
arrangement. The type consists of:
4 SE class carriages, which have 75 seats and a single toilet;
1 SES class carriage, which has 63 seats, a wheelchair hoist on each side, an audio induction loop system
and an accessible toilet; and
1 SEG class carriage, which has 44 seats, a luggage compartment and a diesel generator to power the
carriages.
•
A single AG type luggage / generator van, which dates from the late 1970s and is used to supplement
or replace the SWG or SEG carriages on an as needed basis.
1987
LGOIMA,
under
Figure 2-2: SW carriage type
Released
Trains typically operate with between five and nine carriages, providing a seated capacity of between
266 and 599 passengers per train. Each consist requires a SWS/SES and SWG/SEG, with the balance of
SW/SE types. The largest consists are al ocated to the most heavily used peak services, which depart
Masterton at 6:20 and Wel ington at 16:25. Two SWs, one SWS and one SWG are typical y held as spares to
facilitate maintenance.
The SW and SE types are based on the same source carriage but were previously incompatible due to
differences in suspension systems (bogies), electrical connections and brake systems. Trains therefore had
to operate in al -SW type or all-SE type sets, which limited flexibility and consequently capacity on some
trains, particularly when SE type carriages were removed from service for maintenance. Compatibility
modifications, which were completed in early-2019, have addressed this issue, al owing the introduction of
the nine car consist.
GWRC is about to commence a light mid-life refurbishment of the SW and SE fleets, which wil take
eighteen months to complete and extend the carriages’ life to the mid-2020s. The scope of the overhaul
26 September 2019 │ Status: Draft │ Project No.: 310200204 │ Our ref: 310200204 190926 Lower North Island Longer-Distance Rolling Stock
Business Case - Amended Draft Final.docx
Page 4
link to page 25 link to page 22 link to page 22
could be expanded if this business case determines that the fleets need to remain in operation for a longer
period. All carriages will be life-expired require replacement by 2032.
1987
LGOIMA,
Figure 2-3: SE carriage type
2.1.2 Manawatu Line
The Manawatu Line is located on the western side of the Wel ington Region and extends beyond the
regional boundary into the Horizons Region. It primarily serves the Kapiti Coast and southern Manawatu
under
areas, which together have a catchment population of approximately 174,900
11 (75% of which lies north of
Waikanae), which is experiencing significant ongoing growth that is forecast to continue in the future. The
line links Palmerston North, Shannon, Levin, Otaki, Waikanae and Paraparaumu, and surrounding areas of
the Palmerston North city and Horowhenua and Kapiti Coast districts with each other and Wellington, and
services provides vital extra capacity to supplement the electrified metro rail services south of Waikanae.
The link is important to residents, since it provides access to many employment, educational and other
opportunities and services that are not available elsewhere on the corridor.
The Manawatu Line paral els State Highway 57 north of Levin and State Highway 1 south of that point.
State Highway 1 carries large traffic volumes south of Levin, and geographical constraints restrict it to a
single lane and limit road alternatives for much of its length, which makes it vulnerable to congestion and
Released
resilience events. State Highway 1 is currently being upgraded (see Sectio
n 2.2.2).
The Manawatu Line is currently served by the Capital Connection, a weekday commuter train operated
by KiwiRail, which runs a single peak direction service in each weekday peak. It is the only rail passenger
service on this corridor north of Waikanae
12, and currently the only long-distance commuter train that
crosses a regional boundary in New Zealand. The train takes 2 hours and 5 minutes to travel the 136.23 km
between the line’s end points, which is competitive with the car alternative. It carried approximately
134,000 passengers in the 2019 FY, which equated to an average of around 280 passengers per trip. It is
increasingly operating at capacity on some days of the week, reflecting day to day patronage variations
associated with long-distance commuting, but its capacity is constrained by rolling stock availability and
cannot be increased.
11 Statistics New Zealand subnational population estimate as at 30 June 2018.
12 KiwiRail also runs the tourism-focused thrice-weekly Auckland-Wel ington Northern Explorer on the corridor, which runs
in the opposite direction to peak commuter requirements and stops at Palmerston North and Wel ington only.
26 September 2019 │ Status: Draft │ Project No.: 310200204 │ Our ref: 310200204 190926 Lower North Island Longer-Distance Rolling Stock
Business Case - Amended Draft Final.docx
Page 5
link to page 23 link to page 33 link to page 26
The Capital Connection uses KiwiRail-owned conventional locomotive-hauled rolling stock, with
locomotives and locomotive crews being provided through an intra-company hook and tow
arrangement. The rolling stock fleet is made up of:
•
The S type, il ustrated in
Figure 2-4, which were rebuilt from ex-British Rail Mark 2 carriages dating from
the early 1970s prior to entering New Zealand service in 1999, although differently from the SW and SE
cars, which they are not compatible with. The carriages can be identified by their original smal
windows and upgraded seating and interiors, and they feature general y similar amenities to the SW
and SE carriages. The type consists of:
7 standard S class carriages, which have 60 seats and a single toilet; and
1 S class servery carriage, which has 28 seats and a toilet.
•
A single AG type luggage / generator van, which dates from the late 1970s and is equipped with a
wheelchair hoist.
The train currently operates in an eight-car configuration between Friday afternoon and Tuesday morning,
with six standard cars, the servery car, and luggage / generator van, to provide a seated capacity of 388.
It operates with one less standard car at other times to al ow for maintenance, providing a seated
capacity of 328. One standard car is inoperable due to significant structural issues. No spares are held, so
1987
the train operates at reduced capacity when additional maintenance is required.
The S type carriages are close to the end of their service life, and either require extensive refurbishment or
replacement prior to mid-2021 to enable continued operation of services after that point. A decision on
whether to proceed with refurbishment wil be required within six months (see Sectio
n 3.1.1).
The Capital Connection is classified as an exempt service under the Land Transport Management Act 2003
(LTMA) (see Sectio
n 2.2.3) and operates as a stand-alone service with a separate fare structure. It
operated without public subsidy between its introduction in 1991 and July 2015.
LGOIMA,
under
Released
Figure 2-4: S carriage type (source: nzrailphotos.co.nz)
26 September 2019 │ Status: Draft │ Project No.: 310200204 │ Our ref: 310200204 190926 Lower North Island Longer-Distance Rolling Stock
Business Case - Amended Draft Final.docx
Page 6
link to page 26 link to page 22
2.2
Regional Context
2.2.1 Regional Rail Investment
2.2.1.1
Existing
GWRC’s rail investment plans are detailed in the Wellington Regional Rail Plan, which supplements the
Regional Public Transport Plan and Regional Land Transport Plan (see Sectio
n 2.2.3). The most recent 2013
update of the plan updated the preferred growth pathway known as Rail Scenario 1 (RS1), although it
focused on upgrades to the electrified network that were underway at that time and future infrastructure
upgrades that would enable frequency increases. The 2013 WRRP noted ongoing patronage increases on
the Wairarapa Line but did not propose frequency or capacity increases beyond the electrified area
termini in the short or medium term. In the longer-term, it envisaged reduced journey times on al lines
under Rail Scenario A and network extensions in the form of shuttle or non-electrified interlined services on
both the Wairarapa and Manawatu lines under Rail Scenario B. The WRRP also determined that
electrification beyond Upper Hutt and Waikanae would not be warranted.
Recent planning has revolved around three separate business cases. The first is the Palmerston North-
Wel ington Rail Passenger Business Case, which was completed in October 2017. This assessed the case for
continued public investment in a Palmerston North-Wellington rail passenger service beyond June 2018
1987
when the existing arrangement was due to expire, making it a key supporting reference for this business
case. It considered six options: withdrawal of the train at that point, continued operation of a
conventional locomotive-hauled through train, replacement with a Diesel Multiple Unit (DMU) through
train, replacement with a DMU through train with improved service levels, replacement with a connecting
DMU service north of Waikanae, and replacement with a connecting coach (bus) north of Waikanae. It
determined that the best return on investment would be achieved by retaining through rail services and
improving them in the medium term, by replacing existing rol ing stock with DMUs and improving service
levels. The business case recommended that $6.2 mil ion in Crown funding be sought to enable continued
operation of the existing train until the 2022 financial year (when rol ing stock refurbishment and
replacement is required as noted in Sectio
n 2.1.2) and al ow sufficient time for the longer-term solution to
be confirmed and implemented. This recommendation has not yet been fully realised, being dependent
LGOIMA,
on agreement around contractual and funding arrangements,
he current business case is investigating the longer-term options as part of its wider remit.
The next is the Wel ington Metro Railway Network Track Infrastructure Catch-up Renewals Single Stage
Business Case, which was completed in November 2017. This recommended that $95.8 mil ion be sought
to enable essential track renewals, bridge renewals, slope stabilisation works, and formation and drainage
under
upgrades across the GWRC network. This investment programme was funded through the 2018 National
Land Transport Programme (NLTP) and associated works have commenced. A significant proportion of the
investment is required to enable continued operation of the Wairarapa Line and improve its resilience and
safety, and the current business case and its options are consequently dependent on the programme
being completed.
The last is the Wel ington Metro Railway – Unlocking Network Capacity and Resilience Single Stage Business
Case, which was also completed in November 2017. This recommended that $97.7 mil ion be sought to
enable track, power supply and signal ing upgrades, to in turn improve network resilience and enable the
RS1 frequency improvements that maximise the utilisation of and capacity provided by existing rolling
Released
stock within the electrified area. This investment programme was funded through the 2018 NLTP and
associated works have commenced. Wairarapa Line and Manawatu Line services wil directly benefit from
this work, particularly through the double-tracking of the Upper Hutt-Trentham section, which wil help
enable increased Wairarapa Line frequencies, and through Wellington Station improvements, which wil
improve the operational efficiency of this bottleneck. These upgrades will be completed in conjunction
with the renewal work to maximise efficiency.
2.2.1.2
Future
GWRC is currently developing a new WRRP to replace the existing WRRP, using a business case process to
identify a preferred 30-year rail investment pathway for the Wellington region to a Programme Case level.
The new plan’s focus wil be on actions beyond the current work programme (10 plus years), but it wil
include the above committed investment, and incorporate the investment programme associated with
this business case and other short to medium term investment as identified.
To date, problems with high demand growth (60% of the overal problem), resilience, safety and security,
and customer journey experience have been identified. Associated benefits of any related investment are
expected to include improved capacity to increase economic activity, improved customer experience,
26 September 2019 │ Status: Draft │ Project No.: 310200204 │ Our ref: 310200204 190926 Lower North Island Longer-Distance Rolling Stock
Business Case - Amended Draft Final.docx
Page 7
link to page 33 link to page 19 link to page 19
improved network resilience, and a safer rail network. In combination, these are expected to increase
passenger and freight rail use and mode share, which will further improve transport system access and
capacity, and minimise the detrimental effects of growth, particularly those associated with increased
motor vehicle use, such as congestion and greenhouse gas emissions.
A key consideration is the impact of the Let’s Get Wellington Moving (LGWM) investment programme,
which includes a range of active mode, public transport and road-based initiatives that are expected to
appreciably increase rail network demand. The public transport initiatives include implementation of
proposed RS1 rail timetable improvements and rail capacity enhancements north of Wellington Station, as
well as some form of rapid transit south of the station. All LGWM initiatives are subject to further detailed
assessment.
The scale of the demand growth problem that the new WRRP must respond to is significant, although it will
provide connectivity, mode share and customer experience benefits if addressed. Metlink network-wide
annual rail patronage growth for the 2019 FY was 5.7% across al periods and 7.3% at peak periods. Peak
period growth was higher on the Hutt and Kapiti lines at 8.5% and 8.7% respectively, and lower on the
Wairarapa Line where patronage growth is constrained by capacity, at 3.3%. Current demand growth is
significantly higher than forecast growth, including that forecast through LGWM (see Sectio
n 3.1.2).
2.2.1.3
‘Future of Rail’, the New Zealand Rail Plan and the Rail Network Investment Plan
1987
The Ministry of Transport (MOT) and KiwiRail are working on changes to the LTMA to al ow National Land
Transport Fund (NLTF) investment in KiwiRail to support a resilient and reliable rail system. To date, the
metro rail providers, namely GWRC and Auckland Transport, have had minimal governance level
engagement in this process. GWRC and Auckland Transport are supportive of more investment in the
national rail network if it does not negatively impact on the metro networks, which are experiencing
significant passenger growth pressures, increasing costs, and a need for further network improvements.
A key component of the changes signal ed by the ‘Future of Rail’ workstream is the development of a New
Zealand Rail Plan (NZRP) and a Rail Network Investment Plan (RNIP). The inaugural NZRP is being
developed by KiwiRail and the Ministry of Transport (alongside input sought from GWRC and AT). GWRC
understands the NZRP wil set out a high-level vision for and description of the New Zealand rail network,
LGOIMA,
with specific sections for the two metro railways. GWRC understands that it is proposed that feedback on
the NZRP wil be sought via the next draft Government Policy Statement on Land Transport (GPS) process in
2020.
GWRC expects the Wel ington regional metro rail component of the NZRP wil be largely reflective of the
WRRP, which forms part of the Wellington Regional Public Transport Plan (RPTP) and is being developed by
GWRC in conjunction with KiwiRail, the NZTA and Transdev. Similarly, GWRC expects that the projects and
under
programmes contained within the WRRP wil also appear in KiwiRail’s RNIP, which GWRC understands wil
set out how KiwiRail will plan and deliver the national rail network.
GWRC understands that the fol owing statutory relationships wil be included in the changes to the LTMA:
•
KiwiRail will include proposed RNIP activities in the draft Regional Land Transport Plan (RLTP);
•
NZTA will check RNIP is consistent with the purpose of the LTMA, the GPS and value for money;
•
Auckland Transport and the Wel ington Regional Transport Committee wil discuss, prioritise and consult
on proposed RNIP activities;
Released
•
KiwiRail wil need to take into account the final Auckland and Wel ington RLTPs and RPTP when
finalising the RNIP; and
•
the Minister of Transport wil approve the RNIP.
2.2.2 Regional Road Investment
The Wairarapa and Manawatu lines paral el State Highway 2 and State Highway 1 respectively, as noted in
Section
2.1 and shown in
Figure 2-1. The Wairarapa section of State Highway 2 has been the subject of several investigations over recent years.
The most significant to this business case is the SH2 Te Marua to Masterton Programme Business Case, which
was completed in October 2016. This noted that the road provides the only direct road link between the
Wairarapa and Wel ington, and that its long-term weather and seismic resilience is of regional concern. It
recommended that $20-$25 mil ion be invested on primarily safety-related capital improvements in the
short term (five year) period. A further $60-$75 mil ion in medium term (6-10 year) and $30-$40 mil ion in
long term (11+ years) capital improvements were also recommended, the most significant of which is an
26 September 2019 │ Status: Draft │ Project No.: 310200204 │ Our ref: 310200204 190926 Lower North Island Longer-Distance Rolling Stock
Business Case - Amended Draft Final.docx
Page 8
link to page 26 link to page 26
estimated $50-$100 mil ion over ten years for horizontal curve realignment to “achieve a consistent speed
environment”. This $110-$140 mil ion investment is unlikely to significantly address the resilience issue or
meaningfully improve road capacity.
The southern section of the State Highway 2 corridor has also been the subject of several investigations
over recent years and was the subject of the State Highway 2 Ngauranga to Te Marua Programme
Business Case, which was completed in August 2016. This recommended a $1.4-$2.1 bil ion investment
programme of road and rail capacity, travel demand management, road safety and resilience
improvements, the most significant of which are grade-separated interchanges at Mel ing in the short term,
Kennedy Good in the medium term, and Silverstream in the long term, and four-laning of the Silverstream
to Upper Hutt section of State Highway 2 in the medium term. These initiatives would increase capacity
and reduce travel times on this section of the road corridor if implemented, but they have not been
prioritised in the current 2018 NLTP and are now regarded as longer-term priorities.
State Highway 2 terminates just north of the Wel ington CBD at Ngauranga, where it converges with State
Highway 1, which continues through the CBD and beyond to Wel ington Airport. This section of the road
corridor handles large traffic volumes and is subject to significant congestion at peak times.
State Highway 1 has been the subject of significant investment over the last decade, as the Wellington
Northern Corridor component of the previous government’s Roads of National Significance investment
programme. The most significant projects to this business case include (from south to north) the $850
1987
million 27 km Transmission Gully Motorway between Porirua and Mackays (under construction), the $630
mil ion 18 km Mackays to Peka Peka section of the Kapiti Expressway (completed), the $330 mil ion 14 km
Peka Peka to Otaki section of the Kapiti Expressway (under construction), and future Otaki to north of Levin
improvements, which are expected to include an offline highway, the timing of which is yet to be
determined
13. These are expected to increase capacity, reduce travel times and improve safety and
resilience on this section of the road corridor as the remaining projects are progressively completed
between 2020 and 2025. However, congestion continues to be an issue during construction.
The Wel ington Northern Corridor is expected to increase urban development and population growth in
the Kapiti and Horowhenua districts, since it wil make Wel ington relatively more accessible from those
areas by road than it is at present. This growth wil increase overal transport demand on the corridor,
LGOIMA,
which can be expected to counter some or al of the impact of mode switching from reduced road travel
times on Manawatu Line services in the short to medium term, and increase demand for Manawatu Line
services in the long term, as induced traffic increases road congestion, particularly at the Wel ington end
of the corridor.
2.2.3 Regional Transport Plans under
2.2.3.1
Wel ington Region
2.2.3.1.1 Wel ington Regional Public Transport Plan
The existing Wellington Regional Public Transport Plan dates from 2014, although it has been varied three
times since being adopted and is presently being reviewed. It identifies the purpose of the core rail routes
as being to provide high-capacity, long-distance, time-competitive commuter services connecting key
urban areas across the region, with a primary function of reducing severe road congestion on State
Highways 1 and 2.
RPTPs specify the services that are integral to the public transport network, and the policies, procedures,
Released
information and infrastructure that supports them. The existing Wellington RPTP indicates that Wairarapa
Line services are integral to the network, but it does not identify any plans to increase current service levels
on either line, or replace/increase rol ing stock or other infrastructure, other than as noted in the WRRP. The
RPTP is soon to be reviewed, providing an opportunity to set out in more detail the delivery and investment
programme associated with this business case.
The existing RPTP notes that the Capital Connection is an exempt service under the LTMA, due to its inter-
regional nature. However, inter-regional public transport services are becoming more common
14, and can
now be included in formal public transport networks if identified as being integral to the network in both
regions’ RPTPs. It is therefore possible to define Manawatu Line services as such if desired, providing a
funding and procurement mechanism for rol ing stock, supporting infrastructure and services.
13 It is now envisaged that the Otaki-Levin corridor wil have a multi-modal solution, with bus and/or rail improvements as
wel as roading improvements.
14 They include a trial off-peak bus service between Levin (in the Horizons Region) and Waikanae (in the Wel ington
Region), which is the subject of one of the variations to the existing RPTP.
26 September 2019 │ Status: Draft │ Project No.: 310200204 │ Our ref: 310200204 190926 Lower North Island Longer-Distance Rolling Stock
Business Case - Amended Draft Final.docx
Page 9
link to page 24 link to page 26 link to page 28 link to page 25 link to page 19
2.2.3.1.2 Wellington Regional Land Transport Plan
Higher level regional strategic direction is provided by the Wellington RLTP, which was reviewed in 2018 in
accordance with the LTMA. This identifies rail as being an efficient way to move large numbers of people
over longer distances and indicates that GWRC wil continue to build on the region’s established rail
network, with a priority to improve reliability, capacity, frequency, journey times and reach.
The RLTP has eight strategic objectives. Three have a short-term focus and two of these are particularly
pertinent to this business case – resilience and public transport. Connections between Wel ington and the
Wairarapa and Wel ington and the Kapiti Coast are identified as crucial resilience areas of focus, and rail
capacity and infrastructure, particularly on the Wairarapa Line as crucial public transport areas of focus.
The RLTP prioritises significant projects into three programme bands. The Wellington Metro Railway Network
Track Infrastructure Catch-up Renewals and Unlocking Network Capacity and Resilience projects noted in
Sectio
n 2.2.1, and Wairarapa service and capacity enhancements (the Wairarapa Line component of this
business case), have been given a Priority 1 (top 10) programme ranking. Palmerston North-Wellington
passenger rail (the Manawatu Line component of this business case) has been given a Priority 2 ranking.
Al four programme items have therefore been identified as being of high importance by the Regional
Transport Committee. The Wel ington RLTP is due for review, which is timely as this business case can be
used to confirm the investment programme for rail longer distance rail passenger services.
1987
2.2.3.2
Horizons Region
2.2.3.2.1 Horizons Regional Public Transport Plan
The existing Horizons RPTP dates from 2015 and is due for revision. It notes the Capital Connection as being
an exempt service and (at that time) unsubsidised, but indicates that consideration would be given to
subsidising the train if it was to be identified as the most efficient and effective means of providing a
commuter service between Palmerston North, Horowhenua and Wellington. As noted in Section
2.2.3.1, it
is now possible to define Manawatu Line services as being integral to both regions’ public transport
networks, providing a funding and procurement mechanism rol ing stock, supporting infrastructure and
services that was previously unavailable.
LGOIMA,
2.2.3.2.2 Horizons Regional Land Transport Plan
The Horizons RLTP was reviewed in 2018 in accordance with the LTMA. It identifies five strategic priorities
that wil be the focus of the future work programme, two of which are particularly pertinent to this business
case:
•
improve connectivity, resilience and the safety of strategic routes to and from key destinations linking
under
north-south and east-west, while factoring in demographic changes and impacts on land use; and
•
(provide) effective, efficient, accessible and affordable multi-modal transport networks.
Key programmes to achieve the former include Accessing Central New Zealand (see Section
2.2.4),
Wel ington Northern Corridor (see Sectio
n 2.2.2), and integrated road and rail networks. Key programmes
to achieve the latter include continuous improvements in the integrated public transport network,
passenger rail services between Palmerston North and Wellington, and investigation into improved long-
distance passenger rail services.
The RLTP notes that the continuation of the Palmerston North and Wellington service wil be important in
achieving the multi-modal approach of the Plan. To support this, it commits to a specific action to
Released
investigate the feasibility of retaining or improving the service and identifies the Capital Connection as a
programme item to facilitate NZTA subsidy and enable its continuation in the short term.
2.2.3.3
Spatial Planning - Regional Growth Framework
The GWRC and Horowhenua District Council (part of the Horizons Region) are working with iwi, the NZTA
and the Ministry of Housing and Urban Development on a Regional Growth Framework (RGF) spatial
planning exercise. The RGF wil integrate land use and transport planning and provide the spatial context
for the Wellington RLTP. It is expected to meet the requirements for a future development strategy under
the proposed National Policy Statement on Urban Development.
The RGF wil recognise that the Wellington Region has experienced significant growth over the last 20 years
and is experiencing a shortfal of housing leading to increased new development in the Wairarapa, Kapiti
and Horowhenua Districts. The Wel ington CBD currently provides, and is likely to for the foreseeable future,
a key employment centre for many of these people as noted in Sectio
n 2.1. As a result, public transport
use has grown significantly during this time, but there are capacity and reliability issues that, alongside
road congestion, place a strain on the wider regional transport network. The RGF wil provide a 30 and 100-
26 September 2019 │ Status: Draft │ Project No.: 310200204 │ Our ref: 310200204 190926 Lower North Island Longer-Distance Rolling Stock
Business Case - Amended Draft Final.docx
Page 10
link to page 79
year view of where and how future growth can be accommodated, and the infrastructure needed to
support it. Improvements to the public transport network wil be needed to enable this growth in a way
that minimises environmental impacts and fits with the Government’s goals to improve safety and access
and reduce emissions and reliance on private vehicles.
While the development of the RGF is stil only in its initial stage, investment in rolling stock, supporting
infrastructure and services wil at minimum contribute to improving the transport connectivity for these
already growing communities. If the RGF highlights that further improvement to the transport network is
required, further business cases wil be prepared.
2.2.4 Regional Economic Development
2.2.4.1
Wel ington Region
A new Wairarapa Economic Development Strategy and Action Plan was completed by GWRC and the
three Wairarapa territorial authorities in late 2018. It identifies the Wairarapa Line as a key lifeline for the
sub-region but notes that the existing limited service levels are a significant inhibitor to economic growth.
Rail track, rol ing stock and timetable improvements that deliver a “mature rail connection” are therefore
identified as key components of the recommended infrastructure programme, which has the fol owing
objectives with respect to rail:
1987
•
an all-day timetable, al owing free movement across the day and week (including weekend):
•
a diverse mix of passenger types and counter-cyclical patronage (including tourists and day visitors);
•
reduced travel time; and
•
improved punctuality.
The Wairarapa Economic Development Strategy and Action Plan is a regional economic development
programme for investment assessment purposes (see Sectio
n 5.5.1). 2.2.4.2
Horizons Region
LGOIMA,
A regional growth programme known as Accelerate25 is currently being implemented within the Horizons
Region. Its supporting economic action plan identifies Distribution and Transport as one of four key
enablers of economic growth, which seeks to provide a well-planned, efficient and strategical y
connected transport network that wil support other growth opportunities. Supporting priority initiatives
include rail tourism, the use of Palmerston North-Wel ington rail passenger services to improve regional and
inter-regional connectivity, and the Accessing Central New Zealand initiative, which aims to align all land
under
transport projects to create a connected, resilient and integrated transport system within the region and
across its boundaries.
The Accelerate25 implementation programme is a regional economic development programme for
investment assessment purposes
2.3
National Context
2.3.1 Long Term View
The Long Term View (LTV) sets out the NZTA’s view on the future demands and pressures that are likely to
Released
shape the issues and opportunities facing the land transport system. The first LTV (then known as the Long
Term Strategic View) was developed in early 2017, and it wil be replaced by a new version that reflects
the priorities of the current Government, but it provides useful national context to supplement the regional
transport plans at a corridor level.
With respect to the three strategic corridors that the Wairarapa and Manawatu lines are a component of
within the Wellington Region, its long-term vision is (amongst other aspects):
•
Wairarapa Strategic Corridor: the local road network wil provide access to the state highway and rail
networks, which in turn, wil connect those areas with the Wellington CBD and other regional centres
and basic, but reliable, local passenger transport services wil be easily accessible;
•
Hutt Strategic Corridor: State Highway 2 and the Wairarapa railway line wil provide a high level of
access and reliability for both passengers and freight, be effectively supported by local and regional
connector routes, and high-quality rail and bus services wil accommodate the large number of
people using public transport to commute along this corridor in peak periods; and
26 September 2019 │ Status: Draft │ Project No.: 310200204 │ Our ref: 310200204 190926 Lower North Island Longer-Distance Rolling Stock
Business Case - Amended Draft Final.docx
Page 11
link to page 29
•
Western Strategic Corridor (Ngauranga to Otaki): State Highway 1 and the North Island Main Trunk Line
wil provide a high level of access and reliability for passengers and freight travel ing within and
through the region, and a high-quality rail service wil accommodate the large number of people using
public transport to commute along this corridor in peak periods.
The implication is that Wairarapa Line rail passenger services wil continue to be supported by the NZTA as
a key means of providing reliable and high-quality access along the length of the Wairarapa and Hutt
strategic corridors, and that that some form of Manawatu Line rail passenger service may be supported by
the NZTA as a means of providing reliable and high-quality access beyond Waikanae on that corridor.
The LTV identifies the overal Palmerston North to Wel ington corridor as a national y significant ‘key inter-
regional journey’, one of only four in the lower half of the North Island. The NZTA expects future demand
pressures on the corridor wil be managed through network optimisation, demand management, mode
share and new infrastructure. The Manawatu Line is implicit as the modal alternative that can be used to
manage passenger demand pressures north of Waikanae.
2.3.2 Transport Agency Investment Proposal 2018-27
The draft Transport Agency Investment Proposal (TAIP), which was issued in advance of the 2018 GPS, set
out a 10-year programme of activities that the NZTA proposed for inclusion in the 2018 NLTP, through which
most Government contributions to land transport investment are prioritised and delivered.
1987
The TAIP identifies several rail passenger priorities across the country, including the Wel ington Metro
Network Track Infrastructure Catch-up Renewals and Unlocking Network Capacity and Resilience projects.
It also specifical y signals that the NZTA wil consider proposals for inter-regional commuter rail services,
“such as between…Wellington and Palmerston North” through the Public Transport funding activity class.
More general y, the TAIP signals the types of activities that the NZTA are looking to invest in each region
within each activity class, together with potential investment opportunities. The relevant Wel ington and
Horizons regional priorities and opportunities are shown i
n Table 2-1.
Table 2-1: Relevant activity class investment priorities and opportunities
LGOIMA,
Activity Class
Investment Priorities
Investment Opportunities
Public Transport
•
Maintaining and improving service
Wellington:
levels and improving infrastructure
•
Continue to invest in public transport
•
New public transport services
services across the region
•
Co-funding operational costs.
Horizons:
under • Investigate potential for improved
public transport services within
Palmerston North and to surrounding
townships.
Regional
•
Supporting regional economic
Horizons:
Improvements
development outside of major
•
Improvements to support economic
metropolitan areas
development and tourism
•
Improve network resilience to deliver
reliable connections into the region
Released
from the north, east, south and west.
Transitional Rail
•
Supporting urban and interregional
Wellington:
rail services that improve access to
•
Invest in improvements to Wel ington
housing and employment
Metro Rail regional infrastructure to
opportunities.
provide greater reliability and capacity
•
Accelerate investigation in increasing
capacity and services
Horizons:
•
Investigate opportunities to support
inter-regional public transport
connections.
26 September 2019 │ Status: Draft │ Project No.: 310200204 │ Our ref: 310200204 190926 Lower North Island Longer-Distance Rolling Stock
Business Case - Amended Draft Final.docx
Page 12
link to page 30 link to page 30 link to page 30
2.3.3 Government Policy Statement on Land Transport
The GPS outlines the Government’s priorities and objectives for land transport investment. It is released
every three years and informs the subsequent development of the NLTP.
A new GPS was released in June 2018, and specifies four strategic priorities – Safety, Access, Environment,
and Value for Money – each with supporting objectives and results. The Access and Environment priorities
have the clearest direct link to this investment case. Their objectives and applicable long-term results are
shown i
n Table 2-2.
Table 2-2: GPS access and environment strategic priorities, objectives and applicable results
Strategic Priority
National Land Transport Objectives
Applicable Long-Term Results
Access
•
A land transport system that
•
Metropolitan and high growth urban
provides increased access for
areas are better connected and
economic and social
accessible
opportunities.
•
Sustainable economic development of
regional New Zealand is supported by
safer and better transport connections.
1987
•
A land transport system that
•
Increased mode shift from private
enables transport choice and
vehicle trips to walking, cycling and
access.
public transport in our towns and cities
•
More transport choice (including for
people with less or limited access to
transport).
•
A land transport system that is
•
Improved network resilience for the most
resilient.
critical connections.
Environment
•
A land transport system that
•
Reduce greenhouse gas emissions from
LGOIMA,
reduces greenhouse gas
transport.
emissions, as wel as the adverse
effects on the local environment
and public health.
The Access strategic priority is one of two key strategic priorities in the GPS, along with Safety
15. It is of most
under
importance to the investment case, as it specifical y commits to increased investment in public transport,
to improve connectivity, capacity (through availability and frequency), and access to economic and
social opportunities in both peak and off-peak periods. This includes an emphasis on improving regional
transport connections, as provided by the Wairarapa and Manawatu lines. The priority also commits to a
whole-of-system approach to resilience, including the use of alternative routes and modes to manage
resilience at the most critical points on the network.
The Environment strategic priority is one of two supporting strategic priorities in the GPS, along with Value
for Money. It specifical y commits to increased investment in lower emission modes of transport such as
public transport, to improve services and encourage mode shift, as part of a whole-of-system approach to
the reduction of greenhouse gas emissions and other harmful effects of transport.
Released
The Value for Money strategic priority seeks to provide the right infrastructure and services to the right level
at the best cost. This priority does not identify specific public transport (or other) initiatives, but instead
encourages investment that makes best use of resources and is supported by rigorous investment appraisal
that takes account of the ful range of costs and benefits.
The GPS places some emphasis on investment in rapid transit
16 and indicates that rail will have an
increasingly important public transport role to play. To support this, it includes new rapid transit and
15 The Safety strategic priority focuses on road safety and does not identify associated public transport-related goals,
other than in relation to personal safety and security. It is therefore less relevant to this investment case than the other
strategic priorities. However, rail passenger services provide a safe alternative to road-based travel and can therefore
be considered to indirectly contribute to this priority.
16 Rapid transit typically refers to urban heavy rail (including metro and underground), light rail and bus rapid transit.
26 September 2019 │ Status: Draft │ Project No.: 310200204 │ Our ref: 310200204 190926 Lower North Island Longer-Distance Rolling Stock
Business Case - Amended Draft Final.docx
Page 13
link to page 31
transitional rail activity classes
17. The former supports investment that enables urban development in high
growth areas, primarily using the light rail and bus rapid transit modes. The latter supports investment in
urban rail services, particularly where demand is outstripping capacity or there is a need to reduce conflict
between freight and passenger trains, and in existing and new inter-regional commuter rail services that
support housing and employment opportunities, including in the capital costs associated with rol ing stock.
This al ows the NZTA to fund operational and capital costs from the transitional rail activity class, but it does
not preclude funding from the public transport activity class. Further funding wil be considered in a
second stage GPS.
The case for Wellington longer-distance rail passenger investment is therefore consistent with the GPS,
since it responds strongly to the Government’s strategic priorities by enhancing public transport
connectivity, capacity, reliability and resilience at several critical points on the network, on existing services
that support housing and employment opportunities, and in the case of the Wairarapa Line and Wellington
electrified network, are close to capacity. Such improvements could be funded from either the transitional
rail or public transport activity classes.
2.3.4 Provincial Growth Fund
The Provincial Growth Fund (PGF) has been introduced by the current Government to provide funding to
support investment in regional economic development. It supports three investment types:
1987
•
regional: support for economic development projects, feasibility studies and capability building
identified within regions, based around regional economic development plans;
•
infrastructure: regional infrastructure projects that enable regions to be well connected from an
economic and social perspective, including transport (specifical y rail); and
•
sector: initiatives targeted at priority and/or high value sector opportunities, including tourism.
The PGF thus provides a potential complementary or alternative funding source for longer-distance rail
passenger investment, providing that any investment proposal:
LGOIMA,
•
lifts the productivity of a region or regions;
•
contributes to the PGF objectives (which relate to job creation and sustainable economic
development, social inclusion and participation, Māori development, climate change and
environmental sustainability, and resilience);
•
creates additional value and avoid duplicating existing efforts;
under
•
has a link to the regional priorities and be supported by stakeholders; and
•
is wel managed, wel -governed and have appropriate trade-offs between risk and reward.
The PGF is available to al provinces (outside of the three main cities), but particularly to several priority
‘surge’ regions, which includes the Horizons Region. The Wairarapa and Kapiti areas of the Wellington
region are also eligible for PGF funding.
Wellington longer-distance rail passenger investment is likely to meet al the key PGF requirements, being
rail investment that (in part) supports tourism and is supported by a regional economic development plan,
meeting al criteria, including several PGF objectives, particularly sustainable economic development,
Released
social inclusion and participation, climate change and environmental sustainability, and resilience.
2.4
Conclusion
The Wairarapa and Manawatu lines are an established, integral and wel -utilised component of the lower
North Island transport system, and the longer-distance services that operate on them fulfil very important
transport system access and capacity roles. However, these services are experiencing strong demand
growth and are close to capacity, similarly to Wel ington’s electrified area rail network. The existing rolling
stock fleet consists of several different types of conventional locomotive-hauled rol ing stock is also nearing
the end of its service life, and ownership and compatibility issues and limit operational flexibility. A decision
is therefore required on whether to expand and refurbish or replace the fleet to address these issues. This
has urgency, as some carriages are close to the end of their service life and wil need to be withdrawn by
17 Activity classes are essential y funding buckets through which the NZTA al ocates transport investment. Some activities
can be funded through more than one activity class and other sources of funding can be used to complement
investment.
26 September 2019 │ Status: Draft │ Project No.: 310200204 │ Our ref: 310200204 190926 Lower North Island Longer-Distance Rolling Stock
Business Case - Amended Draft Final.docx
Page 14
mid-2021 without refurbishment or replacement, requiring a decision on whether to proceed within six
months.
Investment in rol ing stock, and reliability, capacity, frequency and journey time improvements on both
lines is supported by Wel ington and Horizons regional transport plans and economic development
programmes. Such investment is consistent with the NZTA’s strategic view and investment priorities for
each corridor in both regions, where the rail modal option is seen as being an important component of the
transport mix, and with the Government’s higher-level land transport priorities and objectives as specified
in the GPS. It is also likely to meet all key PGF requirements, including sustainable economic development,
social inclusion and participation, climate change and environmental sustainability, and resilience
objectives.
1987
LGOIMA,
under
Released
26 September 2019 │ Status: Draft │ Project No.: 310200204 │ Our ref: 310200204 190926 Lower North Island Longer-Distance Rolling Stock
Business Case - Amended Draft Final.docx
Page 15
link to page 24 link to page 19 link to page 33
3. Strategic Assessment
3.1
Problem Definition
The problems, the benefits of addressing them, and from these, the investment objectives for this business
case, were determined at the first of two facilitated Investment Logic Map (ILM) workshops, which was
held with key stakeholders on 10 October 2017. Participants included representatives of GWRC, HRC,
NZTA, Transdev, and the Masterton and Carterton district councils.
The workshop identified three key problems:
•
train condition (25% of the overal problem);
•
fleet capacity (50% of the overall problem); and
•
operational efficiencies (25% of the overal problem).
The problems and their consequences are described further in the fol owing sections and summarised
along with their relationship to the benefits in the ILM map in Appendix A.
3.1.1
1987
Train Condition
This problem is encapsulated by the problem statement:
Current longer-distance passenger trains coming to end of life is resulting in increasing maintenance costs,
customer expectations not being met and risk of service withdrawal.
All existing longer-distance rail rol ing stock dates from either the early 1970s (carriages) or late 1970s
(luggage / generator vans), as noted in Section 2.1. Although al have been subsequently rebuilt to
varying degrees and are equipped to current amenity and safety standards, the bulk of the fleet is now
approaching 50 years in age and nearing the end of its service life.
LGOIMA,
The S type are of most concern. These carriages, which comprise 25% of the longer-distance carriage
fleet, were rebuilt in 1999. They have thus been in continuous post-rebuild service for 20 years and
increasing age-related maintenance costs are reflected in the
mil ion short-term funding gap noted in
Sectio
n 2.2.1.1. The carriages wil require either full refurbishment at an estimated cost of
which
will extend their service life by another 15 years, or replacement, prior to mid-2021. Manawatu Line
services wil otherwise be withdrawn from service at that point. This timeframe places some urgency on an
investment decision and subsequent implementation of the chosen option.
under
The SW and SE types are less of an immediate concern, having been remanufactured in 2007 and
refurbished in 2008 respectively. However, they are looking increasingly tired due to their heavy use, are
increasingly unable to cope with demand (for example, air conditioning), and several components are
approaching end of life. The carriages consequently suffered 53 faults that caused delay, cancellation,
reduced capacity or passenger discomfort in 2017, which is reflected in negative customer feedback.
GWRC is about to commence a light mid-life refurbishment of the SW and SE fleets, which will address
some of these issues and extend the carriages’ life to the mid-2020s as noted in Sectio
n 2.1.1. A more
extensive refurbishment to enable them to operate until 2032 wil be avoided if they are replaced at that
point, but they will be life-expired and require replacement by 2032.
Released
3.1.2 Fleet Capacity
This problem is encapsulated by the problem statement:
Growing passenger demand and difficulty adding capacity to existing fleet results in frustrated passengers
and puts more pressure on the whole transport system.
3.1.2.1
Wairarapa Line
Wairarapa Line patronage has grown substantial y over the last decade, from 680,000 boardings in the
2009 FY
18 to 780,000 in the 2019 FY, an increase of 15% over that period and 33% over the 2007 FY when the
SW fleet replaced the previous rol ing stock fleet.
18 Wairarapa Line patronage figures include passengers that travel only within the Hutt Val ey. However, their numbers
are constrained by the lack of seated capacity in the morning peak, and by a minimum fare that is applied to al
passengers in the northbound direction, which makes Wairarapa services more expensive for Hutt Val ey passengers to
use than electrified services.
26 September 2019 │ Status: Draft │ Project No.: 310200204 │ Our ref: 310200204 190926 Lower North Island Longer-Distance Rolling Stock
Business Case - Amended Draft Final.docx
Page 16
link to page 34 link to page 19 link to page 34 link to page 35 link to page 34 link to page 34 link to page 34
The change in Wairarapa Line boardings has been even more significant at the peak, with an increase in
average daily morning peak patronage of 24% over the same decade, from around 1000 in mid-2009 to
around 1250 in mid-2019 as il ustrated in
Figure 3-1. This equates to an annual average growth rate of
approximately 2.16%, which is well above the Wairarapa annual average population growth rate of
1.26%
19. The year on year peak patronage increase was 3.3% between the 2018 and 2019 financial years,
reflecting the average growth rate of the most recent four-year period.
Morning Peak Patronage
Seated Capacity
1,400
nage 1,200
atro
eak P 1,000
ing P
rn
800
1987
600
ge Daily Mo
vera
400
200
pa Line A
ra
LGOIMA,
aira
0
W
09
10
11
12
13
14
15
16
17
18
19
Jun-
Jun-
Jun-
Jun-
Jun-
Jun-
Jun-
Jun-
Jun-
Jun-
Jun-
under
Figure 3-1: Wairarapa Line morning peak patronage and seated capacity
The chart shows that peak patronage has been close to or greater than seated capacity over much of the
decade, although crowding was al eviated by the introduction of the SE fleet on the line in 2013. It also
indicates that peak Wairarapa Line services are again close to their practical capacity limit, which is
governed by seated capacity on longer-distance services, despite reliability and punctuality issues
associated with the impact of previous infrastructure underinvestment that limit the dependability of
services for passengers. Recent carriage compatibility modifications have allowed some capacity
real ocation, providing short-term relief on some services as described in Sectio
n 2.1.1, but overall peak
capacity has not changed.
Released
Figure 3-1 indicates that peak crowding can be expected to again become an increasing problem and
that additional capacity is likely to be required within a few years to respond to demand and maintain
service quality
20.
Figure 3-2 reinforces this conclusion, showing the impact of projected peak period
patronage growth at the forecast rate
21, which is constrained by current capacity, and at the potential
future unconstrained growth tracks associated with a continuation of the previous decade’s annual
19 The combined annual average population growth rate for the Masterton, Carterton and South Wairarapa districts for
the ten-year period ending June 2018, derived from Statistics New Zealand subnational population estimates.
20 Longer-distance rolling stock is not designed to carry large numbers of standing passengers over extended distances,
since they have narrow aisles and doorways to maximise the quality and availability of seating within the main
passenger compartment. Standing passengers restrict circulation, access to toilets, and access to entry/exit doors at
station stops, which increases station dwel times and overal trip times.
21 The Wairarapa Line patronage forecast is based on WTSM/WPTM model outputs that assume the future
implementation of integrated fares and ticketing and the network improvements specified by the Wel ington Metro
Railway Network Track Infrastructure Catch-up Renewals and Unlocking Network Capacity and Resilience business
cases. The model outputs are based on older data and do not take account of recent growth.
26 September 2019 │ Status: Draft │ Project No.: 310200204 │ Our ref: 310200204 190926 Lower North Island Longer-Distance Rolling Stock
Business Case - Amended Draft Final.docx
Page 17
link to page 40 link to page 36 link to page 35 link to page 35
average population growth rate of 1.3% and the recent (four-year average and current) annual peak
patronage growth rate of 3.3%
22. It indicates that significant capacity improvement is likely to be required
to cater for future demand, particularly if the current peak growth rate is sustained. Previous capacity
improvements have quickly been exhausted, which suggests that demand is being limited by the level of
supply.
Current
Seated Capacity
Forecast
Population (1.3%)
Recent (3.3%)
2,400
nage
2,200
atro
2,000
1,800
eak P
1,600
ing P
rn
1,400
1987
1,200
1,000
ge Daily Mo
800
vera
600
400
pa Line A
ra
200
aira
LGOIMA,
0
W
09
14
19
24
29
34
39
Jun-
Jun-
Jun-
Jun-
Jun-
Jun-
Jun-
Figure 3-2: Wairarapa Line morning peak patronage and projected demand
under
Additional capacity is typical y obtained by increasing train size, more effectively allocating capacity to
demand, and/or increasing frequency. However, responses are currently limited by:
•
rolling stock availability;
•
train length restrictions that limit train length to nine carriages;
•
long turnaround times at each terminus; which are linked to the requirement to turn locomotives (see
Section
3.1.3) and affect round trip time; and
•
passing limitations between Trentham and Masterton, which limit service headway along with
Released
signal ing system constraints north of Featherston
23.
3.1.2.2
Manawatu Line
Manawatu Line patronage fluctuated over the last decade, with an overal reduction of 22% from 175,000
boardings in the 2009 FY to 136,000 in the 2019 FY, reflecting the patronage impact of electrification of the
Paraparaumu-Waikanae section of the Kapiti Line and extension of associated Metlink services to
Waikanae in early 2011. These patronage levels compare to 158,000 boardings in the 2007 FY and an
earlier long-term growth trend.
The patronage change is il ustrated in more detail i
n Figure 3-3, which shows how average daily morning
peak patronage changed from around 350 in mid-2009, to around 240 in mid-2015, then rebounded to
22 Future growth is shown arithmetically and excludes any additional patronage uplift associated LGWM.
23 The short Trentham to Upper Hutt section of the line is about to be converted to double track, but passing
opportunities wil remain limited between there and Masterton. The Featherston-Masterton section of the line uses the
radio-based Track Warrant Control system, which restricts train spacing.
26 September 2019 │ Status: Draft │ Project No.: 310200204 │ Our ref: 310200204 190926 Lower North Island Longer-Distance Rolling Stock
Business Case - Amended Draft Final.docx
Page 18
link to page 22 link to page 25 link to page 37 link to page 33 link to page 36 link to page 36 link to page 36 link to page 36
around 300 in mid-2019. The train’s current capacity is lower than at the beginning of the period and is
further reduced at mid-week times. It increasingly operates at capacity on some days due to day to day
patronage fluctuations. Al operable carriages are in use as noted in Sectio
n 2.1.2.
Morning Peak Patronage
Seated Capacity
600
nage
500
400
ing Peak Patro
orn
300
aily M
1987
ge D
200
vera
100
atu Line A
anaw
0
M
-09
-10
-11
-12
-13
-14
-15
-16
-17
-18
-19
LGOIMA,
Jun
Jun
Jun
Jun
Jun
Jun
Jun
Jun
Jun
Jun
Jun
Figure 3-3: Manawatu Line morning peak patronage and seated capacity
24
under
The post-electrification patronage decline was largely limited to Waikanae and Paraparaumu, which
directly benefited from higher service levels associated with the extension of Metlink services to Waikanae.
These stations previously accounted for around 48% of Capital Connection patronage, but now account
for around 44% of patronage. The decline is likely to have been exacerbated by subsequent fare
increases to recover lost revenue, which were necessitated by reduced revenue, increased costs, and the
Capital Connection’s commercial nature
25. This increased the cost of the train as an option to passengers
and the disparity between its higher fare levels and the standard Metlink fares from these stations.
While Manawatu Line patronage is considerably lower than Wairarapa Line patronage and does not show
the same growth trend at present, it is stil significant at its current level, given that only one train operates
in each direction per day, its rol ing stock is close to the end of its service life and quite worn, and its future
Released
has been uncertain for several years. These aspects are likely to have previously supressed passenger
demand along with the fare increases noted above, but traffic congestion and the increased urban
development and population growth on the corridor noted in Sectio
n 2.2.2 are again driving patronage
growth.
Figure 3-4 shows the effect of projected peak period patronage growth at the same base forecast level as
used for the Wairarapa Line
26 in Sectio
n 3.1.2.1, at an annual average population growth rate of 1.1%
27
24 April-June 2017 and April-June 2019 patronage was not provided by KiwiRail and is estimated. Capacity reduced
from 448 to 388 in early-2015 and has varied by day since late-2016 (the latter trip-weighted average of 352 is shown).
25 The train has a farebox recovery ratio of around 85%, which compares to a Wairarapa Line ratio of around 25%.
26 Manawatu Line patronage growth is expected to be relatively low in the short term, with mode switching to road due
to reductions in road travel times from the Wel ington Northern Corridor projects being offset by increased urban
development and population growth. Patronage is expected to increase in the longer-term, as increased road
congestion at the Wel ington end of the corridor and LGWM-related public transport enhancements take effect.
27 The draft 2018 Horowhenua Growth Strategy 2040 projects that district population will increase by around 10,000
(from 32,000) over the 2016-40 period, in part due to transport improvements on the corridor, with an annual average
26 September 2019 │ Status: Draft │ Project No.: 310200204 │ Our ref: 310200204 190926 Lower North Island Longer-Distance Rolling Stock
Business Case - Amended Draft Final.docx
Page 19
link to page 38 link to page 37
and at the recent (four-year average) annual peak patronage growth rate of 3.1%
28. The resulting
patronage remains within existing capacity for most of the 20-year period, although the growth tracks do
not take account of day to day fluctuations or the growth effects of any potential service enhancements,
which would be expected to lift patronage at higher rates through service level demand elasticities.
Current
Seated Capacity
Forecast
Population (1.1%)
Recent (3.1%)
600
nage
500
400
ing Peak Patro
orn
300
1987
aily M
ge D
200
vera
100
atu Line A
anaw
0
M
LGOIMA,
-09
-14
-19
-24
-29
-34
-39
Jun
Jun
Jun
Jun
Jun
Jun
Jun
Figure 3-4: Manawatu Line morning peak patronage and projected demand
under
3.1.2.3
Electrified Area
Patronage has grown substantially on the electrified area Hutt, Johnsonvil e and Kapiti lines over the last
decade, from 11.2 mil ion boardings in the 2009 FY to 13.5 mil ion in the 2019 FY, an increase of 21% over
that period. This growth reflects population growth on the corridors that the lines serve, and investment in
improvements in infrastructure, rolling stock and services that have improved service quality, frequency
and reliability. The most significant initiative during this period was the progressive and complete
replacement of the previous obsolete electric multiple unit (EMU) fleet by the new FP/FT class Matangi EMU
fleet between 2010 and 2016, which is likely to have been a key driver of growth.
Patronage growth occurred across al lines and time periods, but it has been most significant at the peak,
Released
where Hutt Line, Johnsonvil e Line, and Kapiti Line average daily morning peak patronage increased by
16%, 11% and 29% respectively between mid-2009 and mid-2019. In the February to June 2019 period,
average daily morning peak patronage averaged more than 8900 on the Hutt Line, 1900 on the
Johnsonvil e Line, and 8300 on the Kapiti Line, for a combined electrified area total of 19,200 passengers
per morning peak period.
Figure 3-5 shows that the peak period increase has been most acute since mid-
2015, reflecting similar trends on the Wairarapa and Manawatu lines since that point.
growth rate of 1.1%. This compares to an annual average population growth rate of 0.7% for Horowhenua for the ten-
year period ending June 2018, and to 0.9% for Palmerston North, Horowhenua and Kapiti Coast combined for the ten-
year period, and 1.1% for the five-year period ending June 2018, derived from Statistics New Zealand subnational
population estimates.
28 Future growth is shown arithmetically and excludes any additional patronage uplift associated LGWM.
26 September 2019 │ Status: Draft │ Project No.: 310200204 │ Our ref: 310200204 190926 Lower North Island Longer-Distance Rolling Stock
Business Case - Amended Draft Final.docx
Page 20
link to page 39 link to page 39 link to page 38 link to page 38 link to page 38 link to page 38 link to page 38
Morning Peak Patronage
Seated Capacity
22,000
nage 20,000
atro 18,000
eak P 16,000
ing P 14,000
orn 12,000
10,000
ge Daily M
8,000
vera
6,000
a A
1987
4,000
2,000
0
Electrified Are
09
10
11
12
13
14
15
16
17
18
19
Jun-
Jun-
Jun-
Jun-
Jun-
Jun-
Jun-
Jun-
Jun-
Jun-
Jun-
Figure 3-5: Electrified area morning peak patronage
LGOIMA,
Figure 3-6 shows the effect of projected electrified area peak period patronage growth at the forecast
rate, which includes LGWM uplift between the 2023 and 2025 financial years, and at an annual average
population growth rate of 1.0%
29 and the recent (four-year average) annual peak patronage growth rate
of 5.5%, which both exclude any additional uplift that may result from LGWM
30. The latter rate is lower than
the year on year peak patronage increase of 7.6% between the 2018 and 2019 financial years, and lower
under
than the peak growth rates of 8.5% and 8.7% on the Hutt and Kapiti lines, which account for the bulk of
electrified area patronage. The chart indicates that capacity improvements are likely to be required to
cater for future demand in the electrified area, particularly if recent growth is sustained.
The capacity issue is particularly acute between 7:30 and 8:30.
Figure 3-7 shows the projected relationship
between Wel ington Station arrival demand and capacity across al Metlink services at this peak hour, at
the current forecast rate (including the LGWM patronage uplift
31), at the current al period growth rate of
5.7% (excluding LGWM uplift), and at the current peak period growth rate of 7.3% (also excluding LGWM
uplift)
32. It shows that ideal capacity
33 could be exceeded by 2024, and standing capacity by 2029, if
there are no further initiatives beyond the proposed RS1 timetable changes, which will maximise utilisation
of the existing EMU fleet once associated infrastructure is in place. This will require additional peak
Released
capacity if crowding and mode shift away from public transport is to be avoided.
Rol ing stock lead times place urgency on resolution of this problem, but smal scale EMU fleet expansion to
provide this additional capacity is likely to be expensive and difficult to achieve in this timeframe, since a
small metro EMU order is expected to be unattractive to rol ing stock manufacturers. However, there is an
opportunity to address this capacity issue efficiently and promptly through resolution of the longer-distance
capacity issue, since longer-distance services are an integral part of the metro service offering.
29 The combined annual average growth rate of the Wel ington, Hutt, Porirua, Kapiti and Upper Hutt council areas for
the ten-year period ending June 2018, derived from Statistics New Zealand subnational population estimates.
30 Both growth rates are arithmetic.
31 Model ing has shown that the LGWM programme could deliver an additional 5% to 10% uplift in patronage on top of
the 15% to 20% increase that is currently forecast for the Metlink rail network.
32 Future growth is shown arithmetically and (other than the forecast rate) excludes additional LGWM patronage uplift.
33 Ideal capacity is GWRC’s measure of the optimal level of fleet utilisation. It assumes that some passengers wil stand
from inner stations on both express and inner services.
26 September 2019 │ Status: Draft │ Project No.: 310200204 │ Our ref: 310200204 190926 Lower North Island Longer-Distance Rolling Stock
Business Case - Amended Draft Final.docx
Page 21
Current
Seated Capacity
Forecast (with LGWM)
Population (1.0%)
Recent (5.5%)
45,000
nage 40,000
atro 35,000
eak P
30,000
ing P
orn 25,000
20,000
ge Daily M 15,000
vera
a A 10,000
1987
5,000
0
Electrified Are
09
14
19
24
29
34
39
Jun-
Jun-
Jun-
Jun-
Jun-
Jun-
Jun-
Figure 3-6: Electrified area morning peak patronage and projected demand
LGOIMA,
Seated Capacity
Ideal Capacity
Standing Capacity
Forecast (with LGWM)
Current - All (5.7%)
Current - Peak (7.3%)
under
18,000
30 16,000
o 8:
30 t 14,000
12,000
eekdays 7: 10,000 Released
als -W 8,000
rriv 6,000
n A
Change
4,000
able
et
im
2,000
gton Statio
1 T
RS
ellin
0
W
19
24
29
34
39
Jun-
Jun-
Jun-
Jun-
Jun-
Figure 3-7: Projected Wel ington Station morning peak hour demand and capacity (al Metlink lines)
26 September 2019 │ Status: Draft │ Project No.: 310200204 │ Our ref: 310200204 190926 Lower North Island Longer-Distance Rolling Stock
Business Case - Amended Draft Final.docx
Page 22
link to page 19 link to page 19 link to page 40
3.1.3 Operational Efficiencies
This problem is encapsulated by the problem statement:
Current longer-distance passenger train configuration results in inflexibility and operational inefficiencies
across the whole commuter network.
The Wairarapa and Manawatu lines are run as separate operations, as noted in Section
2.1. Wairarapa Line
services are operated by Transdev under contract to GWRC using GWRC-owned rol ing stock, while
Manawatu Line services are operated by KiwiRail using KiwiRail-owned rol ing stock. This arrangement reflects
past differences between the two operations, where the Wairarapa Line had both a commuter and access
focus with al -day service levels, and was subsidised accordingly, while the Capital Connection was run as
commercial (unsubsidised) peak-only commuter service on the Manawatu Line. The latter now receives some
public funding support, and there is continuing public request for greater frequency on the line, so the
difference between the two lines is not as distinct as it was in the past.
The existing arrangement is inflexible and inefficient. There is no ability to manage operations between two
lines, such as to minimise Wel ington Station dwel times or match train capacity to demand. Nor is there the
ability to manage rol ing stock fleet allocation and maintenance in an effective way, with each fleet requiring
1987
its own maintenance arrangements and inventory. Both operations therefore carry a degree of overhead
that would be reduced or eliminated if run as a single operation with inter-operability between the lines.
Maintenance is further complicated by a complex set of contractual relationships. Transdev subcontracts
carriage maintenance to Hyundai Rotem and uses the KiwiRail-owned Wel ington Carriage Depot through an
access agreement as the location for this maintenance. A 2018 report by SNC- Lavalin
34 notes that
maintenance of the Wairarapa fleet is highly sensitive to the ongoing shared use of this depot, which the
report notes has an inefficient design and is also used by KiwiRail for carriage maintenance. Hyundai Rotem
access to the depot is limited to a four-hour window on weekdays for safety reasons, which is a significant
maintenance constraint.
LGOIMA,
The mixed rol ing stock fleet is also an issue. The longer-distance fleet is relatively small in scale compared to
the electrified fleet, but it is composed of three different carriage types (18 SW, 6 SE and 7 operable S) and
two vans as noted in Section
2.1, with resulting compatibility and maintenance inefficiencies. In comparison,
the 83 two-car (i.e. 166 car) EMU fleet that operates services in the electrified area is composed of a single
type, providing interoperability benefits and significant economies of scale.
under
Existing services on both lines are locomotive hauled through hook and tow arrangements with KiwiRail, which
offers some locomotive fleet management efficiencies. However, locomotives are expensive to run, and the
hook and tow cost is a sizeable proportion of the cost of running services on both lines. The marginal cost of
an additional train, such as to address capacity issues, is consequently also high.
Passenger locomotives are required to have special safety features, such as fire-suppression equipment for
those that operate services through the Remutaka Tunnel. This limits the pool of locomotives that can be used
on services and requires that additional so-equipped locomotives must be held as spares to cover
maintenance and provide redundancy to cover failures. This significantly increases fleet requirements and
consequently cost. For example, five locomotives are dedicated to the Wairarapa service, despite the
Released
current peak requirement for three.
Finally, and importantly, locomotive-hauled trains are also very operational y limiting. They require long
turnaround times of at least 30 minutes at each terminus to al ow the locomotive to be removed from, turned
and reattached to a train, which may also need to be removed from the platform to al ow the locomotive to
leave and/or to refuel the generator. This process is complex, requires several steps and the involvement of
several contractual parties, and differs at each terminus as described in the SNC-Lavalin report. It is
considerable constraint in Wel ington, where there is conflict with other services that limits the efficient
operation of al services at peak times, and a barrier to frequency enhancements that might otherwise help to
address capacity issues. The locomotive turning requirement also necessitates that trains that run for part of a
line’s length must have two locomotives to operate (either double-headed or at each end of the train), with
consequent cost impacts.
34 Investigation of Wairarapa Line Rail Services by SNC-Lavalin Rail & Transit NZ Ltd for GWRC.
26 September 2019 │ Status: Draft │ Project No.: 310200204 │ Our ref: 310200204 190926 Lower North Island Longer-Distance Rolling Stock
Business Case - Amended Draft Final.docx
Page 23
link to page 35 link to page 37 link to page 19 link to page 33 link to page 41
3.2
Benefits of Investment
The October ILM workshop identified four key benefits that investing to address the problems would provide:
•
enhanced regional connectivity (40% of the overal benefit);
•
improved rail service quality (15% of the overal benefit);
•
a more resilient transport network (25% of the overal benefit); and
•
value for money (20% of the overal benefit).
The benefits of investment are described further in the fol owing sections and summarised along with their
relationship to the problems in the ILM map in Appendix A.
3.2.1 Enhanced Regional Connectivity
The longer-distance rail passenger services fulfil a critical regional connectivity role, providing residents of
predominantly rural areas of the Wel ington and Manawatu regions with affordable access to many
employment, educational and other opportunities and services that are not available locally, as noted in
1987
Section 2.1. Investment in the rol ing stock fleet that provides these services wil firstly (and importantly)
maintain this connectivity into the future, and then further strengthen it if used to improve capacity and
service levels on the two lines, particularly to cater to the significant Wairarapa Line projected demand
identified in Sectio
n 3.1.2.2. This will improve liveability and quality of life in these areas, and help to drive local
economic activity and growth, particularly if improvements are also made to services that provide access to
them from the urban parts of the Wellington Region (i.e. through improved counter peak-direction, off-peak
and weekend services)
35 as specifical y sought by the Wairarapa Economic Development Strategy and Action
Plan and Accelerate25 regional economic development plans.
Any investment in the longer-distance rol ing stock fleet that increases capacity and service levels will also
LGOIMA,
strengthen the capacity of Metlink’s core electrified area rail corridors – the Hutt Line and Kapiti Line – by
providing additional capacity and travel options at key stations to cater to the significant electrified area
projected demand identified in Sectio
n 3.1.2.3. This will maintain access and connectivity at those stations
and release capacity to passengers at other stations, in turn improving access and connectivity there.
The benefit strongly aligns with the transport objectives of both regions, with the Wairarapa Economic
Development Strategy and Action Plan and Accelerate25 integration and connectivity goals, with the NZTA’s
under
long term vision for each corridor as expressed in the LTV (and with its ‘better connectivity’ objective), and
with its TAIP investment priorities and opportunities in the relevant activity classes, particularly with regards to
improved transport connections. At the strategic level, it aligns with the Government’s transport priorities and
objectives as outlined in the GPS, particularly the Access strategic priority to which it is closely linked, and the
Environment strategic priority, and with the PGF objectives and its ‘job creation and sustainable economic
development’, ‘social inclusion and participation’, and ‘climate change and environmental sustainability
benefits’. The GPS and PGF alignment is of note, since the ILM at which the benefits were defined took place
prior to the announcement of the Government coalition and its policies.
The impact of any investment wil be able to be measured through changes in service frequency, seat
Released
kilometres (seat km) and rail patronage over time. Frequency is a measure of public transport level of service,
and it is highlighted as a priority in the GPS. Seat km is a measure of public transport capacity, and it captures
both the direct capacity of the rol ing stock and the capacity provided through frequency enhancement.
Patronage is a fundamental measure of response to any public transport investment, and it is therefore a key
measure of success, particularly when assessed over the medium to long term.
3.2.2 Improved Rail Service Quality
The longer-distance rail rol ing stock fleet is nearing the end of its service life, as described in section
s 2.1 and
3.1 This has not yet affected service reliability in a major way (as opposed to Wairarapa Line infrastructure,
which is affecting reliability), but the fleet is worn, is unable to provide sufficient capacity to meet demand on
some services, and it is failing in some ways due to demand. Investment in the rol ing stock fleet wil ensure
that the services remain running and operating reliably into the future, that they can cope with current and
35 The existing services are already used for some business and tourism-related travel, and this would be enhanced by
the improved travel options that are offered by service improvements.
26 September 2019 │ Status: Draft │ Project No.: 310200204 │ Our ref: 310200204 190926 Lower North Island Longer-Distance Rolling Stock
Business Case - Amended Draft Final.docx
Page 24
link to page 19 link to page 33 link to page 43 link to page 37
ongoing growth, and that they remain attractive to and are a preferred choice for users, the majority of whom
spend two to four hours a day travel ing by train.
The benefit aligns with the transport objectives of both regions, with the Wairarapa Economic Development
Strategy and Action Plan integration goal, with the NZTA’s long term vision for each corridor as expressed in
the LTV, and with its TAIP investment priorities and opportunities in the relevant activity classes, particularly with
regards to service and reliability improvements. At the strategic level, it aligns with the Government’s transport
priorities and objectives as outlined in the GPS, particularly the Access and Environment strategic priorities,
similarly to the regional connectivity benefit.
The impact of any investment wil be able to be measured through journey dependability and customer
satisfaction. Journey dependability is a measure of service reliability and punctuality and reflects the
importance of those attributes to passengers. Customer satisfaction encompasses a myriad of attributes that
are important to passengers, including perceptions of dependability, train interior features and functionality,
ride quality, value for money, and overall perceptions of service quality, and it is likely to respond strongly to
rol ing stock and associated service improvements.
3.2.3 More Resilient Transport Network
1987
The longer-distance rail rol ing stock fleet and the services that it provides offer two types of resilience benefit.
Firstly, it offers transport system-level resilience benefits by providing a modal and route alternative to the road
network. This is particularly critical on the Wairarapa Line, where the services frequently fulfil this role when the
parallel State Highway 2 is closed, whether due to weather or crash-related incidents. The fleet also offers
public transport network-level resilience benefits (which also have a wider transport system-level impact), since
it utilises a different power source from the electrified network and can continue operating when other
services cease running due to a power fault or storm damage. Investment in the rol ing stock fleet wil ensure
that these benefits are retained, particularly if the chosen option does not rely solely an overhead power
source to operate, and even more so if the fleet can be managed between the two lines to al ow short-term
transport system or public transport network resilience-related capacity issues to be managed.
LGOIMA,
The benefit strongly aligns with the transport objectives of both regions, which identify system resilience as a
priority, with the Accelerate25 resilience goal, with the NZTA’s LTV ‘system resilience’ objective, and with its
TAIP investment priorities and opportunities in the relevant activity classes, particularly with regards to network
resilience, reliability and capacity. At the strategic level, it aligns with the Government’s transport priorities and
objectives as outlined in the GPS, particularly the Access strategic priority (to which it is closely linked as an
existing example of a whole-of-system approach to resilience) and the Environment strategic priority, and with
under
the PGF objectives and its associated ‘resilience’ benefit.
The impact of any investment wil be able to be measured through the rol ing stock fleet’s compatibility and
load capacity, which reflect its capacity to respond to resilience events when needed.
3.2.4 Value for Money
The longer-distance rail rol ing stock fleet is becoming increasingly expensive to maintain as it nears the end of
its service life, and it is more expensive to operate than it may need to be, as described in section
s 2.1 an
d 3.1.
Direct value for money benefits from an investment in replacement rol ing stock are therefore likely to come
Released
from the elimination of some impending heavy maintenance, from maintenance and operational economies
of scale provided by the elimination of a mixed-ownership and mixed-type rol ing stock fleet, and, if chosen in
an option, from replacement of locomotive haulage with a more-efficient motive power source. These would
al ow the same level of service to be provided at lower cost, or more service to be provided at the same level
of investment, with either scenario providing better value for money than at present.
Value for money wil also be available at the public transport network and transport system levels, particularly
if additional capacity is provided by any replacement fleet. At the network level, this capacity may allow rail
patronage growth to be accommodated without requiring additional EMU capacity until the Matangi fleet is
replaced in the early 2030s
. Figure 3-8 shows how this approach might address the morning peak hour
capacity issue identified in Sectio
n 3.1.2.3 in this way. Similarly, the additional capacity may al ow transport
system growth to be accommodated without additional road capacity. It may also provide a potential
‘carrot’ to any future demand management ‘stick’ that might be used to gain value for money through better
management of road capacity.
26 September 2019 │ Status: Draft │ Project No.: 310200204 │ Our ref: 310200204 190926 Lower North Island Longer-Distance Rolling Stock
Business Case - Amended Draft Final.docx
Page 25
Seated Capacity (with LD)
Ideal Capacity (with LD)
Standing Capacity (with LD)
Forecast (with LGWM)
Current - All (5.7%)
Current - Peak (7.3%)
30 18,000
o 8: 16,000
30 t
14,000
eekdays 7: 12,000
10,000
als -W
pact
rriv
8,000
n A
6,000
Change
1987
4,000
able
et
gton Statio
im
2,000
ellin
1 T
ling stock capacity im
W
RS
Ro
0
19
24
29
34
39
Jun-
Jun-
Jun-
Jun-
Jun-
LGOIMA,
Figure 3-8: Projected Wel ington Station morning peak hour demand and extra capacity (al Metlink lines)
In addition, value for money may be gained from joint procurement of a replacement fleet with other regions
and/or the ability the use a new Wel ington fleet to run trials in other parts of the country. This aspect is outside
of the scope of this business case, but it is important to note that the Government has proposed new longer-
distance rail passenger services for the Upper North Island (Hamilton-Auckland and possibly beyond) and
under
made al owance for them (as new interregional commuter rail services) in the transitional rail funding section
of the GPS. Economies of scale may be gained from procuring a single fleet that can operate across the
different geographies.
The benefit aligns with the transport objectives of both regions, with the Accelerate25 efficiency goal, with a
value for money expectation for new infrastructure in NZTA’s LTV, and with the value for money expectation
that is central to the TAIP. At the strategic level, it aligns with the with the Government’s transport priorities and
objectives as outlined in the GPS, particularly the overarching Value for Money strategic priority, and with the
PGF objectives, particularly in relation to productivity.
The impact of any investment wil be able to be measured through the level of maintenance and operational
Released
costs per unit of service delivered or per unit of benefit received, and potential y through other wider
measures.
3.3
Investment Objectives
The October ILM workshop identified four SMART investment objectives to guide the selection and assessment
of options and ensure that they would respond to the problems and achieve the benefits in an appropriate
way. These were subsequently revised at a second ILM workshop on November 2017 and (as revised) are to:
•
increase service capacity of longer-distance services;
•
improve customer journey satisfaction on the longer-distance network;
•
maximise operational flexibility of longer-distance passenger rolling stock; and
•
minimise whole of life costs per passenger across the longer-distance network.
26 September 2019 │ Status: Draft │ Project No.: 310200204 │ Our ref: 310200204 190926 Lower North Island Longer-Distance Rolling Stock
Business Case - Amended Draft Final.docx
Page 26
link to page 45
The investment objectives are described further in the fol owing sections and summarised along with their
relationship to the problems and benefits in the ILM map in Appendix A. Appendix B outlines the benefits
realisation plan that wil support monitoring of the investment objectives.
3.3.1 Increase Service Capacity
This investment objective seeks to increase the capacity of lower North Island longer-distance rail
passenger services. It wil be quantified by measuring the change in total morning peak seat kilometres
provided across both lines, between the current baseline level and that provided in 2030.
3.3.2 Improve Customer Satisfaction
This investment objective seeks to improve customer journey satisfaction with services on the lower North
Island longer-distance network. It wil be quantified by measuring the change in overal customer
satisfaction on longer-distance services, as surveyed through the annual Metlink customer survey, from the
current level to a target of 95% satisfaction by 2030.
3.3.3 Maximise Operational Flexibility
This investment objective seeks to maximise the operational flexibility of longer-distance passenger rolling
stock on and between the two lower North Island corridors. It wil be quantified by measuring the change
1987
in longer-distance service dwel time at Wel ington Station during the morning peak between the current
level and that needed in 2030.
3.3.4 Minimise Whole of Life Costs Per Passenger
This investment objective seeks to minimise whole of life costs per passenger across the longer-distance
network. It wil be quantified by measuring the change in net cost per passenger per annum, between the
current level and that achieved in 2030.
3.4
Conclusion
LGOIMA,
A stakeholder assessment has found that there are three clear problems associated with the existing longer-
distance rail rol ing stock fleet, which need to be addressed with some urgency:
•
train condition;
•
fleet capacity; and
under
•
operational (in)efficiencies.
Investing to address the problems is expected to provide four major benefits to investors and the wider
community:
•
enhanced regional connectivity;
•
improved rail service quality;
•
a more resilient transport network; and
Released
•
value for money.
The four benefits of investment link closely to the objectives of key central and local government transport and
regional growth strategies and plans, as summarised in
Table 3-1.
26 September 2019 │ Status: Draft │ Project No.: 310200204 │ Our ref: 310200204 190926 Lower North Island Longer-Distance Rolling Stock
Business Case - Amended Draft Final.docx
Page 27
link to page 19
Table 3-1: Links between the investment benefits and relevant strategies and plans
Enhanced
Improved
More
Value for
Regional
Rail Service
Resilient
Money
Connectivity Quality
Transport
Network
Wellington Regional Rail Plan
Wel ington Regional Public Transport Plan
Wel ington Regional Land Transport Plan
Wairarapa Economic Development
Strategy
Horizons Regional Public Transport Plan
Horizons Regional Land Transport Plan
Horizons Accelerate25 Growth Programme
1987
NZTA Long Term Strategic View
NZTA Transport Agency Investment
Proposal
Govt Policy Statement on Land Transport
Provincial Growth Fund
When considered alongside the wider considerations described in Chapter
2 these provide strategic
justification for investing in a longer-distance rail rol ing stock solution for the Wairarapa and Manawatu lines.
LGOIMA,
Such investment is supported by the fol owing clear investment objectives:
•
increase service capacity of longer-distance services;
•
improve customer journey satisfaction on the longer-distance network;
•
maximise operational flexibility of longer-distance passenger rolling stock; and
under
•
minimise whole of life costs per passenger across the longer-distance network.
Released
26 September 2019 │ Status: Draft │ Project No.: 310200204 │ Our ref: 310200204 190926 Lower North Island Longer-Distance Rolling Stock
Business Case - Amended Draft Final.docx
Page 28
link to page 46
4. Option Selection
4.1
Options Development
The options for responding to the problems identified in the first ILM workshop were determined at the
second ILM workshop, which was held with stakeholders on 1 November 2017. Participants included
representatives of GWRC, HRC, NZTA, Transdev, and the Masterton, Carterton and South Wairarapa district
councils.
A wide range of long list responses was considered as part of the initial assessment by the group. These
included a mix of demand, supply and productivity related responses, including variations in mode (bus
versus rail) and fleet type (including life extension-related responses), and variations in service levels,
including service frequency and timing. The responses were either discarded as being impractical or
incorporated into the six potential options listed in
Table 4-1, which were then taken forward for
assessment. A summary of the most-realistic long list options and the rationale taking forward or not is
provided in Appendix C.
Table 4-1: Potential options
1987
Option
Name
Outline Description
1
Maintain existing Wairarapa fleet
Maintain existing Wairarapa Line fleet and services and
al ow Manawatu Line services to cease operating.
2
Maintain and boost existing fleets
Improve Wairarapa Line fleet and services by
purchasing additional used rol ing stock and maintain
existing Manawatu Line fleet and services.
3
Partial EMU fleet
Electrify to Featherston and Otaki, extend EMU
operations to those points and improve services, with
LGOIMA,
bus connections from outer points.
4
New DMU fleet
Replace existing fleets with a DMU fleet at the earliest
opportunity and improve services.
5
New DMMU fleet
Replace existing fleets with a dual-mode multiple unit
(DMMU) fleet at the earliest opportunity and improve
services.
under
6
Full EMU fleet
Electrify to Masterton and Palmerston North, extend
EMU operations to those points at earliest opportunity
and improve services.
Al options assume that the Capital Connection wil receive funding support to enable it to continue operating
in its current form until mid-2021, when the S type carriages wil reach the end of their service life. The options
also assume the implementation of the infrastructure upgrades identified by the Wel ington Metro Railway
Network Track Infrastructure Catch-up Renewals and Unlocking Network Capacity and Resilience business
cases.
Released
An overview of each option is provided in the fol owing sections.
4.2
Options Description
4.2.1 Option 1: Maintain Existing Wairarapa Fleet
This option is the do-minimum option, which the NZTA defines as the
most likely transport situation over the
course of the appraisal period if no intervention were to occur. It is the status quo option that uses existing
rol ing stock and entails:
•
maintaining existing Wairarapa Line service levels on an ongoing basis, with rol ing stock refurbishment
by the end of the 2022 financial year and replacement with DMUs (or other suitable rolling stock as
determined at that time) by the end of the 2032 financial year; and
26 September 2019 │ Status: Draft │ Project No.: 310200204 │ Our ref: 310200204 190926 Lower North Island Longer-Distance Rolling Stock
Business Case - Amended Draft Final.docx
Page 29
link to page 47 link to page 48
•
maintaining existing Manawatu Line service levels until mid-2021, when services wil be withdrawn when
the S type carriages reach the end of their service life.
Table 4-2 summarises the operational (service) and fleet and infrastructure attributes of this option.
Table 4-2: Option 1 operational and fleet and infrastructure requirements
Category
Attributes
Operations
•
Maintain existing Wairarapa service levels on an ongoing basis:
Weekday peak: 3 morning and 3 afternoon peak-direction trips
Weekday off-peak: 2 (plus 1 Friday evening) trips in each direction
Weekend days: 2 trips in each direction.
•
Maintain existing Manawatu service levels until end 2022 FY, when the rol ing stock
must be withdrawn:
Weekday peak: 1 morning and 1 afternoon peak-direction trips.
1987
Fleet and
•
Refurbish SW and SE fleets by end 2022 FY.
Infrastructure
•
Replace SW and SE fleets with 8 new 4-car DMUs by end 2032 FY.
•
Construct new DMU maintenance facilities and stabling yard in Wellington area
by end 2032 FY.
The differing treatment of each line under this option reflects their different focus and status. Existing
Wairarapa Line services have both a commuter and access focus, an important road substitute role, are
identified as being integral to the Wel ington public transport network in the region’s RPTP and operate under
LGOIMA,
contract. Existing Manawatu Line services have a peak-only focus, they are not currently considered to be
integral to the network in either region, and they are commercial y operated, albeit with some public funding
support.
The option would respond to the train condition problem, but only on the Wairarapa Line, and only to the
extent required to maintain services to an adequate standard. It would not address the fleet capacity or
operational efficiency-related problems. It would therefore have significant regional connectivity, rail service
under
quality and resilience disbenefits, while making no meaningful improvement in value for money.
4.2.2 Option 2: Maintain and Boost Existing Fleets
This option is the enhanced status quo option, which improves Wairarapa Line services and maintains
Manawatu Line services using an expanded fleet of existing rol ing stock. It entails:
• improving Wairarapa Line service levels, initial y through improved asset utilisation that is enabled by
compatibility upgrades, then again once rol ing stock fleet expansion and refurbishment has been
completed by the end of the 2022 financial year, then maintaining the higher service levels on an
Released
ongoing basis, with replacement with DMUs (or other suitable rol ing stock as determined at that time) by
the end of the 2032 financial year; and
•
maintaining existing Manawatu Line service levels on an ongoing basis, with rol ing stock refurbishment
by the end of the 2022 financial year and replacement with DMUs (or other suitable rolling stock as
determined at that time) by the end of the 2032 financial year.
Table 4-3 summarises the operational and fleet and Infrastructure attributes of this option.
26 September 2019 │ Status: Draft │ Project No.: 310200204 │ Our ref: 310200204 190926 Lower North Island Longer-Distance Rolling Stock
Business Case - Amended Draft Final.docx
Page 30
link to page 48
Table 4-3: Option 2 operational and fleet and infrastructure requirements
Category
Attributes
Operations
•
Increase Wairarapa service levels in 2023 FY once fleet refurbishment and
expansion is completed:
Weekday peak (2019 FY): 3 morning and 3 afternoon peak-direction trips
Weekday peak (2023 FY): 4 morning and 4 afternoon peak-direction trips (all full
corridor), and 1 morning and 1 afternoon counter peak-direction trips
Weekday off-peak (2019 FY): 2 (plus 1 Friday evening) trips in each direction
Weekday off-peak (2023 FY): 3 (plus 1 Friday evening) trips in each direction
Weekend days (2019 FY): 2 trips in each direction
Weekend days (2023 FY): 4 trips in each direction.
•
Maintain existing Manawatu service levels on an ongoing basis:
Weekday peak: 1 morning and 1 afternoon peak-direction trips.
1987
Fleet and
•
Refurbish SW and SE fleets by end 2022 FY.
Infrastructure
•
Purchase S fleet and refurbish by end 2022 FY.
•
Purchase 16 additional BR Mark 2 cars and refurbish to SE standard by end 2022
FY.
•
Change Featherston, Carterton and Maymorn track arrangements to enable
frequency enhancements by end 2022 FY.
•
Extend ful signal ing system from Featherston to Masterton to enable frequency
enhancements by end of 2022 FY. LGOIMA,
•
Expand Masterton stabling facilities by end 2022 FY.
•
Upgrade Manawatu Line stations by end 2022 FY
•
Replace SW, SE and S fleets with 14 new 4-car DMUs by end 2032 FY.
under
•
Construct new DMU maintenance facilities, and stabling yards in Wellington area
by end 2032 FY.
Manawatu Line services would cease to be commercial y operated under this option. They would be formal y
included in each regions’ public transport network (i.e. identified as being integral to the public transport
networks in the respective RPTPs as required by the LTMA) and operated under contract to GWRC. Rol ing
stock would be owned by GWRC. Rol ing stock and services would be funded jointly by GWRC, HRC and the
NZTA in accordance with the NZTA’s prevailing funding assistance rate.
The option differs from subsequent options in two ways. Firstly, it would delay the replacement of rol ing stock
Released
until the current fleets reach the end of their service life, which would require ful refurbishment of the S fleet to
enable Manawatu Line services to continue operating beyond mid-2021 and align replacement with the SW
and SE fleets. Secondly, additional used rol ing stock would be purchased and refurbished to provide
increased capacity in the intervening period. The delayed replacement is expected to result in a lower level
of patronage growth than subsequent options, and in turn require one less DMU than those in the long run.
Subsequent options align capacity enhancement with fleet replacement, and schedule this for the earliest
opportunity.
The option would respond to the train condition problem on both lines, but only to the extent required to
maintain services to an acceptable standard
36. The purchase of additional used rol ing stock would address
the fleet capacity problem. Joint ownership and operation of the fleets would also offer some operational
efficiencies through better fleet management, although the mixed fleet and locomotive haulage requirement
36 For this purpose, acceptable standard is defined as being clean and tidy and in ful operating condition, but not an
improved condition as would be the case with new rol ing stock.
26 September 2019 │ Status: Draft │ Project No.: 310200204 │ Our ref: 310200204 190926 Lower North Island Longer-Distance Rolling Stock
Business Case - Amended Draft Final.docx
Page 31
link to page 50

would limit this response. The option would consequently offer partial regional connectivity, rail service quality,
resilience and value for money benefits.
4.2.3 Option 3: Partial EMU Fleet
This option improves services on both lines by extending EMU operations to Featherston and Otaki and
replacing existing rol ing stock fleets with a larger fleet of EMUs. It entails:
1987
•
improving Wairarapa Line service levels, initial y through improved asset utilisation that is enabled by
compatibility upgrades, then again once electrification is completed to Featherston and new EMU rol ing
stock is available for service by the end of the 2025 financial year, then maintaining the higher service
levels on an ongoing basis; and
•
maintaining existing Manawatu Line service levels until the end of the 2025 financial year, then improving
them once electrification is completed to Otaki and new EMU rol ing stock is available for service, then
maintaining the higher service levels on an ongoing basis.
LGOIMA,
A key characteristic of the option is the use of high-quality, high-capacity bus connections to al rail services at
Featherston and Otaki, to maintain public transport links to al towns that currently have rail services on each
corridor north of those points. Patronage on the bus links is expected to remain relatively high, but additional
park and ride capacity would be provided to cope with an expected increase in park and ride demand at
those stations.
under
Table 4-4 summarises the operational and fleet and Infrastructure attributes of this option.
Released
26 September 2019 │ Status: Draft │ Project No.: 310200204 │ Our ref: 310200204 190926 Lower North Island Longer-Distance Rolling Stock
Business Case - Amended Draft Final.docx
Page 32
Table 4-4: Option 3 operational and fleet and infrastructure requirements
Category
Attributes
Operations
•
Increase Wairarapa service levels in 2026 FY once fleet and infrastructure
changes are completed (al post-2025 FY trips are Featherston-only):
Weekday peak (2019 FY): 3 morning and 3 afternoon peak-direction trips
Weekday peak (2026 FY): 4 morning and 4 afternoon peak-direction trips,
and 1 morning and 1 afternoon counter peak-direction trips
Weekday off-peak (2019 FY): 2 (plus 1 Friday evening) trips in each direction
Weekday off-peak (2026 FY): 3 (plus 1 Friday evening) trips in each direction
Weekend days (2019 FY): 2 trips in each direction
Weekend days (2026 FY): 4 trips in each direction.
•
Maintain existing Manawatu service levels until 2025 FY, then increase in 2026
FY once fleet and infrastructure changes are completed (al post-2025 FY trips
1987
are Otaki-only):
Weekday peak (2019 FY): 1 morning and 1 afternoon peak-direction trips
Weekday peak (2026 FY): 2 morning and 2 afternoon peak-direction trips
Weekday off-peak (2019 FY): no service
Weekday off-peak (2026 FY): 2 trips in each direction
Weekend days (2019 FY): no service
Weekend days (2026 FY): 2 trips in each direction.
LGOIMA,
•
Contract connecting Masterton-Featherston and Palmerston North-Otaki
bus services by end of 2025 FY
Fleet and
•
Refurbish SW and SE fleets by end 2022 FY.
Infrastructure
•
Undertake life extension activities on S fleet by end 2022 FY
under
•
Replace SW, SE and S fleets with 15 new 4-car EMUs by end 2025 FY.
•
Extend overhead catenary and supporting infrastructure to Featherston and
Otaki by end 2025 FY.
•
Change Featherston and Maymorn track arrangements to enable
frequency enhancements by end 2025 FY
•
Construct new stabling facilities in Featherston and Otaki by end 2025 FY.
•
Expand park and ride and bus transfer facilities in Featherston and Otaki by
end 2025 FY.
Released
•
Expand EMU maintenance facilities and stabling yards in Wellington area by
end 2025 FY.
As with Option 2, Manawatu Line services would cease to be commercial y operated under this option,
although only after replacement of existing rol ing stock with EMUs. They would be formal y included in each
regions’ public transport network (i.e. identified as being integral to the public transport networks in the
respective RPTPs as required by the LTMA) and operated under contract to GWRC. Rol ing stock would be
owned by GWRC. Rol ing stock and services would be funded jointly by GWRC, HRC and the NZTA in
accordance with the NZTA’s prevailing funding assistance rate. Connecting bus services would be
contracted to GWRC on the Wairarapa corridor and HRC on the Manawatu corridor.
The time required to complete EMU procurement and construction, and construction of electric overhead
infrastructure, is a major constraint of this option. This would delay the introduction of rol ing stock and service
improvements by several years compared to Option 2, and in turn require the refurbishment of existing rol ing
26 September 2019 │ Status: Draft │ Project No.: 310200204 │ Our ref: 310200204 190926 Lower North Island Longer-Distance Rolling Stock
Business Case - Amended Draft Final.docx
Page 33
link to page 52
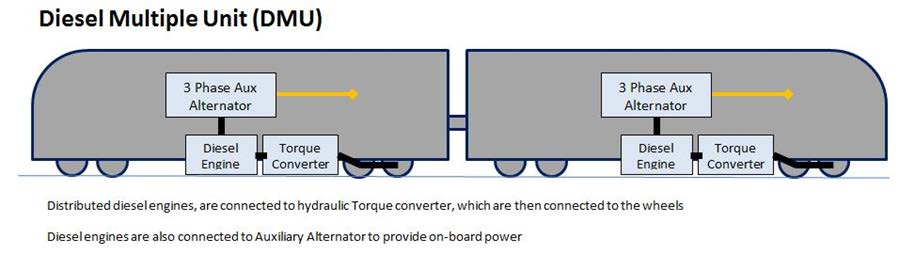
stock to enable services to continue operating in the intervening period. However, a countering advantage is
that it could potential y be a stage in a phased electrification programme.
The option would respond to the train condition and operational efficiencies problems, although not
completely until the 2026 financial year. It would also address the fleet capacity problem, but only after the
same point, which may be problematic on the Wairarapa Line and in the electrified area. The option would
consequently offer regional connectivity, rail service quality, resilience and value for money benefits,
particularly from the 2026 financial year. However, the replacement of rail services with bus services could be
perceived by existing passengers as reducing connectivity and quality, and EMU-run services would be subject
to the same resilience constraints as other EMU-run services on the network.
4.2.4 Option 4: New DMU Fleet
1987
This option improves services on both lines by replacing existing rol ing stock fleets with a larger fleet of DMUs. It
entails:
•
improving Wairarapa Line service levels, initial y through improved asset utilisation that is enabled by
compatibility upgrades, then again once new DMU rol ing stock is available for service by the end of the
2025 financial year, then maintaining the higher service levels on an ongoing basis; and
LGOIMA,
•
maintaining Manawatu Line service levels until the end of the 2025 financial year, then improving them
once new DMU rol ing stock is available for service, then maintaining the higher service levels on an
ongoing basis.
Table 4-5 summarises the operational and fleet and Infrastructure attributes of this option.
under
Released
26 September 2019 │ Status: Draft │ Project No.: 310200204 │ Our ref: 310200204 190926 Lower North Island Longer-Distance Rolling Stock
Business Case - Amended Draft Final.docx
Page 34
Table 4-5: Option 4 operational and fleet and infrastructure requirements
Category
Attributes
Operations
•
Increase Wairarapa service levels in 2026 FY once fleet and infrastructure changes
are completed:
Weekday peak (2019 FY): 3 morning and 3 afternoon peak-direction trips
Weekday peak (2026 FY): 4 morning and 4 afternoon peak-direction trips (all full
corridor), and 1 morning and 1 afternoon counter peak-direction trips
Weekday off-peak (2019 FY): 2 (plus 1 Friday evening) trips in each direction
Weekday off-peak (2026 FY): 3 (plus 1 Friday evening) trips in each direction
Weekend days (2019 FY): 2 trips in each direction
Weekend days (2026 FY): 4 trips in each direction.
•
Maintain existing Manawatu service levels until 2025 FY, then increase in 2026 FY
once infrastructure changes are completed:
1987
Weekday peak (2019 FY): 1 morning and 1 afternoon peak-direction trips
Weekday peak (2026 FY): 2 morning and 2 afternoon peak-direction trips (1 Levin-
only)
Weekday off-peak (2019 FY): no service
Weekday off-peak (2026 FY): 2 trips in each direction
Weekend days (2019 FY): no service
Weekend days (2026 FY): 2 trips in each direction.
LGOIMA,
Fleet and
•
Refurbish SW and SE fleets by end 2022 FY.
Infrastructure
•
Undertake life extension activities on S fleet by end 2022 FY.
•
Replace SW, SE and S fleets with the 15 new 4-car DMUs by end 2025 FY.
•
Change Carterton, Featherston and Maymorn track arrangements to enable
under
frequency enhancements by end 2025 FY.
•
Extend ful signal ing system from Featherston to Masterton to enable frequency
enhancements by end of 2025 FY.
•
Expand Masterton stabling facilities and construct new stabling facilities in Levin
by end 2025 FY.
•
Upgrade Manawatu Line stations by end 2025 FY.
•
Construct new DMU maintenance facilities and stabling yards in Wellington area
by end 2025 FY.
Released
As with Options 2 and 3, Manawatu Line services would cease to be commercial y operated under this option,
although only after replacement of existing rol ing stock with DMUs. They would be formally included in each
regions’ public transport network (i.e. identified as being integral to the public transport networks in the
respective RPTPs as required by the LTMA) and operated under contract to GWRC. Rol ing stock would be
owned by GWRC. Rol ing stock and services would be funded jointly by GWRC, HRC and the NZTA in
accordance with the NZTA’s prevailing funding assistance rate.
The time required to complete DMU procurement and construction is a major constraint of this option. This
would delay the introduction of rol ing stock and service improvements by several years compared to Option
2, and in turn require the refurbishment of existing rol ing stock to enable services to continue operating in the
intervening period.
The option would respond to the train condition and operational efficiencies problems, although not
completely until the 2026 financial year. It would also address the fleet capacity problem, but only after the
26 September 2019 │ Status: Draft │ Project No.: 310200204 │ Our ref: 310200204 190926 Lower North Island Longer-Distance Rolling Stock
Business Case - Amended Draft Final.docx
Page 35
link to page 54

same point, which may be problematic on the Wairarapa Line and in the electrified area. The option would
consequently offer regional connectivity, rail service quality, resilience and value for money benefits,
particularly from the 2026 financial year. The ability of DMUs to operate without electricity is a significant
resilience benefit over most other options.
4.2.5 Option 5: New Dual-Mode Multiple Unit (DMMU) Fleet
1987
This option improves services on both lines by replacing existing rol ing stock fleets with a larger fleet of dual
mode multiple units (DMMU). The electro diesel multiple unit (EDMU) is used to provide a baseline for this
option, but other alternatives could include battery-powered and hydrogen-powered units, which are
becoming more feasible as technology improves. These would be reviewed and considered during the
specification and procurement process. The DMMU option entails:
•
improving Wairarapa Line service levels, initial y through improved asset utilisation that is enabled by
compatibility upgrades, then again once new DMMU rol ing stock is available for service by the end of the
2025 financial year, then maintaining the higher service levels on an ongoing basis; and
LGOIMA,
•
maintaining Manawatu Line service levels until the end of the 2025 financial year, then improving them
once new DMMU rol ing stock is available for service, then maintaining the higher service levels on an
ongoing basis.
Table 4-6 summarises the operational and fleet and Infrastructure attributes of this option.
under
Released
26 September 2019 │ Status: Draft │ Project No.: 310200204 │ Our ref: 310200204 190926 Lower North Island Longer-Distance Rolling Stock
Business Case - Amended Draft Final.docx
Page 36
Table 4-6: Option 5 operational and fleet and infrastructure requirements
Category
Attributes
Operations
•
Increase Wairarapa service levels in 2026 FY once fleet and infrastructure changes
are completed:
Weekday peak (2019 FY): 3 morning and 3 afternoon peak-direction trips
Weekday peak (2026 FY): 4 morning and 4 afternoon peak-direction trips (all full
corridor), and 1 morning and 1 afternoon counter peak-direction trips
Weekday off-peak (2019 FY): 2 (plus 1 Friday evening) trips in each direction
Weekday off-peak (2026 FY): 3 (plus 1 Friday evening) trips in each direction
Weekend days (2019 FY): 2 trips in each direction
Weekend days (2026 FY): 4 trips in each direction.
•
Maintain existing Manawatu service levels until 2025 FY, then increase in 2026 FY
once infrastructure changes are completed:
1987
Weekday peak (2019 FY): 1 morning and 1 afternoon peak-direction trips
Weekday peak (2026 FY): 2 morning and 2 afternoon peak-direction trips (1 Levin-
only)
Weekday off-peak (2019 FY): no service
Weekday off-peak (2026 FY): 2 trips in each direction
Weekend days (2019 FY): no service
Weekend days (2026 FY): 2 trips in each direction.
LGOIMA,
Fleet and
•
Refurbish SW and SE fleets by end 2022 FY.
Infrastructure
•
Undertake life extension activities on S fleet by end 2022 FY.
•
Replace SW, SE and S fleets with the 15 new 4-car DMMUs by end 2025 FY.
•
Change Carterton, Featherston and Maymorn track arrangements to enable
under
frequency enhancements by end 2025 FY.
•
Extend ful signal ing system from Featherston to Masterton to enable frequency
enhancements by end of 2025 FY.
•
Expand Masterton stabling facilities and construct new stabling facilities in Levin
by end 2025 FY.
•
Upgrade Manawatu Line stations by end 2025 FY.
• Construct new DMMU maintenance facilities and stabling yards in Wellington area
Released
by end 2025 FY.
As with Options 2-4, Manawatu Line services would cease to be commercial y operated under this option,
although only after replacement of existing rol ing stock with DMMUs. They would be formally included in each
regions’ public transport network (i.e. identified as being integral to the public transport networks in the
respective RPTPs as required by the LTMA) and operated under contract to GWRC. Rol ing stock would be
owned by GWRC. Rol ing stock and services would be funded jointly by GWRC, HRC and the NZTA in
accordance with the NZTA’s prevailing funding assistance rate.
The time required to complete DMMU procurement and construction is a major constraint of this option.
This would delay the introduction of rol ing stock and service improvements by several years compared to
Option 2, and in turn require the refurbishment of existing rol ing stock to enable services to continue
operating in the intervening period.
The option is very similar to Option 4, with the primary difference being the use of dual mode rather than single
mode rolling stock. The DMMUs would use diesel power north of Upper Hutt and Waikanae, similarly to the
26 September 2019 │ Status: Draft │ Project No.: 310200204 │ Our ref: 310200204 190926 Lower North Island Longer-Distance Rolling Stock
Business Case - Amended Draft Final.docx
Page 37
link to page 56
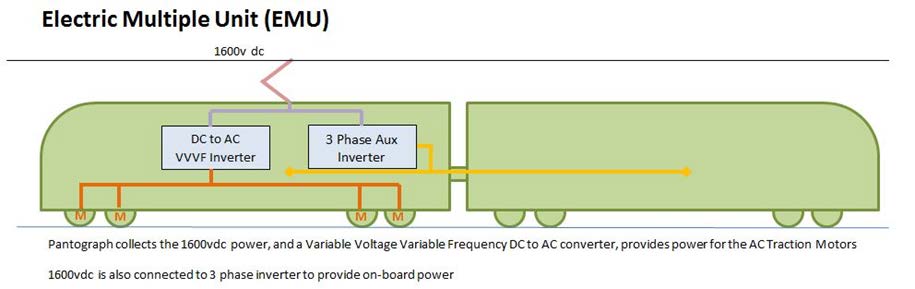
DMUs, and draw power from the electric overhead south of those points. They would therefore have the twin
advantage of using a sustainable power source for part of their journey and the ability to operate both with
and without electric power. The latter advantage is potential y very useful, as it could provide a means for
gradual y extending network electrification while maintain high service levels.
The option would respond to the train condition and operational efficiencies problems, although not
completely until the 2026 financial year. It would also address the fleet capacity problem, but only after the
same point, which may be problematic on the Wairarapa Line and in the electrified area. The option would
consequently offer regional connectivity, rail service quality, resilience and value for money benefits,
particularly from the 2026 financial year. The ability of DMMUs to operate without electricity is a significant
resilience benefit over most other options.
4.2.6 Option 6: Full EMU Fleet
1987
This option is the do-maximum option, which improves services on both lines by extending EMU operations the
ful length if each line and replacing existing rolling stock fleets with a larger fleet of EMUs. It entails:
•
improving Wairarapa Line service levels, initially through improved asset utilisation that is enabled by
LGOIMA,
compatibility upgrades, then again once electrification is completed to Masterton and new EMU rol ing
stock is available for service by the end of the 2027 financial year, then maintaining the higher service
levels on an ongoing basis; and
•
maintaining existing Manawatu Line service levels until the end of the 2027 financial year, then improving
them once electrification is completed to Palmerston North and new EMU rol ing stock is available for
service, then maintaining the higher service levels on an ongoing basis.
under
Table 4-7 summarises the operational and fleet and Infrastructure attributes of this option.
Released
26 September 2019 │ Status: Draft │ Project No.: 310200204 │ Our ref: 310200204 190926 Lower North Island Longer-Distance Rolling Stock
Business Case - Amended Draft Final.docx
Page 38
Table 4-7: Option 6 operational and fleet and infrastructure requirements
Category
Attributes
Operations
•
Increase Wairarapa service levels in 2028 FY once fleet and infrastructure
changes are completed:
Weekday peak (2019 FY): 3 morning and 3 afternoon peak-direction trips
Weekday peak (2028 FY): 4 morning and 4 afternoon peak-direction trips (all full
corridor), and 1 morning and 1 afternoon counter peak-direction trips
Weekday off-peak (2019 FY): 2 (plus 1 Friday evening) trips in each direction
Weekday off-peak (2028 FY): 3 (plus 1 Friday evening) trips in each direction
Weekend days (2019 FY): 2 trips in each direction
Weekend days (2028 FY): 4 trips in each direction.
•
Maintain existing Manawatu service levels until 2027 FY, then increase in 2028 FY
once fleet and infrastructure changes are completed:
1987
Weekday peak (2019 FY): 1 morning and 1 afternoon peak-direction trips
Weekday peak (2028 FY): 2 morning and 2 afternoon peak-direction trips (1 Levin-
only)
Weekday off-peak (2019 FY): no service
Weekday off-peak (2028 FY): 2 trips in each direction
Weekend days (2019 FY): no service
Weekend days (2028 FY): 2 trips in each direction.
LGOIMA,
Fleet and
•
Refurbish SW and SE fleets by end 2022 FY.
Infrastructure
•
Undertake life extension activities on S fleet by end 2022 FY.
•
Replace SW, SE and S fleets with 15 new 4-car EMUs by end 2027 FY.
•
Extend overhead catenary and supporting infrastructure to Masterton and
under
Palmerston North by end 2027 FY.
•
Change Carterton, Featherston and Maymorn track arrangements to enable
frequency enhancements by end 2027 FY.
•
Extend full signal ing system from Featherston to Masterton to enable frequency
enhancements by end of 2027 FY.
•
Expand Masterton stabling facilities and construct new stabling facilities in Levin
by end 2027 FY.
•
Released
Upgrade Manawatu Line stations by end 2027 FY.
•
Expand EMU maintenance facilities and stabling yard in Wellington area by end
2027 FY.
As with Options 2-5, Manawatu Line services would cease to be commercial y operated under this option,
although only after replacement of existing rol ing stock with EMUs. They would be formal y included in each
regions’ public transport network (i.e. identified as being integral to the public transport networks in the
respective RPTPs as required by the LTMA) and operated under contract to GWRC. Rol ing stock would be
owned by GWRC. Rol ing stock and services would be funded jointly by GWRC, HRC and the NZTA in
accordance with the NZTA’s prevailing funding assistance rate.
The time required to complete EMU procurement and construction, and construction of electric overhead
infrastructure, is a major constraint of this option in the same way as Option 3. This would delay the
introduction of rol ing stock and service improvements by several years compared to most other options, and
in turn require the refurbishment of al existing rol ing stock to enable services to continue operating in the
26 September 2019 │ Status: Draft │ Project No.: 310200204 │ Our ref: 310200204 190926 Lower North Island Longer-Distance Rolling Stock
Business Case - Amended Draft Final.docx
Page 39
link to page 57 link to page 58

intervening period. However, the option could be combined with Option 3, to extend electrification to
Featherston and Otaki and introduce new rol ing stock by the end of the 2025 financial year, before opening it
fully to Masterton and Palmerston North respectively by the end of the 2028 financial year, al owing benefits to
be accrued earlier than would otherwise be the case. The option could also be combined with Option 5, with
introduction of DMMUs by the end of the 2025 financial year (instead of EMUs at a later point) and gradual
extension of the electric overhead, also al owing benefits to be accrued earlier than would otherwise be the
case. Both sub-options are potential y viable but have not been explored in detail during the option
assessment process.
As framed (i.e. un-staged), the option would respond to the train condition and operational efficiencies
problems, although not completely until the 2028 financial year. It would also address the fleet capacity
problem, but only after the same point, which is likely to be very problematic on the Wairarapa Line and in the
electrified area. The option would offer regional connectivity, rail service quality, resilience and value for
money benefits, particularly from the 2028 financial year. However, EMU-run services would be subject to the
same resilience constraints as other EMU-run services on the network.
4.2.7 Option Summary
Figure 4-1 summarises and compares the timing (financial year) and level of service provided by the
operational elements of the options.
1987
LGOIMA,
under
Released
Figure 4-1: Summary of the timing and level of service provided by each option at key periods
Table 4-8 summarises and compares the fleet and infrastructure requirements of the options, and the
timing of completion (financial year) required to support the service enhancements.
26 September 2019 │ Status: Draft │ Project No.: 310200204 │ Our ref: 310200204 190926 Lower North Island Longer-Distance Rolling Stock
Business Case - Amended Draft Final.docx
Page 40
Table 4-8: Summary of the fleet and infrastructure requirements and completion financial year
tion 1
tion 2
tion 3
tion 4
tion 5
tion 6
p
p
p
p
p
p
O
O
O
O
O
O
Rolling Stock
Refurbish SW and SE fleets
2022 2022 2022 2022 2022 2022
Purchase S fleet and refurbish
2022
Undertake life extension activities on S fleet
2022 2022 2022 2022
Purchase 16 additional BR Mark 2 cars and refurbish
2022
Replace SW and SE fleets with 8 new 4-car DMUs
2032
Replace SW, SE and S fleets with 14 new 4-car DMUs
2032
1987
Replace SW, SE and S fleets with 15 new 4-car EMUs
2025
2027
Replace SW, SE and S fleets with 15 new 4-car DMUs
2025
Replace SW, SE and S fleets with 15 new 4-car DMMUs
2025
Network Infrastructure
Change Featherston and Maymorn track layout
2022 2025 2025 2025 2027
Change Carterton track layout
2022
2025 2025 2027
Extend ful signal ing from Featherston to Masterton
2022
2025 2025 2027
LGOIMA,
Extend overhead to Featherston and Otaki
2025
Extend overhead to Masterton and Palmerston North
2027
Expand Masterton stabling facilities
2022
2025 2025 2027
Construct new stabling facilities in Featherston and Otaki
2025
under
Construct Levin stabling facilities
2025 2025 2027
Station Facilities
Upgrade Manawatu Line stations
2022
2025 2025 2027
Expand park and ride & bus facilities in Featherston/Otaki
2025
Maintenance Facilities
Construct Wellington DMU maintenance facilities/stabling
2032 2032
2025
Released
Construct Wellington EMU maintenance facilities/stabling
2025
2027
Construct Wellington DMMU maintenance facilities/stabling
2025
26 September 2019 │ Status: Draft │ Project No.: 310200204 │ Our ref: 310200204 190926 Lower North Island Longer-Distance Rolling Stock
Business Case - Amended Draft Final.docx
Page 41
link to page 43 link to page 59 link to page 60
4.3
Option Assessment
4.3.1 Assessment Criteria
The options were screened using an assessment framework based on the Better Business Case model, which
tests options against the investment objectives and a set of critical success factors. This is consistent with the
NZ Transport Agency Business Case Approach.
The investment objectives were identified at the October ILM workshop and revised at the November ILM
workshop as described in Section
3.3. The critical success factors were identified at the November ILM
workshop and subsequently expanded on. They are:
•
strategic alignment: how wel the option meets the investment objectives and associated service
requirements, and fits with central and local government strategies, programmes and projects;
•
affordability - capital costs: the scale of capital expenditure and the likelihood that this can be met from
available funding;
•
affordability - operational costs: the scale of the net operational costs (i.e. operating funding gap) and
the likelihood that they can be met from available funding;
1987
•
technical achievability: the likelihood of successful implementation within the available timeframe, given
constraints such as lead times and implementation risks;
•
resilience: the ability of the option to support transport system and public transport network resilience, both
day to day operational resilience and response and recovery from high impact events;
•
environmental sustainability: the impact of the option on wider environmental sustainability, reflecting the
RLTP objective of an efficient and optimised transport system that minimises environmental impact; and
•
public acceptability: the expected degree of acceptance of the option by existing users, the wider
public, and their political representatives.
LGOIMA,
4.3.2 Assessment
The November ILM workshop assessed each of the six options on its potential to achieve each investment
objective and critical success factor over a 30-year period.
Table 4-9 outlines the scoring system used to
assess the performance of each option and, ultimately, to rank the options.
under
Table 4-9: Assessment framework scoring system
Description
Performance Against
Score
Criterion
High (H)
High
5
Medium-high (M-H)
Above Average
4
Medium (M)
Average
3
Low-medium (L-M)
Below Average
2
Released
Low (L)
Low
1
Table 4-10 summarises the results of this assessment, including the weighting applied to each criterion. The
investment objectives and the crucial Strategic Alignment critical success factor received the highest
weighting, reflecting the importance of these criteria. The service capacity-related investment objective
received the highest weighting, reflecting the importance of the associated problem. Several criteria assess
different aspects of cost/affordability, and col ectively account for a similar weighting to the above
investment objective. Subsequent sections outline the justification for the chosen scores.
The table also provides an indicative 30-year net cost (over the do-minimum) and associated 30-year and 60-
year benefit cost ratio (BCR) ranges, an indicative implementation timeframe, and key risks for each option, to
provide additional context. The 30-year evaluation period includes at least one rol ing stock replacement
cycle. The 60-year period includes at least two replacement cycles and tests how options with high fixed
infrastructure costs compare with other options over a longer timeframe.
26 September 2019 │ Status: Draft │ Project No.: 310200204 │ Our ref: 310200204 190926 Lower North Island Longer-Distance Rolling Stock
Business Case - Amended Draft Final.docx
Page 42
link to page 75 link to page 75 link to page 60 link to page 60 link to page 60 link to page 60
Table 4-10: Option assessment summary
t
st
t
et
ts
Flee
t
Flee
Boo e
e
g
a
U Fle
1: n
le
U Fleet
ap
2: in & F
3:
M
MMU
U Fle
htin
g
l EM
ig
D
D
tion ntai rar
tion inta tin
tion
tion 4:
tion 5:
tion 6: EM
p ai ai
p a
p rtia
p ew
p ew
p
We
O M W
O M Exis
O Pa
O N
O N
O Full
Investment Objectives
Increase service capacity
25%
L
M
M
H
H
H
Improve customer
15%
satisfaction
L
L
L
H
H
H
Maximise operational
10%
flexibility
L
L
L
M-H
H
M
Minimise whole of life costs
10%
1987
per passenger
H
M
M-H
H
H
L
37
Critical Success Factors
Strategic alignment
10%
L
L-M
M
M-H
H
M-H
Affordability - capital
5%
H
M
M
M
M
L
Affordability - operational
5%
H
L-M
M-H
M
M
M
Technical achievability
5%
H
H
H
H
M-H
H
Resilience
5%
L
M
M-H
H
H
M-H
LGOIMA,
Environmental sustainability
5%
L
L
M
L-M
M-H
H
Public acceptability
5%
L
L-M
L
M
M-H
M
Characteristics38
Indicative 30-year net cost
$200 -
$176 -
$202 -
$454 -
under
over do-minimum (2018 $m)
-
$227 -
$386
$364
$343
$381
$754
Indicative 30-year BCR over
do-minimum
-
0.9 - 2.2
0.9 - 2.2
1.2 - 3.3
1.1 - 2.9
0.5 - 1.2
39
Indicative 60-year BCR over
do-minimum
-
1.1 - 3.1
1.1 - 3.3
1.4 - 5.0
1.3 - 4.2
0.7 - 2.0
Indicative implementation
timeframe
13 years
3 years
7 years
7 years
7 years
9 years
40
Key Risks
t
t
t
Released
y
en e
en
ty
en
g
ture
er
e er xi e er
lo
m th
m th
le
p
m th
ironm ilienc to
ironm ilienc to
ilienc to
ironm
hno
t struc
us ow
us ow
om
us ow
os
Env Res C Gr
Env Res C Gr
C Res C Gr
Env
Tec
C Infra
MCA score
100%
2.0
2.3
2.7
4.4
4.7
3.9
37 Based on the discounted net cost per passenger over a 60-year assessment period.
38 Costs, benefits and BCR ranges are based on 80% of the model ed costs and high patronage and revenue growth
(see Section
5.4.1), 120% of costs and low growth, and a 4% discount rate (see Secti
on 5.4.1 for comment on discount
rates).
39 BCRs are indicative high-level ‘first cut’ BCRs, which were used to test the options at the option selection stage. They
differ from those that support the recommended option, which were the result of detailed analysis of benefits and costs.
40 Timeframe to delivery of new rolling stock (Options 1 and 3-6) and additional capacity (Option 2) from July 2019.
26 September 2019 │ Status: Draft │ Project No.: 310200204 │ Our ref: 310200204 190926 Lower North Island Longer-Distance Rolling Stock
Business Case - Amended Draft Final.docx
Page 43
link to page 33 link to page 41 link to page 61
Overal Ranking
6
5
4
2
1
3
4.3.2.1
Option Assessment - Investment Objectives
Options 4-6 are expected to perform best against the Service Capacity investment objective with a high
rating, since rol ing stock is expected to be procured in sufficient quantities to accommodate expected future
growth, be designed to meet specific local requirements, and provide improved service levels once in service.
Option 3 is also expected to respond wel for the same reasons, but the Featherston/Otaki bus connection is a
likely capacity constraint (both north of and at those locations), which limits it to a medium rating. Option 2
also has a medium rating, as the additional used rol ing stock is expected to have comparatively lower
capacity than the above options despite its similarly improved service levels. Option 1 does not address the
fleet capacity issue as identified in Sectio
n 3.1.2, with neither additional rol ing stock capacity nor improved
service levels on the Wairarapa Line, and withdrawal of service on the Manawatu Line, and it consequently
receives a low rating.
Options 4-6 are expected to perform best against the Customer Satisfaction investment objective, with a high
rating relating to the introduction of new rol ing stock
41, associated improvements in vehicle reliability, and
improved service levels. The bus connection is expected to be a significant barrier to some passengers under
Option 3, which limits that option to a low rating despite its new rol ing stock and improved service levels.
1987
Options 2 and 1 do not improve vehicle quality until much later than the other options, and consequently also
have a low rating.
Options 4 and 5 are expected to perform best against the Operational Flexibility investment objective, with a
high or medium-high rating respectively, relating to the dual cab, multiple unit and independent power
characteristics (and dual-mode characteristics of the DMMU), which enable quick turnaround and provide a
very high degree of versatility within a single fleet type to support the ful operation of both corridors (and
potential y elsewhere in the country). Option 6 is also versatile, but only within electrified areas and it
consequently has a medium rating. Options 1-3 have a low rating, reflecting the reduced fleet size and
reliance on the bus connection under Option 3, and the lower flexibility of locomotive-hauled trains under
LGOIMA,
Options 1 and 2.
Options 1, 4 and 5 are expected to perform best against the Whole of Life Costs investment objective with a
high rating, since their long run mix of operational and capital costs is expected to be much lower than the
other options on a per-passenger basis. Option 3 achieves this by constraining capacity, so although it has a
similar cost per passenger to Options 4 & 5, it achieves this by limiting patronage. Option 3 has a medium-high
rating and Option 2 a medium rating, reflecting relatively higher costs per passenger. Option 6 performs
under
poorly, reflecting its high infrastructure cost and later in-service implementation.
Options 4 and 5 are therefore the best-performing of the options against the ful range of investment
objectives, with Option 4 having a high rating against three of the four objectives and a medium-high rating
against the other, and Option 5 having a high rating against al four objectives.
4.3.2.2
Option Assessment - Critical Success Factors
Options 4-6 are expected to perform best against the Strategic Alignment critical success factor with high
(Option 5) or medium-high (Options 4 and 6) ratings, since al provide clear regional connectivity, rail service
Released
quality, resilience and value for money investment benefits, which in turn are closely linked to regional and
national transport objectives as described in Sectio
n 3.2. Option 5 responds particularly strongly to the GPS
Environment strategic priority and thus has a higher rating than Option 4, while Option 6 is hampered by its
high cost, which would prohibit other strategic investment. Option 3 has a medium rating, because it
responds less strongly than the above options against the connectivity and quality benefits. Option 2 has
medium-low rating due to its partial response to the benefits, while Option 1 disbenefits give it a low rating.
Option 1 is expected to perform best against the Affordability – Capital Cost critical success factor with a high
rating that is directly linked to its low cost, which in turn relates to the smal rol ing stock fleet size and delay of
any significant investment until the post-2030 period. Options 2-5 have broadly similar capital costs and a
medium rating, with Option 2 requiring both used rol ing stock in the short run and new rol ing stock in the post-
41 Passengers perceive new rol ing stock as being of higher quality, through a range of attributes that include
appearance, comfort, smoothness and quietness, heating and air conditioning, lighting, and environmental impact.
Good New Zealand evidence of the value of vehicle quality is provided in NZTA Research Report 565 – Pricing
Strategies for Public Transport.
26 September 2019 │ Status: Draft │ Project No.: 310200204 │ Our ref: 310200204 190926 Lower North Island Longer-Distance Rolling Stock
Business Case - Amended Draft Final.docx
Page 44
2030 period, Option 3 requiring some fixed infrastructure, and Options 3-5 all requiring rol ing stock investment
prior to the introduction of the main fleet. Option 6 has a low rating due to its high infrastructure costs.
Option 1 is expected to perform best against the Affordability – Operational Cost critical success factor with a
high rating related to the low cost of its low level of service. Option 3 has a medium-high rating related to its
smaller rail service area and introduction of electrification at an earlier point that Option 6. Options 4-6 have
medium ratings, with Option 4 having a higher operating cost associated with its diesel power source but a
countering lower maintenance cost, and Options 5 and 6 having lower operating costs but higher
maintenance costs. Option 2 has a low rating since it relies on the use of less efficient locomotive haulage
until the post-2030 period.
Options 1, 2, 3, 4 and 6 are expected to perform best against the Technical Achievability critical success
factor with a high rating that relates to their use of a single fleet and established technology. Option 5 is
restricted to a medium-high rating by its use of new (for New Zealand) dual-mode technology, which is likely to
require the upskilling of operating and maintenance personnel, making implementation a little more difficult
than the above options.
Options 4 and 5 are expected to perform best against the Resilience critical success factor, with a high rating
that is linked to the flexibility of multiple unit rolling stock and the ability of the rol ing stock to operate without
1987
electricity. Options 3 and 6 have the similar advantage of being multiple unit based, but a lower medium-high
rating that reflects the limitations of the rol ing stock being unable to operate when there is a problem with
electrical systems. Option 2 has a medium rating, which recognises that a larger longer-distance rol ing stock
fleet will increase overall fleet capacity, which along with its diesel power source will provide some capacity to
respond to resilience events, but also recognises that a refurbished fleet is essential y an old fleet that is more
prone to failure and be the cause of events. Option 1 provides no resilience benefit beyond that provided at
present.
Option 6 is expected to perform best against the Environmental Sustainability critical success factor, reflecting
the environmental benefits of full electrification. Option 5 also performs wel , with a medium-high rating that is
LGOIMA,
linked to its electric base. Option 3 has a similar advantage, but it is hampered by the lower environmental
quality of bus-based connections and expected increased park and ride use, and it consequently receives a
medium rating. Option 4 receives a low-medium rating that reflects its diesel power source, which is less
sustainable that the electric options, although it is more efficient than locomotive-based options. Options 1
and 2 offer no environmental advantage over the present fleet, which relies on inefficient diesel locomotive
haulage.
under
Option 5 is expected to perform best against the Public Acceptability critical success factor with a medium-
high rating that relates to its ability to deliver new and better capacity and frequency in the medium term.
Option 4 can also deliver new and better capacity and frequency in the medium term, but it is inferior to the
DMMU from an environmental perspective. Option 6 performs wel from an environmental perspective, but its
inability to address capacity issues in the medium term also limits it to a medium rating. Option 2 has a low-
medium rating, since it delivers capacity in the short run, but of a relatively low quality, with new rolling stock
arriving only in the long run. Options 1 and 3 are unlikely to be publicly acceptable and consequently have a
low rating, since Option 1 would not respond to capacity issues on the Wairarapa Line and entail the
withdrawal of Manawatu Line services, and Option 3 would eliminate single-train service for around 70% of
existing passengers on both lines.
Released
None of the options achieve a high rating across al critical success factors. Options 4 and 5 are best
performing, with Option 4 having one high rating, one medium-high rating and three medium ratings, and
Option 5 having one high rating, two medium-high ratings, and two medium ratings. Options 1, 3 and 6 have
a low rating for at least one factor, which essentially discounts them as viable options despite Option 6 having
both a high and a medium-high rating. Option 2 has been ruled out on the basis that it has the fewest
medium and high scores of al options.
4.3.2.3
Option Assessment - Characteristics
Options 2-5 are broadly similar in cost compared to the do-minimum over 30 years, ranging from a low of
$176m to $343m for Option 4, and a high of $227m to $386m for Option 2. The Option 6 cost is a step change
higher and significantly more expensive than the other options with a range of $454m to $754m above the do-
minimum, primarily due its high infrastructure requirements and particularly the cost associated with
electrification to Palmerston North.
26 September 2019 │ Status: Draft │ Project No.: 310200204 │ Our ref: 310200204 190926 Lower North Island Longer-Distance Rolling Stock
Business Case - Amended Draft Final.docx
Page 45
link to page 63 link to page 75 link to page 75
Option 4 provides the best economic return with an indicative BCR range over the do-minimum of 1.2 to 3.3
over 30 years and 1.4 to 5.0 over 60 years. Option 5 is the next best performing with slightly lower BCR ranges
of 1.1 to 2.9 and 1.3 to 4.2 respectively. Options 2, 3 and 6 are the poorest performing from an economic
perspective with BCRs of 0.9 to 2.2, 0.9 to 2.2, and 0.5 to 1.2 (30 years), and 1.1 to 3.1, 1.1 to 3.3, and 0.7 to 2.0
(60 years) respectively.
Table 4-11 provides the mid-range 30-year BCR and associated incremental BCRs for each option, based on
mid-range costs, medium patronage growth (see Section
5.4.1), a 4% discount rate (see Sectio
n 5.4.1 for
comment on the discount rates applied) and a target incremental BCR of 1.0. This identifies Option 4 as
providing the optimal benefit-cost mix, as the highest cost option with an incremental BCR greater than the
target incremental BCR, confirming that option as the best performing from an economic perspective. Option
5 would be the next best option in the absence of Option 4.
Table 4-11: Mid-range and incremental BCRs
in
t
ta
et
in
lee
a
t
e
U Fle
U F
1987
3:
U Fleet
M
n 2: M t Existing
l EM
M
U Fle
D
DM
tio
ts
tion
tion 4:
tion 5:
tion 6: EM
p Boos
p rtia
p ew
p ew
p
O & Flee
O Pa
O N
O N
O Full
Indicative benefits over do-minimum
(2018 $m)
$468
$405
$539
$540
$513
Indicative net cost over do-minimum
(2018 $m)
$306
$278
$255
$287
$600
LGOIMA,
Indicative 30-year BCR over do-minimum
1.5
1.5
2.1
1.9
0.9
Incremental BCR over Option 1
-
-
2.1
-
-
Incremental BCR over Option 4
-1.4
-5.9
-
0.0
-0.1
Option 2 has the shortest implementation timeframe for additional capacity of three years. The procurement
under
and construction process delays Options 3, 4 and 5 by an additional four years and Option 6 by an additional
six years over that option. Option 1 has the longest implementation timeframe of 13 years.
Options 4 and 5 are identified as the least-risky options, with Option 4 having an environmental risk associated
with the reliance on a diesel power source, and Option 5 having a technology-related risk as described
above. The cost and timeframe associated with ful electrification is a significant risk under Option 6. Options
1-3 are the most-risky options, with al having a significant resilience-related risk and a customer growth-related
risk relating to their ability to adequately address the problems. Options 1 and 2 also have an environment-
related risk associated with the continued use of diesel locomotive haulage until the 2032 financial year, while
Option 3 has a complexity-related risk as previously described.
Released
Options 4 and 5 have the best performing characteristics overal , with the best economics, a relatively short
implementation timeframe, and the fewest risks compared to other options.
4.3.2.4
Option Assessment - Overall Ranking
Options 4 and 5 are the best-performing options across al three aspects of the assessment as described
above. Both score wel against the investment objectives and critical success factors, with Option 5 having
nine high or medium-high ratings compared to Option 4’s seven. Option 5 also has more high ratings than
Option 4. Neither option has any low ratings. Both provide a positive economic return, although Option 4 is
best performing and more affordable. The two options are general y comparable in terms of timeframe and
risk. Option 5 is ranked slightly ahead of Option 4 on balance, since it is the only option that ful y achieves all
investment objectives, it best meets the crucial Strategic Alignment critical success factor that ultimately
defines overal success, and it has a higher overal score of 4.7, compared to Option 4’s 4.4.
Option 6 is the third-ranked option with an overal score of 3.9 and six high or medium-high ratings, although it
has two low cost-related ratings, a long implementation timeframe and a low BCR, which make it a
26 September 2019 │ Status: Draft │ Project No.: 310200204 │ Our ref: 310200204 190926 Lower North Island Longer-Distance Rolling Stock
Business Case - Amended Draft Final.docx
Page 46
significantly less viable option than Options 4 or 5. The remaining options are ranked, but they perform poorly
against the criteria with overal scores of 2.7 (Option 3), 2.3 (Option 2) and 2.0 (Option 1), score poorly against
multiple investment objectives, and are riskier than Options 4-6, and they are consequently deemed to be
unsuitable.
4.4
Conclusion
Six options have been identified from a long list of sixteen potential mode/fleet and nine potential service level
responses by stakeholders . These are:
•
Option 1: maintain the existing Wairarapa Line fleet and services and al ow Manawatu Line services to
cease operating (the do-minimum option);
•
Option 2: improve the Wairarapa Line fleet and service levels by purchasing additional used rol ing stock
and maintain the existing Manawatu Line fleet and service levels (the enhanced status quo option);
•
Option 3: electrify to Featherston and Otaki, extend EMU operations to those points and improve service
levels, with bus connections from outer points;
•
Option 4: replace existing fleets with a DMU fleet at the earliest opportunity and improve service levels;
1987
•
Option 5: replace existing fleets with a dual-mode DMMU fleet at the earliest opportunity and improve
service levels; and
•
Option 6: electrify to Masterton and Palmerston North, extend EMU operations to those points at earliest
opportunity and improve service levels.
The options have been assessed against an assessment framework consisting of:
•
four investment objectives identified by stakeholders, relating to service capacity, customer satisfaction,
operational flexibility and whole of life costs;
•
seven critical success factors identified by stakeholders, relating to strategic alignment, affordability –
LGOIMA,
capital costs, affordability – operational costs, technical achievability, resilience, environmental
sustainability, and public acceptability; and
•
four option characteristics, relating to indicative cost, indicative economics, implementation timeframe,
and key risks.
The DMU (Option 4) and DMMU (Option 5) are the best-performing options across al three aspects of the
under
assessment. The DMU option is more affordable and provides a slightly better economic return, but the DMMU
option best meets the scored assessment criteria, with better scores against the investment objectives and the
crucial Strategic Alignment critical success factor. The DMMU option is consequently ranked ahead of DMU,
but both options are viable, and both are considered further in the detailed component of this business case.
Released
26 September 2019 │ Status: Draft │ Project No.: 310200204 │ Our ref: 310200204 190926 Lower North Island Longer-Distance Rolling Stock
Business Case - Amended Draft Final.docx
Page 47
link to page 75 link to page 67 link to page 65 link to page 65

5. Recommended Option
5.1
Description
The investment proposal entails replacing all existing longer-distance rail rol ing stock with DMMUs (the primary
preferred option) or DMUs (the alternative preferred option) and using these to improve service levels on the
Wairarapa and Manawatu lines and the overall capacity of the Metlink rail network. It consists of the fol owing
steps:
•
2020 financial year: investigate options to take advantage of the improved asset utilisation resulting from
the recent SW and SE compatibility upgrades to improve interim service levels, and commence the
specification and procurement of the new DMU/DMMU fleet and supporting infrastructure;
•
2022 financial year: complete refurbishment of the SW and SE fleets and S fleet life extension;
•
2025 financial year: complete construction of supporting infrastructure and introduce the new
DMU/DMMU fleet on existing services, replacing the SW, SE and S fleets, which wil then be retired; and
•
2026 financial year: introduce new higher-frequency timetables on each line.
1987
A description of the fleet, infrastructure and service level aspects of the investment proposal are provided in
the fol owing sections, along with a discussion on its expected impact.
5.1.1 Fleet
The new rol ing stock fleet wil consist of 15 four-car sets, to al ow eight to be used to provide four eight-car
peak trains on the Wairarapa Line, three to be used to provide one eight-car and one four-car peak trains on
the Manawatu Line, two to provide spare capacity to al ow for anticipated patronage growth, and two spare
sets to al ow for maintenance. This fleet size is sufficient to al ow for good fleet management and flexible
enough to meet the projected patronage growth scenarios described in Sectio
n 5.4.1 (coupled with the
LGOIMA,
service level improvements noted in Sectio
n 5.1.3). Fleet size wil be reviewed during the specification process
and updated if required at that point. Each four-car set is expected to:
•
consist of two motor-equipped cars and two trailer cars;
•
have a cab at each end of the set to enable quick turnaround at the termini;
•
be equipped for multiple unit operation
42;
under
•
include appropriate toilet, luggage, information and other passenger facilities; and
•
provide a seating capacity of approximately 250 passengers (with additional standing capacity).
The new fleet wil utilise low-emission diesel technology for its power source if the DMU option is selected and
dual-mode technology if the DMMU option is selected. The DMU wil use on-board diesel engines for
propulsion, either directly through a diesel-mechanical or diesel-hydraulic transmission as shown i
n Figure 5-1,
or indirectly through a diesel-electric transmission using a generator to power electric traction motors. A
generator or alternator wil power on-board systems such as lighting and air-conditioning.
Released
Figure 5-1: Characteristics of a DMU with diesel-hydraulic transmission
42 Multiple unit operation wil enable a single driver to control two or more four-car sets operating in a larger consist (i.e.
as an eight or twelve car train).
26 September 2019 │ Status: Draft │ Project No.: 310200204 │ Our ref: 310200204 190926 Lower North Island Longer-Distance Rolling Stock
Business Case - Amended Draft Final.docx
Page 48
link to page 65 link to page 67 link to page 66
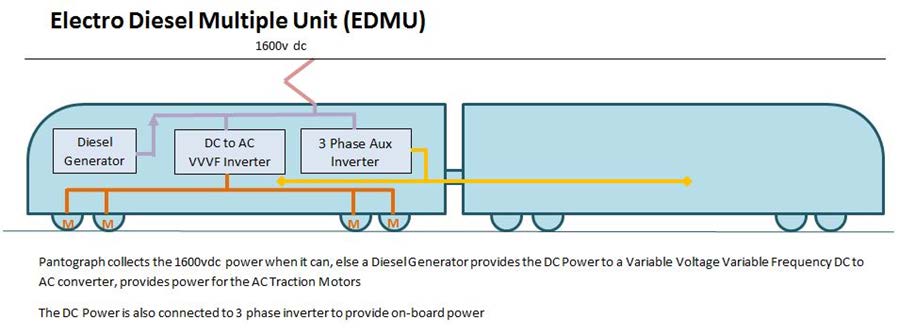
The DMMU wil use a similar transmission to a diesel electric DMU if the electro diesel EDMU alternative is
selected through the specification and procurement process. However, it wil have the ability to either draw
power from the onboard diesel engine and generator, or from the electric overhead via a pantograph to
operate in purely electric mode when in the electrified area, as shown i
n Figure 5-1. Each DMMU will require
more equipment and be more expensive to procure and maintain than the equivalent DMU, but offer
additional flexibility and environmental benefits, and better meet key critical success factors, as described in
Sections 4.2.5 and Section 4.3.2.
1987
Figure 5-2: Characteristics of an EDMU
The new fleet wil be introduced first on the Manawatu Line during the 2025 financial year. Priority wil then go
to increasing capacity and service levels by adding additional DMU/DMMU-run services on the Wairarapa Line
and then replacing all Wairarapa Line rol ing stock, before increasing service levels on the Manawatu Line.
Existing rol ing stock fleets wil be retired one replaced.
LGOIMA,
The new fleet could be specified to be operable in other parts of the country, where different standards for
such factors as platform height, clearances or electrical systems may apply. This would enable trial or
permanent services to be established elsewhere, and potential y offer economies of scale, both at the
procurement and design stage and in ongoing maintenance and operation. Interoperability is likely to be
more workable under the DMU option, but it is also feasible under the DMMU option.
5.1.2 Infrastructure
under
Network infrastructure, station facility and maintenance facility upgrades wil be required to support the
introduction and ongoing operation of the new rol ing stock and associated services. The maintenance
facility wil need to be completed prior to the arrival of the first DMU/DMMU. All other upgrades wil need to be
completed by the end of the 2025 financial year, to enable the service level enhancements to be
implemented early in the fol owing financial year.
The network infrastructure requirements have been independently assessed by Rail Infrastructure Consultants
(RIC) for KiwiRail
43. The RIC investigation considered the requirements of both the passenger service level
enhancements identified in Sectio
n 5.1.3, and current and future freight requirements on both lines,
Released
particularly the Wairarapa Line, where there are existing infrastructure and operational constraints that limit
train headway and passing opportunities.
The RIC investigation identified the fol owing network infrastructure requirements, which in combination, will
deliver capacity, frequency, journey time, punctuality, operational resilience and safety improvements for
passenger and freight services on the Wairarapa Line and support operations on the Manawatu Line:
•
extension of the existing Carterton siding to create a new 600m loop and allow passenger and freight
trains to pass;
•
construction of a new second platform at Featherston to al ow two passenger trains to pass, offset from
the existing platform to allow for future freight-related improvements;
•
construction of a new 600m passing loop at Maymorn to al ow passenger and freight trains to pass;
43 EDMU Business case Support Infrastructure Response Technical Note, RIC report for KiwiRail, May 2019.
26 September 2019 │ Status: Draft │ Project No.: 310200204 │ Our ref: 310200204 190926 Lower North Island Longer-Distance Rolling Stock
Business Case - Amended Draft Final.docx
Page 49
link to page 65 link to page 67 link to page 67
•
replacement of the existing radio-based train management system between Masterton and Featherston
with a full signalling system, to support the frequency and journey time enhancements (along with the new
passing loops) and improve operational resilience and safety;
•
rationalisation of level crossings and upgrades to remaining crossings to improve safety;
•
construction of an improved stabling facility in Masterton, with capacity for four eight-car trains;
•
construction of a new stabling facility in Levin, with capacity for one eight-car train
44; and
•
construction of a new stabling facility in the Wellington area, either separate from or as part of the DMMU
maintenance facility.
The station facility requirements are limited to the Manawatu Line, where stations wil need to be brought up to
a consistent standard with those on the Wairarapa Line and supported with appropriate park and ride
facilities.
The DMU/DMMUs wil require a specific maintenance facility with appropriate capacity and equipment to
support the ful maintenance requirements of a 15-set fleet. This could be an extension of the existing EMU
facility in Wel ington, but space constraints are likely to prohibit this option, and the facility is therefore likely to
be stand-alone and located elsewhere. Further work wil need to be done to determine the optimal location
1987
of this facility and the associated Wel ington stabling facility, which it might be co-located with.
The exact infrastructure requirements are subject to further investigation and dependent on the outcome of
the rol ing stock specification process. Some aspects depend on whether the final specified option is DMU or
DMMU-based, and if the latter, which type of DMMU is ultimately specified. They may also include other
changes, such as amendments to platforms north of Upper Hutt and Waikanae to optimise accessibility, which
are dependent on rol ing stock specification and design.
5.1.3 Service Levels
5.1.3.1
Proposed Service Levels
LGOIMA,
Investment in additional peak-direction services is a central element of the investment proposal. This wil
provide more capacity to respond to existing demand pressures, both outside of and within the electrified
area, and better frequency, which wil make the public transport option more attractive to existing and
potential future peak passengers.
under
Investment in counter peak-direction, off-peak and weekend services on both lines is also an important
element of the investment proposal. The additional off-peak services wil support peak services by providing
additional low marginal cost capacity through peak spreading at fringe peak periods, and by providing more
travel options for those who must currently travel at the peak when capacity is constrained. These and new
and improved counter peak-direction and weekend services wil improve connectivity on both lines, and
consequently improve access and support economic development and tourism in the regional areas that
they serve.
The proposed service levels are based around a complex set of requirements, including the frequency
needed to provide the capacity required to meet projected demand at peak times (coupled with the fleet
Released
size and capacity noted in Section
5.1.1), market segment-based service timing (e.g. Wellington-focused
journey to work, education-based travel, business travel, tourist travel, access-based travel (particularly
SuperGold timing)), the availability of train paths outside of and within the electrified area, and operational
efficiency, particularly in efficiently delivering counter peak-direction, fringe peak, off-peak and weekend
services. Timetables have been developed in sufficient detail to ensure that they meet these requirements,
are operational y viable, and fit with future network plans, but are subject to further refinement and
confirmation at the rol ing stock specification stage, and later prior to implementation of any service
change
45.
44 Existing stabling facilities will be used in Palmerston North and have enough capacity to cater to requirements without
expansion.
45 Other service level options may be possible, particularly at off-peak times, but a higher level of service would
increase operating costs (and capital costs if required at peak times), and a lower level of service would reduce access
and fail to address economic development goals. Proposed Wairarapa Line service improvements are incremental
steps on top of current service levels. Proposed Manawatu Line service improvements are incremental at the peak and
focused from Levin southwards where demand is strongest, and similar to current Wairarapa Line services at off-peak
times.
26 September 2019 │ Status: Draft │ Project No.: 310200204 │ Our ref: 310200204 190926 Lower North Island Longer-Distance Rolling Stock
Business Case - Amended Draft Final.docx
Page 50
link to page 68 link to page 69
Table 5-1 shows the timing and extent of the proposed improvements to Wairarapa Line service levels. It
indicates that:
•
Weekday off-peak services wil increase from two in each direction at present, to three in each direction in
the 2026 financial year;
•
Friday night services wil be maintained at one in each direction; and
•
Saturday and Sunday services wil increase from two in each direction at present, to four in each direction
in the 2026 financial year.
Table 5-1: Current and proposed service levels - Wairarapa Line
Period
Current
2026 FY
From
Weekday morning peak
3
4
Masterton
Weekday afternoon peak
0
1
Weekday off-peak
2
3
Friday night
1
1
1987
Saturday
2
4
Sunday
2
4
To
Weekday morning peak
0
1
Masterton
Weekday afternoon peak
3
4
Weekday off-peak
2
3
Friday night
1
1
LGOIMA,
Saturday
2
4
Sunday
2
4
Table 5-2 shows the timing and extent of the proposed improvements to Manawatu Line service levels. It
indicates that:
under
•
Weekday peak services wil increase from one peak-direction service in each peak at present, to two
peak-direction services in the 2026 financial year (one of which wil run from/to Levin only);
•
Weekday off-peak services wil increase from none at present, to two in each direction in the 2026
financial year; and
•
Saturday and Sunday services wil increase from none in each direction at present, to two in each
direction in the 2026 financial year (similarly to current Wairarapa Line weekend service levels).
Manawatu Line services do not currently stop at any stations between Paraparaumu and Wel ington,
although Porirua has been a scheduled stop in the past. However, the investment proposal seeks to
integrate Manawatu Line services into the Metlink network in a similar way to the Wairarapa Line, and it
Released
therefore includes a plan to reintroduce this stop. This wil provide better access to the employment,
educational and other opportunities and services that are available there from the north, and additional
capacity to supplement EMU-run services at Porirua, which is one of the Metlink networks’ busiest stations.
26 September 2019 │ Status: Draft │ Project No.: 310200204 │ Our ref: 310200204 190926 Lower North Island Longer-Distance Rolling Stock
Business Case - Amended Draft Final.docx
Page 51
link to page 57 link to page 25 link to page 67
Table 5-2: Current and proposed service levels - Manawatu Line
Period
Current
2026 FY
From
Weekday morning peak
1
1 Palmerston Nth
Palmerston
1 Levin
North
Weekday afternoon Peak
0
0
Weekday off-peak
0
2
Friday night
0
0
Saturday
0
2
Sunday
0
2
To Palmerston Weekday morning peak
0
0
North
Weekday afternoon Peak
1
1 Palmerston Nth
1 Levin 1987
Weekday off-peak
0
2
Friday night
0
0
Saturday
0
2
Sunday
0
2
Figure 4-1 provides a graphical comparison of service levels. LGOIMA,
5.1.3.2
Integration with Future of Rail
As noted in Section,
2.2.1.3, the MOT and KiwiRail are working on changes in legislation to al ow NLTF
investment in KiwiRail to support a resilient and reliable rail system. To date, the metro rail providers have
had minimal governance-level engagement in this process, and although they are supportive of more
investment in the national rail network, they would like to ensure that it does not negatively impact on the
metro networks. Both regions have 85-year network access agreements with KiwiRail (through to 2098),
under
which clearly outline the priority rules for different rail services and the process to obtain increased access
to the network.
The proposed timetable slots for the increased service frequency proposed in Section
5.1.3.1 have been
shared and discussed with KiwiRail, and it has been agreed they are possible if the improvements to the rail
network infrastructure outlined within this business case, and those already funded within the Unlocking
Capacity and Improving Resilience business case, are provided.
In a similar manner, if KiwiRail proposes to increase freight service frequencies (particularly in the peak),
they wil need to reach agreement with GWRC, and potential y invest in improvements on the rail network
to ensure that the network capacity and resilience is not degraded as a result. GWRC expects that these
required investments are being planned and considered as part of any proposed increase in freight.
Released
5.1.4 Impact
The investment proposal directly addresses the train condition problem, by replacing old rolling stock with
new. This wil minimise the cost of life extension work, and the increased cost of ongoing maintenance that
wil otherwise be required as the rol ing stock ages and becomes more unreliable. It will therefore provide
the service quality, resilience and value for money benefits that are sought, and achieve the objectives of
improving customer satisfaction and minimising costs per passenger.
The investment proposal directly addresses the fleet capacity problem, by improving the frequency, timing
and direct capacity of trains on both lines. This wil provide greater overal capacity to respond to current
and future demand pressures, and better convenience for current and potential future passengers. It wil
therefore provide the regional connectivity, service quality, resilience and value for money benefits that
are sought, and achieve the objectives of increasing service capacity, improving customer satisfaction,
and minimising costs per passenger (by accommodating patronage growth).
26 September 2019 │ Status: Draft │ Project No.: 310200204 │ Our ref: 310200204 190926 Lower North Island Longer-Distance Rolling Stock
Business Case - Amended Draft Final.docx
Page 52
link to page 70 link to page 75 link to page 70 link to page 70 link to page 70 link to page 70
The investment proposal directly addresses the operational efficiencies problem, by utilising a consistent
but flexible service delivery model and fleet. This wil provide a more responsive and better coordinated
service that is more efficient to maintain and operate. It wil therefore provide the service quality,
resilience and value for money benefits that are sought, and achieve the objectives of maximising
operational efficiency and minimising costs per passenger.
Table 5-3 summarises the links between the investment proposal’s response to each of the problems and
the investment benefits and objectives.
Table 5-3: Links between the problem response, and investment benefits and objectives
Train Condition
Fleet Capacity
Operational
Efficiencies
Investment benefits
Enhanced regional connectivity
N/A
N/A
Improved rail service quality
More resilient transport network
1987
Value for money
Investment objectives
Increase service capacity
N/A
N/A
Improve customer satisfaction
N/A
Maximise operational flexibility
N/A
N/A
Minimise costs per passenger
LGOIMA,
5.2
Benefits
5.2.1 Road User Benefits
Road user benefits account for approximately 80% of the investment proposal’s assessed benefits and include
three components: congestion reduction, safety and environmental benefits. The benefits for each
under
component are derived from the Wel ington outputs of the Value of Rail assessment for the NZTA
46 and
applied on a per passenger km basis
47 to new passengers on the Wairarapa Line and new and existing
passengers on the Manawatu Line
48.
Congestion reduction accounts for most of the road user benefits and relates to the reduction in road travel
time and cost that results from increased public transport use. It has an inflation-adjusted 2018/19 value of
$0.9884 per passenger km derived from the Value of Rail assessment, which is in turn based on values of time
sourced from the NZTA Economic Evaluation Manual (EEM). This provides a 30-year discounted congestion
benefit of $410.2m over the do-minimum under both options, based on medium patronage growth (see
Sectio
n 5.4.1) and a 4% discount rate
49.
Released
46 Value of Rail in New Zealand by EY (2016). See that report for the methodologies used to determine the underlying
benefits.
47 The passenger km approach is consistent with that used for Wel ington Metro Railway Network Track Infrastructure
Catch-up Renewals and Unlocking Network Capacity and Resilience business cases. Manawatu Line passenger km are
based on an average trip to Waikanae only.
48 Since Manawatu Line services would otherwise be withdrawn. The benefit values associated with new passengers are
valued at half of those for existing passengers, in accordance with NZTA EEM guidance.
49 The congestion benefit has been tested against and is broadly consistent with the combined value of time and
vehicle operating cost outputs from the Northern Wel ington Saturn Model, which extends across the whole Wel ington
Region from Wel ington in the south, Masterton to the east and Otaki to the west. This model is a very good traffic
assignment capability, which is used to establish forecast demand levels, but it is limited in terms of its ability to replicate
detailed congestion effects. It is common for Saturn to underestimate actual road delays and to require the use of
more detailed traffic models for localised areas. This together with rather generous coding conventions with respect to
lane and intersection capacities also means that the model is highly likely to have underestimated de-congestion
effects associated with improvements to rail services. Consequently, the benefits calculated using the model can be
taken to be robust and to in all probability to underestimate actual economic benefits.
26 September 2019 │ Status: Draft │ Project No.: 310200204 │ Our ref: 310200204 190926 Lower North Island Longer-Distance Rolling Stock
Business Case - Amended Draft Final.docx
Page 53
link to page 71 link to page 71 link to page 71 link to page 71 link to page 71
The safety benefit relates to the reduction in road traffic volumes and crash risk that wil result from increased
public transport use. It has an inflation-adjusted 2018/19 value of $0.0356 per passenger km
50 derived from the
Value of Rail assessment. This provides a 30-year discounted safety benefit of $14.8m over the do-minimum
under both options, based on medium patronage growth and a 4% discount rate.
The environmental benefit relates to the reduced motor vehicle emissions that result from reduced vehicle
travel through increased public transport use. It has an inflation-adjusted 2018/19 value of $0.0022 per
passenger km derived from the Value of Rail assessment. This provides a 30-year discounted environmental
benefit of $0.9m over the do-minimum under both options, based on medium patronage growth and a 4%
discount rate.
5.2.2 Public Transport User Benefits
Public transport user benefits account for approximately 20% of the investment proposal’s assessed benefits
and include three main components: frequency, health and new vehicle benefits. The benefits for each
component are based on the guidance provided in Appendix A18 (frequency and new vehicle benefits) and
Appendix A20 (health) of the EEM.
The frequency (or wait time) benefit accounts for approximately two thirds of the public transport user benefits
1987
and relates to the increased convenience of public transport as an option to existing and new passengers
from increased headway. Existing service frequency on both corridors is very low, so a wait time benefit of 9.9
minutes per passenger has been applied
51 along with an inflation-adjusted 2018/19 value of time of $13.82
52.
This results in a frequency benefit of $4.56 per passenger for existing passengers and $2.28 per passenger for
new passengers in accordance with the guidance in Section A18.4 of the EEM, providing a 30-year discounted
frequency benefit of $87.8m over the do-minimum under both options, based on medium patronage growth
and a 4% discount rate.
The health benefit relates to the increased active mode use that is associated with the first and last mile
components of public transport-based journeys. This benefit applies to new passengers, who are assumed to
LGOIMA,
increase their activity by around 33 minutes per day
53. This results in an inflation-adjusted 2018/19 health
benefit of $3.46 per passenger for new passengers in accordance with the guidance in Section A20.3 of the
EEM, providing a 30-year discounted health benefit of $38.0m over the do-minimum under both options,
based on medium patronage growth and a 4% discount rate.
The new vehicle benefit relates to the perceived comfort and feel of new rol ing stock, which passengers
place value on. This benefit is based on the guidance provided in Section 18.6 of the EEM and uses an
under
average nine-year wil ingness-to-pay value of 2.
95%54 of the current weighted average fare to calculate a 30-
year discounted new vehicle benefit of $0.9m over the do-minimum under both options, based on medium
patronage growth and a 4% discount rate.
Other public transport user benefits may be available, such as from station improvements or additional rol ing
stock features that are not currently available (e.g. Wi-Fi). However, these cannot be quantified as the
specific improvements and features are yet to be determined and the existing rol ing stock already has most
features that are valued by passengers. Public transport travel time benefits may also be available,
particularly if track improvements and new rol ing stock enable improved travel times. The latter benefit could
be substantial if travel times are significantly reduced, but it is also dependent on rol ing stock specification.
Released
50 The Value of Rail assessment shows a safety disbenefit for Wel ington and a safety benefit for Auckland. The reasons
for this difference are unclear since the Wel ington model was used for both purposes, but no calculation details are
available to allow the cause of the difference to be determined. However, a reduction of road traffic volumes is
typically related to improved road safety, so the safety benefit in this business case has been defined as a patronage-
based proportion of the Auckland safety benefit based on the advice of the economics peer reviewer.
51 This is a patronage-weighted value based on the relevant peak and off-peak wait time benefits in EEM Table A18.2.
52 This blended value of time is based on the trip purposes in EEM Table A2.4 (urban arterial AM peak) and the values of
time in EEM Table A4.1(b) and reflects the arterial nature and diversity of trip purposes on longer-distance services.
53 Based on the findings of Public Transport Use the Ticket to Health, a briefing paper by Bus Association of Victoria
(2010). This active mode travel time equates to a return trip between Wel ington Railway Station and Chews Lane.
54 Based on the findings of NZTA Research Report 565 (Pricing Strategies for Public Transport) by Neil Douglas (2016) that
passengers are wil ing to pay 5.9% higher fares for a new train, declining to 0% after nine years.
26 September 2019 │ Status: Draft │ Project No.: 310200204 │ Our ref: 310200204 190926 Lower North Island Longer-Distance Rolling Stock
Business Case - Amended Draft Final.docx
Page 54
link to page 77 link to page 72 link to page 72 link to page 72
5.2.3 Other Benefits
A public transport vehicle carbon dioxide emissions benefit is also considered as part of the investment
proposal benefit assessment. It is based on an inflation-adjusted 2018/19 EEM CO2 value of $68 per tonne, with
supporting assumptions around electricity and diesel consumption. This provides a 30-year discounted public
transport emission disbenefit of $2.5m over the do-minimum under the DMU option, and a $1.0m disbenefit
over the do-minimum under the DMMU option, based on medium patronage growth and a 4% discount rate.
The emission increase relates to the increase in the number of public transport services over the do minimum,
which counters the per-trip saving.
The investment proposal is likely to provide a wider range of social, economic, environmental and other
benefits, in addition to the direct transport benefits described above. These include accessibility, productivity,
resilience, option and non-use, consumer surplus, and agglomeration and other wider economic benefits.
These benefits wil contribute to and reflect the improved liveability of communities along the corridor, and the
quality of life of their residents, and support the investment case and the broader objectives of the GPS. Most
of these benefits are difficult to accurately quantify and have not been assessed, however, consumer surplus
and agglomeration have been used for sensitivity testing purposes (see Section
5.4.3).
5.3
Costs
1987
The investment proposal cost includes the fol owing cost elements:
•
fare revenue, including SuperGold reimbursement;
•
rail contract passenger service fee costs, which are paid to the Metlink operational contractor (currently
Transdev) and include onboard staff (and drivers after the new units are bought into service);
•
locomotive hire costs, which are paid to KiwiRail and include locomotive crew and fuel costs until the new
units are bought into service (includes a contract termination fee);
•
LGOIMA,
energy costs, which include DMMU electricity and DMU/DMMU diesel fuel
55;
•
network access charges;
•
train maintenance costs, which include planned and unplanned maintenance, and capital heavy
maintenance costs
56;
•
station maintenance costs, which include maintenance, and like for like renewal costs;
under
•
station construction costs, which include station asset upgrade costs and park and ride upgrade costs,
primarily on the Manawatu Line;
•
maintenance facility construction costs, including design and procurement-related costs;
•
network infrastructure construction costs, including passing loops, signalling and stabling yards; and
•
rol ing stock purchase costs, including procurement, design and project management-related costs.
Each four-car set has an estimated undiscounted unit cost of
under the DMU option and
under
the DMMU option, although these costs wil not be confirmed until the procurement and design process has
been completed. This equates to a total cost of
and
respectively for 15 four-car sets.
Released
Procurement, design and project management-related costs are expected to add
and
respectively.
On the infrastructure side, station upgrades are expected to have an undiscounted cost of
maintenance facilities
for the DMU and
or the DMMU, and network infrastructure
57, for a
total estimated infrastructure cost of either
or
over and above current infrastructure
investment requirements. These costs are also subject to confirmation through the procurement and design
process.
55 Based on the electricity rates used in the current network access agreement and diesel discounted retail rates
sourced from MBIE weekly fuel price monitoring figures as at February 2017.
56 Including capital heavy maintenance costs that include S fleet life extension works.
57 Including contingency al owances ranging from 30 to 50%.
26 September 2019 │ Status: Draft │ Project No.: 310200204 │ Our ref: 310200204 190926 Lower North Island Longer-Distance Rolling Stock
Business Case - Amended Draft Final.docx
Page 55
link to page 73 link to page 75 link to page 74
Undiscounted direct project costs consequently total $368.8m under the DMU option and $405.2m under the
DMMU option.
Table 5-4 shows the modelled discounted cost of al DMU cost elements over the do-minimum requirements,
under the low, medium and high patronage growth scenarios described in Sectio
n 5.4.1, assuming a 4%
discount rate, and 30-year evaluation period. These costs account for planned future do-minimum
expenditure that is avoided as a result of the current investment proposal.
Table 5-4: 30-year discounted cost of DMU cost elements over the do-minimum
Cost Element
Low Growth
Medium Growth
High Growth
Costs (2018 $m)
Costs (2018 $m)
Costs (2018 $m)
Fare revenue
Passenger service fee
Locomotive hire
Energy
1987
Network access charges
Train maintenance
Station maintenance
Total operational costs
$74.00
$60.40
$57.60
Station construction
Maintenance facility construction
Network infrastructure construction
LGOIMA,
Rolling stock purchase
Total project capital costs
$199.30
$199.30
$199.30
Total DMU investment proposal costs
$273.30
$259.70
$256.90
under
Table 5-5 shows the expected discounted cost of al DMMU cost elements over the do-minimum requirements,
under the three patronage growth scenarios and the above discount rate and evaluation periods. These
costs account for planned future do-minimum expenditure that is avoided as a result of the current investment
proposal.
Released
26 September 2019 │ Status: Draft │ Project No.: 310200204 │ Our ref: 310200204 190926 Lower North Island Longer-Distance Rolling Stock
Business Case - Amended Draft Final.docx
Page 56
link to page 75
Table 5-5: 30-year discounted cost of DMMU cost elements over the do-minimum
Cost Element
Low Growth
Medium Growth
High Growth
Costs (2018 $m)
Costs (2018 $m)
Costs (2018 $m)
Fare revenue
Passenger service fee
Locomotive hire
Energy
Network access charges
Train maintenance
Station maintenance
Total operational costs
$77.00
$63.30
$60.70
Station construction
1987
Maintenance facility construction
Network infrastructure construction
Rolling stock purchase
Total project capital costs
$227.90
$227.90
$227.90
Total DMMU investment proposal costs
$304.90
$291.20
$288.60
The internal business changes required for GWRC to implement and operate the proposed fleet and service
LGOIMA,
levels have also been assessed and determined to be minimal.
The costs represented in this business case were developed from a range of input sources to ensure their
accuracy. Cost confidence has been assessed using a grading system from the New Zealand Water & Waste
Association (NZWWA) Guidelines for Infrastructure Asset Grading Standards. The standards for each
confidence grade are:
under
•
Grade A - highly reliable: data based on sound records, procedures, investigations and analysis which is
properly documented and recognised as the best method of assessment;
•
Grade B – reliable: data based on sound records, procedures, investigations, and analysis which is
properly documented but has minor shortcomings, for example the data is old, some documentation is
missing and reliance is placed on unconfirmed reports or some extrapolation;
•
Grade C – uncertain: data based on sound records, procedures, investigations or analysis which is
incomplete or unsupported, or extrapolation from a limited sample for which grade A or B data is
available; and
Released
•
Grade D - very uncertain: data is based on unconfirmed verbal reports and/or cursory inspection and
analysis.
The confidence grades for each cost element have been assessed as summarised i
n Table 5-6.
26 September 2019 │ Status: Draft │ Project No.: 310200204 │ Our ref: 310200204 190926 Lower North Island Longer-Distance Rolling Stock
Business Case - Amended Draft Final.docx
Page 57
link to page 77 link to page 85 link to page 75
Table 5-6: Cost confidence
Cost Element
Confidence
Comment
Fare revenue
B - reliable
Based on the current average fare applicable for these
lines and conservative patronage growth forecasts.
Passenger service fee
B - reliable
Based on scaled costs from existing operational contracts.
Locomotive hire
B - reliable
Based on scaled costs from existing operational contracts.
Energy
B - reliable
Based on scaled costs from existing operational contracts.
Network access charges
B - reliable
Based on scaled costs from existing operational contracts.
Train maintenance
B - reliable
Based on scaled costs from existing operational contracts.
Station maintenance
B - reliable
Based on scaled costs from existing operational contracts.
Station construction
C - uncertain
Based on knowledge of the station asset condition north of
Waikanae and the costs experienced in improving the
1987
condition of similar assets
Maintenance facility
C - uncertain
Based on the costs to construct and modify the existing
construction
EMU depot facility. As location of this facility is unknown at
this time, a 50% contingency has been applied.
Network infrastructure
B - reliable
Several concepts for each infrastructure change were
construction
developed, and then detailed costs established for the
preferred concept. Work undertaken by independent
consultant Rail Infrastructure Consultants. A 30%
contingency has been applied to reflect the high-level
LGOIMA,
nature of the design.
Rolling stock purchase
B - reliable
Two separate manufacturers have provided indicative
proposals and costs, which along with other recent
procurement costs, have provided the basis for the rol ing
stock purchase cost, along with the procurement and
project management costs applicable to the recent
under
Matangi projects. A modest 5% contingency has also
been applied.
While there is an element of uncertainty with costs that wil not be resolved until procurement has been
completed, they are based on known costs where possible, and an appropriate contingency has been
applied where uncertainty is greater to ensure that the costs included in this business case are conservative.
The sensitivity tests described in Sectio
n 5.4.3 show that BCRs remain positive even when costs are significantly
higher than projected in this section. If an investment budget to 95% confidence is required, then it is
proposed that an overal contingency of 8% be applied, as described in Section
5.7.
Released
5.4
Economic Analysis
5.4.1 Inputs
The economic assessment is based on the change compared to the do-minimum in accordance with EEM
guidance, and the fol owing assumptions:
•
a 30-year evaluation period from the start of the 2019 financial year, which accounts for one rol ing stock
replacement cycle under both options
58 (i.e. carriages with DMUs or DMMUs) and all associated
infrastructure and service improvements;
58 This evaluation period has been chosen for consistency with the Chapter 4 options selection evaluation period and is
consistent with EEM guidance, which al ows for a standard evaluation period of up to 40 years.
26 September 2019 │ Status: Draft │ Project No.: 310200204 │ Our ref: 310200204 190926 Lower North Island Longer-Distance Rolling Stock
Business Case - Amended Draft Final.docx
Page 58
link to page 65 link to page 70 link to page 72 link to page 77 link to page 33 link to page 76 link to page 76 link to page 76 link to page 76
•
a discount rate of 4%, with sensitivity testing at 2% and 6%, as advised by the NZTA (this is lower than the
standard rates in the EEM, but reflects changes to funding costs that wil be reflected in the procedures in
the near future);
•
the fleet, infrastructure and service change implementation points noted in Section
5.1;
•
the benefit types noted in Sectio
n 5.2; and
•
the cost elements noted in Section
5.3.
Both costs and benefits are sensitive to patronage growth assumptions. On the cost side, the rail contract
passenger service fee costs and fare revenue have a direct link to patronage, while the fuel costs, train
maintenance costs and track access charges have an indirect link, increasing as additional rol ing stock is
brought into service to provide capacity to respond to demand. Al benefits have a direct link to patronage,
except the public transport vehicle carbon dioxide emissions benefit, which has an indirect link that is also
based on rol ing stock use. Three distinct but realistic patronage growth scenarios have therefore been tested:
•
a low patronage growth scenario, which assumes base growth on both lines of 0.6% per annum from the
2026 financial year with lower and fluctuating growth prior to that point
59, reflecting the conservative
forecast growth rates that underpin the preferred option in the Wel ington Metro Railway Network Track
Infrastructure Catch-up Renewals business case;
1987
•
a medium patronage growth scenario, which assumes the same base growth rates as the low patronage
scenario prior to the 2026 financial year, then 1.8% per annum on the Wairarapa Line and 1.2% per annum
on the Manawatu Line, reflecting the expected base patronage impact of projected population growth
on each corridor
60; and
•
a high patronage growth scenario, which assumes the same base growth rates as the low patronage
scenario prior to the 2026 financial year, then 2.7% per annum on the Wairarapa Line and 1.8% per annum
on the Manawatu Line, reflecting a general but conservative continuation of current patronage growth
trends on each corridor
61.
LGOIMA,
Al patronage growth projections are supported by a short run peak service level elasticity of 0.45, increasing
incrementally to 0.75 in the long run, and a short run off-peak service level elasticity of 0.75, increasing
incremental y to 1.25 in the long run. These elasticities are consistent with the international longer-distance
commuter rail experience
62, with the higher off-peak elasticities reflecting the higher uptake that is typical y
available from off-peak improvements, which provide more travel options for existing and new peak and off-
peak passengers and facilitate peak spreading and consequently increase peak capacity. Longer distance
passengers tend to have different travel patterns from urban passengers, travelling less frequently on average,
under
and often only for part days for specific appointments or meetings, so the availability of wel -timed off-peak
services is important to them.
The low patronage growth scenario is unconstrained, in that it does not require spare growth rol ing stock to be
brought into service or for patronage to be capped when capacity is reached. The higher growth scenarios
require al rol ing stock to be brought into service, by the 2043 financial year in the medium growth scenario
and the 2038 financial year in the high growth scenario. The latter scenario also requires the capping of peak
patronage or additional rol ing stock from the 2046 financial year.
5.4.2 Output
Released
Table 5-7 shows the results of the BCR assessment for the DMU investment proposal option under the three
patronage growth scenarios, for the main 4% discount rate and the 2% and 6% tests. The table shows that
the DMU option provides a positive BCR under al growth and discount rate scenarios, with a range of 1.2
to 3.0, indicating that it is expected to provide a positive return on investment. The BCR ranges between
1.5 and 2.3 at the main 4% discount rate. The BCRs are government BCRs, which show the value for money
that the investment provides from a central and local government investment perspective.
59 The base growth rates apply before the service level elasticity effect and patronage uplift associated with new trains.
60 The Wairarapa Line rate is consistent with the Metlink network-wide al -period annual average growth rate of 1.9%
between mid-2009 and mid-2019.
61 The recent four-year average annual peak patronage growth rate is wel above these levels on al lines as noted in
Secti
on 3.1.2. Peak periods account for most patronage at present.
62 See Transfund New Zealand Research Report 248 (Review of Demand Elasticities) by Ian Wal is (2004) and TRL Report
593 (The Demand for Public Transport: A Practical Guide).
26 September 2019 │ Status: Draft │ Project No.: 310200204 │ Our ref: 310200204 190926 Lower North Island Longer-Distance Rolling Stock
Business Case - Amended Draft Final.docx
Page 59
link to page 77 link to page 78
Table 5-7: Results of DMU cost benefit appraisal
Low
Medium
High
Growth
Growth
Growth
2% discount rate
Benefits (present value – 2018 $m)
$545.6
$762.7
$841.6
Net costs (present value – 2018 $m)
$306.7
$287.6
$283.2
Benefit Cost Ratio
1.8
2.7
3.0
4% discount rate
Benefits (present value – 2018 $m)
$399.6
$550.3
$601.5
Net costs (present value – 2018 $m)
$273.3
$259.7
$257.0
Benefit Cost Ratio
1.5
2.1
2.3
6% discount rate
Benefits (present value – 2018 $m)
$300.1
$407.2
$441.1
1987
Net costs (present value – 2018 $m)
$245.9
$236.1
$234.4
Benefit Cost Ratio
1.2
1.7
1.9
Table 5-8 shows the results of the BCR assessment for the DMMU investment proposal option under the three
patronage growth scenarios, for the main 4% discount rate and the 2% and 6% tests, providing government
BCRs similarly to above. The table shows that that option also provides a positive BCR under all growth and
discount rate scenarios, with a range of 1.1 to 2.6, indicating that it is also expected to provide a positive
return on investment. The BCR ranges between 1.3 and 2.1 at the main 4% discount rate.
LGOIMA,
Table 5-8: Results of DMMU cost benefit appraisal
Low
Medium
High
Growth
Growth
Growth
2% discount rate
under
Benefits (present value – 2018 $m)
$547.6
$764.7
$843.6
Net costs (present value – 2018 $m)
$343.0
$324.0
$319.7
Benefit Cost Ratio
1.6
2.4
2.6
4% discount rate
Benefits (present value – 2018 $m)
$401.0
$551.7
$603.0
Net costs (present value – 2018 $m)
$304.7
$291.2
$288.6
Released
Benefit Cost Ratio
1.3
1.9
2.1
6% discount rate
Benefits (present value – 2018 $m)
$301.2
$408.2
$442.1
Net costs (present value – 2018 $m)
$273.4
$263.7
$261.9
Benefit Cost Ratio
1.1
1.5
1.7
5.4.3 Sensitivity Testing
The above assessments do not consider the impact of changes to capital and operational costs, and they
exclude the consumer surplus benefit and agglomeration wider economic benefit of the new services. These
aspects have been used to sensitivity test the BCRs.
Table 5-9 shows the BCR impact of cost sensitivity testing under the 4% discount rate medium growth scenario
at 120%, 100% and 80% of the model ed level of operational and capital costs. The resulting BCR remains
26 September 2019 │ Status: Draft │ Project No.: 310200204 │ Our ref: 310200204 190926 Lower North Island Longer-Distance Rolling Stock
Business Case - Amended Draft Final.docx
Page 60
link to page 78 link to page 79 link to page 78 link to page 78 link to page 78
positive for both options, ranging from 1.7 to 2.9 for the DMU option and 1.5 to 2.6 for the DMMU option.
Table 5-9: Results of cost sensitivity testing with network infrastructure cost included
High
Low
Cost
Cost
DMU
Benefits (present value – 2018 $m)
$550.3
$550.3
Net costs (present value – 2018 $m)
$332.9
$186.6
Benefit Cost Ratio
1.7
2.9
DMMU
Benefits (present value – 2018 $m)
$551.7
$551.7
Net costs (present value – 2018 $m)
$370.7
$211.9
Benefit Cost Ratio
1.5
2.6
1987
Table 5-10 shows the impact on the BCRs of excluding the cost of the network infrastructure improvements
that are needed to restore infrastructure that was previously removed (e.g. reinstatement of sidings), cater for
current freight train lengths (e.g. siding extensions to al ow for current freight train length), or catch up for past
underinvestment (e.g. full signalling system), which are all primarily required to maintain a safe and efficient
dual purpose (freight and passenger) railway network. This reduces the discounted cost by $97.0m and
increases the BCR range significantly to 2.5 to 5.1 for the DMU option and 2.2 to 4.1 for the DMMU option,
under the 4% discount rate medium growth scenario
63.
Table 5-10: Results of cost sensitivity testing with network infrastructure cost excluded
LGOIMA,
High
Low
Cost
Cost
DMU
Benefits (present value – 2018 $m)
$550.3
$550.3
under
Net costs (present value – 2018 $m)
$216.5
$109.1
Benefit Cost Ratio
2.5
5.0
DMMU
Benefits (present value – 2018 $m)
$551.7
$551.7
Net costs (present value – 2018 $m)
$254.3
$134.3
Benefit Cost Ratio
2.2
4.1
Released
Table 5-11 shows the BCR impact of benefit sensitivity testing, by including the consumer surplus and
agglomeration benefits under the 4% discount rate medium growth scenario. The consumer surplus benefit is
based on a long run fares elasticity of -0.6
64 and the average fare on each line. The agglomeration benefit
has been tested at 30% of the modelled level of conventional benefits, based on the findings of the
agglomeration effects of initiatives in Wel ington and other cities
65. In combination, these benefits increase the
BCR by 41%, to 3.0 for the DMU and 2.7 for the DMMU.
63 The benefits associated with these improvements, which are desirable but not essential for the enhanced passenger
operation, have not been included in any of the benefit assessments.
64 See Transfund New Zealand Research Report 248 (Review of Demand Elasticities) by Ian Wal is (2004) and Transport
Elasticities by Todd Litman (2007).
65 Estimates for City Rail Link and the Waitemata Harbour Crossing in Auckland found agglomeration benefits of 33% to
be reasonable, while access improvements for the Leeds City Centre were estimated to have agglomeration benefits
of 25%. A 30% agglomeration estimate has been used for the LGWM programme business case.
26 September 2019 │ Status: Draft │ Project No.: 310200204 │ Our ref: 310200204 190926 Lower North Island Longer-Distance Rolling Stock
Business Case - Amended Draft Final.docx
Page 61
link to page 80 link to page 79
Table 5-11: Results of benefit sensitivity testing
Conventional
Ful
Benefits
Benefits
DMU
Benefits (present value – 2018 $m)
$550.3
$778.6
Net costs (present value – 2018 $m)
$259.7
$259.7
Benefit Cost Ratio
2.1
3.0
DMMU
Benefits (present value – 2018 $m)
$551.7
$780.4
Net costs (present value – 2018 $m)
$291.2
$291.2
Benefit Cost Ratio
1.9
2.7
Limitations of the economic model have prevented sensitivity testing around future changes in the price of
carbon. However, it is expected that a carbon price increase would increase the cost of oil-based fuels,
1987
which would lead to mode shift and increased patronage, particularly for longer distance journeys, and in
turn, increase both road user and public transport user benefits. It would also increase the operational cost of
the diesel-based options, increasing the relative viability of the DMMU and (particularly) EMU options, but this
cost increase is expected to be relatively minor compared to the expect patronage-related impact.
The overall sensitivity testing process reveals that high cost has a similar effect to low growth, and low cost has
a similar effect to high growth or medium growth with full benefits. Taken together, this suggests that a DMU
BCR range of 1.5 to 3.0 is appropriate, and a DMMU range of 1.3 to 2.6 is appropriate if full costs (i.e. including
infrastructure costs) are included. These ranges are taken forward to the assessment profile, given that the
medium and high growth scenarios seem most realistic given recent growth trends, the anticipated effect of
LGOIMA,
the LGWM initiatives on public transport demand general y, and current government transport priorities.
5.5
Assessment Profile
The investment proposal has been assessed against the NZTA’s June 2018 Investment Assessment Framework
66
for the 2018-21 NLTP, given its expected alignment with NLTP investment criteria based on the signals provided
under
in the TAIP and the June 2018 GPS, as noted in Section 2.3. The PGF has similar criteria, which the proposal can
be expected to meet to the same degree if that instrument is used as a funding source.
The NZTA’s Investment Assessment Framework rates a proposal on two factors: results alignment and cost
benefit appraisal. The ratings are then brought together to form an overal assessment profile that determines
a proposal’s priority for NLTP investment. The fol owing sections indicate how this proposal is considered to
meet them.
5.5.1 Results Alignment
Results alignment is an assessment against the outcomes sought from the GPS. There are four rating bands
Released
– Low, Medium, High and Very High – each with criteria that are specific to the activity class. The
investment proposal improvements have been assessed against the public transport, rapid transit and
transitional rail activity class criteria.
Table 5-12 shows the outcome of this assessment, based on the appraisal of the problems, benefits and
investment objectives described in this business case and alignment with the strategic planning
documents outlined in Chapter 2. It indicates that the investment proposal responds strongly to the
outcomes sought by the GPS, with three recommended Medium ratings, nine High ratings and one Very
High rating against thirteen criteria across three of the four results alignment categories. These provide a
recommended overal results alignment rating of Very High.
The Very High recommended rating relates to the ‘enables a substantial increase in access to social and
economic opportunities for large numbers of people along dedicated key corridors and enables transit-
66 The NZTA and MOT are currently reviewing the investment decision making framework and changes are expected to
take effect in late-2019, in time to support the development of the 2021 GPS and subsequent RLTPs and NLTP.
26 September 2019 │ Status: Draft │ Project No.: 310200204 │ Our ref: 310200204 190926 Lower North Island Longer-Distance Rolling Stock
Business Case - Amended Draft Final.docx
Page 62
link to page 37 link to page 41
oriented development’ criterion, which supports the ‘access to opportunities, enables transport choice
and access, and is resilient - liveable cities’ priority. Its selection is based on the significantly improved
access that will be enabled by the investment proposal’s capacity and frequency improvements, both
outside of and within the electrified area, where it will help address the significant network capacity
constraints noted in Sectio
n 3.1.2.3, and improve overal access and connectivity as a result, as noted in
Sectio
n 3.2.1. The investment proposal is also expected to increase the viability of transit oriented
development at the key stations used by the services within the electrified area, where land use
intensification is currently being actively investigated and the longer-distance Wairarapa and Manawatu
services are integral to the overal capacity and service offering.
Table 5-12: GPS results alignment
GPS Priority
Criteria
Alignment
Access to opportunities, • Addresses a significant gap in level of service in
High
enables transport
accessing social or economic opportunities and is
choice and access,
identified in an approved regional economic
and is resilient - thriving
development programme as making a significant
regions
contribution
1987
•
Makes best use of the public transport service
operations in a multi-modal context with land use
•
Addresses significant resilience gap in the public
transport network
•
Addresses an unplanned loss of an existing significant
public funded transport connection.
•
Addresses a significant gap for inter-regional public
Medium
transport.
LGOIMA,
Access to opportunities, • Enables a substantial increase in access to social and
Very High
enables transport
economic opportunities for large numbers of people
choice and access,
along dedicated key corridors and enables transit-
and is resilient - liveable
oriented development.
cities
•
Supports agreed integrated land use, multi-modal
High
under
plans and mode shift in major metros
•
Improves intermodal connectivity where this enhances
the appropriate use of public transport
•
Makes best use of the public transport service
operations and connection to other services
•
Addresses significant risk to continued operation of the
public transport network.
Released
•
Addresses a significant gap in level of service in
Medium
accessing social or economic opportunities and is
identified in an approved programme.
Environment - reduce
•
Enables long term reductions in greenhouse gas
High
adverse effects on the
emissions from land transport.
climate, local
environment and public •
Medium
health
Enables significant reductions in harm to the
environment and people, particularly arising from land
transport-related air pol ution and noise.
5.5.2 Cost Benefit Appraisal
The Investment Assessment Framework classifies BCR ratings into four bands – Low (1.0 to 2.9), Medium (3.0 to
4.9), High (5.0 to 9.9), and Very High (10 and above). The investment proposal has a DMU BCR range of 1.5 to
26 September 2019 │ Status: Draft │ Project No.: 310200204 │ Our ref: 310200204 190926 Lower North Island Longer-Distance Rolling Stock
Business Case - Amended Draft Final.docx
Page 63
link to page 77 link to page 19 link to page 77 link to page 81
3.0 and a DMMU BCR range of 1.3 to 2.6 as recommended in Section
5.4.3, and it is therefore classified as
being in the Low band under both options
67. This essential y defines both options as being the same from an
Investment Assessment Framework perspective. Al BCRs except that assessed for the DMU very high growth
and low discount rate scenario fal within this classification, confirming it as appropriate.
The recommended results alignment rating of Very High and cost benefit appraisal rating of Low or above
give the investment proposal a priority order rating of 1 in the improvement activity scale of 1 to 8, which is the
highest priority for NLTP funding. The final assessment profile and funding approval is subject to the NZTA’s
funding approval process.
5.6
Commercial Case
5.6.1 Procurement and Contractual Arrangements
5.6.1.1
Existing Services
Wairarapa Line services are currently operated by Transdev under contract to GWRC, using a mixed fleet of
GWRC-owned rol ing stock, with Hyundai Rotem providing rol ing stock maintenance and KiwiRail providing
locomotives and locomotive crews through a hook and tow arrangement, as noted in Sectio
n 2.1.1. This
1987
arrangement wil continue while existing rol ing stock remains in operation.
Manawatu Line services are currently commercial y operated by KiwiRail as noted in Section 2.1.2, and may
continue to be operated in this way while existing rol ing stock remains in operation.
5.6.1.2
Capital Investment
LGOIMA,
5.6.1.2.1 Rolling Stock and Maintenance Facility Procurement
Rol ing stock and maintenance facility procurement wil be undertaken by GWRC in accordance with the
NZTA’s and the council’s internal procurement policies. A detailed Procurement Strategy Overview wil be
developed, with the following likely content:
under
•
Introduction
o
Background
o
Objectives of This Document
o
Procurement Documents
o
Project Timescale
•
Procurement Process – Issues and Risks
o
General Released
o
Key Risks and Issues
•
Contract Approach
o
General
o
Conventional Contract
o
Alliance Contract
o
Adoption of Conventional Contract Approach
•
Whole Life (Cycle) Issues – Effect on Procurement Process and Contract Approach
o
General
67 The top end of the DMU range would also qualify it for a Medium rating. The ratings move to Medium to High (DMU)
and Medium (DMMU) if the cost of network infrastructure is excluded (see Sectio
n 5.4.3).
26 September 2019 │ Status: Draft │ Project No.: 310200204 │ Our ref: 310200204 190926 Lower North Island Longer-Distance Rolling Stock
Business Case - Amended Draft Final.docx
Page 64
link to page 42 link to page 65 link to page 19
o
Key Requirements
o
Contract Options
o
Context Issues
o
Greater Wellington Regional Council’s Approach
•
Procurement Process
o
General
o
Pre-Tender Market Investigations
o
Procurement Phase 1 - Expressions of Interest and Prequalification (EOI)
o
Procurement Phase 2 - Request for Tenders
•
Other Issues
o
Local Industry Involvement
o
Tender Assessment Team
o
Probity.
1987
Prior to commencing the rol ing stock procurement process, GWRC wil assess a range of contracting options,
including Design-Build, Design-Build-Maintain, Design-Build-Finance, etc. GWRC wil also consider the scope,
interaction and interdependencies for existing and future rail operating and maintenance contracts.
It is envisaged that rol ing stock procurement wil be competitively tendered and fol ow a similar procurement
process to that successful y used for EMU procurement over the last decade. During the initial EMU
procurement in mid-2000’s, GWRC received expressions of interest from approximately 10 companies, and
expects a similar level of interest from the international market given the similar proposed order size, including
the fol owing manufacturers: Hyundai-Rotem – South Korea, CRRC - Changchan Railway Vehicle Company -
LGOIMA,
China, Bombardier - Australia, Downer - Australia, Stadler - Switzerland, and Construcciones y Auxiliar de
Ferrocarriles (CAF) Spain. GWRC is intending to again to undertake a two-stage procurement process (i.e. EOI
and RFT).
In addition to the proposed procurement of 60 cars (15 – 4 car sets), it may be possible to jointly procure the
new rol ing stock with other regions, as noted in Section
s 3.2.4 an
d 5.1.1, which would offer value for money
benefits through improved economies of scale. The proposed start-up Hamilton-Papakura service wil use a
under
locomotive-hauled carriage fleet, but investigations into higher-speed longer-term replacement options are
about to commence and it may be possible to align requirements. Opportunities for coordination with other
regions like this will be explored during the specification stage.
Existing rol ing stock wil require overhaul to remain in operation at an appropriate standard until 2025-26
replacement. Light refurbishment of the SW and SE fleets wil shortly commence as part of GWRC’s business as
usual programme, as noted in Sectio
n 2.1.1. The life extension work required to enable operation of the S fleet
beyond mid-2021 is dependent on confirmation of funding through this business case, and contractual and
funding agreement between the parties, and is likely to be carried out by KiwiRail through an intra-company
procurement arrangement.
Released
5.6.1.2.2 KiwiRail Network Infrastructure Improvements
KiwiRail wil fol ow its own procurement and project management processes for network infrastructure
improvements. It is expected that physical works wil be undertaken using KiwiRail resources where applicable,
and competitively tendered following a similar approach to that used for the delivery of the Wel ington Metro
Upgrade Programme (WMUP). The WMUP is delivering the improvements identified in the Wel ington Metro
Network Track Infrastructure Catch-up Renewals and Unlocking Network Capacity and Resilience business
cases. Significant synergies may be gained by aligning delivery of the infrastructure required by this business
case with that scheduled for the WMUP, which wil be delivered over a similar period, particularly on the
Wairarapa Line where major works are required to support this business case (sidings and signal ing) and the
Track Infrastructure Catch-up Renewals business case (track and bridge renewals).
5.6.1.3
Long-Term Maintenance and Operation
The new rol ing stock fleet wil be owned by GWRC through its Greater Wel ington Rail Ltd subsidiary.
Maintenance wil be provided either directly by the manufacturer (i.e. through a design-build-maintain or
26 September 2019 │ Status: Draft │ Project No.: 310200204 │ Our ref: 310200204 190926 Lower North Island Longer-Distance Rolling Stock
Business Case - Amended Draft Final.docx
Page 65
link to page 85 link to page 83 link to page 87
build-maintain contract) or through a variation to the existing Operator Maintenance Partnering Contract.
Services on both corridors are likely to be operated by Transdev as part of the Metlink network under the
existing Wellington rail contract, which commenced in mid-2016 and runs for fifteen years.
Manawatu Line services are likely to be incorporated into the Wel ington rail contract when the existing rol ing
stock is replaced by the DMU/DMMU fleet, to provide the operational flexibility and efficiencies sought by this
business case. This will require GWRC to include Manawatu Line services south of the regional boundary in the
existing rail service unit in its RPTP, and for HRC to define a corresponding rail service unit covering Manawatu
Line services north of the regional boundary in its RPTP, to meet the requirements of the LTMA and provide a
funding and procurement mechanism. A formal agreement between the councils wil cede responsibility for
Manawatu Line services within the Horizons Region to GWRC and define the al ocation of operating costs
between the councils (see Sectio
n 5.7).
5.6.2 Risk Management
The key identified risks of the investment proposal are summarised i
n Table 5-13 below, along with their expected
probability, impact and rating, and an associated response. The rating is based on a simple risk matrix with a
nine-point scale, where high probability high impact risks have a score of 1 and low probability low impact risks
have a score of 9, and scores of 1-3 are deemed unacceptable, 4-6 undesirable, and 7-9 acceptable.
1987
Table 5-13: Key risks
Risk
ility
Comment
b
ct
a
a
ting
ob
Imp
Ra
Pr
The new rol ing stock is
Low
High
4
A four-year lead time is required to enable the
not ready by the 2025
specification, procurement, design, construction
LGOIMA,
financial year and
and delivery of the new rol ing stock fleet, requiring
delays subsequent
funding confirmation by the end of the 2020
service improvements
financial year (see Section
5.8). This wil require
prompt funding decision making by the investment
partners, timely procurement and design decisions,
and good project management, so that the new
rol ing stock can be introduced into service when
under required.
Failure to meet the deadline and provide the
required capacity on the Wairarapa Line and to
support the electrified network wil lead to a
significant reduction in service quality and
discontent and mode shift from passengers, which
wil in turn increase congestion and undermine
access and economic growth. Additional
investment may also be required for further life
extension of the carriage fleets.
Released
Supporting
Low
High
4
There is enough time to design, procure and
infrastructure is not
construct the required infrastructure within the
ready when required to
available timeframe, so this timeframe risk is
support the introduction
general y low, although it is reliant on similar factors
of the new rol ing stock
to above. However, service improvements are also
dependent on completion of the WMUP
improvements, particularly the Track Infrastructure
Catch-Up Renewals, Upper Hutt-Trentham double-
tracking and Wellington Station improvements
projects. Their prompt completion is therefore also
very important.
Public funding support is
Low
High
4
The key investment partners (GWRC, HRC and
not confirmed by al
NZTA) have participated in the development of this
investment partners
business case and previous assessments of both
corridors and recognise the need for further
26 September 2019 │ Status: Draft │ Project No.: 310200204 │ Our ref: 310200204 190926 Lower North Island Longer-Distance Rolling Stock
Business Case - Amended Draft Final.docx
Page 66
investment to address the problems. Al wil
consider the financial implications of the investment
against their own priorities before committing
financial support, particularly in relation to future
service enhancements. It would not be
appropriate for investment proposal to proceed
without suitable contributions from both regional
councils relative to the benefit provided within their
jurisdiction, and from national level funding sources
to reflect the wider national benefit. Agreement on
appropriate contractual and funding arrangements
for the existing Manawatu Line service is important
to enable its continued operation until the rol ing
stock is replaced.
KiwiRail wishes to
Low
High
4
Increased service capacity and operational
continue operating the
flexibility are key investment objectives for this
Capital Connection as
business case. Both would be undermined by the
a stand-alone service
continued operation of a stand-alone service on
the Manawatu Line, so such an outcome would be
1987
undesirable, particularly if such a service continued
to receive public funding support.
LGOIMA,
Operating and/or
Med
Med
5
Operating and capital cost forecasts for existing
capital costs are higher
services are based on the current contract
than projected
provisions (Wairarapa Line) and forecasts provided
by KiwiRail (Manawatu Line).
Longer-term costs are based on detailed analysis
by GWRC (rol ing stock and stations) and
investigation by RIC (network infrastructure). These
under are subject to further confirmation through the
design and procurement process, but conservative
capital costs have been deliberately used to al ow
for a higher than anticipated cost and/or higher
specification. Operating costs are closely linked to
patronage and wil be higher when patronage and
revenue are higher and lower when they are lower,
reducing relative operating cost risk.
Scenario testing shows that low growth DMU and
DMMU BCRs remain positive if costs are 35% and
Released
25% higher than anticipated respectively. This
increases to 80% and 65% higher under the medium
growth scenario, and 90% and 75% higher under
the high growth scenario.
Patronage grows at a
Low
Med
7
The high-growth nature of both corridors and
slower rate than
recent growth trajectory support the use of the high
anticipated, resulting in
patronage growth projection. However, the BCRs
lower revenue and
remain positive if patronage growth is at the
reduced benefits
medium growth projection and at the conservative
low growth projection.
Economies of scope are likely to result from
incorporating Manawatu Line operation into the
Metlink operation and can be expected to drive
further patronage and revenue through better
marketing and coordination of services on that line,
26 September 2019 │ Status: Draft │ Project No.: 310200204 │ Our ref: 310200204 190926 Lower North Island Longer-Distance Rolling Stock
Business Case - Amended Draft Final.docx
Page 67
link to page 26 link to page 85 link to page 31
potential y driving much stronger growth than
projected.
DMMU dual-mode
Low
Low
9
Dual mode DMMU rol ing stock is new to New
technology causes
Zealand, although relatively common overseas.
implementation
Care wil need to be taken to ensure that
problems
adequate training is given to operating and
maintenance personnel to ensure that this
implementation risk is mitigated.
Risk will be allocated to the party that is best able to manage that risk, through existing contractual
mechanisms in relation to operations and maintenance, and in accordance with an appropriate contractual
risk al ocation method in relation to rol ing stock and infrastructure procurement.
5.7
Financial Case
The investment proposal wil require co-investment from GWRC, HRC, the NLTF through the NZTA, and
potential y the Crown through PGF, with GWRC as the lead organisation. It is identified in both regions’
RLTPs as noted in Sectio
n 2.2.3, and as a significant activity in the 2018 programme update to the 2015
1987
Wel ington RLTP, with Wairarapa Line service and capacity enhancements (including associated rolling
stock) being al ocated to Priority Band 1 (the highest priority) and Manawatu Line improvements being
al ocated to Priority Band 2. Currently, no project funding is al ocated by either region within the current
2018-21 NLTP, other than contribution to the continued short-term operation of the Capital Connection.
Table 5-14 summarises the key capital investment components for each option over the implementation
period between the 2021 financial year and the 2026 financial year, both without and with an additional
contingency that provides 95% confidence in costs.
Table 5-14: Capital investment components without and with additional contingency
LGOIMA,
DMU
DMMU
Expected
Contin-
95th
Expected
Contin-
95th
Estimate
gency
Percentile
Estimate
gency
Percentile
Estimate
Estimate
Rolling stock
10%
10%
under
Maintenance facility
10%
10%
Stations
5%
5%
Network infrastructure
$120.3m
5%
$126.3m
$120.3m
5%
$126.3m
Capital Connection capex
0%
0%
Total capital funding
$379.0m
8%
$409.3m
$415.3m
8%
$449.2m
Some or al costs are likely to be co-funded from the NLTF through the Public Transport activity class, and/or
Released
the Transitional Rail activity class (or its replacement), for which Wellington regional and inter-regional rail
investment is specifical y highlighted. Some or al could also be funded through the PGF, given the
alignment with its requirements noted in Sectio
n 2.3.4 and the key role that rail plays in the transport
network linking Wairarapa and Manawatu with Wel ington as noted elsewhere in this business case. There
is a particularly strong case for PGF funding of the required network infrastructure, which supports both
improved passenger and improved freight services, the latter generating productivity increases for the
target forestry sector in addition to the tourism and other benefits provided by the improved passenger
services.
The following national-local funding share of the capital investment components is proposed (assuming
NLTF investment:
•
Rolling stock, maintenance facility and stations improvements: A special
FAR, which is consistent
with the FAR applied previously under the Matangi funding model. This reflects the large share of
benefits that accrue to wider society (i.e. central government) from the proposed investment,
26 September 2019 │ Status: Draft │ Project No.: 310200204 │ Our ref: 310200204 190926 Lower North Island Longer-Distance Rolling Stock
Business Case - Amended Draft Final.docx
Page 68
link to page 70 link to page 77 link to page 86 link to page 85 link to page 87 link to page 86
including the congestion, safety, environmental, and health
68 benefits described in Sectio
n 5.2, which
col ectively account for around 84% of al conventional benefits.
•
Capital Connection rolling stock: A
FAR from the Transitional Rail activity class for the capex
required to refurbish KiwiRail’s Capital Connection S type carriage fleet and enable continued
operation until the GWRC-owned DMU/DMMU fleet arrive.
•
Network infrastructure: A
FAR, on the basis that this investment is primarily needed to restore
infrastructure that was previously removed, cater for current freight train lengths, or catch up for past
underinvestment, and is primarily required to maintain a safe and efficient dual purpose railway
network as described in Section
5.4.3. This reflects the wider national interest in ensuring that network
infrastructure capacity and resilience is provided at an appropriate standard to enable enhanced
passenger and freight operations on a growth corridor. The proposed FAR is consistent with that
provided for state highway infrastructure.
As indicated in
Table 5-15,
wil be required within the current 2018-21 NLTP to support the DMMU
project. This consists of:
•
to enable procurement of rolling stock to commence to achieve contract signing by June 2021;
and
1987
•
to ensure that the Capital Connection rol ing stock can remain in service beyond June 2021.
Table 5-15: DMMU capital investment cash flow
Proposed
Total Project Capital Investment Cash Flow
FAR Rate
2020/21
2021/22
2022/23
2023/24
2024/25
2025/26
Rolling stock,
90%
maintenance facility
and stations
LGOIMA,
KiwiRail network
100%
-
-
-
-
infrastructure
upgrades
Capital Connection
100%
-
-
-
rolling stock
under
Total
The GWRC-Horizons funding share of rol ing stock, maintenance facility and station capital costs is
proposed at approximately 86% to 14% respectively. The proposed split reflects vehicle service kilometres
by region and the benefit provided by the share of service within each region.
Table 5-14 summaries the
DMMU loan repayment cashflow and funding split, based on the assumptions of the proposed FAR split
noted above, 4.9% interest rate, 10-year repayment period for the Capital Connection Capex, and 30-year
repayment period for al other capital investments. The DMU cash flow and funding split breakdown is
similar, but with 13% lower project costs than those shown for the DMMU.
Released
Table 5-16: DMMU loan repayment cashflow and funding split
2020/21
2021/22
2022/23
2023/24
2024/25
2025/26
2026/27
NZTA
GWRC
HRC
Total
The national-local funding share of the operational investment is proposed at the regional councils’
standard FAR rate, which is currently 51% for both councils.
Table 5-17 summarises the resulting DMMU
68 The health benefit is regarded as a public transport user benefit, but its value actual y accrues to the health system.
26 September 2019 │ Status: Draft │ Project No.: 310200204 │ Our ref: 310200204 190926 Lower North Island Longer-Distance Rolling Stock
Business Case - Amended Draft Final.docx
Page 69
operational cash flow and funding split over the implementation period, excluding Capital Connection
operational costs. Appendix D provides a ful breakdown of these costs over the ten-year period ending in
the 2029 financial year.
Table 5-17: DMMU change in operational costs (revenue, operating/maintenance/renewal costs)
2024/25
2025/26
2026/27
2027/28
2028/29
2029/30
2030/31
NZTA
-
GWRC
HRC
Total
The proposed capital investment FAR contribution ensures that the regions have sufficient ‘skin in the
game’, since both regional transport rates and fares wil need to increase to contribute to the investment
cost. The proposed FAR contribution will minimise this increase and consequently maximise the patronage
and associated benefits impact of the investment. A low level of central government funding support
1987
would necessitate large fare increases, which would counter much of the demand and therefore reduce
the benefits delivered. Indicative calculations show that GWRC would need to increase regional transport
rates by at least 1.1% and rail fares by at least 2.7% under the proposed FAR regime. If the standard 51%
FAR was be applied to capital investment instead of the proposed FARs, GWRC’s regional transport rates
would need to increase by 3.6% and overal rail fares by 8.7%. It is reasonable to assume that this level of
fare increase would significantly impact the forecast patronage growth, and hence benefit realisation.
5.8
Management Case
5.8.1 Project Management
LGOIMA,
GWRC wil lead implementation of the investment proposal, which wil be overseen by joint GWRC-HRC
governance group and GWRC’s Project Management Office. There are several reasons for GWRC being the
lead agency: (1) GWRC has considerable experience managing rail operations, (2) GWRC wil operate the
bulk of the new DMU/DMMU fleet on Wairarapa Line services, (3) GWRC has existing maintenance facilities in
Wel ington that wil be expanded to support the new trains, and (4) operating the services are part of the
under
Metlink network wil leverage the best coordination and efficiencies.
A GWRC project team wil be responsible for day to day project management, including detailed project
management and risk planning, and provide oversight of rol ing stock and infrastructure specification and
design, construction and implementation. This team wil contract professional service expertise as required to
provide specialist input, particularly during the rol ing stock specification and design process, and engage
directly with the key implementation partners: HRC, KiwiRail, Transdev, and once confirmed, the rol ing stock
manufacturer and the maintenance provider.
KiwiRail wil be responsible for network-related infrastructure improvements in accordance with the
Metropolitan Rail Operating Model. Significant synergies may be gained by aligning delivery of the
Released
infrastructure required by this business case with that scheduled for the WMUP as noted in Section 5.6.1.2, and
it may be appropriate to manage delivery of the required network improvements as an extension of the
WMUP programme.
Service changes wil be managed by GWRC and Transdev through existing mechanisms, separately from
(although dependent on) the rol ing stock and infrastructure development process.
5.8.2 Key Milestones
A minimum four-year lead time is required to enable DMU/DMMU specification, procurement, design,
construction and delivery. Funding wil therefore need to be confirmed by the end of the 2020 financial
year (June 2020) to enable this process to commence and ensure that the delivery of the new rol ing stock
begins early in the 2025 financial year and is completed by the end of that year, as required to enable
service levels to be improved at the beginning of the 2026 financial year. A similar timeframe is required
for the specification, design, procurement and construction of supporting network infrastructure, station
26 September 2019 │ Status: Draft │ Project No.: 310200204 │ Our ref: 310200204 190926 Lower North Island Longer-Distance Rolling Stock
Business Case - Amended Draft Final.docx
Page 70
link to page 88 link to page 59
facility and maintenance facility upgrades, with the later needing to be completed prior to the delivery of
the rol ing stock and the remainder required prior to the introduction of service improvements.
Table 5-18 outlines the key milestones that wil form the basis of the project plan. The completion dates are
indicative only and subject to further project planning and subsequent specification and design processes.
Table 5-18: Key milestones
Key Milestone
Indicative Date
Formal submission of a funding proposal to the NZTA
December 2019
Confirmation of funding and partnering arrangements
June 2020
Formal project inception
July 2020
DMU/DMMU specification and tender development completed
December 2020
DMU/DMMU tender process completed
June 2021
S fleet life extension completed
June 2022
Infrastructure design and procurement completed
June 2022
1987
DMU/DMMU maintenance facility completed
June 2024
Initial DMU/DMMU delivery completed
July 2024
Introduction of DMU/DMMU rolling stock on existing Manawatu Line services
October 2024
Introduction of DMU/DMMU rolling stock on existing Wairarapa Line services
January 2025
Final DMU/DMMU delivery completed
May 2025
Network infrastructure improvements completed
June 2025
Manawatu Line station and park and ride upgrades completed
June 2025
LGOIMA,
Service level improvements commence
July 2025
5.9
Conclusion and Final Recommendation
The investment proposal entails the replacement of al existing longer-distance rail rol ing stock with a fleet of
under
15 four-car DMUs or DMMUs, which wil be owned by GWRC and enter service in the 2025 financial year. The
new rol ing stock wil operate all services on the Wairarapa and Manawatu lines, which wil run at improved
frequencies to provide better access and capacity between Masterton/Palmerston North and Wel ington,
including at key stations within the electrified area. Supporting improvements wil be made to maintenance
facilities, stations and network infrastructure. Existing rol ing stock wil be maintained in acceptable operating
condition until the introduction of the new rol ing stock and then be retired.
The DMMU option is the primary preferred and recommended option due to its better alignment with the
investment objectives and key success factors as described in Section
4.3.2. A detailed assessment has
found that this has:
Released
•
medium growth 30-year discounted benefits of $551.7m compared to costs at the same level of
$291.2m, and a projected BCR range of 1.3 to 2.6 (compared to a DMU BCR range of 1.5 to 3.0); and
•
a higher BCR range of 2.2 to 4.1 (compared to a DMU BCR range of 2.5 to 5.1) if the cost of network
infrastructure, which is required to restore infrastructure that was previously removed and catch up for
past underinvestment, is excluded.
Assessment against the NZTA’s 2018-21 Investment Assessment Framework gives a results alignment rating
of Very High and a BCR rating of Low, which give both options a priority order rating of 1, the highest
priority for NLTP funding. The Very High rating relates to the ongoing improvement in access that the
investment proposal enables for large numbers of passengers on the Wel ington region’s main northern
corridors.
GWRC would lead implementation and be responsible for procuring the new DMMU rol ing stock fleet and
station-related infrastructure improvements, along with overal programme management. GWRC would also
26 September 2019 │ Status: Draft │ Project No.: 310200204 │ Our ref: 310200204 190926 Lower North Island Longer-Distance Rolling Stock
Business Case - Amended Draft Final.docx
Page 71
be responsible for long-term operation of services on both lines, including Manawatu Line services, which
would be incorporated into its existing rail contract and operated on behalf of HRC north of the regional
boundary. KiwiRail would be responsible for network-related infrastructure improvements in accordance with
the Metropolitan Rail Operating Model. Key risks around timeframe, funding, KiwiRail’s commercial interests,
costs and revenue would be managed through the project management process and contractual
mechanisms.
The investment proposal includes project capital expenditure of $415.3m, with a
confidence estimate of
$449.2m. It is proposed that network infrastructure wil be funded by the NZTA at a
FAR, rol ing stock,
maintenance facility and station improvements receiving a
targeted enhanced FAR, and ongoing
maintenance and operations receiving a standard
FAR. Cost and revenue will be shared between
GWRC and HRC based on the share of vehicle service km in each region. An urgent funding decision is
required to enable the specification and procurement process to commence in mid-2020 and ensure that
sufficient capacity is in place when required to meet projected demand pressures, given the long lead times
for rol ing stock and supporting infrastructure.
In conclusion, the investment proposal has been shown to clearly respond to significant problems and offer
significant benefits to the lower North Island. These link closely with national transport and economic
development priorities and provide a strong case for investment. It is therefore recommended that
1987
investment decision makers:
•
approve this proposal to replace existing Wellington longer-distance rail rol ing stock with a fleet of 15 four-
car dual-mode DMMU units, and associated infrastructure and service enhancements;
•
approve funding through appropriate channels at appropriate FAR rates by June 2020; and
•
prioritise these approvals, to al ow project planning to commence and enable the new rol ing stock to be
brought into service in the 2025 financial year and service improvements to be implemented the fol owing
financial year.
LGOIMA,
under
Released
26 September 2019 │ Status: Draft │ Project No.: 310200204 │ Our ref: 310200204 190926 Lower North Island Longer-Distance Rolling Stock
Business Case - Amended Draft Final.docx
Page 72

Appendices
1987
LGOIMA,
under
Released
Page 57 Page 0
Appendix A Investment Logic Map
1987
LGOIMA,
under
Released
26 September 2019 │ Status: Draft │ Project No.: 310200204 │ Our ref: 310200204 190926 Lower North Island Longer-Distance Rolling Stock
Business Case - Amended Draft Final.docx
1987
LGOIMA,
under
Released
26 September 2019 │ Status: Draft │ Project No.: 310200204 │ Our ref: 310200204 190926 Lower North Island Longer-Distance Rolling Stock
Business Case - Amended Draft Final.docx
Appendix B Benefits Realisation Plan
1987
LGOIMA,
under
Released
26 September 2019 │ Status: Draft │ Project No.: 310200204 │ Our ref: 310200204 190926 Lower North Island Longer-Distance Rolling Stock
Business Case - Amended Draft Final.docx
1987
LGOIMA,
under
Released
26 September 2019 │ Status: Draft │ Project No.: 310200204 │ Our ref: 310200204 190926 Lower North Island Longer-Distance Rolling Stock
Business Case - Amended Draft Final.docx
Appendix C Summary of Long List Options
1987
LGOIMA,
under
Released
26 September 2019 │ Status: Draft │ Project No.: 310200204 │ Our ref: 310200204 190926 Lower North Island Longer-Distance Rolling Stock
Business Case - Amended Draft Final.docx
Summary of long list options including rationale for discounting
Option Description
Assessment
Mode and Fleet Options (shortlisted options highlighted)
1
Discontinue longer distance rail service – i.e. people use private cars to
Similar option assessed as part of Palmerston North-Wellington Rail
access electrified rail network – increased park and ride facility required,
Passenger Business Case and determined not to be viable
and improved road network
2
Discontinue longer distance rail service – encourage a commercial bus
Similar option assessed as part of Palmerston North-Wellington Rail
1987
service to connect to electrified network
Passenger Business Case and determined not to be viable
3
Life extend current Wairarapa fleet – cease Manawatu Line
Take forward as do minimum, Option 1 going forward
4
Refurbish Manawatu and Wairarapa fleets
Wil not address growth
5
Refurbish Manawatu and Wairarapa fleets and buy additional carriages
Include as an option – Option 2 going forward
(for example SA trains from Auckland)
6
Existing locomotives and new carriages
Overal journey time be longer than a multiple unit option, locomotive
hauled trains are also less operational y efficient (time to turn services),
and less flexible (require infrastructure like turntable to turn locomotive)
LGOIMA,
7
New locomotive and new carriages
Similar issues to option above, however flexibility could be improved with
a double cab locomotive
8
New locomotive and refurbished carriages
Similar issues to the above two options
9
Full bus replacement on Manawatu Line
Similar option assessed as part of Palmerston North-Wellington Rail
under Passenger Business Case, and determined not to be viable
10
Bus feeders into existing electrified network on Manawatu and Wairarapa Similar option assessed as part of Palmerston North-Wellington Rail
Passenger Business Case and determined not to be viable
11
Extend electrification to Featherston/Levin, buy new EMUs and provide
Include as an Option for assessment – Option 3 going forward
bus connections north of those points
12
Buy new DMUs
Included as an Option for assessment – Option 4 going forward
13
Buy new Dual Mode trains
Included as an Option for assessment – Option 5 going forward
14
Full electrify to Masterton and Palmerston North and new EMUs
Included as an Option for assessment – Option 6 going forward
Released
15
Buy new high-speed train
Not included as perceived to be cost prohibitive, and technical y
challenging for New Zealand rail environment
26 September 2019 │ Status: Draft │ Project No.: 310200204 │ Our ref: 310200204 190926 Lower North Island Longer-Distance Rolling Stock Business Case - Amended Draft Final.docx
16
Buy new LRT vehicles
Light rail vehicles are not able to co-operate on the rail network with
heavy rail (freight trains), so would require significant investment in
creating a parallel light rail network – perceived no benefit.
Service Level Options (shortlisted options highlighted)
1
Keep current service pattern
Would be unlikely to meet demand – reduced mode share. Used as base
option in assessment
2
Keep current service pattern – but trains longer in the peak (more trains
While would provide increased capacity, does not provide customer
1987
and platform extensions)
flexibility and convenience
3
Increase peak services only
Provide capacity in the peak and focus on customers working a typical 9-
5 job – would not provide flexibility for other travel options (i.e. half days),
does not cater for tourism and other activities, and conflicts with strong
desire from communities to increase off peak and weekend services
4
Increase both peak and off-peak service frequencies
Service offering included in Option 2 – 6 for further assessment
5
Shuttle services in peak
Does not provide increased capacity within the electrified area, which is
already approaching capacity
LGOIMA,
6
Shuttle services in off peak
While possible, it does not provide as good of a customer experience, as
requires people to change services – do not see significant
savings/benefits with this option
7
Shuttle services in peak and off peak
Does not provide increased capacity within the electrified area, which is
already approaching capacity
8
Change land use policy to reduce demand and need for longer distance Does not align with strategic objectives
under
transportation
9
Change fares to reduce demand and need for longer distance
Does not align with strategic objectives
transportation
Released
26 September 2019 │ Status: Draft │ Project No.: 310200204 │ Our ref: 310200204 190926 Lower North Island Longer-Distance Rolling Stock Business Case - Amended Draft Final.docx
Appendix D Investment Cash Flow
1987
LGOIMA,
under
Released
26 September 2019 │ Status: Draft │ Project No.: 310200204 │ Our ref: 310200204 190926 Lower North Island Longer-Distance Rolling Stock
Business Case - Amended Draft Final.docx
Capital and operating cost cashflow and funding split for the ten years ending in the 2030 FY (2019 $m)
2020/21
2021/22
2022/23
2023/24
2024/25
2025/26
2026/27
2027/28
2028/29
2029/30
Project cashflow funding
KR Network base network upgrade project
-
-
-
-
-
-
-
-
capex
1987
Rolling stock, maintenance facility & station
-
-
-
-
project capex
Capital Connection Capex
-
-
-
-
-
-
Total
$
-
-
-
Loan repayments contributions
NZTA (other funder) loan repayments
LGOIMA,
GWRC loan repayments
HRC loan repayments
Total loan repayment
under
Change in opex + capex (renewal)
contributions (excluding loan repayments and
Capital Connection)
Change in NZTA opex + capex (renewal)
-
-
-
-
-
Change in GWRC opex + capex (renewal)
-
-
-
-
Change in HRC opex + capex (renewal)
-
-
-
-
Total loan repayment
-
-
-
-
Released
26 September 2019 │ Status: Draft │ Project No.: 310200204 │ Our ref: 310200204 190926 Lower North Island Longer-Distance Rolling Stock Business Case - Amended Draft Final.docx
 Wellington
Level 13, 80 The Terrace
Wel ington 6011
PO Box 13-052, Armagh
Christchurch 8141
Tel +64 4 381 6700
Please visi
t www.stantec.com to learn more about how
Stantec design with community in mind.
1987
LGOIMA,
under
Released
Document Outline