 Report on possible government measures to encourage
the uptake of electric vehicles
Contents
Report on possible government measures to encourage
the uptake of electric vehicles
Contents
Purpose of report ................................................................................................................................ 2
Useful terms ........................................................................................................................................ 2
Transport greenhouse gas emissions in New Zealand ....................................................................... 3
Percentage fuel used on the roads in New Zealand (2013)................................................................ 3
The New Zealand vehicle fleet: challenges to growing the market for electric vehicles ..................... 4
Electric vehicles in New Zealand – policies and uptake ..................................................................... 5
Current projections for electric vehicle uptake .................................................................................... 6
What are the opportunities and barriers for electric vehicles? ............................................................ 7
Criteria used to assess potential measures ........................................................................................ 9
Measures that we recommend be investigated further for inclusion in a package ........................... 10
Measure 1: Energy Efficiency and Conservation Authority (EECA) information and promotion
campaign ....................................................................................................................................... 10
Measure 2: Government support for charging infrastructure ......................................................... 12
Measure 3: Government fleet procurement of electric vehicles .................................................... 14
Measures that could be investigated further ..................................................................................... 17
Measure 4: An electric vehicle programme to co-fund initiatives with other parties ...................... 17
Measure 5: Electric vehicles in bus and transit lanes.................................................................... 19
Measure 6: Road User Charges (RUC) exemptions and discounts for electric vehicles .............. 22
Measure 7: Fringe benefit tax on electric and hybrid vehicles ...................................................... 26
Measure 8: Tax depreciation rates for electric vehicles ................................................................ 28
Measures to be progressed outside of the package ......................................................................... 29
Measure 9: Amending ACC levies for plug-in hybrid electric vehicles (PHEVs) ........................... 29
Measure 10: A Road User Charges (RUC) rate for plug-in hybrid electric vehicles (PHEVs) ....... 31
Measure 11: Removing battery import duties................................................................................ 32
Measure 12: A feebate scheme to encourage purchase of low emission vehicles ....................... 33
Measure 13: Recognition of alternative low emission vehicle designs .......................................... 34
Measures that were not considered worth progressing .................................................................... 35
Measure 14: Lower registration and annual vehicle licensing fees for electric vehicles ............... 35
Measure 15: GST exemption for second hand electric vehicles ................................................... 35
Page 1 of 35
 Purpose of report
1.
This report outlines the potential role of electric vehicles in helping New Zealand reduce its
greenhouse gas (GHG) emissions from transport.
2.
It provides you with advice on a range of measures that could form a package to encourage
the uptake of electric vehicles in New Zealand.
3.
Our advice is divided into four categories of potential measures that:
3.1.
we recommend be investigated further for possible inclusion in a package
3.2.
could be investigated further for possible inclusion in a package
3.3.
should be progressed outside of the package
3.4.
were not considered worth progressing.
Useful terms
4.
Pure electric vehicle – a vehicle powered solely by electric batteries charged from an
external source.
5.
Plug-in hybrid vehicle (PHEV) – a vehicle that operates on a combination of batteries that
are charged externally, along with petrol or diesel motors.
6.
Electric vehicle – either a pure electric vehicle or a PHEV.
7.
Hybrid vehicle – a vehicle that has an internal battery but cannot be directly plugged in, and
must have petrol or diesel to run.
8.
Light vehicle – a vehicle with a maximum gross mass of 3.5 tonnes or less.
Page 2 of 35
 Transport greenhouse gas emissions in New Zealand
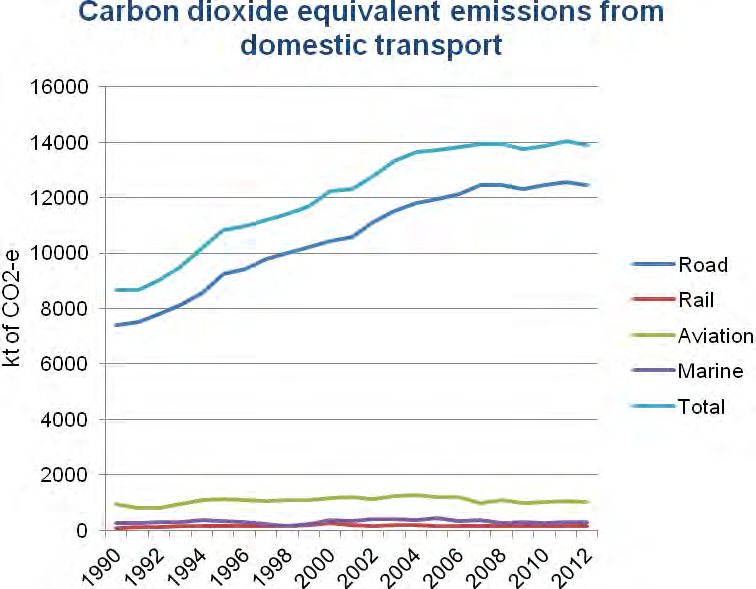
9.
In 2012, the transport sector accounted for 18 percent of New Zealand’s emissions. Of this,
89 percent was from road transport and the remainder from domestic aviation, marine and
rail.
10.
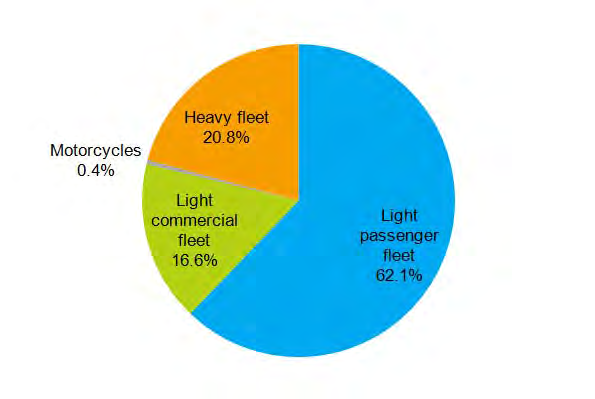
Light passenger vehicles emit the majority of road transport GHG emissions. While making
up only 4 percent of the vehicle fleet, heavy vehicles use almost 21 percent of the total fuel
used in New Zealand.
Percentage fuel used on the roads in New Zealand (2013)
Page 3 of 35

 Turnover of the fleet
22.
The speed at which the make-up of the light vehicle fleet can be changed is driven by the
fleet turnover. This is difficult to predict accurately, but on average over the last decade 7.1
percent of light vehicles enter the fleet each year. New Zealand has an aging fleet by
Organisation for Economic Co-operation and Development (OECD) standards. In New
Zealand, the average lifespan of a car is 20 years, and about 5.5 percent of the light fleet is
scrapped annually.
Electric vehicles in New Zealand – policies and uptake
23.
In New Zealand, measures have already been implemented to promote the uptake of low
emission vehicles generally, which have an impact on the uptake of electric vehicles. These
include:
23.1. the New Zealand Emissions Trading Scheme, which establishes a price on emissions
that flows through to the cost of petrol (the current price signal is weak)
23.2. the fuel economy labelling scheme
23.3. electric vehicles being exempt from road user charges (RUC) until 2020.
24.
Recent data indicates that the average emissions performance of light vehicles entering the
fleet is improving. In 2013 it was 183 grams of carbon dioxide (CO2) per kilometre, down
from 220 grams per kilometre in 2005.
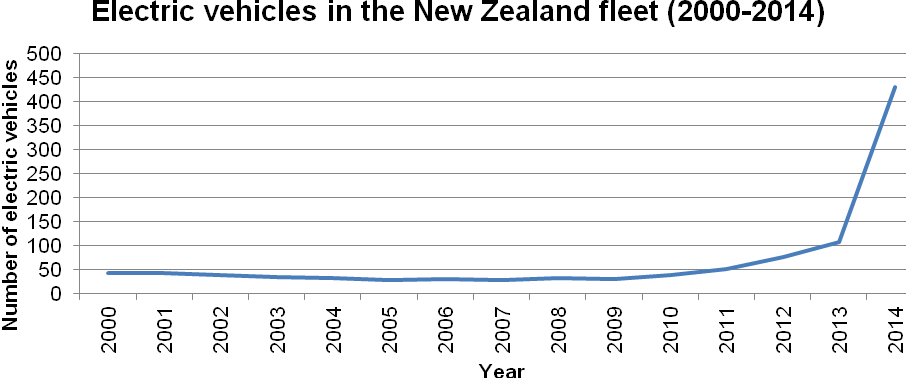
25.
However, these initiatives have had limited impact on uptake of low emission vehicles to
date. While the numbers of electric and hybrid vehicles are increasing, they currently make
up 0.32 percent of the total vehicle fleet (electric vehicles only make up 0.02 percent of our
total fleet).
Page 5 of 35
 Current projections for electric vehicle uptake
26.
There are serious challenges in providing accurate projections for electric vehicle uptake in
New Zealand given the high level of uncertainty around a number of factors that will
influence uptake. Uncertainties include:
26.1. the rate that the prices of electric vehicles will fall
26.2. the extent to which battery prices will fall
26.3. trends in the cost of other energy sources
26.4. trends in the price imposed on carbon emissions
26.5. the future of the RUC exemption
26.6. the availability of used electric vehicles into the New Zealand market (half of light
vehicle registrations in New Zealand are used vehicles).
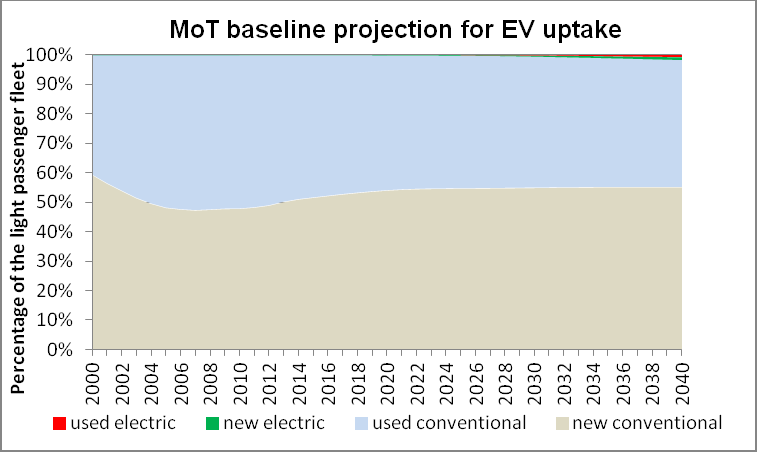
27.
The Ministry of Transport ran one baseline projection of electric vehicle uptake (below). This
forecasts that electric vehicles will account for 1 percent of the vehicle fleet by 2035 and 2
percent by 2040. This baseline scenario is based on electric vehicle uptake trends to date. It
assumes no significant changes in policy, the price of electric vehicles, or any relevant
external shocks.
28.
We have not been able to analyse how the measures identified in this report could affect the
Ministry of Transport’s baseline projection. We have instead provided a qualitative analysis
of the impact we expect each measure could have on addressing market failures and
regulatory barriers to uptake (Appendix B to the cover briefing).
Other modelling work
29.
We have also undertaken some modelling work for the Ministry for the Environment, in
response to a query by the Minister for Climate Change Issues, asking what impact 1 million
electric vehicles in fleets have on reducing CO2 emissions.
30.
We assumed a range of scenarios where electric vehicles made up approximately 200,000,
500,000, and 1 million vehicles in the fleet and modelled the corresponding effect on carbon
emissions (see the graph below).
Page 6 of 35
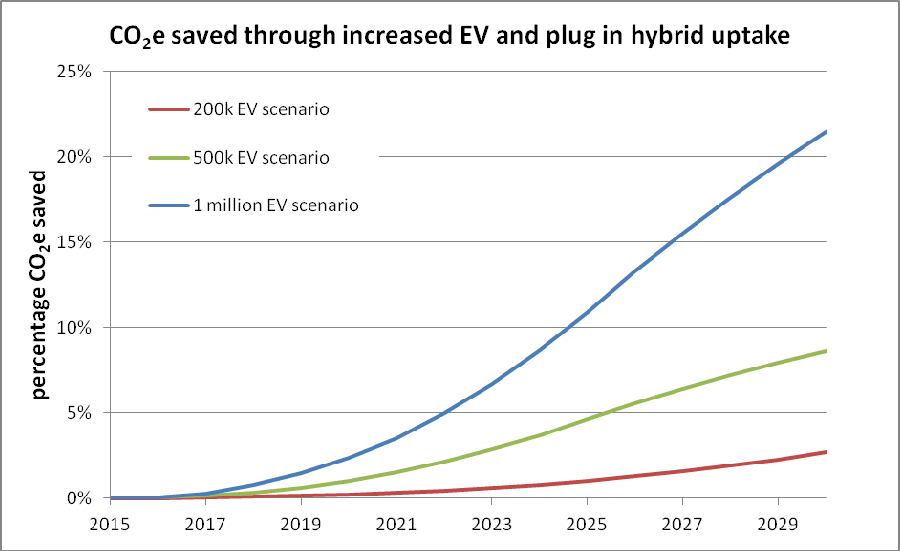

31.
The scenarios depicted below were not based on any specific assumptions about changes in
policy or the cost of electric vehicles. No analysis was undertaken to identify the conditions
or policy pathways that would be needed for these scenarios to be realised.
32.
Ministers may also be aware of some electric vehicle scenario work undertaken by the
Ministry of Business, Innovation and Employment (MBIE) as part of the Smart Grid Forum.
MBIE assumed a scenario where electric vehicles saturate the market by 2028. This was
done exclusively to test what impact this level of uptake would have on the distribution
network. This scenario was not based on a likely scenario for electric vehicle uptake, or a
particular policy pathway. The scenario would be extremely unlikely to occur given the
constraints on used imports discussed above.
What are the opportunities and barriers for electric vehicles?
The opportunity
33.
As well as reducing emissions, increased uptake of electric vehicles can bring other benefits
such as reducing our reliance on imported fossil fuels, and enhancing the efficiency of
renewable electricity networks.
34.
New Zealand is well positioned to benefit from electric vehicles because:
34.1. we have high levels of renewable electricity generation (currently 78 percent), with
capacity to increase the energy demand on renewables via electric vehicle uptake
34.2. 95 percent of daily travel demand is for distances less than 120 kilometres, which is
within the range of electric vehicle batteries (currently approximately 150 kilometres
per charge)
34.3. we do not need major investment in infrastructure – domestic power supply is
suitable for charging at home, and 80 percent of homes have off-street parking.
Page 7 of 35

35.
We previously advised that any policies dependent on the turnover of the vehicle fleet may
be effective at reducing emissions over a very long-term, but are unlikely to make a
significant contribution to New Zealand’s 2020–2030 emissions reduction target.1 Therefore
adopting a package of measures to achieve higher electric vehicle uptake represents an
investment for the long-term, and may assist in the achievement of longer-term emissions
targets.
Barriers to uptake
36.
High upfront costs – although some models are becoming cost-competitive, the average
upfront costs of electric vehicles are generally higher than conventional vehicles, and
consumers are not recognising their additional associated value.
37.
Limited range – pure electric vehicles are not suited to long journeys (over 150 kilometres)
without stops to recharge the vehicle. There is a strong body of research that private citizens
highly value the ability to travel long distances, even if very occasionally.
38.
Few electric models are available in New Zealand – only a small range of models are offered
in the New Zealand market currently.
39.
Supply of used electric vehicles is likely to be constrained in the foreseeable future – uptake
of electric vehicles in Japan is expected to be low in the foreseeable future. Further,
Japanese policies mean electric vehicles do not depreciate as quickly as conventional
vehicles so they are not on-sold into the second-hand market as quickly. These factors may
consequently limit the supply of used electric vehicles in New Zealand in the future.
Government’s role in overcoming these barriers
40.
Government is limited in what it can directly do to address the barriers above. In some cases
intervention may not be required as existing barriers may reduce themselves through cost
reductions and improved battery technology over time.
41.
There is a clearer role for government intervention to address market failures affecting
uptake, such as in helping to resolve:
41.1. coordination problems, for example, addressing any issues to ensure that the
necessary infrastructure is in place ahead of demand in order to encourage uptake
41.2. information problems, for example, lack of awareness and misconceptions about
electric vehicles, and uncertainty about the total cost of ownership (including
maintenance costs, battery life and residual values)
41.3. trade barriers, for example, the removal of import duties on a broad range of
environmental goods (which could include electric vehicles and batteries) in the
context of the negotiations towards a global Environmental Goods Agreement in the
World Trade Organization (WTO).
42.
As well, we have identified several instances of possible regulatory failure (for example, ACC
levies and road user changes for PHEVs). Left unaddressed, these regulatory failures may
‘nudge’ motorists away from choosing electric vehicles.
1 Our modelling indicates that doubling the uptake rate of electric and hybrid vehicles over the next 25 years (compared to
business-as-usual baseline) could result in emissions reductions of 7 percent in the transport sector by 2040.
Page 8 of 35
 Criteria used to assess potential measures
43.
A set of standard criteria was used to assess the merits of potential measures in accelerating
the uptake of electric vehicles as a means to reduce transport GHG emissions.
43.1. Effective – the measure will achieve a reduction in transport GHG emissions. This
includes securing a reduction that is sustained long-term.
43.2. Efficient – the measure will take account of:
43.2.1. purchase, implementation, and maintenance costs for individuals, businesses
and government
43.2.2. compliance costs and government administration costs.
43.3. Equitable – the measure addresses distributional impacts between high income
households and low income households, and maintains the principle that system use
and costs imposed determine who pays and at what level.
43.4. The measure maximises co-benefits (for example, increasing air quality) and
minimises co-costs (for example, increasing the pressure on freshwater ecosystems).
43.5. The measure encourages private sector activity and investment with government
intervention only occurring where there is an identified market or regulatory failure.
43.6. The measure helps New Zealand transition to a long-term low-emissions transport
sector.
Page 9 of 35
 Measures that we recommend be investigated further for inclusion in a package
44.
Listed below are the measures that we recommend are prioritised for further investigation.
Our initial analysis suggests these measures are the most viable for inclusion in a package
to encourage the uptake of electric vehicles.
Measure 1: Energy Efficiency and Conservation Authority (EECA) information and promotion
campaign
We recommend any package includes an information and promotion campaign as a central
component. A campaign would help address information barriers and enhance the visibility of other
measures to address barriers to uptake of electric vehicles. Given that vehicle fleet turnover is a
long-term option for reducing GHG emissions, we recommend pursuing a campaign that seeks
long-term change (this would require funding of approximately $1.7 million per year, for 5 years).
45.
Many motorists are either unaware of, or hold misconceptions about electric vehicles and
their operation. Electric vehicles are a relatively new technology that is not well understood
or accepted by potential buyers.
46.
The Sustainable Business Council has also cited a “lack of awareness of electric vehicles by
corporate fleet managers and staff that have vehicles as part of their salary package” as a
barrier to uptake. We are undertaking research with EECA to better understand the
information barriers that exist among fleet buyers.2
47.
We consider an ideal information and promotion campaign is one that supports the long-term
change in perceptions and understanding of electric vehicles, which is necessary to
maximise GHG reductions from uptake.
48.
Such a campaign would need to target the market segments most likely to respond to
information and promotion in the first instance (for example, fleet owners, lease companies,
large businesses, and government agencies). Public information would focus on dispelling
misconceptions.3 Building long-term relationships with business and local government would
provide opportunities to develop joint measures and share learnings between stakeholders.
This level of commitment would send a strong signal to business and local government
about the Government’s long-term support for electric vehicles.
49.
EECA has the mandate and capability to deliver this kind of information and promotion
campaign. EECA has identified the elements of a comprehensive campaign that seeks long-
term consumer change and addresses barriers to uptake. The campaign would run for 5
years and cost $1.7 million per year. This could require a new budget initiative. The funding
would enable EECA to:
49.1. run a high profile media and advertising campaign
2 EECA has engaged with a number of major light vehicle fleet owners (including Downer, Opus and Fonterra) to better
understand barriers to the uptake of electric vehicles from a fleet buyer’s perspective. A key barrier is a lack of information
on the total cost of ownership. In response to this, EECA is working on a “total cost of ownership” tool to help fleet
managers compare the total costs of owning and operating an electric vehicle with an equivalent petrol or diesel vehicle,
so that fuel and maintenance savings can be readily taken into account.
3 For example, EECA’s engagement with fleet managers (and the public) has identified misconceptions about the
environmental performance of electric vehicles as a barrier to uptake. To this end, EECA is engaging a consultant to
undertake a lifecycle analysis of electric vehicles in the New Zealand context, to provide authoritative information that can
be easily communicated.
Page 10 of 35

49.2. directly market to, and build long-term partnerships with, corporate fleet managers
49.3. undertake joint measures with private sector companies and local government.
50.
This campaign is scalable and could be delivered with a more limited reach over a shorter
time frame (for example, 2 years) for a cost of $1.2 million per year.
51.
Any campaign would also be used to inform consumers of other measures within the
package that address barriers to uptake (for example, the RUC exemption for light electric
vehicles).
52.
We recommend any package to support the uptake of electric vehicles should involve an
information and promotion campaign. We consider a longer-term and more comprehensive
campaign is best suited to the dynamics of the New Zealand vehicle market, particularly as
the majority of new vehicles are purchased for fleets before entering the second-hand
market 3 to 5 years later.
53.
We consider the smaller, lower cost campaigns would still have merit, but would also have
fewer benefits over the long-term. The signal sent to industry would also be weaker.
Page 11 of 35
 Measure 2: Government support for charging infrastructure
We recommend that the Government supports the private sector to establish a cohesive network of
fast-charging stations by:
offering branding and promotional support to facilitate a cohesive network
providing independent advice to local government and other independent investors about
appropriate recharging infrastructure
potentially funding, or co-funding the installation of fast-charging stations in locations where
it is not commercially viable for the market to do so.
A new budget bid would be required to request Crown funding for this option. Alternatively, should
you progress measures 1 and 4, funding for charging infrastructure (promotion and installation)
could be drawn from the proposed EECA promotional campaign and electric vehicle programme.
54.
As in other countries, the majority of electric vehicles are likely to be charged during
overnight parking, predominantly in homes. In addition, 95 percent of all journeys in
New Zealand are less than 120 kilometres, well within the range of electric vehicles. We
anticipate that range will improve with battery technology over the coming years.
55.
Nevertheless, charging infrastructure will still be required to offset range anxiety and
enhance the versatility of electric vehicles.
56.
Evidence from jurisdictions such as Oregon (USA) suggests that public charging
infrastructure increases the utility, and therefore value, of electric vehicles. Without a
charging infrastructure network, electric vehicles are only useful within a radius of 50 percent
of their range. A network of fast-charging facilities means that electric vehicles can travel
further if required. This makes them appealing to a larger segment of the car-buying
population.
57.
The Electricity Networks Association has announced plans to study if a ‘renewable highway’
providing a nationwide infrastructure for charging is possible.
58.
On 12 February 2015, officials met with Mighty River Power (MRP) and the Sustainable
Business Council. [Commercial in-confidence] MRP advised us that it plans to partner with
other electricity industry players to invest in a ‘renewable highway’. The ‘renewable highway’
is a network of fast-charging stations that will form a network from which other charging
infrastructure could expand. We understand that MRP considers that this measure can be
entirely funded by industry. MRP intends to establish these charging stations at locations
where motorists would logically stop on a long journey (for example, shopping areas, tourist
attractions).
59.
Other parties (such as JuicePoint and the private equity group behind Charge.net.nz) are
also looking to provide more charging infrastructure. This does not require Crown funds.
60.
There may be a role for government in ensuring the network is cohesive. For example, there
may be locations where charging infrastructure is not commercially viable to install, but
necessary to complete a cohesive network. Easy identification of charging stations and the
standardisation of various systems may also be an issue if multiple businesses are installing
fast-charging stations.
Page 12 of 35

61.
We understand that a number of local councils and other players that are looking to install
charging infrastructure are seeking independent advice about what charging facilities they
should install. There would be value in government filling this gap.
62.
We considered the following options for government support for charging infrastructure.
Option 2.1 – government branding and information support for charging infrastructure.
Option 2.2 – inclusion of charging infrastructure in large State highway projects.
Option 2.3 – government providing funding for charging infrastructure to fill gaps in the
network.
Assessment of the options
63.
Option 2.1 is preferred. Under this option, the market decides the most appropriate locations
for fast-charging infrastructure. The cost of providing branding and information support could
be covered by EECA as part of the information and promotion campaign (see page 10 of this
report). If set up as a stand-alone programme, a budget bid may be required to request
Crown funds.
64.
EECA could potentially play an advisory and coordination role in supporting these
independent players. The NZ Transport Agency advises that it could assist by providing
access to Crown land and transport planning advice.
65.
Option 2.2 is not preferred because motorists are unlikely to consider it desirable or safe to
charge their vehicles on the roadside (for example, motorists would prefer to do something
productive during charging times). The cost of creating a safe area for motorists to charge
their vehicles along State highways would be much higher than installing charging
infrastructure at existing parking facilities.
66.
Option 2.3 would be more effective once we have an indication of where the gaps in the
network are that cannot be filled by the market. The Government could fund (or co-fund)
charging infrastructure under the proposed electric vehicle programme (see page 17).
Page 13 of 35


72.3. Electric vehicles remain unattractive to many fleet managers for practical reasons,
such as the need to ensure pool cars are charged for the next user, ensuring that
electric vehicles have sufficient range for employees’ day-to-day activities, and that
employees have access to charging facilities.
73.
The current AoG contract is due to expire on 30 June 2015 and the new contract has the
potential to be in place for the next 10 years. The criteria for vehicle inclusion in the
catalogue are expected to stay much the same, and as a result electric vehicles are highly
unlikely to be included in the catalogue under the status quo.4
Options considered
74.
Potential options to facilitate the uptake of electric and other low emission vehicles into the
government fleet include the following.
Option 3.1 – the Government funding a trial of electric vehicles within government agency
fleets. An indicative cost for such a trial would be around $500,000 (and potentially cost
neutral over time). This level of funding would cover the additional purchase costs for around
24 electric vehicles or PHEVs in four government fleet locations around New Zealand. It
would also cover the risk to fleet managers of any lower residual value at on-sale, the cost of
installing charging facilities, and costs associated with project management, research and
monitoring.
Option 3.2 - requiring MBIE to include a specific class in the AoG catalogue for electric and
hybrid vehicles.
Option 3.3 – providing greater information in government fleet managers’ guidelines
regarding electric vehicles.
Option 3.4 – amending government procurement guidelines to require a set percentage of all
vehicles purchased by government fleets to be electric.
Option 3.5 – the Government guaranteeing agencies a residual value on the resale of all
electric vehicles purchased through the AoG vehicle catalogue. Government would
guarantee an on-sale price that would make electric vehicles competitive with other vehicles
vying for inclusion in the catalogue.
Option 3.6 – choosing electric vehicles for some or all Crown limousine replacements and
ministerial self-drive cars.
Assessment of the options
75.
Option 3.1 is the preferred option. A trial could fill information gaps around the whole-of-life
cost associated with electric vehicles, and demonstrate their functionality in New Zealand
fleets. This information would help to inform government and corporate fleet purchasers
about key uncertainties, such as likely resale value, and maintenance and replacement
costs, and therefore reduce risk. The visibility of a trial by government could complement a
government information campaign by normalising electric vehicles and dispelling myths
associated with electric vehicles.
76.
MBIE and EECA have expressed their willingness to support the development of a trial
scheme, in terms of developing parameters, providing comparative cost data, and identifying
willing government agencies to participate.
4 Inclusion in the catalogue is determined by an expert procurement panel.
Page 15 of 35

77.
Further discussions would be needed to determine who would administer and manage this
trial. MBIE would also work with the AoG contracted suppliers on the supply of electric
vehicles. While some contracted suppliers are manufacturing electric vehicles globally, these
are not being imported into New Zealand due to the current low demand for these types of
vehicles.
78.
There is some risk associated with this option. The unknown costs around electric vehicles
(that is, on-sale value, maintenance and replacement costs), which this trial is trying to
identify, also risk increasing (or decreasing) the costs of this trial.
79.
Option 3.2 (including a specific class for electric and hybrid vehicles in the catalogue) is also
recommended. This would make electric and hybrid vehicles more visible to government
fleet managers and nudge them to consider them as a viable option. It would ensure that
manufacturers that sell electric vehicles are included in the AoG contract so that lower prices
for electric vehicles can be negotiated. This measure would place some cost on MBIE, which
may have to run an additional tender process for this specific class.
80.
Option 3.3 would provide a low cost way of encouraging uptake of electric vehicles in the
government fleet. However, without information relating to the whole-of-life costs (that option
3.1 will seek to generate), this would have limited effect.
81.
Option 3.4 is potentially viable but it is a higher risk option. We do not know how government
agencies use their vehicles so a prescribed level of uptake risks burdening agencies with
vehicles that do not fit their needs (that is, typical driving distance or pooling arrangements).
This approach could also present a financial risk to agencies and government given the
unknowns around the supply of affordable electric vehicles, the on-sale value of these cars,
and maintenance costs (all unknowns that a trial would seek to inform). This option would
require adjustments to the AoG solution, but MBIE advises that the new contract scheduled
from 1 July 2015 will be flexible enough to allow for any such change.
82.
Option 3.5 could be effective for incentivising wider uptake of electric vehicles in the
government fleet. It could also offer a simplified approach to financing option 3.4. It removes
the risk for government fleet purchasers of on-sale value being unknown, and provides
useful information about whole-of-life cost for private fleet purchasers. However, this option
presents a financial risk to government and similar information about electric vehicle on-sale
value could be gained from a lower risk trial (option 3.1).
83.
Option 3.6 would not be viable at this time as MBIE has already begun the tender process
for Crown limousine replacements. We understand that the tender document includes the
following wording to encourage the inclusion of electric vehicles in the tender process:
“If it
meets all the requirements electric vehicles would be welcomed.”
Page 16 of 35
 Measures that could be investigated further
84.
The measures below could be initiated in the short-term (next 2 years). You may wish to
consider which, if any, of these options should be progressed as part of a package to
encourage the uptake of electric vehicles.
Measure 4: An electric vehicle programme to co-fund initiatives with other parties
We could investigate the establishment of an electric vehicle programme that would co-fund projects
that encourage the uptake of electric vehicles. This option would encourage businesses and local
communities to develop projects to address the market failures/barriers that are limiting the uptake
of electric vehicles. This would require a new budget bid.
85.
In addition to government, there are other parties that have an interest in encouraging
uptake of electric vehicles, including the electricity sector, manufacturers of electric vehicles,
businesses seeking to reduce their fuel costs and GHG emissions, and local government.
86.
An electric vehicle programme could be used to bring together the efforts of these parties
over a focused period of time. The programme could be used to ensure that the sum of
efforts to encourage uptake of electric vehicles is maximised by having a greater degree of
visibility and coherence. This programme would be distinct from the EECA promotional
campaign.
87.
Under this option, local government and private sector organisations would be incentivised to
develop and implement their own projects aimed at increasing the uptake and use of electric
vehicles. They would apply to have their project co-funded and an investment group would
assess the projects against a set of agreed criteria. The investment group would be
responsible for ensuring that the projects represent value for money and contribute to the
objective of lowering GHG emissions through the uptake of electric vehicles.
88.
The advantage of this approach is that it encourages innovation by giving local government
and private sector organisations the flexibility to determine the types of projects that are most
appropriate for particular market conditions and/or their local communities.
89.
The co-funding approach encourages partnership by giving both parties the incentive to
ensure that projects are value for money, and achieve the desired outcomes of encouraging
uptake of electric vehicles and reducing GHG emissions.
90.
Examples of the type of projects that could be funded by an electric vehicle programme
include:
90.1. trials of electric buses on urban public transport routes
90.2. installation of public fast-charging infrastructure at locations where it is not
commercially viable for the market to do so, but is necessary to form a cohesive
network
90.3. creation and promotion of branded tourism routes (for example, where tourists can
hire electric vehicles, and preferentially park and charge the electric vehicle at tourist
attractions, cafes and accommodation along the route)
90.4. demonstrations of vehicle types not currently offered in New Zealand (for example,
electric vans for use by trade employees in business fleets).
Page 17 of 35

91.
Auckland Transport’s recent announcement of a Request for Proposal from car share
operators to launch an electric vehicle scheme in Auckland is also an example of the type of
project that could be co-funded through an electric vehicle programme.
Details that would need to be considered
92.
Details of an electric vehicle programme that would need to be determined include the
following:
92.1. The level of funding made available, and over what period – the level of funding could
vary significantly depending on the level of ambition assigned to the programme. As
an example, a programme in the order of $2 million over 2 years could be used to co-
fund 8 to 10 trials, demonstrations or small infrastructure projects (for example,
charging stations).
92.2. Co-funding rates for projects – we consider that a maximum co-funding rate of 50
percent would give both parties the appropriate incentive to ensure that the projects
were effective and value for money.
92.3. Which government department or agency is primarily responsible for administering
the fund.
92.4. Composition of the investment group – the group would ideally be comprised of
representatives of central and local government, industry and users.
92.5. Eligibility and criteria for funding – these would be decided by ministers.
92.6. Appropriate level of oversight for allocation decisions – this would depend on the
level of funding for the programme and the potential cost of individual projects.
93.
Our recommendation is to consider this option. The Ministry of Transport, NZ Transport
Agency, and EECA have experience in dealing with similar programmes, and can assist in
the development and administration of an electric vehicle programme.
Page 18 of 35
 Measure 5: Electric vehicles in bus and transit lanes
Consideration could be given to investigating the removal of regulatory barriers preventing road
controlling authorities from allowing electric vehicles in bus and transit lanes.
94.
Allowing electric vehicles access to bus and transit lanes is a relatively low cost incentive to
encourage uptake of electric vehicles and bring forward GHG emission reductions. This
particular measure is perceived by drivers to be of high value relative to other common
electric vehicle incentives. In Norway this incentive was a key part of changing consumer
opinion about electric vehicles.5
95.
In New Zealand, priority vehicle lanes exist in two main forms: as transit lanes (for example,
T2 and T3 lanes), which prioritise private vehicles carrying multiple passengers; and as bus
lanes, which primarily prioritise public buses.
96.
Priority lanes run along congested arterial roads in urban areas and are intended to reward
forms of travel that make a stronger contribution to network efficiency. Priority lanes offer
time savings, which provide strong incentives for travel behaviour change.
97.
Under the Land Transport (Road User) Rule 2004 (the Road User Rule), road controlling
authorities (RCAs) are restricted from granting electric vehicles access to priority lanes. This
incentive is therefore not currently possible without changes to the Road User Rule and
related provisions in Land Transport Rule: Traffic Control Devices 2004.
Background
98.
At present, transit lanes only exist in Auckland. They operate in two forms.
98.1. As ‘priority lanes’ at on-ramps onto the motorways, where vehicles with two or more
people can bypass the on-ramp signal lights during congested periods and enter the
motorway ahead of other traffic.
98.2. As ‘T2 or T3 lanes’. These operate on arterial roads during peak hours and are
reserved for cars with two to three or more people.
99.
Bus lanes exist along main arterial roads in most of New Zealand's main urban centres.
100. The NZ Transport Agency is a RCA and manages priority lanes on the Auckland motorway.
RCAs, like Auckland Transport and Greater Wellington Regional Council, have responsibility
for determining bus lane location and identifying vehicles that can and cannot use the lanes.
101. Providing electric vehicles access to priority lanes would likely provide an incentive for
ownership. However, there is limited data available to identify what time savings are
necessary to influence electric vehicle uptake. In the USA, there is evidence that policies
allowing access to transit lanes have positively influenced the uptake of electric and hybrid
vehicles.6 NZ Transport Agency research shows a fairly strong relationship between travel
5 Sourced from a 2014 presentation by Norwegian Transportokinomisk Institutt, on ‘Electrification of road transport in
Norway’, slide 9.
6 See two USA studies: (2014)
Evaluation of State-level U.S. Electric Vehicle Incentives, The International Council on
Clean Transportation, p.26; and (2008)
Impact of High Occupancy Vehicle (HOV) Lane incentives for Hybrids in Virginia,
Journal of Public Transportation, vol. 11, no.4, p.52.
Page 19 of 35

time savings offered by bus and car pool lanes and a shift from car to buses or high
occupancy vehicles.7
102. Allowing electric vehicles to access priority lanes will inevitably have some impact on other
transport objectives. Priority lanes are typically implemented for network efficiency purposes,
and the inclusion of electric vehicles in such lanes is likely to impact on public transport
reliability and general congestion as electric vehicle numbers grow. However, without RCAs
modelling specific corridors, it is not possible to know the precise effects of this incentive,
either for electric vehicle uptake or on other transport objectives.
103. In Auckland, the Onewa Road T3 lane offers a travel time saving of around 20 minutes (this
resulted in a 120 percent increase in the share of high occupancy vehicles). The priority
lanes on on-ramps offer time savings between 2 and 5 minutes and have resulted in only a
small increase in high occupancy vehicles.8
104. Many bus lanes in New Zealand may not offer a real time saving to car drivers, given the
stop-start nature of buses operating in them. The NZ Transport Agency has also advised that
the four main corridors with bus lanes in Auckland are expected to be congested within 1 to
3 years. This suggests there are limited opportunities to provide electric vehicle drivers with
real time savings via bus lanes. Nevertheless access to bus lanes is likely to remain an
incentive for electric vehicle uptake as it provides the perception of priority access.
Options
105. The options considered were:
option 5.1 – amending existing legislation to allow electric vehicles automatic right of access
to all bus and transit lanes
option 5.2 – amending existing legislation to enable RCAs to determine which bus and transit
lanes electric vehicles can access.
Assessment of the options
106. If this measure is pursued, option 5.2 is preferred. Under this option the Ministry of Transport
would consider options for amending legislation to give RCAs the power to allow electric
vehicle access to specific bus and transit lanes. RCAs would retain the power to exclude
electric vehicles from bus and transit lanes should they choose to do so.
107. This option provides RCAs with the flexibility to choose which bus and transit lanes electric
vehicles can access. This flexibility would allow RCAs to manage conflicting transport
priorities along a corridor, including electric vehicle promotion and network efficiency.
108. There is a risk that this option would not result in electric vehicles having access to bus and
transit lanes. It is the NZ Transport Agency’s expectation that RCAs are unlikely to be
interested in granting electric vehicles access to bus and transit lanes. The NZ Transport
Agency expects RCAs will share its reservations about the potentially negative impact of
having electric vehicles in bus and transit lanes on network efficiency (that is, vehicle
congestion and bus reliability). For this reason, it would be important to discuss this measure
with RCAs prior to any announcement or decision.
7 http://www.nzta.govt.nz/resources/research/reports/557/docs/557.pdf , p.23.
8 Ibid, p.22, 23.
Page 20 of 35

109. This risk could be mitigated through consultation with RCAs. Matters relating to
implementation of the option will need to be tested with RCAs to consider how they could be
managed.
110. This incentive would result in minor costs for RCAs. There would be costs involved in
altering signage to identify electric vehicle accessible lanes, and also to make it clear the
lanes that do not afford electric vehicles access.
111. The NZ Transport Agency advises that changes to systems to enable identification of electric
vehicles for enforcement purposes could range between $60,000 and $200,000 to enable.
However, this work may be able to ‘piggyback’ on other projects.
112. Option 5.1 would be the simplest way to ensure this policy is implemented. However, it
would reduce the flexibility RCAs have to manage their networks. Should electric vehicle
numbers grow, and impede the flow of other traffic in a priority lane, RCAs would have no
recourse to mitigate this. A mandatory policy would also mean electric vehicle access could
not be revoked until the regulation expired or was amended.
Page 21 of 35
 Measure 6: Road user charges (RUC) exemptions and discounts for electric vehicles
Consideration could be given to introducing a RUC exemption for light electric vehicles from the
date each vehicle is registered in New Zealand, for a finite period of time (for example, 5 years).
This option would require a change to the Road User Charges Act 2012.
113. The New Zealand land transport system is largely funded on a user pays basis. Anyone
using New Zealand’s roads contributes towards the operation and development of the land
transport system. Vehicle operators pay for their road use through either fuel excise duty
(FED) or road user charges (RUC), and through a portion of the annual vehicle licensing fee.
114. The Road User Charges Act 2012 (the RUC Act) requires that all vehicles that do not pay
FED through tax on fuel purchases9 (that is, including electric and diesel vehicles) be subject
to RUC, unless exempted.
115. The scope for exemptions is defined in section 37 of the RUC Act. It allows the Governor-
General to, by Order in Council, specify the period during which road user charges are not
payable in respect of light electric vehicles. An Order in Council made under section 37 of
the RUC Act must specify the date on which the exemption expires, and may, from time to
time, be amended to provide for a later date.
116. The Road User Charges (Exemption Period for Light Electric RUC Vehicles) Order 2012
makes light electric vehicles exempt from RUC until 30 June 2020.The definition of electric
light vehicle in the RUC Act includes all vehicles with “motive power wholly or partly derived
from an external source of electricity”. In practice, the exemption includes pure electric
vehicles and PHEVs.
Previous Cabinet decisions
117. In May 2009, the Cabinet Economic Growth and Infrastructure Committee:
117.1. agreed that the Road User Charges Act 1977 and Road User Charges Regulations
1978 be amended to exempt light electric vehicles from paying road user charges
117.2. agreed that a road user charges exemption (that is intended to apply until 1 percent
of the light vehicle fleet is electric) will apply until 2013, with the ability to reassess the
percentage of light electric vehicles in the fleet and extend the exemption [EGI Min
(09) 10/7 refers].
118. In April 2012, Cabinet agreed to extend the existing exemption from RUC for light electric
vehicles until 30 June 2020 [EGI Min (12) 6/6]. This decision reflected a slower than
anticipated rate of uptake of light electric vehicles.
Benefits of the RUC exemption for light electric vehicles
119. The RUC exemption does not address information or coordination problems. It is a financial
incentive that is designed to encourage electric vehicle uptake by reducing their operating
costs.
120. We have not formally evaluated the RUC exemption, so we do not know exactly how
effective the RUC exemption is at incentivising the uptake of electric vehicles in practice.
This includes knowing the extent to which consumers are aware of the RUC exemptions,
9 Note that FED is also charged on CNG and LPG.
Page 22 of 35

and its potential value. For instance, motorists who have previously driven light petrol
vehicles are unlikely to consider the saving on RUC as distinct from overall fuel costs.
121. Stakeholders, such as the Sustainable Business Council and Fleet Management
Association, have said that their members consider the RUC exemption to be an important
consideration when making fleet purchase decisions.
122. We undertook analysis of whether electric vehicles would be reliant on the RUC exemption
for an economic advantage over conventional vehicles based on current costs. We found
that, based on current vehicle and fuel prices, the RUC exemption is an important factor in
determining whether the total cost of ownership for electric vehicles is competitive with
comparable petrol and hybrid vehicles. The RUC exemption therefore plays an important
role in determining whether it makes economic sense for fleet buyers to purchase electric
vehicles in the short to medium-term.
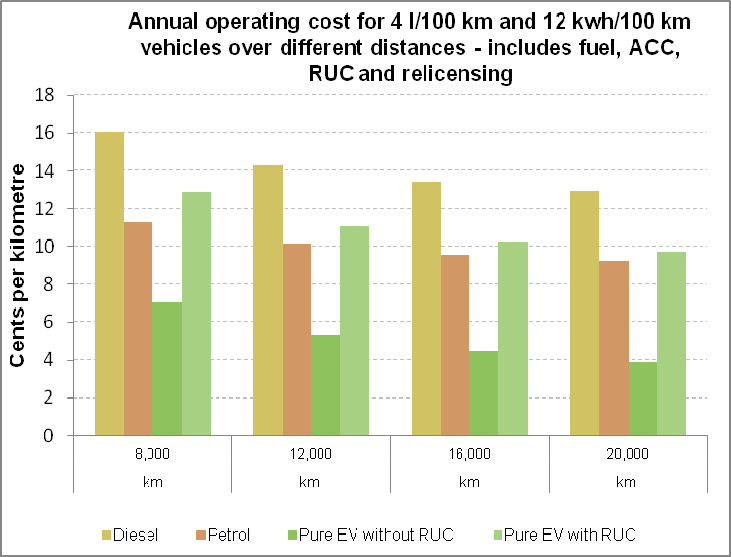
123. The analysis compared the per kilometre operating cost of different vehicle types, based on:
123.1. fuel cost (2015 prices)
123.2. ACC costs
123.3. annual vehicle licensing
123.4. RUC (where applicable)
124. The analysis did not cover capital (that is, purchase price), maintenance costs or
depreciation.
125. The following breakdown shows the costs for both petrol and diesel vehicles using 4 litres
per 100 kilometre and electric vehicles using 12 kilowatt-hours per 100 kilometres.10 It shows
that efficient petrol vehicles have similar operating costs to electric vehicles paying RUC.
10 Conventional Toyota Prius hybrids use 4 to 4.5 litres per 100 kilometres of petrol in the real word, and Nissan Leaf
electric vehicles achieve around 13 kilowatt-hours per 100 kilometres.
Page 23 of 35

126. The analysis shows that if there was no RUC exemption, a solely financial analysis would
exclude electric vehicles from any rational business decisions (unless there was a significant
rise in the price of petrol or major drop in electric vehicle purchase prices).
Cost of RUC exemption
127. Currently, electric vehicles make up just 0.02 percent of the fleet. Based on our modelling of
projected uptake, we would expect to see 30,000 electric vehicles (or about 1 percent of the
fleet) in the New Zealand fleet by 2033 under a ‘status quo’ scenario. The financial
sustainability of the RUC exemption would need to be addressed at this point.
128. The cost of exempting 1 percent of light electric vehicles from RUC is approximately $22
million per year (2015) from the approximately $3 billion which goes into the national land
transport fund annually. Forgoing this revenue means that:
128.1. less funding is available for delivering roading improvements, which could require that
delivery is spread over a slightly longer time frame
128.2. more of the revenue burden is carried by a decreasing proportion of road users,
which could require proportionate increases in FED and RUC to achieve the same
level of funding.
Options considered
129. The following option is consistent with existing government policy, and can be implemented
under the RUC Act.
Option 6.1 – extend the blanket RUC exemption for light electric vehicles to a date beyond
30 June 2020.
130. The following amendments to RUC for electric vehicles would require amendment of the
RUC Act.
Option 6.2 – introduce RUC exemption for light electric vehicles from the date individual
vehicles are first registered in New Zealand, for a finite period of time.
Option 6.3 – introduce a lifetime exemption from RUC for all the light electric vehicles first
registered in New Zealand before a specified date.
Option 6.4 – extend the RUC exemption to include heavy electric vehicles.
Option 6.5 – provide a discounted rate of RUC for heavy electric vehicles.
Option 6.6 – provide a discounted rate of RUC for heavy passenger electric vehicles.
131. Note that no amendment to the RUC Act is proposed for this year’s legislative programme.
Assessment of the options
132. If this measure is pursued, option 6.2 is preferred. A RUC exemption for light electric
vehicles from the date they are first registered, for a finite period of time, would help manage
the cost of foregone revenue (within the 1 percent limit already agreed by Cabinet). It is also
more equitable than the current exemption because owners of electric vehicles would begin
paying their fair share towards the land transport system after the finite period ended. We
would need to do more work to determine an appropriate exemption period. A risk of this
option is that it could be politically difficult for a future government to close off the exemption.
Page 24 of 35

133. If you do not want to pursue an amendment to the RUC Act, you could consider option 6.1.
Based on our preliminary assessment, the RUC exemption for light electric vehicles could be
extended to 2025 without exceeding the 1 percent limit already agreed by Cabinet, even with
a boost in uptake levels as a result of a government package.11
134. We do not recommend that option 6.3 be pursued. While this option would incentivise early
uptake, it could create some unwanted market distortions (for example, a ‘bubble’ of electric
vehicles registered prior to the exemption close off). Such distortions would substantially
increase the amount of revenue foregone and would further exacerbate the inequity of the
RUC exemption.
135. We do not recommend exempting or discounting heavy electric vehicles from RUC. Heavy
vehicles do significantly more damage to the roads, and therefore have a greater impact on
maintenance costs. It would also be a further deviation from the user pays model, and is
likely to face political resistance.
136. Currently, there are very few electric heavy vehicles on the road. Nationally, there is 1 fully
electric truck, 3 hybrid trucks, and 80 electric trolley buses in Wellington.
137. If pursued further, we would need to consult with industry to consider their views on the
matter, and get a better indication of likely rates of uptake. This would inform the projected
costs of the exemption. We would also suggest limiting the scope of the changes to reduce
the risk of higher-than-expected revenue losses (for example, option 6.6 – a discount for
heavy passenger electric vehicles).
138. A risk with all the options above is that the overall cost cannot be defined accurately
(essentially it will be demand driven). Also, there could be perceptions of unfairness from
manufacturers or users of other low emission technologies, such as hydrogen vehicles.
139. If a change to the RUC Act is required following ministerial decisions on the RUC exemption,
the Ministry of Transport could explore whether the exemption should also apply to other low
emission vehicles.
11 If we assume that a package of measures to encourage the uptake of electric vehicles doubles the baseline rate of
uptake, we could see 30,000 electric vehicles in the New Zealand fleet by 2029. However, it is very difficult to project
future uptake of electric vehicles off the current low base (approximately 400 vehicles). Actual uptake in 10 years’ time
may vary significantly from current projections.
Page 25 of 35
 Measure 7: Fringe benefit tax on electric and hybrid vehicles
We recommend that a review be conducted within the next 2 years of the basis for calculating the
taxable value of the fringe benefit for electric and hybrid vehicles. This review would ensure that the
lower running costs of these vehicles are adequately recognised.
140. Fringe benefit tax is a tax on non-cash benefits provided in connection with employment. The
tax is intended to leave an employee neutral between receiving a fringe benefit and receiving
the equivalent monetary remuneration. Consequently, fringe benefit tax should not distort
choice, unless it results in overtaxing the benefit, such as through an overvaluation of the
benefit provided.
141. Electric and hybrid vehicles attract a higher amount of fringe benefit tax as their purchase
prices are higher than those of equivalent conventional vehicles. The Sustainable Business
Council and Business are of the view that reducing the fringe benefit tax on electric vehicles
would have a significant nudge effect on the purchase decisions of fleet managers.
142. For the purposes of fringe benefit tax, the annual taxable value of an employee’s vehicle
benefit is calculated as either 20 percent of a vehicle’s cost price, or 36 percent of its book
value. These proportions are proxy estimates of the fixed and running costs that the
employee would bear if they owned the car themselves. Fringe benefit tax applies to these
estimates.
143. Little is known about the extent to which fleet purchase decisions are being influenced by
fringe benefit tax. In our view, however, it is more likely that other barriers, such as the
limited (travel) range of pure electric vehicles, are playing a far greater role in company
decisions not to purchase electric vehicles for their fleets. Also, many employees use motor
vehicles solely for work purposes rather than as a non-cash employment benefit, and would
be unaffected by changes to fringe benefit tax rules.
144. Nevertheless, a potential issue with the fringe benefit tax regime could be the method for
calculating the taxable value of the fringe benefit. The regime assumes that the calculation
used to value the fringe benefit of a conventional vehicle correctly values the benefit of an
electric/hybrid vehicle. However, although the purchase price is higher, the running costs of
electric/hybrid vehicles tend to be lower than for conventional vehicles. By using the same
proportion of cost price (or book value), the calculation ignores these key differences.
145. Despite the expectation that the purchase price of electric vehicles will continue to fall over
time, it is unlikely that it will fall below that of conventional vehicles. This means that in the
future the potential for the tax calculation to overvalue the fringe benefit of electric/hybrid
vehicles will remain.
146. Where the tax regime overtaxes the fringe benefit of electric vehicles, this would have the
potential to distort vehicle choice in favour of conventional vehicles and away from
electric/hybrid vehicles. This brings a risk that the tax calculation will continue to potentially
overvalue and overtax the fringe benefit of electric/hybrid vehicles.
147. The options looked at to address this concern were:
option 7.1 – exempt electric vehicles from fringe benefit tax
option 7.2 – allow the fringe benefit tax on an electric vehicle to be calculated on the basis of
the cost price/book value of an equivalent conventional vehicle
Page 26 of 35

option 7.3 – review the basis for calculating the taxable value of the vehicle benefit for
electric/hybrid vehicles within the next 2 years.
Assessment of the options
148. If this measure is pursued, option 7.3 is preferred. This would remove any perception that
the fringe benefit tax regime is influencing companies to favour conventional vehicles over
electric/hybrid vehicles. It would also preserve and strengthen the existing policy settings of
the fringe benefit tax regime.
149. Tax officials note that this review work would have to be prioritised against other items on the
Government’s tax policy work programme. The timing of any review should also take into
account the likelihood of continued large variations in the cost structure of electric vehicles,
to ensure any amendment would appropriately reflect the benefit provided, over a longer
term.
150. Option 7.1 is not preferred as it would be inconsistent with New Zealand’s broad based tax
settings. It would also compromise equity goals by affording a tax advantage to those
companies and employees where an electric/hybrid company car is made available for
private use.
151. Option 7.2 is not preferred because it would also, although to a lesser extent, be inconsistent
with the current broad based tax settings and would compromise equity goals within the
current framework. Such a change would create a discrepancy between the effective
taxation of a fringe benefit vehicle and the equivalent cash remuneration.
Page 27 of 35
 Measure 8: Tax depreciation rates for electric vehicles
We recommend that you consider inviting relevant industry groups (for example, Drive Electric,
electric vehicle manufacturers) to discuss with tax policy officials the case for having higher
depreciation rates for electric vehicles. It would be expected that the industry would prepare an
economic case and support its arguments for a higher rate of depreciation for income tax purposes.
152. MRP and Zero Emission Vehicles Limited have suggested that government could consider
accelerated depreciation rates for electric vehicles. Currently electric vehicles are
depreciated at the same rate as passenger vehicles (30 percent (diminishing value) or 21
percent (straight line) over 5 years). Residual value for passenger vehicles is estimated at 25
percent of cost price.
153. We understand companies that calculate residual vehicle values are making low estimates
for electric vehicles (from $5,000 to $15,000) even though their original purchase price is
higher than similar conventional vehicles. This is likely to be because electric vehicles are
new to the market so there is a lack of information about their resale value and there is
uncertainty about durability, potential technological developments and battery life.
154. Lower than average residual values act as a further disincentive to fleet buyers by increasing
their overall fleet’s vehicle costs. The standard tax depreciation rate for passenger vehicles
is thus perceived as unfair, in part because they receive a poor return on investment. They
perceive that the total cost of ownership over a 5-year period will be higher for electric
vehicles, but they are unable to deduct the tax on the additional cost from their taxable
earnings annually. An accelerated tax depreciation rate for electric vehicles would therefore
help make them more cost-effective and competitive with conventional vehicles.
155. The impact identified by relevant industry groups is a question about the timing and value of
tax depreciation deductions rather than a permanent tax effect. When the asset is disposed
of, the Income Tax Act 2007 requires a wash-up to calculate if the relevant tax depreciation
rate has correctly spread the cost of the asset over its economic life.
156. Tax policy officials advise that proposals for accelerated depreciation would be inconsistent
with the Government’s revenue strategy, which supports a broad-base low-rate tax system
and generally avoids tax concessions. Keeping the tax bases as broad as practical
minimises the distortionary impact taxes can have on decision-making in terms of consumer
choice and decisions to produce goods and services. The primary function of the tax system
is to raise revenue to finance government expenditure in a fair and efficient way; its function
is not to encourage particular types of economic activity. If the Government wishes to
encourage a particular economic activity it is preferable for this to be done in a transparent
way by direct funding rather than through the tax system.
157. That said, the policy principle behind tax depreciation is that the deduction should match the
economic life of the asset. Within these parameters, and keeping in mind the principles of
New Zealand’s broad-base low-rate tax system, there may be a case to consider whether
the current tax depreciation rate that applies to the entire New Zealand passenger vehicle
fleet is appropriate for electric passenger vehicles.
158. Relevant industry groups (for example, Drive Electric, electric vehicle manufacturers) can
discuss their concerns with Inland Revenue directly. Industry would be required to make an
economic case for change, including a clear indication of the fiscal costs.
159. Depreciation rates for electric passenger vehicles are not administratively determined by
Inland Revenue and any work on this issue would need to be prioritised against other items
on the Government’s tax policy work programme.
Page 28 of 35
 Measures to be progressed outside of the package
160. We have assessed the following measures as having merit, but being more suitable for
progression over the medium-term as part of wider reviews within the relevant departments
or agencies.
Measure 9: Amending ACC levies for plug-in hybrid electric vehicles (PHEVs)
We recommend that this issue be deferred until there is a wider review of the NZ Transport
Agency’s annual vehicle licensing classification system.
161. The owners of PHEVs pay more in ACC levies than equivalent diesel or electric vehicle
owners. This is considered to be inequitable and a disincentive to ownership.
162. This anomaly results from the way in which ACC levies are collected as well as the way in
which PHEVs are classified by the NZ Transport Agency and ACC.
163. ACC levies are collected from vehicle owners either exclusively through annual vehicle
licensing (as is the case for electric and diesel vehicles), or through a combination of annual
vehicle licensing and the ACC motor vehicle levy placed on petrol. Under this system a
petrol driven vehicle pays a lower ACC levy as part of their annual vehicle licence compared
to a non-petrol driven vehicle (for example, pure electric and diesel vehicles), as they are
also charged an ACC levy at the petrol pump.
164. PHEVs are overcharged because they are classified as ‘non-petrol driven’ vehicles. Non-
petrol driven vehicles are charged a higher ACC levy as part of their annual vehicle licence
as it is assumed they do not pay a levy on petrol. However, as PHEVs may use petrol for
approximately 40 percent of their travel, they end up making additional ACC levy payments.
165. We estimate that (under the new ACC levy rates on petrol from July 2015) PHEV owners will
pay, on average, an additional $15 to $40 per annum in ACC levies beyond what other non-
petrol vehicle owners are paying.
166. This additional levy equates to a net cost to consumers of approximately $4,000 per annum
(assuming the 2014 level of PHEV ownership: 220 vehicles in the fleet).
167. Our preliminary modelling suggests PHEV numbers may increase to 2,600 or 0.07 percent of
the vehicle fleet in 2020. In this scenario, the cumulative cost of the additional ACC levy
would reach approximately $159,200 by 2020 (assuming 2015 prices and no increase in the
ACC levy rate on petrol or change in PHEV fuel economy).
Options
168. The options considered to address this anomaly were:
option 10.1 – defer this issue until there is a wider review of the NZ Transport Agency’s
annual vehicle licensing classification system
option 10.2 – undertake a review of the levy rate charged on PHEVs by ACC and amend if
necessary.
Page 29 of 35
 Assessment of the options
169. Option 10.1 is preferred. While there is an equity issue related to the overpayment by PHEV
owners, the cost involved in removing this anomaly is considerably greater than the
expected net benefit to consumers. ACC estimates that the one-off cost of changing the levy
rate charged as part of the annual licensing of PHEVs would be between $0.5 million and
$1.2 million. The NZ Transport Agency estimates that reclassifying PHEVs in the Motor
Vehicle Register would cost between $60,000 and $200,000.
170. The additional cost of the ACC payment to the individual PHEV owners is also unlikely to be
a disincentive to purchasing these vehicles as it is hidden within annual vehicle licensing
costs.
171. Should you wish to pursue option 10.2, the following steps would need to be taken.
171.1. You would need to write to the ACC Minister to request that ACC undertakes a
review of the PHEV levy rate.
171.2. Should ACC consider it appropriate to amend the rate charged on PHEVs, both ACC
and the NZ Transport Agency would need to collaborate to design an operational
policy to identify, classify, and charge PHEVs with a new levy.
171.3. You would need to write to the NZ Transport Agency Board requesting that they
direct the Agency to collaborate with ACC in this process.
172. Note that ACC and the NZ Transport Agency would need to develop this operational policy
prior to June 2015. ACC need to consult on levy changes before seeking Cabinet approval
and the next cycle of consultation is set for August 2015. Missing this deadline would delay
consultation until the 2017 consultation cycle, or necessitate an out-of-cycle consultation,
which would in turn increase the cost of this process.
Page 30 of 35
 Measure 10: A road user charges (RUC) rate for plug-in hybrid electric vehicles (PHEVs)
We recommend that officials investigate setting a RUC rate for PHEVs shortly before any RUC
exemption is due to end.
173. When the RUC exemption ends, PHEVs will have to pay RUC as well as FED on any petrol
used. They could apply for a refund of FED, but the burden of doing so may be a
disincentive for uptake of PHEVs, and increase the NZ Transport Agency’s administrative
costs. We can investigate setting a RUC rate for PHEVs shortly before any RUC exemption
is due to end.
Page 31 of 35
 Measure 11: Removing battery import duties
We recommend that this issue be considered in the context of New Zealand’s participation in the
Environmental Goods Agreement negotiations at the World Trade Organization. We will continue to
work with the Ministry of Foreign Affairs and Trade (MFAT), MBIE and the New Zealand Customs
Service to establish the impact of any future changes to the tariffs on electric vehicle batteries
174. New Zealand has joined 17 other World Trade Organization members (including China, the
European Union, Japan and the USA) in negotiations towards an Environmental Goods
Agreement in the World Trade Organization context.
175. The possible inclusion of electric vehicles in any final Environmental Goods Agreement
outcome may have a noticeable impact on the global uptake of electric vehicles through
faster and deeper cost reductions, for not only electric vehicles but also associated
technology including batteries and charging infrastructure.
176. Replacement batteries for electric and hybrid vehicles are subject to a 5 percent import duty,
which may add to battery replacement costs for owners. This duty represents a relatively
small component of the cost of replacing a battery, but any reduction in battery replacement
cost would ‘nudge’ consumers to consider electric vehicles as an affordable option.
177. The 5 percent import duty is in place to assist New Zealand manufacturers of batteries.
Though such domestic manufacturers appear to no longer exist, Cabinet has agreed that the
rate remains in place until 30 June 2017.
178. MFAT advises that import duties on replacement batteries for electric vehicles continue to
play an important role as negotiating coin in the context of trade negotiations, particularly the
negotiations towards an Environmental Goods Agreement.
179. MFAT is opposed to any unilateral action to reduce import duties on replacement batteries.
Import duties on a range of environmentally friendly technologies, including electric vehicles
and replacement batteries, may be reduced in accordance with an eventual Environmental
Goods Agreement outcome, assuming that these technologies are part of the final package.
180. Further analysis is required on the impact of tariff duty on imports of replacement batteries
for electric vehicles, noting that in 2014, 98 percent of the $12.8 million trade in lithium-ion
batteries entered free of tariff duty.
181. We will continue to work with MFAT, MBIE, and the New Zealand Customs Service to
establish the impact of any future changes to the tariffs on electric vehicle batteries.
182. We consider this the preferred way forward. Given the removal of duties requires Cabinet
approval, it would be preferable to have the input and support of relevant departments and
ministers.
183. MBIE advises that if the recommendation is to put in place a new tariff concession scheme,
this process would take approximately 4 months (this includes the policy development
process).
Page 32 of 35
 Measure 12: A feebate scheme to encourage purchase of low emission vehicles
We recommend that feebates not be pursued as a measure for encouraging the uptake of electric
vehicles. We recommend that feebates should be further investigated as a mechanism for reducing
GHG emissions across the vehicle fleet as a whole.
184. Feebate schemes reward purchasers of low emission vehicles with a rebate on the purchase
cost while vehicles with higher emissions are charged a fee.12 We previously advised that
feebates could be a way to provide a subsidy to purchasers of electric vehicles without
imposing a cost on government, as the fees charged to higher emissions vehicles can fund
the rebates to lower emissions vehicles.
185. Feebates reward the consumer ‘up front’ for future cost savings and related long-term
societal benefits of reduced GHG emissions. Feebates aim to improve vehicle emissions
performance across the vehicle market rather than incentivising electric vehicles
per se.
186. Feebates have been implemented in France, and feebate-like systems are in place in other
areas such as the Netherlands and California. Evidence suggests the French and Dutch
systems have been effective in achieving reductions in GHG emissions from new vehicles,
but the impact on the uptake of electric vehicles is less clear. In France, uptake of electric
(both pure electric and PHEVs) and hybrid vehicles is low (3.4 percent of the new vehicle
market in 2013). In comparison, in other markets the uptake of the three classes is higher
(for example, Japan with 21 percent of all new vehicles in 2013, Norway with 12.8 percent,
the Netherlands with 11.3 percent, and California with 10.3 percent).
187. After further analysis we conclude that feebate systems are unsuitable solely as a
mechanism to encourage the uptake of electric vehicles. International studies have found the
major impact of feebates is to incentivise improved emissions performance of existing
vehicle models, rather than achieving a shift in the models purchased. Increased uptake of
electric vehicles may be an indirect effect of feebates. However, the costs of establishing a
feebates scheme solely to encourage electric vehicle uptake would outweigh the benefits (if
that was measured in terms of additional electric vehicles being purchased).
188. While we do not recommend that feebates pursued as a measure for encouraging the
uptake of electric vehicles, we consider feebates should be further investigated as a
mechanism for reducing GHG emissions across the vehicle fleet as a whole. We note that
feebates are reported to be a relatively simple way to begin reductions in fuel consumption
and GHG emissions in countries that have not yet developed programmes for this purpose.
We intend to provide analysis in further advice to you scheduled for May 2015.
12 The rebate/fee would be applied at the time the vehicle is first registered.
Page 33 of 35
 Measure 13: Recognition of alternative low emission vehicle designs
We recommend that changes to the regulatory framework for recognising alternative vehicle
designs not be pursued as a measure for encouraging the uptake of electric vehicles. However, this
issue should be further investigated as a mechanism for reducing GHG emissions across the
vehicle fleet as a whole.
189. One approach car manufacturers have taken to reduce the price of electric vehicles, and to
make them travel further on a standard battery charge, is to make the vehicles smaller and
lighter than traditional cars. New Zealand road safety standards and classifications, however,
prevent a number of smaller electric vehicles from operating on our roads.
190. A number of alternative low emission vehicles can legally be used in Europe and Japan, but
not in New Zealand. For example, the French manufacturer Renault makes a vehicle called
the Twizy. This vehicle gets acceptable ratings in the European New Car Assessment
Programme crash testing, but cannot be used in New Zealand as it does not meet existing
vehicle classifications. Google’s proposed small driverless car would also not be able to be
used in New Zealand as it falls outside our current standards.
191. Currently, there may be ways to resolve these issues within the regulatory framework13, but it
is not clear whether this is an efficient or robust method for assessing alternative low
emission vehicles.
13 For example, the NZ Transport Agency is able to “declare that a vehicle is a mobility device or is not a motor vehicle” in
certain cases. The NZ Transport Agency exercised this power to declare Yike Bikes (a small folding electric motorbike
made in New Zealand) not to be motor vehicles in September 2014.
Page 34 of 35
 Measures that were not considered worth progressing
Measure 14: Lower registration and annual vehicle licensing fees for electric vehicles
Measures that were not considered worth progressing
Measure 14: Lower registration and annual vehicle licensing fees for electric vehicles
We recommend that no change to registration fees be considered, given first registration fees are
currently differentiated on motor size. We also recommend that annual licensing fees not be
differentiated to favour better performing vehicles as adjustments to existing fees would not provide
sufficient economic value to act as an incentive.
192. The Sustainable Business Council suggested fees for first registration of vehicles favour
better performing vehicles. As with annual licensing fees, the bulk of the fee payable at first
registration is the ACC levy. The next highest component of the fee payable is the
registration fee, which is currently differentiated on motor size.
193. Most passenger cars (between 1301 to 2600 ccs) are charged $112. We understand the first
registration fee payable by an electric vehicle would be around $90.
194. The effectiveness of this option may be limited by the relatively small one-off cost of
registration compared to the purchase price of the vehicle. However, given on-road costs are
advertised at the point of purchase, this would likely have a nudge effect on consumers.
195. The Sustainable Business Council also suggested that the fee for annual licensing
(commonly known as ‘registration’) of vehicles be structured so that better performing
vehicles are charged less.
196. The bulk of the annual licence fee charged to motorists is the ACC levy. The licence fee itself
only amounts to $43.50 (excluding GST). Given its low value, any adjustment of this fee to
reflect vehicle performance would be a very weak incentive to purchasers.
Measure 15: GST exemption for second-hand electric vehicles
We do not recommend further consideration of a GST exemption for electric vehicles.
197. MRP suggested a GST exemption be provided for second-hand imported PHEVs to
incentivise their importation to New Zealand over Australia. We note that New Zealand has a
broad based tax system under which GST is applied at the same rate to all goods and
services. Exempting individual items from GST does not align with government policy and
has not been provided for other consumer items.
Page 35 of 35