
 Auckland Transport
Auckland light rail peer review -
Part B: options and assessment
(Draft 2)
21 July 2015
N207/Rep/1553
Ian Wallis Associates Ltd
[email address]
link to page 3 link to page 4 link to page 11
Ian Wal is Associates Ltd
Contents
1. INTRODUCTION ............................................................................................................................... 3
2. OPTIONS AND ASSESSMENT - PEER REVIEW .................................................................................. 4
ANNEX A: Study Objectives ................................................................................................................... 11
IWA/N207/Rep/1553
21 July 2015
2
Ian Wal is Associates Ltd
1. INTRODUCTION
This paper has been prepared for Auckland Transport by consultants Ian Wallis Associates (IWA), as
part of a peer review of AT’s proposals for a light rail network for Auckland.
The paper is one of three papers prepared by IWA for this peer review.
This paper (B) is concerned with
options and their assessment. Specifically it addresses the following
aspect of the peer review task:
“…
the reliability of the options analysis results against the achievement of the
study objectives, including whether there are further viable options that could be
considered and appropriateness of the MCA for the purpose used – to identify the
broad strategic option for further development.”
For conciseness, our review of this aspect is provided in tabular form, within the following sections:
• A: Project Purpose and Objectives
• B: Problem Definition
• C: Range of Options Considered
• D: Selection of ‘Short’ List Options
• E: Framework for Option Assessment
• F: Assessment Objectives and Criteria
• G: Assessment Scoring Methodology
• H: Assessment Scoring Application
• I: Approach to Assessment Weightings (and Sensitivity Tests)
• J: Summary of Option Assessment Findings.
The other two papers in this peer review set cover the fol owing aspects of the AT proposals:
Paper A: Robustness of the deficiency analysis. This paper focuses on demand and capacity analyses
regarding the maximum number of buses that can practically and reliably be accommodated on main
routes in the isthmus and city centre.
Paper C: Cost estimates. This paper reviews the estimates of LRT infrastructure costs, vehicle capital
costs and operating costs for the LRT proposals relative to the costs for the bus-based base case.
IWA/N207/Rep/1553
21 July 2015
3
link to page 4 link to page 4
Ian Wal is Associates Ltd
2. OPTIONS AND ASSESSMENT - PEER REVIEW
Summary of AT Work Undertaken
Peer Review Comments
A. Project Purpose and Objectives
We were advised by AT
1 that the
purpose for this • We note the ‘two-pronged’ nature of this purpose
(CCFAS2) project has been defined as fol ows:
statement, ie focusing on: (i) providing an effective
“
Provide an effective transport solution for those
transport solution for inner Auckland that supports
parts of inner Auckland and the City Centre that
growth requirements; and (i ) maintaining the
cannot be served by the heavy rail network, with
amenity of the city centre streets, in particular in the
CRL; that supports growth requirements in a way
light of the prospect of an increased number of
that maintains or enhances the quality and capacity
buses on these streets to cater for future public
of the City Centre streets; and thereby resolve the
transport demand.
outstanding issues identified in CCFAS including the • Taken at face value, these objectives/sub-objectives
impact of a high number of buses on urban
are consistent with the ‘two-pronged’ (‘balanced’)
amenity.”
statement of project purpose: objective 1 focuses on
economic development; objectives 2 and 3 on
AT also advised that six
objectives had been set for
transport system accessibility and efficiency
the project, in summary as fol ows (full in/around the city centre; objective 4 on
objectives/sub-objectives set out in Annex A):
sustainability and environmental impacts of the
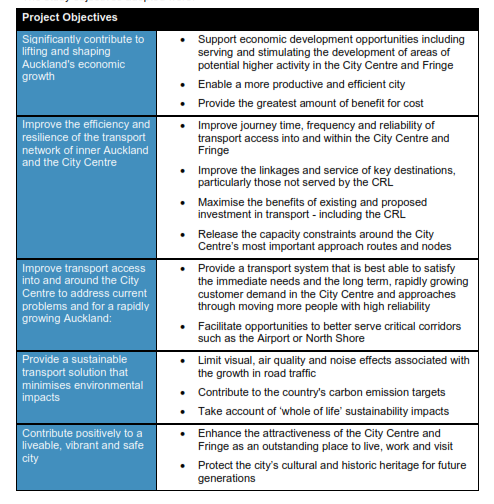
1. Significantly contribute to lifting and shaping
transport system; objective 5 on city ‘liveability’,
Auckland’s economic growth
including restraining transport costs and congestion
2. Improve the efficiency and resilience of the
levels; and objective 6 on implementability and
transport network of inner Auckland and the
‘stageability’.
City Centre.
• However, we note that, in interpreting these
3. Improved transport access into and around
objectives, the further advice from AT indicates a
the City Centre to address current problems
somewhat different balance between the objectives
and for a rapidly growing Auckland.
– focusing primarily on city ‘liveability’ and amenity
4. Provide a sustainable transport solution that
of the city central area.
minimises environmental impacts.
• This direction wil clearly have implications for the
5. Contribute positively to a liveable, vibrant and
option assessment framework and criteria (as
safe city.
discussed in a later section).
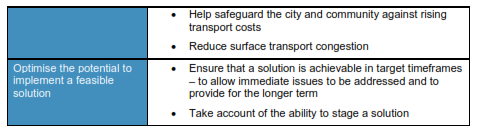
6. Optimise the potential to implement a feasible
solution.
In relation to the stated project purpose and
objectives, we were further advised by AT
2 as
fol ows:
“
You wil see the emphasis given (in the project
purpose) to urban amenity. In this context I can
confirm that achievement of objectives 4 and 5 is
given particular weighty in accordance with the
guidance of the AT executive. Objective 1 should
also be understood to have an amenity dimension –
we understand that enhanced economic activity in
the City Centre is not seen as likely to occur unless
the aesthetical qualities improve.”
B. Problem Definition
The definition of the problem that this project is • We note that the ‘problem definition’ as outlined
intended to address is essential y summarised in the
in the Jacobs’ Deficiency Analysis paper is entirely
based on a ‘do minimum’ transport scenario for
year 2046: this Do Min case includes CRL and the
1 Email John Al ard to Ian Wallis, 20 July 2015.
2 Ibid.
IWA/N207/Rep/1553
21 July 2015
4
link to page 5 link to page 5 link to page 5
Ian Wal is Associates Ltd
CCFAS2 ‘Deficiency Analysis’ paper prepared by the
new bus network, but otherwise minimal changes
AT Project Team
3.
to the existing PT system. Its estimation of future
That paper focuses on the transport issues and
bus service levels is based on continuing to use
problems expected to occur in the southern
‘standard’ size buses (c. 50 passenger capacity) in
corridor and the central area over the period to
the corridors of interest, despite the use of much
2046. Its analyses are based primarily on transport
larger capacity vehicles elsewhere in AKL. Thus it
model ing using the APT model. Its findings on these
paints a ‘worst case’ picture of the number of
issues and problems are summarised as fol ows:
buses in future – which, prima facie, could be
“In summary, the deficiency analysis for CCFAS2 has
substantial y improved upon by use of a smal er
highlighted that capacity on public transport bus
number of larger (eg double-decker) buses. Its
services is likely to be a real issue, particularly as
results need to be interpreted in that light.
they near the City Centre and then within the City
Centre itself. The problem of delivering sufficient
capacity is already evident by 2026 on some services
and corridors and by 2046, nearly twice the number
of buses currently operating would be required to
meet the demand for travel by bus. The central
isthmus is the main area where issues are evident as
services entering the City Centre at Symonds Street
struggle to cope with demand and Symonds Street
itself wil struggle to cope with the required bus
volumes beyond the very early 2020s.”
In regard to issues relating to the amenity of the City
Centre area as affected by transport, a separate
report was prepared, focusing on the ‘amenity
capacity’ of central area streets in terms of bus
volumes.
4 Arguably, a more balanced summary of the
problems is provided in a recent AT document
5:
•
Increasing congestion in the City Centre is
reducing urban amenity and liveability.
•
Constrained access to the City Centre wil
limit economic growth and reduce the
region’s productivity.
•
Inefficient use of city centre street space
wil restrict accessibility, mobility and the
city’s economic competiveness.
C. Range of Options Considered
The main outcome of the long list review workshop • We have reviewed the paper summarising the
[10 Oct 14, AT34] was the selection of five suburban
findings from the long list workshop and have no
routes for further assessment (Dominion, Manukau,
issues with selection of these five suburban
Sandringham, Mt Eden, Remuera Roads). A variety
routes/corridors and options for their extension
of city centre streets/ corridors were also in/through the CBD. We note that these options are
nominated as providing potential routes for described in various places as 'Long list options',
operation of the suburban services in/through the
although arguably at that stage they were no more
CBD.
than specifications of potential corridors/roads to
be used rather than future network or service
options.
3 CCFAS2 – Deficiency Analysis (ref ZB01598), Jacobs for AT, 9 January 2015.
4 Built Environment and Amenity Technical Paper (draft), Jasmax for AT, November 2014. [IWA 65]
5 LRT Technical Advisor RoI (ref 303-15-791-PS), AT, July 2015.
IWA/N207/Rep/1553
21 July 2015
5
Ian Wal is Associates Ltd
D. Selection of ‘Short’ List Options
Fol owing the long list review work (as above), AT • While a multitude of 'short' list options could be
prepared a Short List Summary Paper [13 Feb 15, AT
defined, consistent with the outcomes from the long
61.1]. This paper
“developed a short list of 10
list review workshop above [AT 34], we consider
network options that would enable a range of
that the 10 short list options defined are likely to
combinations of modes to be evaluated”. Of these
have covered the range of more promising options
10 options, five are focused on LRT (involving
(recognising that the options might be further
different combinations of the five suburban refined in the subsequent stages of the study).
corridors identified earlier), two involve bus on-
• However, we note that we have not identified any
street (using double-decker buses), one involves
written material that explains and justifies the
BRT (predominantly on-street), one involves a
selection of these 10 options from the wide range of
combination of heavy rail and bus, and one a
possibilities: this short list assessment is a significant
combination of heavy rail and LRT. The five LRT
step in the overal study and should be appropriately
options al involve different combinations of the five
documented. We also note that while five LRT-based
suburban corridors identified earlier, and al would
options were included in the short list, only one of
run into the CBD via Queen and/or Symonds
these options was 'mirrored' by a corresponding
Streets.
BRT-based option - whereas there appears to be no
reason why the other four LRT options were not
similarly 'mirrored'.
• We further note that, in the specification/discussion
of the options, the aspect of bus capacity gets only
brief mention. Our understanding is that: the Do
Min option is based on ‘standard’ size buses; options
1, 2 and 3 involve double-decker buses; other
options (including the BRT option 7) most likely
involve standard size buses (although this is
unclear). Given the demand forecasts for 2046, we
would have expected that the main bus routes in al
options would be operated by double-decker buses.
E. Framework for Option Assessment
A multi-criteria analysis (MCA) approach was taken • We support in principle the use of the multi-criteria
to the comparative assessment (evaluation) of the
analysis (MCA) framework for the study’s
10 ‘short list’ options. This involved [refer AT27, 23
comparative assessment of options against the
Dec 14]:
range of objectives. However, we have considerable
• Specification of objectives (8).
concerns relating to some of the details of
• Specification of criteria relating to each application of this framework, as noted in the
objective (over 50 criteria in total, within the
fol owing sections.
8 objectives).
• We note that the MCA application in this case is
• For each criterion, specification of an more ambitious and complex than most such
appropriate measure and the data source for
applications, in terms of having:
this measure.
o A relatively large number of objectives (8)
• Specification and then application of a relative
o A relatively large number of criteria (> 50),
rating scale (2, 1, 0, -1, -2) for rating the
many of which significantly overlap (hence may
performance of each option against each
result in double-counting) and some of which
criterion.
contradict others.
• Selection and application of weightings for
o A relatively large number of options (10) to be
each objective and the criterion within the
compared
objectives, and hence derivation of the • We have been unable to identify any statement as
weighted sum score for each option under
to the role of the MCA, potentially as part of a wider
each set of weights.
assessment of the most promising options – which
• Drawing conclusions from these results on the
would be expected to include a business case
relative performance of the options, and the
analysis, including an economic appraisal. By
sensitivity of the performance results to a
default, the impression is given that the MCA
range of weighting assumptions.
assessment comprises the
total assessment of
IWA/N207/Rep/1553
21 July 2015
6
link to page 7
Ian Wal is Associates Ltd
options, rather than only a component of a wider
assessment process.
F. Assessment Objectives and Criteria
The assessment (evaluation) framework has eight • The eight objectives used in the assessment differ
‘objectives’. Six of these relate to ‘benefits’ - of
from the six study objectives defined earlier (refer
which three relate directly to transport (city centre
Annex A). One reason is that an additional objective
access, city centre mobility, regional movement),
(cost) has been included for assessment purposes,
two to environment and one to economic but was not included in the original objectives. .
performance. The seventh objective relates to • Apart from that, there is only a broad
implementation and the eighth to cost aspects.
correspondence (no more) between the other seven
assessment objectives and the six project objectives.
Further, there is no clear correspondence between
the assessment criteria and the project sub-
objectives. We cannot see any good reason for these
differences, particularly at the top (objective) level,
and have not identified any documentation to
explain the reasons.
• Further, we note that the eight assessment
‘objectives’ are not couched in ‘objective terms’, but
are merely topic heading in the spreadsheet
analyses.
• We note that, of the eight objectives, seven are
essential y measuring ‘benefits’ (to transport users,
the community, the environment, etc) while only
one is measuring ‘costs’ (to the public sector).
Within the eight objectives, over 50 assessment • The > 50 criteria is a relatively large number for such
criteria are specified. For each objective, a
assessments, and tends to give rise to issues of
corresponding measure is defined along with the
double (or triple) counting and interpretation. For
data source to be used in measuring performance.
example, criteria 1.02, 1.04 and 1.07 appear in part
to double-count similar effects, and in part to point
in contradictory directions. We have not attempted
to review/critique every individual criterion and its
associated measures.
G. Assessment Scoring Methodology
The assessment scoring is set out in two main • The ‘Do Minimum’ should be defined somewhere
spreadsheets [AT27, Evaluation framework v O9,
(we have not sighted any definition). We are unclear
sheets ‘Assessment’ and ‘Scored version’]. It
whether the Do Min is a realistic option over the
involved ranking (rating?) performance against
longer-term (eg 2046): if not, we suggest it should
each criterion on a relative scale, comparing every
be replaced, as the assessment base case, by a
option against the Do Minimum case. The rating
minimum cost variant that would be realistic
scale used was +2, +1, 0, -1, -2, using only integer
(maybe this is option 1?)
6
scores and where the Do Minimum was scored 0 • We have seen no statement as to the ‘assessment
(zero) in al cases.
year’ adopted but assume it is 2046, representing a
medium/long term year for which model estimates
are available and by which the full scheme is
assumed to have been implemented.
• The 5-point assessment scale is relatively crude for
a project of this type: a 7-point scale may be worth
consideration.
• Where quantitative assessments are possible/
available against criteria, it would be helpful to
include these in the assessment. Then, as required,
they can be also expressed in terms of points
6 AT advises that option 1 is being used as the ‘base case’ for economic assessment purposes in work currently in progress.
IWA/N207/Rep/1553
21 July 2015
7
Ian Wal is Associates Ltd
(usual y assuming a linear relationship between the
quantified estimates and the corresponding point
scores). This wil give more confidence that relative
performance figures (e.g. out of the transport
model) are being reflected consistently in the rating
scores.
• The above point is considered especial y important
in the case of the cost objective. It is not readily
apparent to people examining the results that the
total cost range between the options is very
substantial, probably in the order of $2.0 bil ion (PV
terms) over the economic life of the project. This
significant amount (of similar order to the total costs
of CRL) tends to get lost in the way that the
assessment results are presented.
H. Assessment Scoring Application
Each option was assessed against each criterion on • We have not attempted to review the awarded
the 5-point scale (relative to Do Min = 0). The Excel
scores in any detail. However, we do have some
worksheet [AT27, Assessment] sets out the scores
reservations from the limited checks made (noting
awarded with a brief comment as to the basis for
that no two parties are ever likely to agree
them.
completely on the relative merits of options against
al criteria).
• To review the assessment findings on the relative
merits of BRT v LRT, we specifical y compared option
5 (ful LRT network) and option 7 (ful BRT network).
A view quite often expressed is that anything an LRT
solution can achieve, an equivalent BRT option can
also achieve, but at significantly lower total costs
(capital and operating, in PV terms). This review
found that, according to the assessment results,
option 7 performs substantial y worse than option 5
against most objectives (1, 2, 4, 6 and 8). In
‘unweighted’ terms (al objectives weighted equal y,
and al criteria within any objective weighted
equal y) option 7 performs no better than option 1
(double decker buses, on-street operation). We find
these relative results somewhat unlikely, which
raises more general concerns about the assessment
scoring and weightings applied (refer fol owing
section).
• We also note that, under the base assessment (all
objectives given equal weighting), the 10 options fal
into two groups: options 1, 2, 3 and 7, with weighted
sum scores in the range -0.6 to 0.7; and the other six
options, with weighted sum scores considerably
higher, in the range 1.7 to 2.8. We observe that al
six high-scoring options are focused on LRT mode;
whereas the four lower-scoring options are focused
on bus mode (with one including a limited heavy rail
extension, Mt Roskil Spur). The conclusion that may
well be taken from this scoring is that, for the area
under study, LRT-based PT
is very considerably
superior to bus-based PT services on the assumption
that
al objectives are equal y weighted. This result
is somewhat surprising in our view.
IWA/N207/Rep/1553
21 July 2015
8
Ian Wal is Associates Ltd
I. Approach to Assessment Weightings (and
Sensitivity Tests)
Our understanding is that the ‘base’ assessment (A) • The results we have inspected [AT27, v9: Scored
results give equal weight to each objective (ie a one-
version] appear to be identical for equal and
point score difference between options is given the
unequal criteria weightings (ie assessment (B) is
same weight across all objectives); and also equal
identical to (A), (D) identical to (C). This suggests
weight to al criteria within any objective.
that the unequal criteria weightings have not been
Sensitivity tests have also been undertaken on the
applied in practice.
weighting of objectives and criteria, adopting:
• The main changes in objective weightings for (C) and
(B) Equal objective weighting, unequal criterion
(D) compare with (A) and (B) are that two objectives
weighting
(Environment, Cost) are down-weighted (to 5%
(C) Unequal objective weighting, equal criterion
each), while three objectives (city centre access, city
weighting
centre mobility, economic performance) are up-
weighted (to 20% each). However, we note that this
(D) Unequal objective weighting, unequal re-weighting of objectives has resulted in very little
criterion weighting.
change in the relative rankings of the ten options.
• It was noted in the first section of this table that AT’s
intention was to give particular weight to the project
objective 4 (‘a sustainable transport solution that
minimises environmental impacts’) and objective 5
(‘significantly contribute to lifting and shaping
Auckland’s economic growth’). In our
interpretation, project objective 4 best corresponds
to assessment objective ‘Environment’ and
objective 5 to ‘Built Environment’. But, in the
sensitivity testing for objective weightings,
‘Environment’ has been sharply down-weighted
(from 12.5% to 5.0%) and ‘Built environment’ has
been marginal y down-weighted (from 12.5% to
10.0%). Our conclusion is that the current sensitivity
tests do not reflect the relative importance of the
various project objectives as advised by AT
management.
• We have a substantial concern about the relative
weightings adopted between 'benefit' objectives
and criteria and 'cost' objectives and criteria (refer
item F above). The current base objective
weightings (A) result in a weighting for 'benefit'
objectives against cost objectives of 87.5%: 12.5%;
while the reweighted objectives result in a ratio of
95%: 5%.
• We note that, for a project of this nature,
conventional economic evaluation typical y shows a
broad comparability between the magnitude of
benefits and the magnitude of costs (i.e. a BCR ratio
in the order of 1.0). This would suggest that, from a
socio-economic perspective, the appropriate
balance between benefit objectives (in total) and
cost objectives would be expected to be in the order
of 50%: 50%. It would be of interest to examine the
results of sensitivity tests on these lines.
• Indicatively, we note that the cost range between
the 10 options is likely to be in the order of $2 bil ion
(capital and operating, PV terms, over the project
life). This cost range would equate to a difference of
two rating points (-2 compared with 0) on the cost
IWA/N207/Rep/1553
21 July 2015
9
Ian Wal is Associates Ltd
objective, i.e. around $1.0 bil ion per one rating
point difference. We suggest that some thought be
given to the 'value' (in wil ingness-to-pay terms) that
society might reasonably give to a score difference
of one rating point on each of the seven 'benefit'
objectives. If this value is considered to be
significantly lower than $1 bil ion, then this benefit
objective should, logical y, be given lower weighting
than the cost objective; or vice versa if the value is
considered to be higher. It would also be worth
considering a similar question for al the 'benefit'
objectives combined: the logic of weighting al
objectives equal y, as has been done at present, is
that a one point higher rating across al of the
benefit categories would be worth in the order of
seven times the $1.0 bil ion per point cost advantage
on the cost objective.
• We suggest that the treatment of the cost objective
in the MCA evaluation needs re-consideration, with
a choice between:
(i) re-assessing the weighting to be given to the cost
objective, in the light of the above comments; or
(i ) not attempting to include the cost objective in
the MCA, but addressing the costs v benefits
trade-off separately (eg in the economic case
assessment).
The present approach is a very unsatisfactory solution.
J. Summary of Option Assessment Findings
The MCA findings indicate (based on the objectives, • In regard to point (i), while ‘real-world’ experience
criteria and scoring system used):
indicates some advantages for LRT-based solutions
(i) a strong superiority for al the LRT-based
over bus-based solutions in similar situations, it
options over the bus-based options. They also
would general y suggest a closer balance between
indicate a similarly strong superiority for the
the two types of solutions than is indicated by the
LRT-based option 5 over the BRT-based option
MCA results.
7: apart from the mode/technology involved, • In regard to point (i ), we find that the sensitivity
these two options are very similar in terms of
tests undertaken are not consistent with the advice
route, network, services, etc.
provided by AT management on the relative
(i ) The ordering of options is very insensitive to the
priorities of the various objectives.
different criterion weightings tested.
• In regard to point (i i), we find that the attempt to
(i i) The ordering of options is very insensitive to
include the cost objective in a framework otherwise
major changes in their relative costs.
including only ‘benefit’ objectives has not been
successful or helpful. We suggest that further
consideration needs to be given to this, with one
option being to exclude costs from the MCA
assessment and to address cost v benefit trade-offs
elsewhere (eg in the economic case).
IWA/N207/Rep/1553
21 July 2015
10
Ian Wal is Associates Ltd
ANNEX A: Study Objectives
(
Source: Light Rail for Auckland: Potential Peer Review – Terms of Reference).
IWA/N207/Rep/1553
21 July 2015
11
Document Outline