 E.81
E.81
CAPITAL & COAST DISTRICT HEALTH BOARD
Annual Report 2014/2015
CONTENTS
Chair and Chief Executive’s foreword ……………………………………………………………. .2
Strategic Direction …………………………………………………………………………. ……………. .4
About CCDHB ……………………………………. …………………………………………………………. .5
Governance of CCDHB ………………………………………………………………….………………….7
Board Strategy ………………………………………………………………………………………………. .8
Board and Committee Meeting Attendance…………………………………………………. .10
Our People …………………………………………………………………………………………. …………11
Performance Highlights ………………………………………………………………………………….15
Minister’s Health Targets ………………………………………………………………………………. 16
Impacts and Outcomes …………………………………………………………………………………. 19
Statement of Performance ………………………………………………. …………………………. 36
Statement of Responsibility ……………………………………………………………….………. …52
Independent Auditor’s Report ………………………………. . ………………………….………. 53
Financial Statements …………………………………………………………………………. ….……..56
CCDHB postal address:
Private Bag 7902, Wel ington South
Wellington Hospital physical address:
Riddiford St, Newtown
Wel ington 6021
Website: www.ccdhb.org.nz
Phone: 04 385 5999 | Fax: 04 385 5856
COMMS: 00008-1510
Capital & Coast DHB Annual Report 2014/2015 - Page 1
 CHAIR AND CHIEF EXECUTIVE’S FOREWORD
It is a pleasure to present Capital & Coast District Health Board’s (DHB) Annual Report for the year 1 July
2014 to 30 June 2015. This report provides a summary of our successes and progress against our key
performance measures and a detailed account of how the health funding we received has been managed.
The DHB has had a busy and successful year providing quality care and continuing to improve health
outcomes for our population. There have been numerous successes and learnings in the past year.
We achieved our financial target of a $4m deficit. This is the second year the DHB has achieved its budgeted
result and is a direct result of hard work and focussed effort by staff right across the organisation.
This year we established a medical day ward at Kenepuru Hospital, building work began for the new national
secure youth forensic inpatient mental health service and we opened four additional spaces at the Kenepuru
dialysis unit. We also invested in new technology, including installing electronic whiteboards and a suite of
other tools to enable us to better respond to and plan for the flow of patients through hospital services.
We met our elective target which has meant nearly 9,000 people have had access to publicly funded elective
surgery in the past year. An area of focus is improving access to orthopaedic surgery and this year we
invested $3 million to increase our orthopaedic theatre capacity at Kenepuru Hospital. We were also one of
only a few DHBs in the country to achieve the 95 per cent immunisation target for 8 month olds. This is a
really important preventative health target and has been accomplished by working collaboratively with our
local primary health organisations.
During the year, following intense consultation, the Wairarapa, Hutt Valley and Capital & Coast DHB mental
health, addiction and intellectual disability services combined. This is a flagship innovation for New Zealand
and the integrated service means clients have access to the same services, irrespective of where they live.
Capital & Coast DHB Annual Report 2014/2015 - Page
2


In the community we are working hard to develop clinical care pathways for common medical conditions to
improve our patient’s journey through the health system, the role of primary care clinicians continues to
expand so more care can be provided closer to people’s homes and all but one of our general practices in
the region are now providing free GP visits for children under 13. We also agreed to integrate our
community and hospital laboratory. The new service will see laboratory equipment upgraded in the region
which will improve patient experiences, turnaround times, and access to tests results.
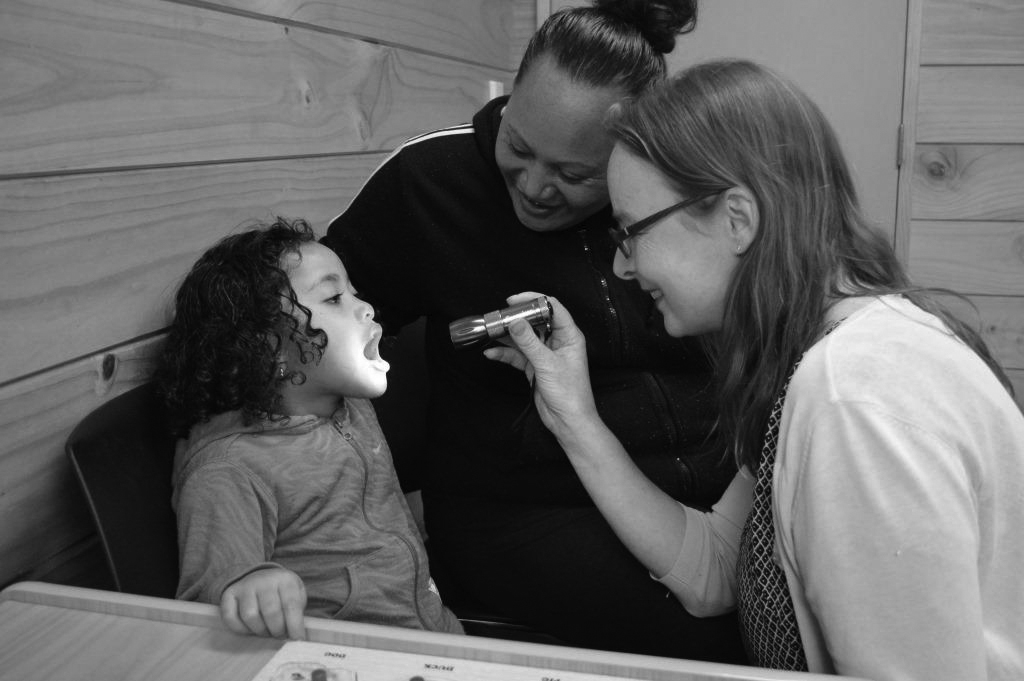
Through the Porirua Social Sector Trial the number of children enrolled with the oral health service has
increased by carrying out a data matching process between health providers. Within Porirua the number of
pre-schoolers enrolled with Bee Healthy Regional Dental Service has increased, notably in the Māori and
Pacific populations. This enrolment initiative will be carried out in Wellington, Kapiti and Hutt Valley.
There have been several other initiatives through the Porirua Social Sector Trial which are making a real
difference to the health and wellbeing of people living in this community. Every child from Porirua who
presents to the emergency department with asthma is fol owed up by the Porirua Asthma Service, there is
additional support for families going through the court process and soap and tissues are being provided to
schools to help support and promote good hygiene.
We continue to respond to the changing needs of our ageing population. Fol owing visits from Professor Ian
Sturgess, a geriatrician and quality improvement specialist from the UK, we have made further
improvements to the way we care for the frail elderly. Work is happening in both the community and
hospital which has resulted in better coordination of services across community, primary care and hospital
settings and the average length of stay in hospital for this vulnerable group of people is reducing.
The on-going commitment to training our workforce; both present and future, remains a key driver to our
success. Over the course of the last year, over 1000 students or trainees spent time at our DHB as part of
their studies. There are also many links across the organisation into each of the four universities in and
around Wellington, as well as across New Zealand.
Quality and safety is a priority in everything we do. We actively support national patient safety campaigns
and are committed to preventing patient harm such as reducing the number of patients who have fal s while
in hospital. On occasion we do get things wrong; however we learn from these mistakes and change the way
we do things to avoid it happening again in the future.
We would like to take this opportunity to thank our staff and our health and social service sector partners
for their contribution in the past year and on-going commitment to improve the health of our region.
Dr Virginia Hope MNZM
Debbie Chin
BOARD CHAIR
CHIEF EXECUTIVE
Capital & Coast DHB Annual Report 2014/2015 - Page
3
STRATEGIC DIRECTION
OUR VISION
Better health and independence for people, families and communities.
We understand we must work with our communities to help reduce disparities in health status and reduce
the incidence of chronic conditions amongst our population while increasing the independence of the people
in our district. To achieve our health goals, we have developed a range of specific strategies which include:
o focusing on people through integrated care
o supporting and promoting healthy lifestyles
o working with our communities
o developing our workforce
o updating our hospitals
o managing our money
OUR VALUES
As a health care provider, we work according to core values:
o focusing on people and patients
o innovation
o living the Treaty
o professionalism
o action and excellence
STRATEGIC GOALS
We aim to meet the Government’s service objectives as well as the needs of our population through:
o reduction of health disparities within our population
o integrated delivery of services
o improving the health of children in vulnerable communities, with a particular focus on rheumatic
fever, serious skin infection and respiratory conditions
o financial and clinical sustainability
o a culture of collaboration with local and regional partners.
Capital & Coast DHB Annual Report 2014/2015 - Page
4
ABOUT CCDHB
We receive funding to improve, promote and protect the health of the people in our communities and
ensure health services are available, either by contracting with external providers (such as primary health
organisations, general practices, primary care practices/services, non-governmental organisations, rest
homes, dentists, pharmacists, and Māori and mental health providers) or providing the services directly
(such as hospital services).
Currently just over 300,000 people live within the Capital & Coast DHB district, with two thirds of the
population in Wellington City, 18% in Porirua and 15% on the Kāpiti Coast. The DHB must assess the health
status of the population and determine what funds should be directed to preventing il ness and early
intervention of illness (via primary health and public health services), while continuing to provide and
improve existing hospital and other specialist services.
We are the leading provider of specialist tertiary services for the upper South and lower North Islands,
covering a population of about 900,000.
In all, the DHB offers hospital services across a wide range of specialist areas including; cardiology and
cardiothoracic surgery, neurosurgery, vascular surgery, renal medicine and transplants, genetics, oncology,
paediatric surgery, neonatal intensive care, obstetrics, endocrinology, orthopaedics, urology, and specialised
forensic services.
Community-based services provided include both general and specialist district nursing, specialist multi-
disciplinary rehabilitation services, occupational therapy, speech language therapy, physiotherapy, dietetics,
social work and home support services, mental health, alcohol and drug services.
Our DHB operates two hospitals; Wel ington and Kenepuru, supported by the Kāpiti Health Centre, a large
Mental Health campus at Kenepuru and other community based services. It is a major employer in the
Wellington region with over 4,300 full-time equivalent staff with an additional number of people working on
a casual basis.
THE HEALTH OF OUR POPULATION
Our DHB is the sixth largest in New Zealand and spans three territories; Wellington City, Porirua City and part
of Kāpiti Coast district. The people of the Wellington region enjoy, on average, better health, longer life
spans, and lower rates of morbidity and mortality than many other parts of the country. We have fewer than
average Māori (11%) and a higher than average Pacific (7%) and Asian (12%) populations.
A third of our population are aged between 25 and 44, however, age structures differ by ethnicity and
between geographic areas:
o Māori and Pacific have a relatively young age structure with more children and fewer people aged
over 65
o Porirua has a large proportion of children under 15 years
Capital & Coast DHB Annual Report 2014/2015 - Page
5
o Kāpiti Coast has a large population aged over 65 years.
Overall our district is relatively advantaged in terms of socioeconomic deprivation, with one in five people
living in the least deprived areas (NZDep2013 decile 1). However, there are pockets of deprivation in Porirua
and south east Wellington and these communities experience poorer health outcomes.
The district population is predicted to increase 8% (24,000 people) by 2026 with the highest growth in
Wellington and Kāpiti. Like the country as a whole, our population is ageing and the number of people aged
over 65 years is expected to grow by almost 40% (14,000 people) by 2026.
Key health issues for this DHB include:
o Reducing the incidence of long term conditions (such as cardiovascular disease, diabetes and
respiratory conditions) and minimising the impact on people’s daily lives. Māori and Pacific tend to
have earlier onset of long term conditions than other groups.
o The burden of cancer and reducing disparities in survival.
o Experience of mental il ness and its unequal impact on younger, disadvantaged population groups.
o Addressing issues for children and youth, including oral health, respiratory, skin infections and
injuries, mental health and youth suicide, as well as sexual health.
o Health of older people, including management of long term conditions, cancer, musculoskeletal
disease (for example, arthritis, osteoporosis), injury from falls, the impact of dementia, and home
and community support needs.
o Responding to the needs of the 23% of the district population estimated to have a disability.
Capital & Coast DHB Annual Report 2014/2015 - Page
6
GOVERNANCE OF CCDHB
ROLE OF THE BOARD
The Board of Capital & Coast DHB is responsible for the governance of the organisation and is accountable to
the Minister of Health. The DHB governance structure is set out in the New Zealand Public Health and
Disability Act 2000.
The Board consists of 11 members who have overall responsibility for the organisation’s performance. Seven
members are elected as part of the three-yearly local body election process and four are appointed by the
Minister of Health. A Crown Monitor was appointed in August 2014.
ROLE OF THE CEO
The Board delegates to the CEO, on such terms and conditions as are appropriate, the power to make
decisions on operational and management matters within the framework of the Board’s agreed strategic
direction as set out in the Annual Plan. It endorses the CEO, assigning defined levels of authority to other
specified levels of management within the organisational structure.
GOVERNANCE PHILOSOPHY
Over the past few years, the three Boards have taken a ‘whole-of-health system’ approach, including
integrating clinical and support services where this provides benefits across the system.
Each Board continues to provide governance of local services and all three Boards provide collective
governance over services that are shared or integrated, ensuring local accountability.
Integrated service approaches are intended to deliver:
• Preventative health and empowered self-care
• Provision of relevant services close to home; and
• Quality hospital care, including highly complex care, for those who need it.
This requires a strong focus on relationships with primary and community care and working closely with staff
and communities as we progress service design. The Boards believe this gives us the best opportunity to
address the challenges of balancing quality, cost and access.
Capital & Coast DHB Annual Report 2014/2015 - Page
7
BOARD STRATEGY
IMPROVE CHILD HEALTH AND CHILD HEALTH SERVICES IN THE
WELLINGTON REGION
Improve the environment, and the quality of healthcare, in the children’s ward at Wel ington hospital.
o Develop integrated, fit-for-purpose child health services for the sub-region and region.
o Use schools as hubs for health education and nutrition advice.
o Provide better monitoring and evaluation of child health outcomes in Wellington.
BETTER ELDER CARE
Plans are under way to establish better pathways for managing the ‘frail elderly’ so that older citizens have
access to better quality services in the community. We would like these services expanded to include:
o A Regional Elder Care Centre of Excellence, based in Kenepuru.
o Better monitoring and oversight of aged care facilities.
o A system of continuous quality improvement for home and community support for our elderly
population.
INTEGRATED CARE
So that health services can be provided as close to home as possible, and unnecessary hospital admissions
can be avoided.
o CCDHB has been working with primary health organisations to integrate primary, secondary, tertiary
and public health care. We want to encourage the more rapid development of integrated care
pathways that can prevent unnecessary admissions and adverse events.
o We want to expand these services to include:
o Integrated family health care centres that provide access to a variety of services in one location and
eventually focus on keeping people well, as well as treating people when they are sick. We would
like to begin with a pilot for an integrated family care centre in Porirua.
o Better access to information that promotes wellness and good personal health, at all points across
the health continuum.
o Better access to mental health services.
Capital & Coast DHB Annual Report 2014/2015 - Page
8
EMPOWERED SELF-CARE
As chronic diseases become more prevalent, it is important that patients are actively engaged in their care.
We want to see greater recognition of the capacity of the patient in guiding and managing their own care, as
well as better sharing of information and decision-making, and more opportunities for preventive care. We
want to assess the increasing evidence for the impact of preventative activities in primary care e.g. in pre-
diabetes and in reducing cardio-vascular disease risk. Other initiatives we would like to see include:
o The progressive availability and promotion of access to advance care planning throughout the health
system.
o Schools as community hubs for education, physical wellbeing and activity and nutrition advice.
o RPH to develop a community care pilot with a group of cluster schools within its current mandate.
o Measuring patient experience/outcome to ensure that better health outcomes are achieved.
o Improved access to green prescriptions and nutrition advice.
ENHANCED CLINICAL LEADERSHIP
We want clinical leaders to have greater and more coordinated input into decision-making within CCDHB.
We also want to see:
o More and better communication between the Board and clinical leaders.
o More innovative delivery of our health services, including more effective use of telemedicine,
telehealth, and Skype.
CONTINUOUS OUTCOME EVALUATION AND MONITORING
We want continuous outcome evaluation and monitoring against our strategic goals and targets. For
example the Board would like to be able to track the relationship between CVD assessment, and health
outcomes, including using the assessments to identify those iwth pre-diabetic conditions and give them
access to more intensive input and treatment to prevent their transition to diabetes.
Capital & Coast DHB Annual Report 2014/2015 - Page
9
BOARD AND COMMITTEE MEETING ATTENDANCE
July 2014 - June 2015
Board
CPHAC
DSAC
HAC
FRAC
Board member
(11 meetings)
(5 meetings) (5 meetings) (7 meetings)
(10 meetings)
Dr Virginia Hope++
11
3
3
7
10
Dr Derek Milne
9
5
5
6
8
Dr Judith Aitken
8
-
-
2 *
9
Mr David Choat
11
4
4
-
-
Mr Peter Douglas++
9
1 **
1 **
-
5
Ms Helene Ritchie
10
4
4
-
-
Mr Darrin Sykes++
6
-
-
-
9
Ms Sue Kedgley
9
-
-
5
-
Mr Chris Laidlaw
9
5
5
-
-
Mr Nick Leggett +
10
-
-
1 **
-
Mr Roger Jarrold
10
-
-
-
7
Dr Margaret Wilsher
6
-
-
-
-
Note:
- not a member
* new member of the committee from Jan 2015
** ceased committee membership
+ Board representative, Sub-Regional Pacific Strategic Health Advisory Group
++ Board representatives, Māori Partnership Board
Capital & Coast DHB Annual Report 2014/2015 - Page
10
OUR PEOPLE
Delivering expert health care requires the right mix of trained and qualified people. In order for us to
do this we work hard to attract and retain a skilled and responsive workforce that can deliver a
sustainable service that looks to continually improve patient care.
A key priority for us is improving clinical workforce retention by continuing to support and grow
clinical leadership, by supporting clinical governance of the patient journey across primary and
secondary services.
Identifying more efficient and effective ways to deliver services at a regional, sub-regional and local
level; controlling the growth of hospital labour costs; maintaining and where possible, improving
hospital productivity: and achieving better integration of local primary and secondary services all
require support, active involvement and leadership by clinicians.
The DHB continues to ensure local clinicians take a lead role in the establishment of regional clinical
networks, local and regional clinical pathways, and optimal clinical arrangements for securing
specialised hospital capacity with neighbouring DHBs. This strengthened clinical leadership was
assisted through the activity of the Al iance Leadership Team, the Strategic Clinical Governance
Group and involvement of clinicians in the development of collaborative service models at a sub-
regional and regional level.
The Strategic Clinical Governance Group is responsible for providing clinical leadership; leading the
development of clinical governance across all of the services provided by the DHB; overseeing the
quality and safety of services delivered by DHB providers and the clinical quality programme; and
providing advice and recommendations to the DHB Board, Chief Executive and management.
GOOD EMPLOYER OBLIGATIONS REPORT
A key value of the DHB is to be a good employer. Capital & Coast DHB embraces the seven key
elements of ‘the Good Employer’ as prescribed by the EEO Commissioner. The elements are:
o Leadership, accountability, and culture
o Recruitment, selection, and induction
o Employee development, promotion, and exit
o Flexibility and work design
o Remuneration, recognition, and conditions
o Harassment and bul ying prevention
o Safe and healthy environment
A rigorous recruiting and selection procedure is followed to ensure fairness and equal opportunity
and we have an equal employment opportunities focus within the relevant polices. Training and
Capital & Coast DHB Annual Report 2014/2015 - Page
11
development opportunities are offered to all staff, and personal performance and development
plans are done annually.
Several forums are in place comprising of employees from across the DHB. These forums meet to
consider workplace practices. Topics include health and safety, and professional practices for
nursing, clerical, and administration staff.
As a good employer the DHB values professionalism through leadership. Therefore unacceptable
employee behaviour is not tolerated. We have updated our suite of HR policies and guidelines
related to discipline, performance, code of conduct, harassment prevention, and protected
disclosures this year. We are also taking a proactive approach to reduce the incidence of bul ying
and harassment within our organisation.
Approximately 92% of employees are covered by Col ective Employment Agreements (CEA). Al the
CEAs have remuneration, recognition and conditions clauses. We also take a similar approach for
those employees on individual employment agreements to ensure fairness and equity in
remuneration, recognition and conditions across the organisation.
The Protected Disclosure Act 2000 and the Board’s related policy, protects the right of employees to
raise matters of public concern in a safe and appropriate manner. Where an individual may feel
personally disadvantaged there are established grievance procedures available including external
mediation or the mechanisms covered by the Employment Relations Act 2000. Employees also have
‘no questions asked’ access to the employee assistance programme.
WORKFORCE PROFILE
Full Time Equivalent (FTE) Staff Numbers
2015
2014
2013
2012
2011
2010
2009
Medical
640.89
618
87.71
563.58
524.16
510.32
490
Nursing
1945.95
1895
1909.99
1804.96
1789.38
1791.15
1639.69
Allied Health
762.16
767
759.87
727.11
705.54
684.84
645.75
Other
997.65
877
1011.13
958.46
957.16
968.29
971.31
Total
4346.65
4257
4268
4054
3976
3954
3746
Capital & Coast DHB Annual Report 2014/2015 - Page
12
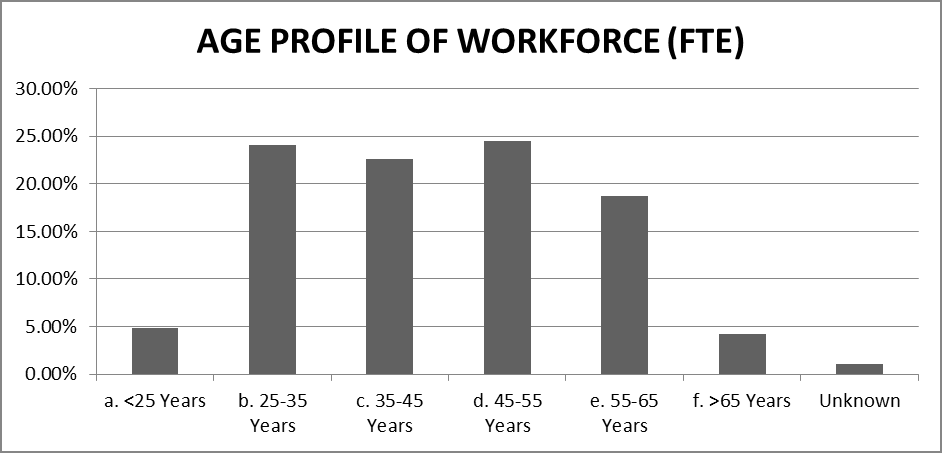
 Age Profile of Workforce
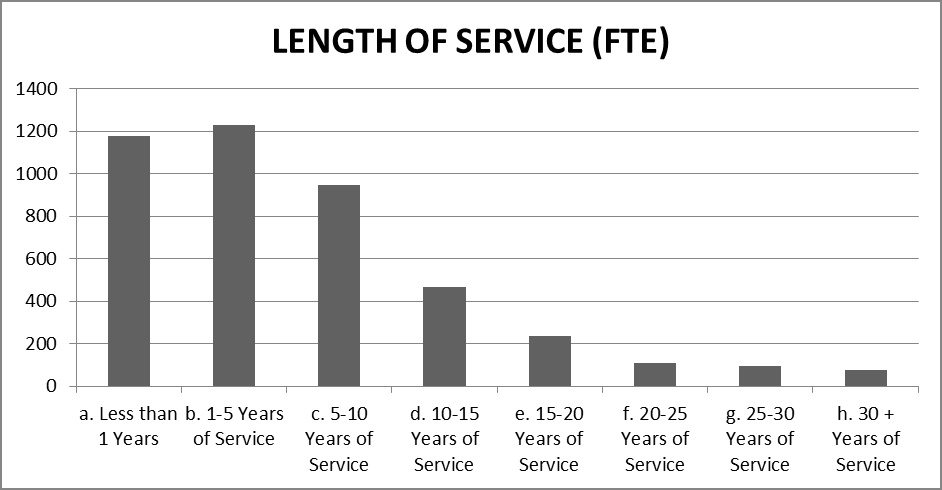
Length of Service
Capital & Coast DHB Annual Report 2014/2015 - Page
13
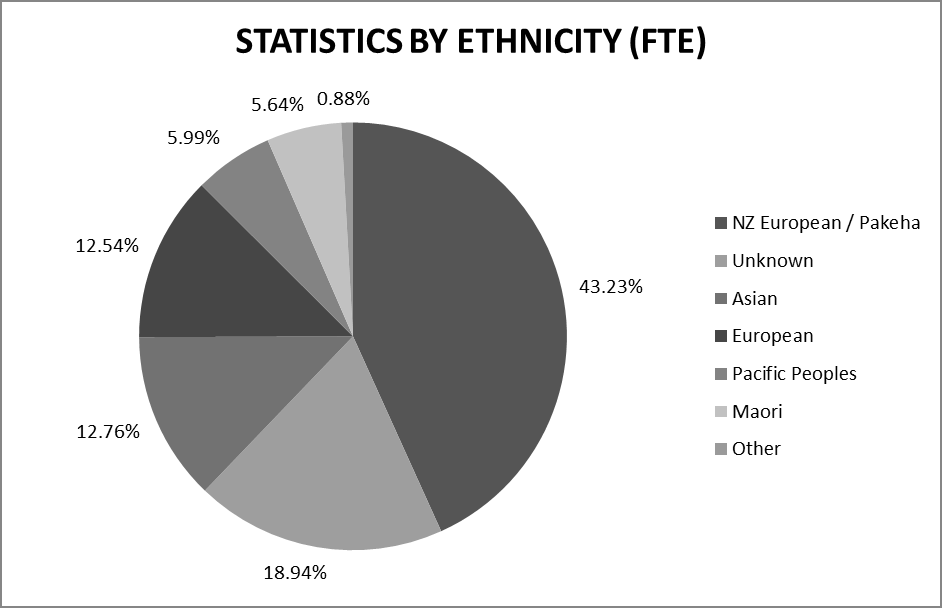
Statistics by Ethnicity
Statistics by Gender
2015
2014
2013
2012
2011
2010
2009
Female
73%
72%
73%
73%
73%
73%
72%
Male
27%
28%
27%
27%
27%
27%
28%
Capital & Coast DHB Annual Report 2014/2015 - Page
14
PERFORMANCE HIGHLIGHTS
Capital & Coast DHB continues to provide high quality and timely services for our population. In
2014/15:
• Amenable (avoidable) mortality rates continue to decrease.
• The burden of tooth decay in 12 year olds decreased.
• Capital & Coast DHB ranked second best out of twenty DHBs on the immunisation health
target, with 95% of eight month olds receiving their vaccination on time.
• All but two general practices in Capital & Coast DHB have a diabetes care improvement plan.
These plans include regular monitoring of diabetes care and outline strategies and services
that will improve diabetes care in the practice.
• Capital & Coast PHOs made significant progress against the smoking advice in primary care
health target, with 88% of smokers with a general practice appointment in the last twelve
months receiving advice to quit – an increase of 16% from the previous financial year.
• Capital & Coast DHB exceeded the improved access to elective surgery health target with
8,969 elective surgeries delivered to the DHB population.
• The average length of stay targets for acute and elective admissions to Wel ington and
Kenepuru Hospitals were met and average length of stay in our hospitals continues to
decrease. At the same time, our acute readmission rate remains lower than the national
average.
• All Capital & Coast residents with long-term support needs received a comprehensive clinical
[InterRAI] assessment and a completed care plan.
Capital & Coast DHB Annual Report 2014/2015 - Page
15
link to page 2
MINISTER’S HEALTH TARGETS
Health targets are a set of national performance measures specifically designed to improve the performance
of health services that reflect significant public and government priorities. They provide a focus for action.
1
Shorter stays in Emergency Departments
Shorter stays in ED
95 percent of patients presenting at an
Capital & Coast DHB
Emergency Department (ED) will be admitted,
100%
90%
discharged or transferred within six hours.
80%
70%
Target: 95%
60%
50%
40%
2014/15 Performance: 91%
30%
20%
10%
0%
Q1 Q2 Q3 Q4 Q1 Q2 Q3 Q4 Q1 Q2 Q3 Q4 Q1 Q2 Q3 Q4
2011/12
2012/13
2013/14
2014/15
Improved access to elective surgery
Improved access to elective surgery
More New Zealanders have access to elective
Capital & Coast DHB
surgical services with at least 4,000 additional
150%
140%
discharges nationally every year.
130%
120%
Target: 8,884 (graph - 100%)
110%
100%
90%
2014/15 Performance: 8,969
80%
70%
60%
50%
Q1 Q2 Q3 Q4 Q1 Q2 Q3 Q4 Q1 Q2 Q3 Q4 Q1 Q2 Q3 Q4
2011/12
2012/13
2013/14
2014/15
1 Quoted from the Ministry of Health, http://www.health.govt.nz/new-zealand-health-system/health-targets
Capital & Coast DHB Annual Report 2014/2015 - Page
16
Increased immunisation
Increased Immunisation
85 p
ercen
t of eight months olds will have their
Capital & Coast DHB
primary course of immunisation (six weeks, three
100%
90%
months and five months immunisation events)
80%
on time by July 2013, 90 percent by July 2014
70%
60%
and 95 percent by December 2014.
50%
40%
Target: 95%
30%
20%
10%
2014/15 Performance: 95%
0%
Q1 Q2 Q3 Q4 Q1 Q2 Q3 Q4 Q1 Q2 Q3 Q4
Māori
Pacific
Total
Target
2012/13
2013/14
2014/15
Better help for smokers to quit – Hospital
Better help for smokers to quit - Hospital
95 percent of patients who smoke and are seen
Capital & Coast DHB
by a health practitioner in public hospitals are
100%
90%
offered brief advice and support to quit smoking.
80%
70%
Target: 95%
60%
50%
40%
2014/15 Performance: 87%
30%
20%
10%
0%
Q1 Q2 Q3 Q4 Q1 Q2 Q3 Q4 Q1 Q2 Q3 Q4 Q1 Q2 Q3 Q4
2011/12
2012/13
2013/14
2014/15
Better help for smokers to quit – Primary Care
Better help for smokers to quit - Primary care
90 percent of patients who smoke and are seen
Capital & Coast DHB
by a health practitioner in primary care are
100%
90%
offered brief advice and support to quit smoking.
80%
70%
Target: 90%
60%
50%
40%
2014/15 Performance: 88%
30%
20%
10%
0%
Q1 Q2 Q3 Q4 Q1 Q2 Q3 Q4 Q1 Q2 Q3 Q4 Q1 Q2 Q3 Q4
2011/12
2012/13
2013/14
2014/15
Capital & Coast DHB Annual Report 2014/2015 - Page
17
More heart and diabetes checks
More heart and diabetes checks
90 percent of the eligible population will have
Capital & Coast DHB
had their cardiovascular risk assessed in the last
100%
90%
five years.
80%
70%
Target: 90%
60%
50%
40%
2014/15 Performance: 89%
30%
20%
Māori
Pacific
10%
Total
Target
0%
Q3 Q4 Q1 Q2 Q3 Q4 Q1 Q2 Q3 Q4 Q1 Q2 Q3 Q4
2012/13
2013/14
2014/15
Shorter waits for cancer treatment
Shorter waits for cancer treatment
All patients, ready for treatment, wait less than
Capital & Coast DHB
four weeks for radiotherapy or chemotherapy.
100%
90%
The Ministry of Health has transitioned from this
80%
target to the ‘Faster cancer treatment’ Health
70%
60%
Target.
50%
40%
Target: 100%
30%
20%
10%
2014/15 Performance: 100%
0%
Q1 Q2 Q3 Q4 Q1 Q2 Q3 Q4 Q1 Q2 Q3 Q4 Q1 Q2 Q3 Q4
2011/12
2012/13
2013/14
2014/15
Faster cancer treatment
Faster cancer treatment
85 percent of patients receive their first cancer
Capital & Coast DHB
treatment (or other management) within 62 days
100%
90%
of being referred with a high suspicion of cancer
80%
and a need to be seen within two weeks by July
70%
60%
2016, increasing to 90 percent by June 2017.
50%
40%
Target: 85% by July 2016
30%
20%
10%
2014/15 Performance: 81%
0%
Q1
Q2
Q3
Q4
2014/15
Capital & Coast DHB Annual Report 2014/2015 - Page
18
IMPACTS AND OUTCOMES
As the major funder and provider of health, wellbeing, and disability services in our district, we work
to make and maintain positive changes in the health of our population. Our decisions about which
services to fund and deliver have a significant impact on the health of our population, and contribute
to the effectiveness of our entire health system.
In the fol owing section, we present our six intended outcomes and their associated impact
measures. Although we do not have a specific target for our selected impact measures, trends in
these measures can indicate in which areas our DHB is making a positive difference and in which
areas our DHB should seek to improve. It is important to note that these outcomes are progressed
not just through the work of DHBs, but also through the work of al of those across the health system
and wider health and social services.
POPULATION HEALTH OUTCOME: IMPROVED HEALTH EQUITY
What difference wil we make for our population?
Overarching across the three components of our strategy is a focus on patient-centred care. This
incorporates an outcome of improved health equity, to ensure the gains in health of our population
are across all groups. Inequalities in access to and decisions over resources are the primary cause of
health inequalities. Differential access to health services – and in the quality of care provided to
patients – also contribute to unequal health outcomes. These structural inequalities may explain
more of ethnic inequalities in health than is often recognised.
Although the overall Wellington sub-region has a relatively affluent, healthy population, there are
pockets of deprivation concentrated in parts of Porirua, the south eastern suburbs of Wellington,
parts of the Hutt Valley such as Naenae and Wainuiomata, and parts of Masterton. Over half of the
Pacific population live in the most deprived areas and 29 percent of Māori live in the most deprived
areas.
Māori and Pacific peoples die on average ten to fifteen years earlier than non-Māori non-Pacific, and
experience significantly higher acute admission and avoidable mortality rates. Although access to
some health care services has improved, outcomes often remain worse for Māori and Pacific.
We acknowledge our responsibility to design and deliver services that are accessible and responsive
to our population’s needs.
In addition to the outputs described in the fol owing Statement of Performance, recent initiatives in
our sub-region that we are undertaking to improve equity outcomes include:
• A subregional equity report, which contains a suite of equity indicators, including ASH rates.
By improving our monitoring of disparities, we will be able to more effectively plan activities
and reduce existing disparities.
Capital & Coast DHB Annual Report 2014/2015 - Page
19
• A project that aims to reduce the number of people who do not attend (DNA) outpatient
appointments, as Māori and Pacific have higher DNA rates than other ethnicities.
The Porirua Social Sector Trial, which aims to reduce the ASH rates and ED admissions of Porirua
residents. The trial wil achieve these aims through collaboration between various social services,
including housing, education, police, and health services.
Impact measures – The DHB measures progress through:
A reduction in amenable mortality rates for Māori &
Amenable mortality rate,
Pacific
Capital & Coast DHB
300
‘Amenable mortality’ is defined as premature deaths
,000 250
from conditions that were potentially avoidable
200
through health care.
150
100
Differences in amenable mortality rates for different
50
population groups reflect variation in the coverage
-standardised rate per 1
0
and quality of health care received by them.
Age
2000-2002
2005-2007
2009-2011
Māori
Pacific
Total
Amenable mortality rates in Capital & Coast DHB have
decreased by 40% since 2000-2002. However, Māori
Amenable conditions are defined by the
and Pacific amenable mortality rates are still more
Ministry of Health and exclude people aged over
than 2.5 times higher than other ethnicities,
75 years.
indicating that Māori and Pacific are not receiving
equitable coverage or quality of healthcare.
This measure links to the Early Detection &
Management and Intensive Assessment & Treatment
output classes.
Capital & Coast DHB Annual Report 2014/2015 - Page
20
A reduction in the ambulatory sensitive
Ambulatory sensitive hospitalisation
hospitalisation (ASH) rates (0-74)
rate, 0-74 years, Capital & Coast DHB
5000
Ambulatory sensitive hospitalisations (ASH) are
4000
admissions to hospital for conditions that could have
00,000 3000
been prevented or treated by appropriate
er 1
interventions in a primary care or community setting.
2000
These conditions include skin infections, dental
Rate p 1000
conditions, asthma, pneumonia, cardiovascular
0
disease, and diabetes.
2010/11 2011/12 2012/13 2013/14 Yr to
Māori
Pacific
Mar 15
Other
National
ASH rates also highlight opportunities to better
support people to seek intervention early and to
manage their long-term conditions. A reduction in
ASH admissions will reflect better management and
treatment across the whole health system.
In Capital & Coast DHB, our overall ASH rate is lower
than the national ASH rate. However, our ASH rate for
Māori and Pacific is more than twice the rate for
other ethnicities, and this disparity has remained
constant over the last four years.
This measure links to the Prevention Services and
Early Detection & Management output classes.
A reduction in the rate of acute admissions for Māori
Acute admission rate ratio,
& Pacific compared to non-Māori non-Pacific
Capital & Coast DHB
2.5
Māori and Pacific are at least one-and-a-half times
2
more likely to be admitted acutely to hospital than
io 1.5
non-Māori non-Pacific. Positively, the acute admission
1
rate ratio for Pacific has decreased over the last
Rate rat
0.5
couple of years, but the ratio for Māori has remained
0
the same. This disparity reflects both social and
economic inequities and inequities in access to health
services.
Māori: Other
Pacific: Other
This measure links to the Prevention Services and
Early Detection & Management output classes.
Capital & Coast DHB Annual Report 2014/2015 - Page
21
link to page 17
A reduction in acute medical admission rates for
Acute admission rate for frail elderly,
Māori and Pacific frail elderly2
Capital & Coast DHB
500
Rates of acute medical admissions are high across all
400
groups and particularly for Pacific Peoples. Rates for
00,000 300
Māori 70+ are declining, which is positive.
er 1 200
By improving the clinical management of frail elderly
Rate p 100
in the community, we expect that acute admission
0
rates for frail elderly will decrease.
Māori 70+ years
Pacific 70+ years
This measure links to the Rehabilitation & Support
Other 80+ years
output class.
POPULATION HEALTH OUTCOME: PREVENTATIVE HEALTH
What difference wil we make for our population?
Preventative health services provide the population with health literacy, or an understanding of how
their daily choices affect their health, and protect the population to keep them healthy. Healthy
eating, active living, and not smoking are some of the factors which can prevent diseases or poor
health in the longer term.
Tobacco smoking kills an estimated 5,000 people in New Zealand every year, including deaths due to
second-hand smoke exposure. Smoking is also a major contributor to preventable illness and long-
term conditions. It is a major cause of lung and a variety of other cancers, as well as chronic
obstructive pulmonary disease, heart disease and strokes. Supporting the population to say no to
tobacco smoking is an important opportunity to target improvements in the health of populations
with high need and to improve Māori health.
Current trends indicate sustained increases in obesity in New Zealand’s adult population. This has
significant implications for rates of cardiovascular disease, diabetes, respiratory disease and some
cancers, as wel as poor psychosocial outcomes and reduced life expectancy. Supporting the
population to maintain healthier body weight through improved nutrition and physical activity levels
is fundamental to improving the health and wel being of the population and to the prevention of
chronic conditions and disability at all ages.
2 Age groups have been set based definitions used in current programmes of work for frail elderly.
Capital & Coast DHB Annual Report 2014/2015 - Page
22
Measures – The DHB measures progress through:
An increase in the percentage of adults 15+
Proportion of adults in the sub-region
consuming 2+ fruit and 3+ vegetable servings daily
that consume fruit and vegetables on
a daily basis, NZ Health Survey
Good nutrition is fundamental to health and the
100%
prevention of disease and disability. Appropriate fruit
80%
and vegetable consumption helps to protect people
revalence 60%
against obesity, CVD, diabetes and some common
40%
cancers and contributes to maintaining and healthy
20%
body weight. Nutrition-related risk factors (such as
-standardised p
0%
high cholesterol, high blood pressure, obesity and
Age
2006/07
2011/13
inadequate fruit and vegetable intake) jointly
2+ servings fruit
3+ servings vegetables
contribute to two out of every five deaths each year.
The number of adults consuming fruit and vegetables
on a daily basis has not changed significantly over the
last five years. By providing education and support for
people to live healthily, we expect that the
consumption of fruit and vegetables will increase.
This measure links to the Prevention Services output
class.
A reduction in obesity prevalence amongst the
Obesity prevalence in adults in the
population 15+
sub-region, NZ Health Survey
Obesity is one of the most important modifiable risk
100%
factors for a number of major diseases, including type
80%
2 diabetes, ischaemic heart disease, ischaemic stroke,
revalence 60%
and several common cancers. In the last two decades,
40%
the prevalence of overweight and obesity in
developed countries has increased so quickly that is
20%
-standardised p
has been described as an epidemic.
Age
0%
2006/07
2011/13
The most recent NZ Health Survey shows that there is
no significant difference in obesity rates between the
three DHBs. Adults have a much higher obesity rate
than children in all three. By providing education and
support for people to live healthily, we expect that
the prevalence of obesity will decrease.
This measure links to the Prevention Services and
Early Detection & Management output classes.
Capital & Coast DHB Annual Report 2014/2015 - Page
23
A reduction in smoking rates for the sub-region’s 15+
Smoking prevalence in adults in the
population
sub-region, NZ Health Survey
25%
Cigarette smoking has serious consequences for
20%
health. It is estimated that smoking kills 5,000 New
revalence
Zealanders a year. Ministry of Health has set a goal
15%
that New Zealand will be smoke free by 2025. Our
10%
DHB is working towards this goal by providing
5%
-standardised p
smoking advice and cessation support to patients
Age 0%
when they visit their general practice or visit the
2006/07
2011/13
hospital.
Current
Daily
Census 2013 data shows that in our sub-region,
smoking prevalence in Māori (30%) and Pacific (24%)
are higher than the average smoking prevalence
(14%) in our sub-region.
By providing smoking cessation advice and support,
we expect that the percentage of people who smoke
will decrease.
This measure links to the Prevention Services output
class.
Capital & Coast DHB Annual Report 2014/2015 - Page
24
A decrease in the number of vaccine preventable
Number of vaccine-preventable
disease notifications
disease notifications in the sub-region
800
In addition to protecting an individual from disease,
600
immunisation can also provide population-wide
400
protection by reducing the incidence of infectious
diseases and preventing the spread of these diseases
200
to vulnerable people.
0
2008 2009 2010 2011 2012 2013 2014
The peak in 2012 was due to Pertussis (whooping
Wairarapa
Hutt Val ey
cough) outbreaks in the region, which caused an
Capital & Coast
increase in vaccine preventable disease notifications.
The number of notifications has returned to previous Source: Environmental Science & Research
levels in 2014.
surveil ance reports
In the longer term, with increased immunisation, we
expect that the number of vaccine-preventable
disease notifications will decrease.
This measure links to the Prevention Services and
Early Detection & Management output classes.
POPULATION HEALTH OUTCOME: PREVENTATIVE HEALTH: IMPROVED
CHILD AND YOUTH HEALTH
What difference wil we make for our population?
Outcomes for the current generation of children and young people wil determine the future success
or failure of the community and society as a whole. The relatively short periods of time which
gestation, infancy, childhood and adolescence occupy have more power to shape the individual than
much longer periods of time later in life.
The health status of young people and expectant mothers is most strongly influenced by
environmental determinants of health outside of the services the DHB provides. However the DHBs
have a focus on influencing change that supports healthier environments; on ensuring younger
populations have a healthy start to life; and on addressing the inequalities between population
groups to improve overall population outcomes.
Capital & Coast DHB Annual Report 2014/2015 - Page
25
Measures – The DHB measures progress through:
A reduction in ambulatory sensitive hospitalisations
Ambulatory sensitive hospitalisation
of children (0-4)
rate, 0-4 years, Capital & Coast DHB
15000
Ambulatory sensitive hospitalisations (ASH) are
admissions to hospital for conditions that could have
10000
00,000
been prevented or treated by appropriate
er 1
interventions in a primary care or community setting.
5000
These conditions include skin infections, dental
Rate p
conditions, asthma, pneumonia, cardiovascular
0
disease, and diabetes.
2010/11 2011/12 2012/13 2013/14 Yr to
Māori
PacificMar 15
Other
National
ASH rates also highlight opportunities to better
support people to seek intervention early and to
manage their long-term conditions. A reduction in
ASH admissions will reflect better management and
treatment across the whole health system.
This measure links to the Prevention Services and
Early Detection & Management output classes.
Capital & Coast DHB Annual Report 2014/2015 - Page
26
An increase in the proportion of children caries free
Proportion of 5 year olds caries-free,
at five years
Capital & Coast DHB
100%
Regular dental care has lifelong benefits for health.
80%
Improved oral health is also an indicator of the equity
caries
60%
of access to services and the effectiveness of
ith no
mainstream services at targeting those most in need.
40%
rtion w
Māori and Pacific children have worse oral health
20%
Propo
outcomes than other ethnicities.
0%
2009
2010
2011
2012
2013
2014
The DHB is undertaking a number of activities to
Māori
Pacific
Total
improve oral health outcomes for children. A new
sub-regional enrolment system has recently been
established, and its aim is to enrol every infant with
community oral health services. In addition, Before
School Checks include a ‘Lift the Lip’ oral health
examination, through which children with poor oral
health are referred to community oral health services.
By ensuring that every child has access to and is
receiving oral health services, we expect that the
proportion of five year olds with no caries will
increase.
This measure links to the Early Detection &
Management output class.
A decrease in the mean number of decayed, missing
Burden of decay in 12 year olds,
or fil ed teeth (DMFT) at Year 8
Capital & Coast DHB
1.5
The burden of tooth decay is measured by the mean
number of decayed, missing or filled teeth (DMFT) in
T 1.0
MF
twelve year old children. Māori and Pacific children
an D
have a higher burden of decay than other ethnicities.
Me 0.5
By ensuring that every child has access to and is
0.0
receiving oral health services, we expect that the
2009
2010
2011
2012
2013
2014
burden of decay in twelve year olds will decrease.
Māori
Pacific
Total
This measure links to the Early Detection &
Management output class.
Capital & Coast DHB Annual Report 2014/2015 - Page
27
An increase in the proportion of year 10 students
Proportion of Yr 10 students who
who report never smoking
report never smoking
100%
Reducing smoking prevalence is dependent on
80%
smoking cessation and on preventing young people
60%
from taking up smoking. Over 95% of smokers have
40%
started smoking by 18 years of age.
20%
A reduction in the uptake of smoking is a good proxy
0%
2008
2009
2010
2011
2012
2013
measure of successful engagement and a change in
Wairarapa
Hutt Val ey
the social and environmental factors that influence
Capital & Coast
National
risk behaviour.
The proportion of year 10 students who report never
smoking has increased over the last five years across
all three DHBs, which is positive.
This measure links to the Prevention Services output
class.
POPULATION HEALTH OUTCOME: EMPOWERED SELF-CARE
What difference wil we make for our population?
The impact of long-term conditions in terms of quality of life and cost to the health system is
significant. Early diagnosis and intervention and improved disease management provide major
opportunities for improving health outcomes; particularly for Māori and Pacific people, who have
disproportionately higher rates of many long-term conditions.
Empowering people to manage their long-term conditions and seek appropriate intervention early
will result in a reduction in the proportion of the population seeking urgent care or requiring acute
admission to hospital. Improving access to alternative pathways of care will ensure people are being
given the right treatment in the right place; improving health outcomes, reducing pressure on
hospital resources and enabling investment in other priority areas.
Capital & Coast DHB Annual Report 2014/2015 - Page
28
Measures – The DHB measures progress through:
A reduction in the hospitalisation rate for
CVD hospitalisation rate
cardiovascular disease (CVD)
Capital & Coast DHB
30
Cardiovascular diseases (CVD) are diseases that affect
,000 25
the heart and circulatory system. They include
20
ischaemic heart disease, rheumatic heart disease,
15
cerebrovascular disease and other forms of vascular
10
and heart disease. Cardiovascular disease is the
5
leading cause of death in the sub-region. Overall,
-standardised rate per 1 0
around 70% of the burden of cardiovascular disease is
Age
2010
2011
2012
2013
2014
Māori
Pacific
Other
attributed to modifiable risk factors. CVD is
preventable through adopting a healthy lifestyle, and
can be managed with lifestyle change, early
intervention and effective management.
One of the Health Targets is to provide CVD risk
checks for the eligible population (65+ years). By
identifying those at risk of CVD early, we can help
them to change their lifestyle to improve their health,
and reduce the chance that they develop a serious
health condition. We expect that this intervention wil
lead to a decrease in the rate of CVD-related
hospitalisations for our population.
In Capital & Coast DHB, Māori and Pacific have a
higher rate of CVD hospitalisation than other
ethnicities. The inequity between Māori and ‘Other’
has stayed the same over the last four years, whilst
the inequity between Pacific and ‘Other’ has
decreased.
This measure links to the Prevention Services and
Early Detection & Management output classes.
Capital & Coast DHB Annual Report 2014/2015 - Page
29
A reduction in the hospitalisation rate for diabetes
Diabetes hospitalisation rate
Capital & Coast DHB
Diabetes is defined by the body’s inability to control
8
blood glucose. Diabetes is a chronic condition, which
,000
6
can cause kidney failure, eye disease, foot ulceration
and a higher risk of heart disease if not well managed.
4
Supporting people to manage their diabetes wel
2
reduces acute admissions to hospital.
-standardised rate per 1 0
Age
2010
2011
2012
2013
2014
The number of diabetics has been increasing at a rate
Māori
Pacific
Other
of approximately 8% a year.
All but two general practices in Capital & Coast DHB
have a diabetes care improvement plan. These plans
include regular monitoring of diabetes care and
outline strategies and services that will improve
diabetes care in the practice. Diabetes admission
rates increased for Māori and Pacific over the last few
years, but have since dropped to below the 2010 rate,
which is good.
This measure links to the Prevention Services and
Early Detection & Management output classes.
Increased proportion of diabetics checked with
Proportion of diabetics 15-74 years
satisfactory or better blood glucose control (HbA1c
old with good blood glucose control,
less than or equal to 64 mmol/mol)
Capital & Coast DHB
100%
Diabetes is a significant cause of ill health and
80%
premature death, and prevalence is increasing at an
60%
estimated 4-5% a year. Improving the management of
40%
diabetes will reduce long-term avoidable
20%
complications which require hospital-level
0%
intervention, such as lower limb amputation, kidney
2010/11 2011/12 2012/13 2013/14 2014/15
Māori
Pacific
Other
failure and blindness, and will improve people’s
quality of life.
Results from 2010/11 to 2012/13 are presented
as a rate of diabetics who had an HbA1c test.
Fewer Māori and Pacific have good blood glucose
This measure was then revised from 2013/14 to
control when compared to other ethnicities.
be a rate of al enrol ed diabetics, which resulted
in a drop in reported performance. There was
This measure links to the Prevention Services and
also a delay in developing reporting with the
Early Detection & Management output classes.
new methodology, so results for 2013/14 are
not available.
Capital & Coast DHB Annual Report 2014/2015 - Page
30
A reduction in the age standardised hospitalisation
Hospitalisation rate for chronic
rate for chronic respiratory conditions
respiratory conditions, Capital &
Coast DHB
The most common chronic respiratory conditions
10
include asthma and chronic obstructive pulmonary
,000 8
disorder (COPD).
6
4
By providing cessation support for people who
2
smoke, improving access to primary care, and helping
0
people to take their medication regularly, we expect
-standardised rate per 1
2010
2011
2012
2013
2014
that the rate of chronic respiratory hospitalisations
Age
Māori
Pacific
Other
for our population will decrease.
In Capital & Coast DHB, the rate of chronic respiratory
hospitalisation for Māori has varied over the last five
years. Rates for Māori and Pacific are approximately
three times higher than the rate for other ethnicities.
This measure links to the Prevention Services and
Early Detection & Management output classes.
HEALTH SERVICES OUTCOME: SERVICES CLOSER TO HOME
What difference wil we make for our population?
We are working to better integrate health services across the continuum to better provide the
services patients require closer to their homes. When services are delivered closer to the patient’s
home they can better access services and have a relationship of trust with their regular GP, nurse or
other clinician. This al ows patients to use services when they need them and empowers them to
manage their health.
Capital & Coast DHB Annual Report 2014/2015 - Page
31
Measures – The DHB measures progress through:
The utilisation rate of primary care by age group
12
When people are able to access primary care when
erson
PHO utilisation rates, Capital & Coast
10
they need it, they can receive treatment earlier, have
8
nroled p
better continuity of care, and sometimes even
6
prevent a hospital admission. Improved utilisation of
4
primary care appropriate to the needs of the age
2
group reflects patients’ ability and willingness to visit
0
ber of visits per e
12 13 14
12 13 14
12 13 14
12 13 14
12 13 14
12 13 14
their medical home of primary care for their medical
um
N
2011/ 2012/ 2013/
2011/ 2012/ 2013/
2011/ 2012/ 2013/
2011/ 2012/ 2013/
2011/ 2012/ 2013/
2011/ 2012/ 2013/
treatment.
Under 5 5 to 14 15 to 24 25 to 44 45 to 64 65 and
yrs
yrs
yrs
yrs
yrs
over
This measure links to the Early Detection &
Management output class.
A reduction in ambulatory sensitive hospitalisations
Ambulatory sensitive hospitalisation
of adults (45-64)
rate, 45-64 years, Capital & Coast DHB
6000
Ambulatory sensitive hospital admissions are usually
unplanned admissions that are potentially
4000
00,000
preventable by appropriate health services delivered
er 1
in community settings, including through primary
2000
health care. They provide an indication of access to,
Rate p
and the effectiveness of, primary health care, as well
0
2010/11 2011/12 2012/13 2013/14 Yr to
as management of the interface between the primary
Māori
PacificMar 15
and secondary health sectors.
Other
National
This measure links to the Prevention Services and
Early Detection & Management output classes.
Maintain or increase the proportion of patients
Percentage of people receiving home
receiving home based support services of those 65+
support
who receive DHB funded home based support or
100%
aged residential care services
80%
60%
When people receive the adequate support for their
needs to be managed, remaining in their own homes
40%
is considered to provide a much higher quality of life,
20%
as a result of staying active and positively connected
0%
to their communities.
2009/10 2010/11 2011/12 2012/13 2013/14
Wairarapa
Hutt Val ey
This measure links to the Rehabilitation & Support
Capital & Coast
output class.
Capital & Coast DHB Annual Report 2014/2015 - Page
32
HEALTH SERVICES OUTCOME: QUALITY HOSPITAL CARE AND COMPLEX
CARE FOR THOSE WHO NEED IT
What difference wil we make for our population?
Improved patient-focused, clinically driven pathways will provide the flexibility for early intervention
and planned readmission where clinically appropriate, and will support improvements in care across
the whole continuum. Responsive intervention will also enable people, their families and caregivers
to establish more stable lives.
Overseas experience shows that systemic changes to the way care is offered to patients can lead to
measurable changes in patient morbidity and mortality. Examples are changes intended to reduce
incidences of falls, pressure ulcers, pneumonia, and hospital-acquired infections in patients.
Measures – The DHB measures progress through:
The percentage of patients admitted, transferred or
Percentage of patients admitted, transferred
discharged from the Emergency Department within
or discharged from ED within six hours,
Capital & Coast DHB
six hours
100%
80%
Timely access to treatment improves health
60%
outcomes and is indicative of increased capacity and
40%
improvements in the flow of patients through DHB
20%
services. It also demonstrates a commitment to
0%
addressing the needs of patients and valuing their
1
3
1
3
1
3
1
3
1
3
Q
Q
Q
Q
Q
Q
Q
Q
Q
Q
time.
2010/11 2011/12 2012/13 2013/14 2014/15
Performance
Target
Timely acute care in ED is also a proxy measure for
how well the whole system is working together to
support people to stay wel and to provide timely and
appropriate complex care through management of
acute demand in the community, improved capacity
in ED and supported discharge into services in the
community.
Our performance on the Shorter Stays in ED health
target has increased by 20% since the target was
introduced, and in quarter 4 of 2014/15 we met the
target, with 95% of patients admitted, transferred, or
discharged from ED within six hours.
This measure links to the Intensive Assessment &
Treatment output class.
Capital & Coast DHB Annual Report 2014/2015 - Page
33
A reduction in the standardised rate of acute
Standardised acute readmission rate,
readmissions within 28 days, Total & 75+
all ages
12%
A decrease in the rate of acute readmissions shows
10%
that people are receiving high-quality care in hospital,
8%
that they are being appropriately discharged (i.e., not
6%
4%
leaving hospital too early or too late), and that they
2%
are being well-supported by primary and community
0%
care once they are out of hospital.
2010 2011 2012 2013 2014
Yr to
Mar 15
The standardised acute readmission rate has
remained at about 6.5% for Wairarapa and 7% for
Standardised acute readmission rate,
75+ years
Hutt Valley and Capital & Coast over the last five
12%
years. Although the acute readmission rate has
10%
remained the same, the average length of stay in our
8%
hospital facilities has decreased (see Statement of
6%
4%
Performance), which shows that the effectiveness
2%
and efficiency of treatment in hospital has improved.
0%
2010 2011 2012 2013 2014
Yr to
This measure links to the Intensive Assessment &
Mar 15
Wairarapa
Hutt Val ey
Treatment output class.
Capital & Coast
National
A reduction in the rate of acute readmissions within
Acute mental health readmission rate
28 days to Mental Health Services
25%
20%
Inpatient mental health services aim to provide
treatment that enables individuals to return to the
15%
community as soon as possible. Unplanned
10%
readmissions to a psychiatric facility following a
5%
recent discharge may indicate that inpatient
treatment was either incomplete or ineffective, or
0%
2009/10 2010/11 2011/12 2012/13 2013/14
that follow-up care was inadequate to maintain the
Hutt Val ey
Capital & Coast
person out of hospital.
National
This indicator helps identify if investigation into the
functioning of the system is needed to determine any
areas in which it might be breaking down. Improved
performance on this measure demonstrates better
whole of system performance.
This measure links to the Intensive Assessment &
Treatment output class.
Capital & Coast DHB Annual Report 2014/2015 - Page
34
Maintain or increase standardised intervention rates
Standardised Intervention Rates
(SIR) for elective services
500
400
One of the areas of focus for elective services is the
level of service being provided to the DHB’s
300
00,000
population (as measured by Standardised
200
Intervention Rates), and the level of service being
SIR per 1 100
provided for identified key conditions, including
cardiac procedures, major joint replacement and
0
2010
2011
2012
2013
2014
cataract procedures. Capital & Coast DHB’s
Wairarapa
Hutt Val ey
standardised intervention rate is lower than the
Capital & Coast
National
national average.
This measure links to the Intensive Assessment &
Treatment output class.
Capital & Coast DHB Annual Report 2014/2015 - Page
35


 STATEMENT OF PERFORMANCE
OUTPUT CLASSES CONTRIBUTING TO DESIRED OUTCOMES
STATEMENT OF PERFORMANCE
OUTPUT CLASSES CONTRIBUTING TO DESIRED OUTCOMES
In the Statement of Performance, we evaluate our performance (outputs) against the targets that
we set in the Statement of Performance Expectations in our 2014/15 Annual Plan. We choose
outputs that wil make the greatest contribution to the wel being of our population in the shorter
term, and to the health outcomes we are seeking to achieve over the longer term. These outputs
also cover areas in which we are developing new services and therefore expect to see a change in
activity levels or settings in the current year. The outputs here provide a picture of the health service
activity across the whole of the Capital & Coast health system.
Our four Output Classes and their related services are:
1. Prevention Services
o Health promotion and public health services
o Immunisation services
o Smoking cessation services
o Screening services
2. Early Detection and Management Services
o Primary care (GP) services
o Oral health services
3. Intensive Treatment and Assessment Services
o Medical and surgical services
o Cancer services
o Mental health and addictions services
4. Rehabilitation and Support Services
o Disability services
o Health of older people services
Scope of DHB Operations – Output Classes in the Continuum of Care
Population
Population
with
Population
Wel
At Risk
with
Complex
with Frail
Population
Population
Managed
and/or
and/or End of
Conditions
Unstable
Life Conditions
Conditions
Intensive Assessment and Treatment
Prevention Services
Services
Rehabilitation and
Early Detection and Management Services
Support
Capital & Coast DHB Annual Report 2014/2015 - Page
36
VOTE HEALTH ESTIMATES OF APPROPRIATIONS
The 2014/15 Vote Health Estimates of Appropriations noted that performance information for
selected Non-departmental Appropriations (Health Workforce Training and Development, National
Child health Services, National Contracted Services, National Disability Support Services, National
Elective Services, National Emergency Services, National Health Information Systems, National
Maternity Services, National Mental health Services, National Personal Health Services, and Primary
Health Care Strategy) would be reported in part through DHBs 2014/15 Annual Reports. The Ministry
of Health has advised DHBs that the Minister of Health will report this information instead of DHBs.
Readers wishing to view the overal budget and performance information for these selected Non-
departmental Appropriations will be able to refer to the Minister of Health's 2014/15 Vote Health
Non-Departmental Expenditure report. This report will be made available on the Ministry of Health’s
website.
INTERPRETING OUR PERFORMANCE
Types of measures
Identifying appropriate measures for each output class is difficult as it is important to do more than
measure just the volumes of patients and consumers through our system. The number of services
delivered or the number of people who receive a service is often less important than whether the
right person or enough of the right people received the right service, and whether the service was
delivered at the right time. Because of this complexity, in addition to volume, we report on a mix of
output measures to help us to evaluate different aspects of our performance. The outputs are
categorised by type of measure, which shows whether the output is targeting coverage, quality,
quantity (volume), or timeliness. When possible and relevant, we have also broken our performance
down by ethnicity.
Type of Measure
Abbreviation
Coverage
C
Quality
Q
Volume
V
Timeliness
T
We have identified new measures in 2014/15 with a † symbol. These measures were introduced in
the 2014/15 Annual Plan and did not appear in the 2013/14 Annual Report. Our 2013/14
performance has therefore not been audited by Audit New Zealand.
Standardisation
Different populations have different characteristics, and these different population characteristics
can lead to different rates between populations. One such characteristic is the age structure of a
population. It would be unreasonable to compare the hospital average length of stay in Wairarapa,
which has a large proportion of elderly, directly to Capital & Coast, which has a smaller proportion of
elderly. But, by standardising for age, we can see what the rates would have been if the two
Capital & Coast DHB Annual Report 2014/2015 - Page
37
populations had the same proportion of people in each age group, and therefore draw comparisons.
In the fol owing outputs, if measures have been standardised (often by the Ministry of Health to
al ow comparison between DHBs), we have noted why and how.
FINANCIAL PERFORMANCE ($000S)
Revenue
2013/14 Actual
2014/15 Budget
2014/15 Actual
Prevention
8,991
7,786
7,399
Early Detection and Management
177,733
187,656
184,070
Intensive Assessment and Treatment
692,993
668,925
707,319
Rehabilitation and Support
95,940
113,449
97,439
Total
975,657
977,816
996,227
Expenditure
2013/14 Actual
2014/15 Budget
2014/15 Actual
Prevention
9,003
7,845
7,399
Early Detection and Management
177,741
188,923
184,070
Intensive Assessment and Treatment
698,828
670,904
711,313
Rehabilitation and Support
95,982
114,144
97,427
Total
981,554
981,816
1,000,209
OUTPUT CLASS 1: PREVENTION SERVICES
Description
‘Preventative’ health services promote and protect the health of the whole population, or
identifiable sub-populations, and influence individual behaviours by targeting population-wide
changes to physical and social environments to influence and support people to make healthier
choices.
Context
New Zealand is experiencing a growing prevalence of long-term conditions such as diabetes and
cardiovascular disease, which are major causes of poor health and morbidity and account for a
significant number of presentations in primary care and admissions to hospital and specialist
services. With an ageing population, the burden of long-term conditions will increase. It has been
estimated that 70% of health funding is spent on long-term conditions. Two in every three New
Zealand adults have been diagnosed with at least one long-term condition and long-term conditions
are the leading driver of health inequalities. The majority of chronic conditions are preventable or
could be better managed. Tobacco smoking, inactivity, poor nutrition, and rising obesity rates are
major and common contributors to a number of the most prevalent long-term conditions and are
avoidable risk factors. It is important to note that these avoidable risk factors and other
determinants of health are influenced not just by what we do in our DHB, but also by wider health
and social services and the social environment. These risk factors are preventable through a
supportive environment, improved awareness and personal responsibility for health and wellbeing.
These prevention services also support people to address any risk factors that contribute to both
acute events (e.g., alcohol-related injury) and the development of long-term conditions (e.g., obesity
or diabetes). High health need and at-risk population groups (low socio-economic, Māori, and
Capital & Coast DHB Annual Report 2014/2015 - Page
38
link to page 52
Pacific) who are more likely to be exposed to environments less conducive to making healthier
choices are a focus. Along with collaborative relationships with other state sector and community
organisations and businesses, preventative services are our best opportunity to target
improvements in the health of these high need populations to reduce inequalities in health status
and improve population health outcomes. These services also ensure that threats to the health of
the community such as communicable disease, water quality, imported disease-carrying pests, are
detected early and prevented, and ensure our ability to respond to emergency events such as
pandemics or earthquakes.
Outputs
Health promotion and public health services: inform people about health matters and health risks,
and support people to be healthy. Success begins with awareness and engagement, reinforced by
community health programmes that support people to maintain wellness or assist them to make
healthier choices. Health promotion and public health services
enable people to improve their
health by increasing their control over their health determinants. Public health services use a range
of strategies, including those described by the Ottawa Charter: public policy, reorienting the health
system, developing supportive environments, community action, and supporting individual personal
skills. While the health sector has a significant role here, some outcomes require a joined-up
approach to address determinants of health. For example, obesity can be influenced by income,
housing, food security, employment, and quality working conditions. Our DHB and RPH work with
other sectors (e.g., housing, justice, education) to address these determinants.
Immunisation services: work to prevent the outbreak of vaccine-preventable diseases and
unnecessary hospitalisations. The work spans primary and community care, allied health and public
health services to optimise provision of immunisations across all age groups, both routinely and in
response to specific risk. A high coverage rate is indicative of a well‐coordinated, successful service.
Smoking cessation services: are provided by clinical staff to smokers to help smokers quit. Clinicians
follow the ABC process
a: Ask al patients whether they smoke and document their response; if the
patient smokes, provide
Brief advice to quit smoking; and if patient agrees, provide
Cessation
support (e.g., a prescription for nicotine gum or a referral to a provider like Quitline).
Screening services: encourage uptake of services predominately funded and provided through the
National Screening Unit that help early identification of breast and cervical cancer, and carry out
newborn hearing testing, and antenatal HIV screening.
How we measure the performance of our Prevention Services:
Outputs
Measure
Type of
2013/14
2014/15
2014/15
2014/15
Measure Performance
Target
Performance Achievement
Health
The number of new
promotion
client referrals to
and public
public health nurses in
2014:
V
2013: 1,234
health
primary/intermediate
1,105d
2014: 1,258
Achieved
services
schoolsbc
Capital & Coast DHB Annual Report 2014/2015 - Page
39
link to page 40 link to page 40 link to page 41
Outputs
Measure
Type of
2013/14
2014/15
2014/15
2014/15
Measure Performance
Target
Performance Achievement
The percentage of
infants breastfed at 6
C
74%†
59%f
70%
Achieved
monthse
Immunisation
Health Target: The
services
percentage of eight
month olds fully
C
93%
95%
95%
Achieved
vaccinated
The percentage of
enrol ed people over
65 years vaccinated
65%
C
70%
65%
Not Achieved
against flug
High Needs
64%
61%
Not Achieved
The percentage of Yr 7
children provided
Boostrix vaccination in
C
2013: 67%
2014:
70%
2014: 70%
Achieved
school
s b
The percentage of Yr 8
2014:
girls vaccinated against
C
2013: 64%
HPV (final dose)
b
≥60% h
2014: 61%
Achieved
Smoking
Health Target (Better
cessation
Help for Smokers to
services
Quit – Hospital): The
percentage of
C
92%
95%
87%
Not Achieved
hospitalised smokers
receiving advice and
help to quit
Health Target (Better
Help for Smokers to
Quit – Primary Care):
The percentage of
enrol ed patients who
smoke and are seen in
C
72%
90%
88%
Not Achieved
General Practice who
are offered brief
advice and support to
quit smoking
Screening
The percentage of
services
eligible children
receiving a Before
91%
C
90%
85%
Not Achieved
School Check
High Need
83%
87%
Not Achieved
The percentage of
eligible women (25-69)
having cervical
79%
80%
Achieved
screening in the last 3
C
80%
yearsi
Māori
60%
63%
Not Achieved
Pacific
62%
66%
Not Achieved
The percentage of
eligible women (50-69
yrs) having breast
69%
screening in the last 2
C
70%
70%
Achieved
year
si
Māori
63%
64%
Not Achieved
Capital & Coast DHB Annual Report 2014/2015 - Page
40
Outputs
Measure
Type of
2013/14
2014/15
2014/15
2014/15
Measure Performance
Target
Performance Achievement
Pacific
64%
64%
Not Achieved
Comments on performance
Health promotion and public health services
Public health nurses continue to respond to the community’s needs in primary and intermediate
schools. Referrals to public health nurses are made by teachers, health professionals, social workers,
and caregivers. The public health nurses make weekly visits to Decile 1-3 (students with lowest
family income) schools and fortnightly visits to Decile 4-6 schools. The public health nurses also
provide an email and phone service for Decile 7-10 (highest income) schools.
Immunisation services
Capital & Coast DHB achieved the eight month old immunisation Health Target. Primary Health
Organisations (PHOs) are being supported and encouraged to implement initiatives to increase
immunisation coverage. Immunisation education is provided for primary health care nurses and
hospital staff that have immunisation responsibilities. Primary healthcare providers also receive a list
of children who are overdue for immunisation so that they can fol ow up to ensure that the children
receive their immunisations.
The influenza vaccination period was extended by the Ministry of Health in 2014/15 due to a
prolonged flu season. As a result, we expect the percentage of enrol ed people over 65 years
vaccinated against flu to increase over the next quarter (September 2015). PHOs continue to support
practices to provide influenza vaccination for at-risk patients.
The Regional Public Health Immunisation team work in schools ensures that HPV and Boostrix
vaccinations are completed in a timely manner and according to all national protocols. The team met
the targets for both vaccination programmes in the 2014 calendar year.
Smoking cessation services
Capital & Coast DHB did not achieve the Health Target for smoking cessation advice in hospital. To
improve performance on this target, the hospital has implemented a more consistent approach to
documentation of smoking status and advice given, and have made changes to patient discharge
summaries.
Capital & Coast DHB did not achieve the Health Target for smoking cessation advice in primary care.
However, PHOs have made significant progress on this target, with performance increasing by 16%
between 2013/14 and 2014/15. Compass Health PHO is providing clinical leadership and support for
all PHOs and primary care services in Capital & Coast DHB.
Screening services
Capital & Coast DHB was close to achieving the B4School check targets. In 2014/15 there was
increased sharing of information between GP practices, Māori health providers and Plunket. There
has been increased utilisation of the Plunket mobile van together with the partnership of the
Capital & Coast DHB Annual Report 2014/2015 - Page
41
Hearing and Vision team, targeting children living in the most deprived areas. This ‘One Stop’ service
ensures a complete assessment is conducted seamlessly with children and whānau. A Working
Group will continue to meet regularly and support the programme in finding new and more effective
and efficient ways of working across the community, continue to improve performance, and
ultimately improve outcomes for all children.
Capital & Coast DHB achieved the target for breast and cervical screening for the total population,
but Māori and Pacific screening rates did not meet the target. To improve our screening rates, the
screening service has implemented data matching with primary care, ‘priority’ women days for
Māori, Pacific, and women living in the most deprived areas, and monthly Saturday clinics for
women who cannot attend during working hours. Mobile rosters have changed so that screening is
more accessible to priority women. Independent service providers, such as Mana Wahine, work to
locate and assist priority women to engage with screening services.
OUTPUT CLASS 2: EARLY DETECTION AND MANAGEMENT
Description
Early detection and management services cover a broad scope and scale of services provided across
the continuum of care activities to maintain, improve and restore people’s health. These services
include detection of people at risk and with early disease and more effective management and
coordination of people with long-term conditions. These services are by nature more generalist,
usually accessible from multiple providers, and at a number of different locations.
Context
New Zealand is experiencing an increasing prevalence rate of long-term conditions such as diabetes
and cardiovascular disease, and some population groups suffer from these conditions more than
others, for example, Māori and Pacific people, older people and those on lower incomes. The health
system is also experiencing increasing demand for acute and urgent care services. For our DHB,
diabetes, COPD, asthma, and chronic respiratory conditions are significant long-term conditions that
are prevalent in our population. Early detection and management services based in the community
deliver earlier identification of risk, provide opportunity to intervene in less invasive and more cost-
effective ways, and reduce the burden of long-term conditions through supported self-management
(avoidance of complications, acute illness and crises). These services deliver coordination of care,
ultimately supporting people to maintain good health.
Outputs
Primary care services: are offered in local community settings by teams of general practitioners
(GPs), registered nurses, nurse practitioners, and other primary health care professionals; aimed at
improving, maintaining, or restoring health. High numbers of enrolment with general practice are
indicative of engagement, accessibility, and responsiveness of primary care services. These services
keep people well by: intervening early to detect, manage, and treat health conditions (e.g., health
Capital & Coast DHB Annual Report 2014/2015 - Page
42
checks ); providing education and advice so people can manage their own health; and, reaching
those at risk of developing long-term or acute conditions.
Oral health services: are provided by registered oral health professionals to assist people in
maintaining healthy teeth and gums. A reduction in the number of young children requiring invasive
complex oral health treatment (under general anaesthetic) is indicative of the quality of early
intervention and of public health education and messages regarding the importance of good oral
health. High enrolment indicates engagement, while timely examination and treatment indicates a
well-functioning, efficient service.
How we measure the performance of our Early Detection & Management Services:
Outputs
Measure
Type of
2013/14
2014/15
2014/15
2014/15
Measure Performance
Target
Performance
Achievement
Primary
The number of DHB-
care
domiciled population
280,161
283,078
281,844
Not Achieved
services
enrol ed in a PHO
V
Māori
28,834
29,779
29,112
Not Achieved
Pacific
21,882†
22,047
21,758
Not Achieved
The percentage of the
PHO enrol ed
population enrol ed in
C
6%
≥5%
4.5%
Not Achieved
Care Plus
The ratio of nurse and
GP visits by high need
patients versus non
C
1.14
≥1.10
1.12
Achieved
high need patients j
Health Target: The
percentage of the
eligible population
C
85%
90%
89%
Not Achieved
assessed for CVD risk
in the last five years
Local Measure: The
percentage of
practices with a
Q
62%
100%
97%
Not Achieved
diabetes care
improvement plan
Oral
The percentage of
health
children under 5 years
2014:
services
enrol ed in DHB
C
2013: 42%
85%
2014: 59%
Not Achieved
funded dental
2015:
85%
servicesk
The percentage of
2014:
adolescents accessing
85%
DHB funded dental
C
2013: 73%
2015:
2014: 74%
Not Achieved
services
85%
Comments on performance
Primary care services
Capital & Coast DHB did not meet the target for the number of DHB-domiciled population enrolled in
a PHO. These targets were set with population projections based on the 2006 Census, which
Capital & Coast DHB Annual Report 2014/2015 - Page
43
overestimated the 2014/15 population by approximately 5,000 people in Capital & Coast DHB
compared to the latest projections from the 2013 Census. Enrolment rates are 94% for the total
population, 88% for Māori, and 98% for Pacific.
The target ratio of nurse and GP visits by high need patients versus non high need patients was not
achieved. The ratio indicates that ‘high need’ patients (Māori, Pacific, and those living in the most
deprived areas) are visiting primary care services more than non-high need patients, which is good.
During 2014/2015, ‘very low cost access’ funding was provided to practices for which at least half of
the enrol ed population was identified as ‘high need’. This funding al owed practices to have low
consultation fees, which reduced the financial barriers to accessing primary health care for the ‘high
need’ population.
All but two general practices in Capital & Coast DHB have implemented diabetes care improvement
plans. These plans are developed and implemented by general practices to provide quality care and
management for enrolled patients with diabetes.
Oral health services
The preschool oral health enrolment target in 2014/15 was not achieved. However, the Oral Health
Service has made significant progress on this target, with performance increasing by 17% between
2013/14 and 2014/15. Initiatives to increase pre-school enrolments include data-matching with
primary care, enrolling newborns, collaboration with Well Child Tamariki Ora providers, working
with early childhood centres, and developing internal IT and administration systems. In addition,
work on the Porirua Social Sector Trial by Compass Health PHO has contributed to the increase in
enrolments.
Capital & Coast DHB did not achieve the target for the percentage of adolescents accessing DHB
funded dental services. To improve performance, the Oral Health Service is working with contracted
Private Dental Practices to identify areas with low access rates and ways to improve utilisation.
There are also sub-regional initiatives to raise awareness of ‘FREE dental care for under 18 year olds’.
OUTPUT CLASS 3: INTENSIVE ASSESSMENT AND TREATMENT
Description
Intensive assessment and treatment services are complex hospital services. They are provided by
specialists and other health care professionals in a hospital setting. Hospitals often provide these
services because clinical expertise (across a range of areas) and specialist equipment need to be
located in the same place. These services include inpatient, outpatient, emergency, and urgent care
services. Our DHB provides an extensive range of intensive treatment and complex specialist services
to our population. Our DHB also funds some tertiary and quaternary services that are provided by
other DHBs, private hospitals, and private providers for our population. A proportion of these
services are driven by demand, such as unplanned (acute) and maternity services. For planned
(elective) services, access is determined by capability, capacity, resources, clinical triage, national
service coverage agreements, and treatment thresholds.
Capital & Coast DHB Annual Report 2014/2015 - Page
44
Context
Equitable and timely access to intensive assessment and treatment can significantly improve a
person’s quality of life, either through early intervention (i.e., removal of an obstructed gallbladder
to prevent repeat attacks of abdominal pain/colic, and to reduce the risk of cancer and infection) or
through corrective action (i.e., major joint replacements to relieve pain and improve activity).
Flexible and responsive assessment and treatment services also support improvements across the
whole system, so that people can receive support in the community with confidence that complex
intervention is available if needed. As an owner and provider of these services, the DHB is also
concerned with the quality of the services being provided. Adverse events in hospital cause harm to
patients, drive unnecessary costs, and shift resources away from other services. Improving our
service delivery, systems, and processes will improve patient safety, reduce the number of hospital
events causing harm, and improve outcomes for people using our services. There are expectations
for the delivery of increased elective surgical volumes, a reduction in waiting times for treatments,
and increased clinical leadership around improving service delivery and safety to improve the quality
and efficiency of care being delivered. The changes being made to meet expectations are providing
opportunities to introduce innovative clinically led service delivery models and improve productivity
within our hospital services.
Outputs
Medical and surgical services: Unplanned hospital services (Acute services) are for illnesses that have
an abrupt onset and are often of short duration and rapidly progressive, creating an urgent need of
care. Hospital-based acute services include emergency departments, short-stay acute assessments
and intensive care services. Planned Services (Elective surgery) are services for people who do not
need immediate hospital treatment and are ‘booked’ services. This also includes non-medical
interventions (coronary angioplasty) and specialist assessments (first assessments, follow-ups, or
preadmission assessments). National Elective Services Patient Flow Indicators (ESPIs) are indicative
of a successful and responsive service; addressing increasing needs and matching commitments to
capacity.
Cancer services: Cancer services include diagnosis and treatment services. Cancer treatment in the
sub-region is delivered by the Wel ington Blood and Cancer Centre.
Mental health and addictions services: Specialist Mental Health Services are services for people who
are most severely affected by mental illness or addictions and include assessment, diagnosis,
treatment and rehabilitation, as well as crisis response when needed, and as required under the
Mental Health Act. Currently the expectation established in the National Mental Health Strategy is
that specialist services (including psychiatric disability services) will be available to 3% of the
population. Utilisation rates will be monitored across age groups and ethnicities to ensure service
levels are maintained and to demonstrate responsiveness.
Capital & Coast DHB Annual Report 2014/2015 - Page
45
link to page 47
How we measure the performance of our Intensive Assessment & Treatment
Services:
Outputs
Measure
Type of
2013/14
2014/15
2014/15
2014/15
Measure Performance
Target
Performance Achievement
Medical
Health Target: The
and
percentage of patients
surgical
admitted, discharged or
T
92%
95%
91%
Not Achieved
services
transferred from ED
within six hours
Health Target: The
number of surgical
V
8,734
8,884
8,969
Achieved
elective discharges
The standardised
average length of stay
3.62
3.81
3.49
Achieved
for inpatients (days) l -
T
Acute
Elective
3.17
3.18
3.12
Achieved
Quality
The percentage of
measures
“DNA” (did not attend)
appointments for
6%†
5%
Achieved
outpatient first
Q
6%m
specialist assessments
Māori
12%†
11%
Not Achieved
Pacific
13%†
11%
Not Achieved
The number of Hospital
Acquired Pressure
Q
61†
0
71
Not Achieved
Injuriesn
The number of central
line acquired
bacteraemia infections
Q
2
0
4
Not Achieved
in ICU
The rate of inpatient
fal s causing harm per
Q
1.25o
≤1.37
1.10
Achieved
1000 bed days
The rate of identified
medication errors per
Q
0.
93o
≤0.86
0.94
Not Achieved
1000 bed days
Cancer
Shorter Waits for
services
Cancer Treatment – The
percentage of patients,
ready for treatment,
T
100%
100%
100%
Achieved
who wait less than four
weeks for radiotherapy
or chemotherapy
Capital & Coast DHB Annual Report 2014/2015 - Page
46
Outputs
Measure
Type of
2013/14
2014/15
2014/15
2014/15
Measure Performance
Target
Performance Achievement
Health Target: Faster
Cancer Treatment – The
percentage of patients
who receive their first
cancer treatment (or
85% by
other management)
T
New
June
81%
Not Achieved
within 62 days of being
measure
2016
referred with a high
suspicion of cancer and
a need to be seen
within two weeksp
Mental
The number of people
health and accessing secondary
9,785†
10,000
9,995
Not Achieved
addictions
mental health services
V
services
Māori
2,072†
2,174
2,118
Not Achieved
Pacific
741†
716
749
Achieved
Percentage of people
admitted to an acute
mental health inpatient
service who were seen
by mental health
Q
63%†
75%
54%
Not Achieved
community team in the
7 days prior to the day
of admission
Percentage of people
discharged from an
acute mental health
inpatient service who
were seen by mental
Q
70%†
90%
59%
Not Achieved
health community team
in the 7 days fol owing
the day of discharge
The percentage of
patients 0-19 referred
to non-urgent child &
adolescent mental
T
85%†
95%
86%
Not Achieved
health services who are
seen within eight
weeksq
The percentage of
patients 0-19 referred
to non-urgent child &
adolescent addictions
T
74%†
95%
55%
Not Achieved
services who are seen
within eight weeks
Comments on performance
Medical and surgical services
Capital & Coast DHB did not achieve the ED Health Target in 2014/15.A severe and drawn-out winter
season in 2014 impacted on bed capacity and the hospital’s ability to admit patients in a timely
manner. The target was consistently met for patients who were not admitted. The number and
Capital & Coast DHB Annual Report 2014/2015 - Page
47
proportion of patients requiring admission is increasing, and 35% of all ED visits required admission
to hospital in 2014/15. Work continues to improve the models of care in specialty areas.
Quality measures
Capital & Coast DHB continues to provide high quality and timely care to patients. In 2013 the Health
Quality & Safety Commission (HQSC) introduced a campaign that focusses on improving patient
safety in medications, falls, health acquired infections, and perioperative harm. Our fall rates are
lower than they were in 2013/14. Going forward, the Pressure Injury Working Group is working on
‘care process auditing’ (used for falls in 2014/15) and a pressure injury sticker to reinforce best
practice.
All of the central line acquired bacteraemia (CLAB) infections in ICU were reviewed and were caused
by prolonged insertion and complex patients. Adherence to best practice guidelines for the insertion
of the central line and the maintenance of the line once inserted has not decreased.
With the introduction of new auditing processes, we can assess where to improve medication errors,
and the Clinical Practice Committee will be focussing on this piece of work in 2015/16.
Cancer services
Capital & Coast DHB continue to meet the Shorter Waits for Cancer Treatment target. We are
improving patient flow processes and are confident of achieving the Faster Cancer Treatment Health
Target by June 2016.
Mental health and addictions services
Capital & Coast DHB did not meet the targets for the number of people accessing secondary mental
health services. These targets were set with population projections based on the 2006 Census, which
overestimated the 2014/15 population by approximately 5,000 people in Capital & Coast DHB
compared to the latest projections from the 2013 Census.
To increase the percentage of people who are seen pre- and post- mental health inpatient
admission, Capital & Coast DHB has made improvements to data col ection and business processes.
The percentage has since increased to 75% for the year-to-date July 2015. In addition, to improve
follow-up care after an inpatient admission, the DHB has implemented comprehensive inpatient
client reviews that include community teams, and weekly conferences led by community and
inpatient clinicians.
OUTPUT CLASS 4: REHABILITATION AND SUPPORT
Description
Rehabilitation and support services provide people with the support that they need to maintain their
independence, either temporarily while recovering from illness or disability, or over the rest of their
lives. Rehabilitation and support services are provided mostly for older people, mental health clients,
and clients with complex health conditions. A ‘needs assessment’, coordinated by Needs Assessment
and Service Coordination (NASC), determines which services a person may require. These services
Capital & Coast DHB Annual Report 2014/2015 - Page
48
may be provided at home, as personal care, community nursing, or community services.
Alternatively, people may require long- or short-term residential care, respite, or day services.
Support services also include palliative care services for people who have end-stage conditions. It is
important that they and their families are supported so that the person can live comfortably, have
their needs met in a holistic and respectful way, and die without undue pain and suffering.
Rehabilitation and support services may be delivered in coordination with other organisations and
agencies, and may include public, private, and part-funding arrangements.
Context
Services that support people to manage their needs and live well, safely and independently in their
own homes are considered to provide a much higher quality of life, as a result of staying active and
positively connected to their communities. People whose needs are adequately met by these
support services are less dependent on hospital and residential services and less likely to experience
acute illness or deterioration of their conditions. As a result, effective support services will help to
reduce demand for acute services and improve access to other services and interventions. Support
services will have a major impact on the sustainability of hospital and specialist services and on the
wider health system in general. It will also free up resources for investment into early intervention,
health promotion, and prevention services that wil help people stay healthier for longer. Our DHB
has taken a restorative approach and has introduced individual packages of care to better meet
people’s needs, including complex packages of care for people assessed as eligible for residential
care who would rather remain in their own homes. With an ageing population, it is vital that we
ascertain the effectiveness of services in this area and that our DHB uses the InterRAI (International
Residential Assessment Instrument) tool to ensure people receive support services that best meet
their needs and, where possible, support them to regain maximum functional independence.
Outputs
Health of older people services: These are services provided to enable people to live as
independently as possible and to restore functional ability. Services are delivered in specialist
inpatient units, outpatient clinics and also in home and work environments. Specialist geriatric and
allied health expertise and advice is also provided to general practitioners, home and community
care providers, residential care facilities and voluntary groups.
Disability services: Many disability services are accessed through a Needs Assessment and Service
Co-ordination (NASC) service. NASCs are organisations contracted to the DSS, which work with
disabled people to help identify their needs and to outline what disability support services are
available. They allocate Ministry-funded support services and assist with accessing other supports.
Capital & Coast DHB Annual Report 2014/2015 - Page
49
link to page 51 link to page 51 link to page 51
How we measure the performance of our Rehabilitation & Support Services:
Outputs
Measure
Type of
2013/14
2014/15
2014/15
2014/15
Measure Performance
Target
Performance Achievement
Health of
The percentage of
older
people 65+ who have
people
received long term
services
home support services
in the last three months
who have had a
Q
100%
≥95%
100%
Achieved
comprehensive clinical
[InterRAI] assessment
and a completed care
plan
The number of InterRAI
assessments
V
5,912
5,741r
3,163s
Not Achieved
The number of people
receiving home and
community support
V
3,000
3,004r
3,139
Achieved
services
The number of days of
Short-term Care (respite
beddays, day respite,
V
19,068†
19,154r
19,463
Achieved
and community day
activity support)t
The number of
subsidised aged
residential care bed
V
551,067
557,434r
564,146
Achieved
days
The percentage of
residential care
providers meeting three
Q
94%
≥91%
94%
Achieved
year certification
standardsu
Disability
The number of Disability
services
Forum meetings (sub-
V
2
2
4
Achieved
regional and local)
Comments on performance
Health of older people services
Capital & Coast DHB continues to exceed the target for the percentage of older people with long-
term support needs who have had an interRAI assessment. The actual number of assessments is
dependent on the needs of the older population so this measure is descriptive rather than
aspirational.
The number of people receiving home and community support services has remained stable. The
number of respite days provided to support carers continues to grow. The increase in residential bed
days is being monitored.
Nine residential care providers (27%) in Capital & Coast DHB have four year certification, 22 have
three year certification, and the remaining two facilities have two year certification.
Capital & Coast DHB Annual Report 2014/2015 - Page
50
Disability services
Our priority in 2014/15 has been engagement with the local community. Capital & Coast DHB was
part of four sub-regional and local Disability Forum meetings in 2014/15. This engagement has
helped us to improve the partnership between staff and communities in service development and
planning.
a ABC for Smoking Cessation Quick Reference Card, PHARMAC
b To provide an overview of public health services in the sub-region, this Annual Report presents a subset of
the activities that Regional Public Health undertook in 2014/15. Please refer to the 2014/15 Regional Public
Health Annual Report at www.rph.org.nz for a more comprehensive description of Regional Public Health’s
activities in the 2014/15 year.
c This measure is aligned with the school (calendar) year rather than financial year.
d Target is estimated volumes, rather than a true ‘target’.
e Plunket data only, for exclusive, full and partial breastfeeding.
f National target
g Baseline as at December 2012
h Target aligned to national target
i Data from National Screening Unit. Note that coverage rates in 2013/14 are based on population projections
derived from Census 2006, whilst rates in 2014/15 are based on population projections derived from Census
2013.
j The ratio (high need: non high need) of standardised GP and nurse utilisation rate. This measures equity of
access, as those with high needs are likely to require more visits.
k As oral health measures are reported on a calendar year the Ministry of Health requests targets be specified
for each year.
l This measure is provided by the Ministry of Health one quarter in arrears, so performance is for 12 months
ending March 2014 (2013/14 baseline) and 12 months ending March 2015 (2014/15 performance).
m This is a long-term target as this measure is one of the “headline indicators” in the DHBs’ equity report.
n This measure has been updated from ‘The number of hospital acquired pressure sores and ulcers’ to reflect
new terminology. The methodology for the measure remains the same.
o Note that the 2013/14 fal s and medication error rates in the 2013/14 Annual Report incorrectly omitted data
from one ward. The rates shown here have been corrected to include al wards.
p This is a new measure that replaced the ‘Shorter Waits for Cancer Treatment’ Health Target from 1 October
2014.
q This measure is provided by the Ministry of Health one quarter in arrears, so performance is for 12 months
ending March 2014 (2013/14 baseline) and 12 months ending March 2015 (2014/15 performance).
r This is a descriptive measure of volumes only and is not the focus for service improvement or improving
health status.
s Note that there have been changes in the recording and reporting of the number of InterRAI assessments.
The methodology for 2014/15 gives an underestimate of performance compared to the methodology for the
target.
t Only includes volume paid as fee for service and excludes bulk-funded dedicated respite beds (6 Beds in
Capital & Coast).
u Excluding new providers and facilities as these are required to have a one year certification.
† These measures were introduced in 2014/15 and did not appear in the 2013/14 Annual Report. Our 2013/14
performance has therefore not been audited by Audit New Zealand.
Capital & Coast DHB Annual Report 2014/2015 - Page
51


 STATEMENT OF RESPONSIBILITY
For the year ended 30 June 2015:
STATEMENT OF RESPONSIBILITY
For the year ended 30 June 2015:
In terms of the Crown Entities Act 2004, the Board and Management of Capital & Coast District Health Board
accepts responsibility for the preparation of the annual Financial Statements and the Statement of
Performance and the judgements used in them.
The Board and Management of Capital & Coast District Health Board are responsible for any end-of-year
performance information provided by Crown Service Enterprise under Section 19A of the Public Finance Act
1989.
The Board and Management of Capital & Coast District Health Board accepts responsibility for establishing
and maintaining a system of internal control designed to provide reasonable assurance as to the integrity
and reliability of financial and non financial reporting.
In the opinion of the Board and Management of Capital & Coast District Health Board, the annual Financial
Statements and the Statement of Performance for the year ended 30 June 2015, fairly reflect the financial
position and operations of Capital & Coast District Health Board.
Dr Virginia Hope MNZM - Board Chair
30 October 2015
Debbie Chin - Chief Executive
30 October 2015
Roger Jarrold - Finance, Risk and Audit Committee Chair
30 October 2015
Tony Hickmott - Chief Financial Officer
30 October 2015
Capital & Coast DHB Annual Report 2014/2015 - Page
52
INDEPENDENT AUDITOR’S REPORT
To the readers of the Capital and Coast District Health Board’s financial statements and performance
information for the year ended 30 June 2015
The Auditor-General is the auditor of the Capital and Coast District Health Board (the Health Board). The
Auditor-General has appointed me, Kel y Rushton, using the staff and resources of Audit New Zealand, to
carry out the audit of the financial statements and the performance information, including the performance
information for an appropriation, of the Health Board on her behalf.
We have audited:
• the financial statements of the Health Board on pages 56 to 100, that comprise the statement of
financial position, statement of contingent liabilities and assets, and statement of commitments as at
30 June 2015, the statement of comprehensive revenue and expenses, statement of changes in equity
and statement of cash flows for the year ended on that date and the notes to the financial statements
that include accounting policies and other explanatory information; and
• the performance information of the Health Board on pages 16 to 51.
Unmodified opinion on the financial statements
In our opinion the financial statements of the Health Board:
o present fairly, in all material respects:
its financial position as at 30 June 2015; and
its financial performance and cash flows for the year then ended; and
o comply with generally accepted accounting practice in New Zealand and have been prepared in
accordance with Public Benefit Entity Standards.
Qualified opinion on the performance information because of limited controls on information from third-
party health providers
Some significant performance measures of the Health Board, (including some of the national health targets,
rely on information from third-party health providers, such as primary health organisations. The Health
Board’s control over much of this information is limited, and there are no practical audit procedures to
determine the effect of this limited control. For example, the primary care measure that includes advising
smokers to quit relies on information from general practitioners that we are unable to independently test.
Our audit opinion on the performance information of the Health Board for the period ended 30 June 2014,
which is reported as comparative information, was modified for the same reason.
Qualified opinion on the performance information about “better help for smokers to quit – hospital” in
the prior year
In respect of the 30 June 2014 comparative information only, our audit of the reported performance for
national health target “better help for smokers to quit – hospital” identified errors which indicated that the
report results for the year ended 30 June 2014 are likely to be material y overstated. We were unable to
quantify the extent of any overstatement, and our audit opinion on the statement of service performance
for the year ended 30 June 2014 was modified accordingly.
The issues which resulted in errors in the performance information for the national health target “better
help for smokers to quit – hospital” have been resolved for the 30 June 2015 year. However, the issues
cannot be resolved for the 30 June 2014 year, which means that the Health Board’s performance
Capital & Coast DHB Annual Report 2014/2015 - Page
53
information reported in the statement of performance for the 30 June 2015 year, may not be directly
comparable to the 30 June 2014 performance information.
In our opinion, except for the effect of the matters described above, the performance information of the
Health Board on pages 16 to 51:
• presents fairly, in all material respects, the Health Board’s performance for the year ended 30 June 2015,
including:
o for each class of reportable outputs:
its standards of performance achieved as compared with forecasts included in the statement
of performance expectations for the financial year;
its actual revenue and output expenses as compared with the forecasts included in the
statement of performance expectations for the financial year;
o what has been achieved with the appropriation; and
o the actual expenses or capital expenditure incurred compared with the appropriated or forecast
expenses or capital expenditure.
• complies with generally accepted accounting practice in New Zealand.
Our audit was completed on 30 October 2015. This is the date at which our opinion is expressed.
The basis of our opinion is explained below. In addition, we outline the responsibilities of the Board and our
responsibilities, and explain our independence.
Basis of opinion
We carried out our audit in accordance with the Auditor-General’s Auditing Standards, which incorporate
the International Standards on Auditing (New Zealand). Those standards require that we comply with ethical
requirements and plan and carry out our audit to obtain reasonable assurance about whether the financial
statements and the performance information are free from material misstatement.
Material misstatements are differences or omissions of amounts and disclosures that, in our judgement, are
likely to influence readers’ overall understanding of the financial statements and the performance
information. We were unable to determine if there were material misstatements in the performance
information because the scope of our work was limited, as we referred to in our opinion.
An audit involves carrying out procedures to obtain audit evidence about the amounts and disclosures in the
financial statements and the performance information. The procedures selected depend on our judgement,
including our assessment of risks of material misstatement of the financial statements and the performance
information, whether due to fraud or error. In making those risk assessments, we consider internal control
relevant to the preparation of the Health Board’s financial statements and performance information in order
to design audit procedures that are appropriate in the circumstances, but not for the purpose of expressing
an opinion on the effectiveness of the Health Board’s internal control.
An audit also involves evaluating:
• the appropriateness of accounting policies used and whether they have been consistently applied;
• the reasonableness of the significant accounting estimates and judgements made by the Board;
• the appropriateness of the reported performance information within the Health Board’s framework for
reporting performance;
• the adequacy of the disclosures in the financial statements and the performance information; and
• the overall presentation of the financial statements and the performance information.
Capital & Coast DHB Annual Report 2014/2015 - Page
54

We did not examine every transaction, nor do we guarantee complete accuracy of the financial statements
and the performance information. Also, we did not evaluate the security and controls over the electronic
publication of the financial statements and the performance information.
We believe we have obtained sufficient and appropriate audit evidence to provide a basis for our audit
opinion.
Responsibilities of the Board
Board is responsible for preparing financial statements and performance information that:
• comply with generally accepted accounting practice in New Zealand;
• present fairly the Health Board’s financial position, financial performance and cash flows; and
• present fairly the Health Board’s performance.
The Board’s responsibilities arise from the Crown Entities Act 2004, the New Zealand Public Health and
Disability Act 2000 and the Public Finance Act 1989.
The Board is responsible for such internal control as it determines is necessary to enable the preparation of
financial statements and performance information that are free from material misstatement, whether due
to fraud or error. The Board is also responsible for the publication of the financial statements and the
performance information, whether in printed or electronic form.
Responsibilities of the Auditor
We are responsible for expressing an independent opinion on the financial statements and the performance
information and reporting that opinion to you based on our audit. Our responsibility arises from the Public
Audit Act 2001.
Independence
When carrying out the audit, we fol owed the independence requirements of the Auditor-General, which
incorporate the independence requirements of the External Reporting Board.
Other than the audit, we have no relationship with or interests in the Health Board.
Kelly Rushton
Audit New Zealand
On behalf of the Auditor-General
Wellington, New Zealand
Capital & Coast DHB Annual Report 2014/2015 - Page
55
FINANCIAL STATEMENTS
STATEMENT OF COMPREHENSIVE REVENUE AND EXPENSE
For the year ended 30 June 2015
in thousands of New Zealand Dol ars
Note
Original
Revised
2015
2015
2015
2014
Actual
Budget
Budget
Actual
Revenue
1
996,227
985,016
977,816
975,657
Total revenue
996,227
985,016
977,816
975,657
Expenditure
Clinical supplies
112,656
105,094
105,094
110,685
Employee benefit costs
2
413,360
408,303
407,803
409,095
Infrastructure and non-clinical expenses
52,754
47,115
47,115
55,540
Other operating expenses
3
4,137
4,866
4,866
4,717
Outsourced services
29,060
26,342
25,642
20,693
Payments to other district health boards
67,682
70,790
70,790
67,215
Payments to non-health board providers
258,256
259,095
257,095
253,952
Capital charge
4
8,382
8,483
8,483
8,578
Finance costs
5
16,147
16,683
16,683
16,573
Depreciation and amortisation expense
6,7
37,775
38,245
38,245
34,508
Total expenditure
1,000,209
985,016
981,816
981,556
Surplus/(deficit)
(3,982)
-
(4,000)
(5,899)
Other comprehensive revenue and expense
-
-
-
-
Total comprehensive revenue and expense
(3,982)
-
(4,000)
(5,899)
The accompanying statement of accounting policies and notes form part of these financial statements.
Explanations of significant variances against budget are detailed in note 24.
The ‘Original 2015 Budget’ column relates to the initial break-even Budget agreed with the Ministry of Health and
tabled in Parliament.
The ‘Revised 2015 Budget’ column reflects the latest Budget numbers with an agreed deficit of $4m.
Capital & Coast DHB Annual Report 2014/2015 - Page 56
STATEMENT OF CHANGES IN EQUITY
For the year ended 30 June 2015
in thousands of New Zealand Dol ars
Note
Original
Revised
2015
2015
2015
2014
Actual
Budget
Budget
Actual
Balance at 1 July
115,165
108,049
108,049
118,548
Total comprehensive revenue and
expense for the year
(3,982)
-
(4,000)
(5,899)
Owner transactions
Contribution from the Crown
5,600
-
8,000
6,000
Repayment of equity
(3,484)
(3,483)
(3,483)
(3,484)
Balance at 30 June
18
113,299
104,566
108,566
115,165
The accompanying statement of accounting policies and notes form part of these financial statements.
Explanations of significant variances against budget are detailed in note 24.
The ‘Original 2015 Budget’ column relates to the initial break-even Budget agreed with the Ministry of Health and
tabled in Parliament.
The ‘Revised 2015 Budget’ column reflects the latest Budget numbers with an agreed deficit of $4m.
Capital & Coast DHB Annual Report 2014/2015 - Page 57
link to page 80 link to page 79 link to page 78 link to page 85 link to page 87 link to page 85
STATEMENT OF FINANCIAL POSITION
As at 30 June 2015
in thousands of New Zealand Dol ars
Note
Original
Revised
2015
2015
2015
2014
Actual
Budget
Budget
Actual
Assets
Current assets
Cash and cash equivalents
11
19,101
6,471
6,471
12,097
Trade and other receivables
10
45,858
43,933
43,933
44,145
Inventories
8
7,472
8,184
8,184
8,184
Trust and special funds
12
7,619
7,116
7,116
7,116
Total current assets
80,050
65,704
65,704
71,542
Non-current assets
Property, plant and equipment
6
488,857
506,697
514,697
514,102
Intangible assets
7
22,302
8,609
8,609
14,952
Investments in joint ventures
9
-
-
-
3,955
Total non-current assets
511,159
515,306
523,306
533,009
Total assets
591,209
581,010
589,010
604,551
Equity
Crown equity
18
422,803
425,174
433,174
420,687
Revaluation reserve
18
23,606
23,606
23,606
23,606
Accumulated comprehensive revenue and
expense
18
(333,110)
(336,924)
(340,924)
(329,128)
Total equity
113,299
111,856
115,856
115,165
Liabilities
Current liabilities
Trade and other payables
16
68,153
59,339
63,339
81,580
Borrowings
13
34,326
1,248
1,248
71,248
Employee entitlements
14
61,356
61,220
61,220
59,859
Provisions
15
363
2,213
2,213
350
Patient and restricted funds
17
157
-
-
174
Total current liabilities
164,355
124,020
128,020
213,211
Non-current liabilities
Borrowings
13
305,954
339,107
339,107
269,107
Employee entitlements
14
7,309
5,775
5,775
6,787
Provisions
15
292
252
252
281
Total non-current liabilities
313,555
345,134
345,134
276,175
Total liabilities
477,910
469,154
473,154
489,386
Total equity and liabilities
591,209
589,010
589,010
604,551
The accompanying statement of accounting policies and notes form part of these financial statements.
Explanations of significant variances against budget are detailed in note 24.
The ‘Original 2015 Budget’ column relates to the initial break-even Budget agreed with the Ministry of Health and tabled in
Parliament.
The ‘Revised 2015 Budget’ column reflects the latest Budget numbers with an agreed deficit of $4m.
Capital & Coast DHB Annual Report 2014/2015 - Page 58
link to page 80 link to page 80
STATEMENT OF CASH FLOWS
For the year ended 30 June 2015
in thousands of New Zealand Dol ars
Note
Original
Revised
2015
2015
2015
2014
Actual
Budget
Budget
Actual
Cash flows from operating activities
Cash receipts from Ministry of Health and
other Crown Entities
978,390
960,332
960,332
955,127
Other receipts
17,752
19,526
12,026
17,790
Cash paid to suppliers
(538,659)
(536,109)
(529,410)
(495,203)
Cash paid to employees
(411,340)
(408,303)
(407,803)
(407,935)
Cash generated from operations
46,143
35,446
35,145
69,779
Goods and Services Tax and other taxes
(NET) (a)
2,374
-
-
494
Capital charge paid
(12,579)
(8,928)
(8,928)
(8,928)
Net cash flows from operating activities
11
35,938
26,518
26,217
61,345
Cash flows from investing activities
Interest received
2,167
907
1,208
1,131
Acquisition of property, plant and
equipment
(9,644)
(7,325)
(15,325)
(19,620)
Acquisition of intangible assets
(6,309)
(12,675)
(12,675)
(6,068)
Investment in joint venture
-
-
-
(2,021)
Appropriation from trust and special funds (b)
(521)
-
-
(146)
Net cash flows from investing activities
(14,307)
(19,093)
(26,792)
(26,724)
Cash flows from financing activities
Contribution from the Crown
5,600
-
8,000
6,000
Borrowings raised
-
-
-
901
Repayment of borrowings
(84)
-
-
(79)
Repayment of equity
(3,484)
(3,484)
(3,484)
(3,484)
Repayment of finance leases
9
-
-
(253)
Interest paid
(16,668)
(16,683)
(16,683)
(16,573)
Net cash flows from financing activities
(14,627)
(20,167)
(12,167)
(13,488)
Net increase/(decrease) in cash and cash
equivalents
7,004
(12,742)
(12,742)
21,133
Cash and cash equivalents at beginning of
year
12,097
19,213
19,213
(9,036)
Cash and cash equivalents at end of year
11
19,101
6,471
6,471
12,097
(b)
T he Goods and Services Tax (net) component of operating activities reflects the net GST paid and received
with the Inland Revenue Department. The Goods and Services Tax component has been presented on a net basis, as
the gross amounts do not provide meaningful information for financial reporting purposes.
(c)
Appropriation from trust and special funds in investing activities reflects the net of trust and special fund
revenue received and expenses paid during the year.
The accompanying statement of accounting policies and notes form part of these financial statements.
Explanations of significant variances against budget are detailed in note 24.
The ‘Original 2015 Budget’ column relates to the initial break-even Budget agreed with the Ministry of Health and
tabled in Parliament.
The ‘Revised 2015 Budget’ column reflects the latest Budget numbers with an agreed deficit of $4m.
Capital & Coast DHB Annual Report 2014/2015 - Page 59
STATEMENT OF CONTINGENT LIABILITIES AND ASSETS
As at 30 June 2015 in thousands of New Zealand Dol ars
Note
2015
2014
Actual
Actual
Legal proceedings against the DHB
230
200
Other contractual matters
474
125
704
325
The DHB has been notified of 16 potential claims but assesses that it is not likely to be liable under these claims as
at 30 June 2015 (2014: 8).
The claims are both patient and employment related. The DHB is contesting the claims, and whilst there is an
element of uncertainty as to what the courts may award, the DHB believes that any damages awarded in relation to
patient claims wil be met by its insurers.
The DHB has no contingent assets (2014: $nil).
STATEMENT OF COMMITMENTS
As at 30 June 2015
in thousands of New Zealand Dol ars
Note
2015
2014
Actual
Actual
Buildings
13,933
975
Leasehold improvements
306
570
Plant & equipment
1,302
2,584
Intangible assets
688
3,035
Capital commitments
16,229
7,164
Non-cancel able commitments – operating lease
commitments
Not more than one year
2,340
2,819
One to two years
1,728
2,055
Two to five years
1,771
1,675
Over five years
785
-
6,624
6,549
The accompanying statement of accounting policies and notes form part of these financial statements.
Capital & Coast DHB Annual Report 2014/2015 - Page 60
NOTES TO THE FINANCIAL STATEMENTS
in thousands of New Zealand Dol ars
Statement of Accounting Policies
Reporting entity
Capital & Coast District Health Board (DHB) is a Health Board established by the New Zealand Public Health and
Disability Act 2000. The DHB is a Crown entity in terms of the Crown Entities Act 2004, owned by the Crown and
domiciled in New Zealand. The DHB is a reporting entity for the purposes of the New Zealand Public Health and
Disability Act 2000, and the Crown Entities Act 2004.
The primary objective of the DHB is to provide goods or services for the community or social benefit rather than
making a financial return. Accordingly, the DHB has designated itself as a public benefit entity (PBE) for financial
reporting purposes.
The DHB’s activities involve delivering health and disability services and mental health services in a variety of ways
to the community.
Statement of compliance
The financial statements of the DHB have been prepared in accordance with the requirements of the Crown
Entities Act 2004, which includes a requirement of compliance with New Zealand General y Accepted Accounting
Practice (NZ GAAP). The financial statements have been prepared in accordance with Tier 1 PBE accounting
standards.
These financial statements are the first financial statements presented in accordance with the new PBE accounting
standards. There are no material adjustments arising on transition to the new PBE accounting standards.
Changes in accounting policies
There have been no changes in accounting policies during the financial year.
Standards, amendments and interpretations issued that are not yet effective and have not been early
adopted
Standards, amendments, and interpretations issued but not yet effective that have not been early adopted, and
which are relevant to the DHB are as listed below. The DHB has not yet assessed the effect of the new standards
and expects it wil not be early adopted.
• In May 2013, the External Reporting Board issued a new suite of PBE accounting standards for
application by public sector entities for reporting periods beginning on or after 1 July 2014. The DHB
has applied these standards in preparing the 30 June 2015 financial statements.
Basis of preparation
The financial statements for the year ended 30 June 2015 were approved by the Board on 30 October 2015.
The financial statements have been prepared for the period 1 July 2014 to 30 June 2015. Comparative figures and
balances relate to the period 1 July 2013 to 30 June 2014.
The financial statements are presented in New Zealand Dol ars (NZD), rounded to the nearest thousand.
The financial statements are prepared on the historical cost basis except where modified by the revaluation of
certain items of land, buildings and the measurement of equity instruments and derivative financial instruments at
fair value.
The accounting policies set out below have been applied consistently to al periods presented in the financial
statements.
The preparation of financial statements in conformity with International Public Sector Accounting Standards
(IPSAS) requires management to make judgements, estimates and assumptions that affect the application of
policies and reported amounts of assets and liabilities, income and expenses. The estimates and associated
assumptions are based on historical experience and various other factors that are believed to be reasonable under
the circumstances, the results of which form the basis of making the judgements about carrying values of assets
and liabilities that are not readily apparent from other sources. Actual results may differ from these estimates.
Capital & Coast DHB Annual Report 2014/2015 - Page 61
NOTES TO THE FINANCIAL STATEMENTS
in thousands of New Zealand Dol ars
The estimates and underlying assumptions are reviewed on an ongoing basis. Revisions to accounting estimates
are recognised in the period in which the estimate is revised if the revision affects only that period or in the period
of the revision and future periods if the revision affects both current and future periods.
Statement of Going Concern
The going concern principle has been adopted in the preparation of these financial statements. The Board, after
making enquiries, has a reasonable expectation that the DHB has adequate resources to continue operations for
the foreseeable future based on current trading terms and legislative requirements. The Board has reached this
conclusion having regard to circumstances which it considers likely to affect the DHB during the period of one year
from the date of signing the 2014/15 financial statements, and to circumstances which it knows wil occur after
that date which could affect the validity of the going concern assumption (as set out in its current Statement of
Intent). The key considerations are set out below.
Letter of comfort
The Board has received a letter of comfort, dated 22 October 2015 from the Ministers of Health and Finance which
states that deficit support wil be provided where necessary to maintain viability.
Capital injection of $5.6m was received during the current financial year.
Operating and cash flow forecasts
The Board has considered forecast information relating to operational viability and cash flow requirements. The
Board is satisfied that there wil be sufficient cash flows generated from operating activities to meet the investing
and financing cash flow requirements of the DHB as set out in its current Statement of Intent and based on current
trading terms and legislative requirements.
Borrowing covenants and forecast borrowing requirements
The forecast for the next year prepared by the DHB shows that the peak borrowing requirement wil not exceed
the available borrowing facilities. Furthermore, the forecast borrowing requirements can be met without breaching
covenants or other borrowing restrictions.
While the Board is confident in the ability of the DHB to continue as a going concern, if the forecast information
relating to operational viability and cash flow requirements is not achieved there would be significant uncertainty
as to whether the DHB would be able to continue as a going concern based on current trading terms and legislative
requirements.
If the DHB was unable to continue as a going concern, adjustments may have to be made to reflect the situation
that assets may have to be realised and liabilities extinguished other than in the normal course of business and at
amounts which could differ significantly from the amounts at which they are currently reported in the statement of
financial position.
Joint ventures
Joint ventures are those entities over whose activities the DHB has joint control, established by contractual
agreement.
The DHB has a 16.7% shareholding in a joint venture, Central Region Technical Advisory Services Limited (CRTAS)
and participates in its commercial and financial policy decisions. CRTAS is a joint venture company incorporated on
6 June 2001 and owned by the six DHBs within the central region.
The results of the joint venture company have not been included in the financial statements as they are not
considered significant.
Foreign currency
Transactions in foreign currencies are translated at the foreign exchange rate ruling at the date of the transaction.
Foreign exchange differences arising on translation are recognised in the statement of comprehensive revenue and
expense. Monetary assets and liabilities denominated in foreign currencies at the balance sheet date are translated
to NZD at the foreign exchange rate ruling at that date.
Capital & Coast DHB Annual Report 2014/2015 - Page 62
NOTES TO THE FINANCIAL STATEMENTS
in thousands of New Zealand Dol ars
Budget figures
The budget figures are those approved by the DHB in its District Annual Plan and included in the Statement of
Intent tabled in Parliament. The budget figures have been prepared in accordance with NZGAAP. They comply with
PBE Standards and other applicable Financial Reporting Standards as appropriate for public benefit entities. Those
standards are consistent with the accounting policies adopted by the DHB for the preparation of these financial
statements.
Property, plant and equipment
Classes of property, plant and equipment
The major classes of property, plant and equipment are as fol ows:
• freehold land
•
freehold buildings
• leasehold improvements
• plant and equipment
• furniture and fittings
• work in progress
Owned assets
Except for land and buildings assets are stated at cost less accumulated depreciation and impairment losses.
Land and buildings are valued to fair value as determined by an independent registered valuer with sufficient
regularity to ensure the carrying amount is not material y different to fair value and at least every five years. Any
increase in value of a class of land and buildings is recognised directly to equity unless it offsets a previous decrease
in value recognised in the statement of comprehensive revenue and expense. Any decreases in value relating to a
class of land and buildings are debited directly to the revaluation reserve, to the extent that they reverse previous
surpluses and are otherwise recognised as an expense in the statement of comprehensive revenue and expense.
Addition to property, plant and equipment
Additions to property, plant and equipment are recorded at cost.
Where material parts of an item of property, plant and equipment have different useful lives, they are accounted
for as separate components of property, plant and equipment.
Disposal of property, plant and equipment
Where an item of property, plant and equipment is disposed of, the gain or loss recognised in the statement of
comprehensive revenue and expense is calculated as the difference between the net sales price and the carrying
amount of the asset.
Leased assets
Finance Leases
Leases where the DHB assumes substantial y al the risks and rewards incidental to ownership of an asset, whether
or not title is eventual y transferred, are classified as finance leases. At the commencement of the lease term, the
DHB recognises finance leases as assets and liabilities in the statement of financial position at the lower of their fair
value or the present value of the minimum lease payments. The amount recognised as an asset is depreciated over
its useful life. If there is uncertainty as to whether the DHB wil obtain ownership of the asset at the end of the
lease term, the asset is ful y depreciated over the shorter of the lease term and its useful life.
Operating Lease
An operating lease is a lease that does not transfer substantial y al the risks and rewards incidental to ownership of
an asset. Lease payments under an operating lease are recognised as an expense on a straight line basis over the
lease term.
Lease incentives received are recognised in the surplus or deficit over the lease term as an integral part of the total
lease expense.
Subsequent costs
Subsequent costs are added to the carrying amount of an item of property, plant and equipment when that cost is
incurred if it is probable that the service potential or future economic benefits embodied within the new item wil
flow to the DHB. Al other costs are recognised in the statement of comprehensive revenue and expense as an
expense as incurred.
Capital & Coast DHB Annual Report 2014/2015 - Page 63
NOTES TO THE FINANCIAL STATEMENTS
in thousands of New Zealand Dol ars
Depreciation
Depreciation is charged to the statement of comprehensive revenue and expense using the straight line method.
Land is not depreciated.
Depreciation is set at rates that wil write off the cost or fair value of the assets, less their estimated residual
values, over their useful lives. The estimated useful lives of major classes of assets and resulting rates are as
fol ows:
Class of asset
Estimated life
• freehold buildings
1 to 60 years
• leasehold improvements
1 to 5 years
•
plant and equipment
1 to 25 years
• furniture and fittings
1 to 15 years
The residual value of assets is reassessed annual y.
Leasehold improvements are depreciated over their lease term.
Work in progress is not depreciated. The total cost of a project is transferred to the appropriate class of asset on its
completion and then depreciated.
Intangible assets
Research and development
Expenditure on research activities, undertaken with the prospect of gaining new scientific or technical knowledge
and understanding, is recognised in the statement of comprehensive revenue and expense as an expense as
incurred. Other development expenditure is recognised in the statement of comprehensive revenue and expense
as an expense as incurred.
Other intangibles
Other intangible assets that are acquired by the DHB are stated at cost less accumulated amortisation and
impairment losses.
Subsequent expenditure
Subsequent expenditure on intangible assets is capitalised only when it increases the service potential or future
economic benefits embodied in the specific asset to which it relates. Al other expenditure is expensed as incurred.
Amortisation
Amortisation is charged to the statement of comprehensive revenue and expense on a straight-line basis over the
estimated useful lives of intangible assets. Intangible assets are amortised from the date they are available for use.
The estimated useful lives are as fol ows:
Type of asset
Estimated life
Software
3 years
Licences
5 years
Financial instruments
Non-derivative financial instruments
Non-derivative financial instruments comprise of trade and other receivables, cash and cash equivalents, interest
bearing loans and borrowings, and trade and other payables.
Non-derivative financial instruments are recognised initial y at fair value. A financial instrument is recognised if the
DHB becomes a party to the contractual provisions of the instrument. Financial assets are derecognised if the
DHB’s contractual rights to the cash flows from the financial assets expire or the DHB transfers the financial asset
to another party without retaining control or substantial y al the risks and rewards of the asset. Regular way
purchases and sales of financial assets are accounted for at trade date, i.e. the dates that the DHB commits itself to
purchase or sel the asset. Financial liabilities are derecognised if the DHB’s obligations specified in the contract
expire or are discharged, or cancel ed.
Capital & Coast DHB Annual Report 2014/2015 - Page 64
NOTES TO THE FINANCIAL STATEMENTS
in thousands of New Zealand Dol ars
Trade and other receivables
Trade and other receivables are initial y recognised at fair value and subsequently stated at amortised cost less any
provision for impairment. Bad debts are written off during the period in which they are identified.
Inventories
Inventories are held for the DHB’s own use, and are stated at the lower of cost and net realisable value. Cost is
based on weighted average cost. Inventories held for distribution are stated at cost, adjusted where applicable for
any loss of service potential.
Cash and cash equivalents
Cash and cash equivalents comprises cash balances, cal deposits and deposits with a maturity of no more than
three months from the date of acquisition. Bank overdrafts that are repayable on demand and form an integral
part of the DHB’s cash management are included as a component of cash and cash equivalents for the statement of
cash flows.
Impairment
The carrying amounts of the DHB’s assets other than inventories and inventories held for distribution are reviewed
at each balance date to determine whether there is any indication of impairment. If any such indication exists, the
assets’ recoverable amounts are estimated. If the estimated recoverable amount of an asset is less than its carrying
amount, the asset is written down to its estimated recoverable amount and an impairment loss is recognised in the
statement of comprehensive revenue and expense.
An impairment loss on property, plant and equipment revalued on a class of asset basis is recognised directly
against any revaluation reserve in respect of the same class of asset to the extent that the impairment loss does
not exceed the amount in the revaluation reserve for the same class of asset.
Calculation of recoverable amount
The estimated recoverable amount of receivables carried at amortised cost is calculated as the present value of
estimated future cash flows, discounted at their original effective interest rate. Receivables with a short duration
are not discounted.
Estimated recoverable amount of other assets is the greater of their fair value less costs to sel and value in use.
Value in use is calculated differently depending on whether an asset generates cash or not. For an asset that does
not generate largely independent cash inflows, the recoverable amount is determined for the cash-generating unit
to which the asset belongs.
For non-cash generating assets that are not part of a cash generating unit, value in use is based on depreciated
replacement cost (DRC). For cash generating assets value in use is determined by estimating future cash flows from
the use and ultimate disposal of the asset and discounting these to their present value using a pre-tax discount rate
that reflects current market rates and the risks specific to the asset.
Impairment gains and losses, for items of property, plant and equipment that are revalued on a class of assets
basis, are also recognised on a class basis.
Reversals of impairment
Impairment losses are reversed when there is a change in the estimates used to determine the recoverable
amount.
An impairment loss on items of property, plant and equipment carried at fair value is reversed through the
revaluation reserve. Al other impairment losses are reversed through the statement of comprehensive revenue
and expense.
An impairment loss is reversed only to the extent that the asset’s carrying amount does not exceed the carrying
amount that would have been determined, net of depreciation or amortisation, if no impairment loss had been
recognised.
Interest bearing borrowings
Interest bearing borrowings are recognised initial y at fair value less attributable transaction costs. After initial
recognition, al borrowings are measured at amortised cost using the effective interest method.
Capital & Coast DHB Annual Report 2014/2015 - Page 65
NOTES TO THE FINANCIAL STATEMENTS
in thousands of New Zealand Dol ars
Employee benefits
Short term employee entitlements
Employee entitlements that the DHB expects to be settled within 12 months of balance date are measured at
undiscounted nominal values based on accrued entitlements at current rates of pay. These include salaries and
wages accrued up to balance date, annual leave earned but not yet taken at balance date.
Defined contribution plans
Certain employees are members of defined contribution schemes and the DHB contributes to those schemes. A
defined contribution scheme is a plan under which the employee and the DHB pay fixed contributions to a separate
entity. The group has no legal or constructive obligation to pay further contributions in relation to employee
service in the current and prior periods. Obligations for contributions to defined contribution plans are recognised
as an expense in the statement of comprehensive revenue and expense as incurred.
Defined benefit plan
The DHB belongs to some Defined Benefit Plan Contributors Schemes. The schemes are multi-employer defined
benefit schemes for which the DHB has no liability to fund, apart from a set percentage of members remuneration.
Any surplus/deficit of the schemes which may affect future contributions by individual employers is the liability of
the government alone. The scheme is therefore accounted for as a defined contribution scheme.
Long service leave, sabbatical leave, sick leave, medical education leave and retirement gratuities
The DHB’s net obligation in respect of long service leave, sabbatical leave, medical education leave and retirement
gratuities is the amount of future benefit that employees have earned in return for their service in the current and
prior periods. The obligation is calculated using the projected unit credit method and is discounted to its present
value. The discount rate is the market yield on relevant New Zealand government bonds at the balance sheet date.
Annual leave
Annual leave are short term obligations and are calculated on an actual basis at the amount the DHB expects to
pay. The DHB accrues the obligation for paid absences when the obligation both relates to employees’ past services
and it accumulates.
Provisions
A provision is recognised when the DHB has a present legal or constructive obligation as a result of a past event,
and it is probable that an outflow of economic benefits wil be required to settle the obligation. If the effect is
material, provisions are determined by discounting the expected future cash flows at a rate that reflects current
market rates and, where appropriate, the risks specific to the liability.
Restructuring
A provision for restructuring is recognised when the DHB has approved a detailed and formal restructuring plan,
and the restructuring has either commenced or has been announced publicly. Future operating costs are not
provided for.
Trade and other payables
Trade and other payables are initial y recognised at fair value and subsequently stated at amortised cost using the
effective interest rate.
Derivative financial instruments
The DHB uses foreign exchange and interest rate swap contracts to hedge its exposure to foreign exchange and
interest rate risks arising from operational, financing and investment activities. Derivatives that do not qualify for
hedge accounting are accounted for as trading instruments.
Derivative financial instruments are recognised initial y at fair value. Subsequent to initial recognition, derivative
financial instruments are stated at fair value. The gain or loss on re-measurement to fair value is recognised
immediately in the statement of comprehensive revenue and expense. However, where derivatives qualify for
hedge accounting, recognition of any resultant gain or loss depends on the nature of the item being hedged.
The fair value of interest rate swaps is the estimated amount that the DHB would receive or pay to terminate the
swap at the balance sheet date, taking into account current interest rates and the current creditworthiness of the
swap counterparties. The fair value of forward exchange contracts is their quoted market price at the balance
sheet date, being the present value of the quoted forward price.
Capital & Coast DHB Annual Report 2014/2015 - Page 66
NOTES TO THE FINANCIAL STATEMENTS
in thousands of New Zealand Dol ars
Hedging: cash flow hedges
Where a derivative financial instrument is designated as a hedge of the variability in cash flows of a recognised
asset or liability, or a highly probable forecast transaction, the effective part of any gain or loss on the derivative
financial instrument is recognised directly in equity.
When the forecast transaction subsequently results in the recognition of a non-financial asset or non-financial
liability, or the forecast transaction becomes a firm commitment, the associated cumulative gain or loss is removed
from equity and included in the initial cost or other carrying amount of the non-financial asset or liability. If a hedge
of a forecast transaction subsequently results in the recognition of a financial asset or a financial liability, the
associated gains and losses that were recognised directly in equity are reclassified into the statement of
comprehensive revenue and expense in the same period or periods during which the asset acquired or liability
assumed affects the statement of comprehensive revenue and expense (i.e. when interest income or expense is
recognised). For cash flow hedges, other than those covered by the preceding two policy statements, the
associated cumulative gain or loss is removed from equity and recognised in the statement of comprehensive
revenue and expense in the same period or periods during which the hedged forecast transaction affects the
statement of comprehensive revenue and expense. The ineffective part of any gain or loss is recognised
immediately in the statement of comprehensive revenue and expense.
When a hedging instrument expires or is sold, terminated or exercised, or the entity revokes designation of the
hedge relationship but the hedged forecast transaction is stil expected to occur, the cumulative gain or loss at that
point remains in equity and is recognised in accordance with the above policy when the transaction occurs. If the
hedged transaction is no longer expected to take place, the cumulative unrealised gain or loss recognised in equity
is recognised immediately in the statement of comprehensive revenue and expense.
Income tax
The DHB is a Crown entity under the New Zealand Public Health and Disability Act 2000 and is therefore exempt
from the payment of income tax. Accordingly, no provision has been made for income tax.
Goods and services tax
Al amounts are shown exclusive of Goods and Services Tax (GST), except for receivables and payables that are
stated inclusive of GST. Where GST is irrecoverable as an input tax, it is recognised as part of the related asset or
expense.
Commitments and contingencies are disclosed exclusive of GST. The net amount of GST recoverable from, or
payable to, the Inland Revenue Department is included as part of receivables or payables in the statement of
financial position.
The net GST paid to, or received from the IRD, including the GST related to investing and financing activities, is
classified as an operating cash flow in the statement of cash flows.
Borrowing costs
Borrowing costs are recognised as an expense in the period in which they are incurred, except to the extent that
they are directly attributable to the acquisition or construction of a qualifying asset, in which case, they are
capitalised as part of the cost of that asset.
Capital charge
The capital charge is recognised as an expense in the period to which the charge relates.
Revenue
Revenue is measured at the fair value of consideration received or receivable.
Crown funding
The majority of revenue is provided through an appropriation in association with a Crown Funding Agreement.
Revenue is recognised monthly in accordance with the Crown Funding Agreement payment schedule, which
al ocates the appropriation equal y throughout the year. The DHB considers there are no conditions attached to
the funding and it is recognised as revenue at the point of entitlement.
Capital & Coast DHB Annual Report 2014/2015 - Page 67
NOTES TO THE FINANCIAL STATEMENTS
in thousands of New Zealand Dol ars
Goods sold and services rendered
Revenue from goods sold is recognised when the DHB has transferred to the buyer the significant risks and rewards
of ownership of the goods and the DHB does not retain either continuing managerial involvement to the degree
usual y associated with ownership nor effective control over the goods sold.
Revenue from services is recognised, to the proportion that a transaction is complete, when it is probable that the
payment associated with the transaction wil flow to the DHB and that payment can be measured or estimated
reliably, and to the extent that any obligations and al conditions have been satisfied by the DHB.
Revenue from other DHBs
Inter-district patient inflow revenue occurs when a patient treated within the CCDHB region is domiciled outside of
the Capital & Coast region. The Ministry of Health credits CCDHB with a monthly amount based on estimated
patient treatment for non - Capital & Coast residents within Capital & Coast region. An annual wash-up occurs at
year end to reflect the actual number of non - Capital & Coast patients treated at CCDHB.
Interest income
Interest income is recognised using the effective interest rate method.
Rental income
Rental income from property is recognised in the statement of comprehensive revenue and expense on a straight-
line basis over the term of the lease.
Donated assets
Where a physical asset is gifted to or acquired by the DHB for nil or nominal cost, the fair value of the asset
received is recognised as income. Such assets are recognised as income when control over the asset is obtained.
Expenses
Operating lease payments
Payments made under operating leases are recognised as an expense in the statement of comprehensive revenue
and expense on a straight-line basis over the term of the lease.
Finance lease payments
Minimum lease payments are apportioned between the finance charge and the reduction of the outstanding
liability. The finance charge is al ocated to each period during the lease term on an effective interest basis.
Cost of service (statement of service performance)
The cost of service statements, as reported in the statement of service performance, report the net cost of services
for the outputs of the DHB and are represented by the cost of providing the output less al the revenue that can be
al ocated to these activities.
Cost al ocation
The DHB has arrived at the net cost of service for each significant activity using the cost al ocation system outlined
below.
Cost al ocation policy
Direct costs are charged directly to output classes. Indirect costs are charged to output classes based on cost
drivers and related activity and usage information.
Criteria for direct and indirect costs
Direct costs are those costs directly attributable to an output class.
Indirect costs are those costs that cannot be identified in an economical y feasible manner with a specific output
class.
Cost drivers for al ocation of indirect costs
The cost of internal services not directly charged to outputs is al ocated as overheads using appropriate cost drivers
such as actual usage, staff numbers and floor area. For the year ended 30 June 2015, indirect costs accounted for
1.46% of the DHB’s total costs (2014: 1.54%).
Capital & Coast DHB Annual Report 2014/2015 - Page 68
NOTES TO THE FINANCIAL STATEMENTS
in thousands of New Zealand Dol ars
Accounting estimates and judgements
Management has discussed with the Finance Risk & Audit Committee the development, selection and disclosure of
the DHB’s critical accounting policies and estimates and the application of these policies and estimates.
Key sources of estimated uncertainty
In preparing these financial statements the DHB has made estimates and assumptions concerning the future. These
assumptions may differ from the subsequent actual results. Estimates and assumptions are continual y evaluated
and are based on historical experience and other factors, including expectations of future events that are believed
to be reasonable under the circumstances. The estimates and assumptions that have a significant risk of causing a
material adjustment to the carrying amounts of assets and liabilities within the next financial year are discussed
below.
Property, plant and equipment
At each balance date the DHB reviews the useful lives and residual values of its property plant and equipment.
Assessing the appropriateness of useful life and residual value estimates of property plant and equipment requires
the DHB to consider a number of factors such as the physical condition of the asset, expected period of use of the
asset, and expected disposal proceeds from the future sale of the asset.
An incorrect estimate of the useful life or residual value wil impact the depreciation expense recognised in the
statement of comprehensive revenue and expense, and carrying amount of the asset in the statement of financial
position. The DHB minimises the risk of estimation uncertainty by:
• physical inspection of assets
• asset replacement programmes
• obtaining valuations
The DHB has not made significant changes to past assumptions concerning useful lives and residual values. The
carrying amounts of property, plant and equipment are disclosed in note 6.
Retirement, long service leave, sick leave and continuing education
Assessing the exposure to long term employee benefits involves making estimates of future length of service and
interest rates. The risk is minimised by utilising the services of an actuary.
Critical accounting judgements in applying the DHB’s accounting policies
Leases classification
Determining whether a lease agreement is a finance lease or an operating lease requires judgement as to whether
the agreement transfers substantial y al the risks and rewards to the DHB.
Finance and operating leases
Judgement is required on various aspects that include, but are not limited to, the fair value of the leased asset, the
economic life of the leased asset, whether or not to include renewal options on the lease term and determining an
appropriate discount rate to calculate the present value of the minimum lease payments. Classification as a finance
lease means the asset is recognised in the statement of financial position as property, plant and equipment,
whereas for an operating lease no such asset is recognised.
The DHB has exercised its judgement on the appropriate classification of equipment leases, and has determined a
number of lease arrangements are finance leases.
Capital & Coast DHB Annual Report 2014/2015 - Page 69
NOTES TO THE FINANCIAL STATEMENTS
in thousands of New Zealand Dol ars
1
REVENUE
2015
2014
Actual
Actual
Ministry of Health contract funding
754,035
748,225
Other government
20,332
17,153
Inter district flows (other DHBs)
201,501
192,481
Non government & crown agency sourced
17,551
16,035
Interest income
2,514
1,131
Income from donations
294
632
996,227
975,657
2
E
MPLOY
EE B
ENEF
IT CO
STS
2015
2014
Actual
Actual
Direct staff costs (excluding increases in employee benefit
provisions)
384,174
383,772
Indirect staff costs (excluding contributions to defined
14,354
12,239
contribution plans and increases in employee benefit
provisions)
Contributions to defined contribution plans
12,070
11,391
Increase/(decrease) in employee benefit provisions
2,762
1,693
413,360
409,095
Employer contributions to defined contribution plans include contributions to Kiwisaver, State Sector
Retirement Savings Scheme and the Defined Benefit Plan Contributors Scheme.
3
OTHER OPERATING EXPENSES
Note
2015
2014
Actual
Actual
Impairment of trade receivables (bad debts)
-
142
Increase /(decrease) in provision of trade receivables
(doubtful debts)
10
122
740
(Gain)/loss on disposal of property, plant and equipment
29
97
Audit fees for financial statements audit
207
194
Fees for other assurance services
6
75
Board member fees
21
370
362
Operating lease expense
2,744
2,644
Other operating expenses
659
463
4,137
4,717
Capital & Coast DHB Annual Report 2014/2015 - Page 70
NOTES TO THE FINANCIAL STATEMENTS
in thousands of New Zealand Dol ars
4
CAPITAL CHARGE
2015
2014
Actual
Actual
The DHB pays a monthly capital charge to the Crown based on
the greater of its actual or budgeted closing equity balance. The
capital charge rate for the period ended 30 June 2015 was 8 per
8,382
8,578
cent (2014: 8 per cent)
5
FINANCE COSTS
2015
2014
Actual
Actual
Interest on term borrowings
16,147
16,556
Interest on finance leases
-
17
16,147
16,573
Capital & Coast DHB Annual Report 2014/2015 - Page 71
NOTES TO THE FINANCIAL STATEMENTS
in thousands of New Zealand Dol ars
6
PROPERTY, PLANT AND EQUIPMENT
Freehold
Freehold
Leasehold
Plant &
Furniture &
land
buildings
Improvements
Equipment
Fittings
Total
Cost
Balance at 1 July 2013
25,705
445,253
276
81,435
25,279
577,948
Additions
-
12,564
348
3,790
1,407
18,109
Disposals
-
-
-
(243)
(14)
(257)
Impairment losses
-
-
-
-
-
-
Revaluations
-
-
-
-
-
-
Transfer to fixed assets
-
-
-
-
-
-
Restatement plant &
-
-
-
-
-
-
equipment, furniture &
fittings
Transfer between
-
-
-
-
-
-
categories
Balance at 30 June 2014
25,705
457,817
624
84,982
26,672
595,800
Balance at 1 July 2014
25,705
457,817
624
84,982
26,672
595,800
Additions
-
4,730
151
3,311
1,132
9,324
Disposals
-
-
(11)
(135)
(40)
(186)
Impairment losses
-
-
-
-
-
-
Revaluations
-
-
-
-
-
-
Transfer to fixed assets
-
-
-
-
-
-
Restatement plant &
-
-
-
-
-
-
equipment, furniture &
fittings
Transfer between
-
-
-
-
-
-
categories
Balance at 30 June 2015
25,705
462,547
764
88,158
27,764
604,938
Depreciation and
impairment losses
Balance at 1 July 2013
-
(1,937)
(232)
(37,328)
(14,880)
(54,377)
Depreciation charge for
-
(21,298)
(15)
(8,521)
(3,004)
(32,838)
the year
Impairment losses
-
-
-
-
-
-
Disposals
-
-
-
140
-
140
Revaluations
-
-
-
-
-
-
Restatement plant &
-
-
-
-
-
-
equipment, furniture &
fittings
Transfer between
-
-
-
-
-
-
categories
Balance at 30 June 2014
-
(23,235)
(247)
(45,709)
(17,884)
(87,075)
Capital & Coast DHB Annual Report 2014/2015 - Page 72
NOTES TO THE FINANCIAL STATEMENTS
in thousands of New Zealand Dol ars
6
PROPERTY, PLANT AND EQUIPMENT (CONTINUED)
Freehold
Freehold
Leasehold
Plant &
Furniture &
land
buildings
Improvements
Equipment
Fittings
Total
Depreciation and
impairment losses
Balance at 1 July 2014
-
(23,235)
(247)
(45,709)
(17,884)
(87,075)
Depreciation charge for
-
(22,635)
(65)
(9,470)
(3,001)
(35,171)
the year
Impairment losses
-
-
-
-
-
-
Disposals
-
-
11
68
40
119
Revaluations
-
-
-
-
-
-
Restatement plant &
-
-
-
-
-
-
equipment, furniture &
fittings
Transfer between
-
-
-
-
-
-
categories
Balance at 30 June 2015
-
(45,870)
(301)
(55,111)
(20,845) (122,127)
Carrying amounts
At 1 July 2013
25,705
443,316
44
44,107
10,399
523,571
At 30 June 2014
25,705
434,582
377
39,273
8,788
508,725
At 1 July 2014
25,705
434,582
377
39,273
8,788
508,725
At 30 June 2015
25,705
416,677
463
33,047
6,919
482,811
Freehold
Freehold
Leasehold
Plant &
Furniture &
land
buildings
Improvements
Equipment
Fittings
Total
Work in progress
Balance at 1 July 2013
-
3,257
78
352
1,865
5,552
Additions
-
13,289
472
3,833
350
17,944
Transfer from WIP
-
(12,564)
(348)
(3,800)
(1,407)
(18,119)
Balance at 30 June 2014
-
3,982
202
385
808
5,377
Balance at 1 July 2014
-
3,982
202
385
808
5,377
Additions
-
5,789
132
3,337
-
9,258
Transfer from WIP
-
(4,733)
(141)
(3,073)
(642)
(8,589)
Balance at 30 June 2015
-
5,038
193
649
166
6,046
Capital & Coast DHB Annual Report 2014/2015 - Page 73
NOTES TO THE FINANCIAL STATEMENTS
in thousands of New Zealand Dol ars
6 PROPERTY, PLANT AND EQUIPMENT (CONTINUED)
Revaluation
Current Crown accounting policies require al crown entities to revalue land and buildings in
accordance with PBE IPSAS 17, Property, Plant and Equipment. Current valuation standards and
guidance notes have been developed in association with the treasury for the valuation of hospitals and
tertiary institutions.
The revaluation of land and buildings was carried out as at 21 June 2013 by Milton Bevin, FPINZ, an
independent registered valuer with Col iers International New Zealand Limited. The valuation conforms
to international valuation standards. Land revaluation was determined by reference to its highest and
best use. The revaluation of buildings was based on depreciated replacement cost methodology.
The total fair value of land valued by the valuer amounted to $25.7m.
The total fair value of buildings valued by the valuer amounted to $445.3m.
Buildings revaluation recognised in statement of comprehensive revenue and expense
Year
Particulars
Actual
2002
Revaluation loss
(65,939)
2004
Revaluation gain
11,898
2006
Revaluation gain
16,257
2011
Revaluation gain
17,433
2013
Revaluation gain
20,301
Revaluation loss carried forward
(50)
The initial revaluation loss on buildings as at 30 June 2002 of $65.9m was recognised in the statement
of comprehensive revenue and expense. PBE IPSAS 17 states that any subsequent revaluation increase
in buildings shal be recognised in the statement of comprehensive revenue and expense to the extent
that it reverses a revaluation decrease, of the same asset, previously recognised in the statement of
comprehensive revenue and expense. As at 30 June 2015 net revaluation losses of $0.05m are carried
forward to future years.
Borrowing costs
The total amount of borrowing costs capitalised during the year ended 30 June 2015 was $16.8m
(2014: $16m).
Restrictions
The DHB does not have ful title to Crown land it occupies but transfer is arranged if and when land is
sold. Some of the land is subject to Waitangi Tribunal claims. The disposal of certain properties may be
subject to the provision of section 40 of the Public Works Act 1981 and Maori Protection Mechanisms.
Titles to land transferred from the Crown to the DHB are subject to a memorial in terms of the Treaty
of Waitangi Act 1975 (as amended by the Treaty of Waitangi (State Enterprises) Act 1988). The effect
on the value of assets resulting from potential claims under the Treaty of Waitangi Act 1975 cannot be
quantified.
Leased assets
The net carrying amount of property, plant and equipment held under finance leases is $nil.
(2014:$0.007m).
Capital & Coast DHB Annual Report 2014/2015 - Page 74
link to page 59
NOTES TO THE FINANCIAL STATEMENTS
in thousands of New Zealand Dol ars
7 INTANGIBLE ASSETS
FPSC Shared
Services
Software
Rights
Licences
Total
Cost
Balance at 1 July 2013
10,617
2,637
2,464
15,718
Additions
3,513
2,452
103
6,068
Disposals
-
-
-
-
Transfer to fixed assets
-
-
-
-
Impairment losses
-
-
-
-
Transfer between categories
-
-
-
Balance at 30 June 2014
14,130
5,089
2,567
21,786
Balance at 1 July 2014
14,130
5,089
2,567
21,786
Additions
6,209
1,378
280
7,867
Disposals
-
-
-
-
Transfer to fixed assets
-
-
-
-
Impairment losses
-
-
-
-
Transfer between categories
-
-
-
-
Balance at 30 June 2015
20,339
6,467
2,847
29,653
Amortisation and impairment losses
Balance at 1 July 2013
(8,443)
-
(1,357)
(9,800)
Amortisation charge for the year
(1,306)
-
(364)
(1,670)
Impairment losses
-
-
-
-
Disposals
-
-
-
-
PP&E restatement
-
-
-
-
Transfer between categories
-
-
-
-
Balance at 30 June 2014
(9,749)
-
(1,721)
(11,470)
Balance at 1 July 2014
(9,749)
-
(1,721)
(11,470)
Amortisation charge for the year
(2,161)
-
(443)
(2,604)
Impairment losses
-
-
-
Disposals
-
-
-
-
PP&E restatement
-
-
-
-
Transfer between categories
-
-
-
-
Balance at 30 June 2015
(11,910)
-
(2,164)
(14,074)
Carrying amounts
At 1 July 2013
2,174
2,637
1,107
5,918
At 30 June 2014
4,381
5,089
846
10,316
At 1 July 2014
4,381
5,089
846
10,316
At 30 June 2015
8,429
6,467
683
15,579
Capital & Coast DHB Annual Report 2014/2015 - Page 75
link to page 59
NOTES TO THE FINANCIAL STATEMENTS
in thousands of New Zealand Dol ars
7
INTANGIBLE ASSETS (CONTINUED)
Software
Licences
CRTAS
Total
Work in progress
Balance at 1 July 2013
2,856
75
-
2,931
Additions
5,289
308
-
5,597
Transfer from WIP
(3,788)
(103)
-
(3,891)
Balance at 30 June 2014
4,357
280
-
4,637
Balance at 1 July 2014
4,357
280
-
4,637
Additions
3,713
-
4,862
8,575
Transfer from WIP
(6,209)
(280)
-
(6,489)
Balance at 30 June 2015
1,861
-
4,862
6,723
There are no restrictions over the title of Capital & Coast District Health Board’s intangible assets, nor are any
intangible assets pledged as security for liabilities
HBL
Health Benefits Limited (HBL) was established in July 2010. HBL is undertaking a Finance, Procurement and Supply
Chain (FPSC) shared services project aimed at reducing costs in administrative support and procurement for the
public health sector. The FPSC project is to be funded by the 20 DHBs across the country who wil be the
beneficiaries of these savings. As at 30 June 2015, the DHB has incurred $6.47m as its share of the project. This
funding represents an intangible asset and gives the DHB the right to access shared services.
It was announced that HBL wil wind down in June 2015 with its assets and liabilities being transferred to a new
company - New Zealand Health Partnerships (NZHP). Each of the 20 DHBs wil obtain a direct interest in NZHP based
on their proportional contribution to the establishment of the FPSC shared services.
The investment has been tested for impairment during the year by the CCDHB Board and management. However at
this stage on the information available no impairment is required at this point.
Central Region Information Systems Plan (CRISP)
CRISP is a programme to move the Central Region District Health Boards from a current state of disparate,
fragmented and, in some cases obsolescent, clinical and administrative information systems to a future state of
shared, standardised and ful y integrated information systems that wil enhance clinical practice, drive
administrative efficiencies, enable regionalisation of services and reduce current operational risks.
It was original y agreed that Central Region Technical Advisory Services Limited (CRTAS) would create the CRISP
assets and provide services in relation to those assets to the DHBs. Each DHB would provide funding to CRTAS and in
return for the funding relating to capital items the DHBs would be provided with Class B Redeemable Shares in
CRTAS.
The agreement to provide the CRISP assets and services was amended on 1 December 2014 to transfer the
ownership of CRISP assets to the DHBs jointly. As at 30 June 2015, CCDHB had contributed $4.862m towards capital
expenditure which has been recognised as Work in Progress (WIP) in respect of intangible assets.
The investment has been tested for impairment during the year by the CCDHB Board and management. However at
this stage on the information available no impairment is required at this point.
Capital & Coast DHB Annual Report 2014/2015 - Page 76
link to page 59
NOTES TO THE FINANCIAL STATEMENTS
in thousands of New Zealand Dol ars
8
INVENTORIES
2015
2014
Actual
Actual
Pharmaceuticals
1,682
1,828
Surgical & medical supplies
5,631
5,805
Other supplies
159
551
7,472
8,184
The amount of inventories recognised as an expense during the year ended 30 June 2015 was $53.0m
(2014: $52.3m). Al inventories are distributed to operating areas in the normal course of business.
The write-down of inventories held for distribution amounted to $nil (2014: $nil). There have been no
reversals of write-downs.
No inventories are pledged as security for liabilities, but some inventories are subject to retention of title
clauses (Romalpa clauses). The value of stocks subject to such clauses cannot be quantified due to the
inherent difficulties in identifying the specific inventories affected at year-end.
9
INVESTMENTS IN JOINT VENTURES
Carrying amount of investments in joint ventures
2015
2014
Actual
Actual
Uncal ed ordinary share capital
-
-
Advance on redeemable preference shares
-
3,955
-
3,955
Central Region Technical Advisory Services (CRTAS) has a total ordinary share capital of $600 of which the
DHB share is $100. At balance date al ordinary share capital remains uncal ed.
Summary of the DHB’s interests in Central TAS joint venture (16.67%)
2015
2014
Actual
Actual
Non-current assets
67
1,937
Current assets
2,115
3,587
Non-current liabilities
-
-
Current liabilities
1,929
2,245
Net assets/(liabilities)
253
3,279
Income
5,693
4,044
Expense
5,667
3,993
26
51
Owing to the minor nature of the joint venture, no results are recorded in the DHB’s financial statements.
The DHB’s share in contingent liabilities
Central Region TAS has no contingent liabilities. (2014: $nil)
The DHB’s share in commitments
The DHB share of Capital Commitments for CRTAS is $nil (2014: $0.5m).
Capital & Coast DHB Annual Report 2014/2015 - Page 77
link to page 59
NOTES TO THE FINANCIAL STATEMENTS
in thousands of New Zealand Dol ars
10
TRADE AND OTHER RECEIVABLES
2015
2014
Actual
Actual
Trade receivables from non-related parties
3,327
3,873
Ministry of Health receivables
14,718
14,816
Other DHB receivables
12,584
8,614
30,629
27,303
Accrued income
10,997
12,409
Prepayments
4,232
4,433
Total receivables
45,858
44,145
Total receivables comprises:
Receivable from the sale of goods and services (exchange transactions)
31,140
29,329
Receivable from Ministry funding (non-exchange transactions)
14,718
14,816
Trade receivables are shown net of a provision for doubtful debts amounting to $0.6m (2014: $0.8m)
The carrying value of receivables approximates their fair value.
As at 30 June 2015, al overdue receivables have been assessed for impairment and appropriate
provisions applied, as detailed below:
2015
2014
Gross Impairment
Net
Gross
Impairment
Net
Not past due
28,558
-
28,558
25,467
-
25,467
Past due 1-30 days
501
-
501
734
-
734
Past due 31-60
443
-
443
401
-
401
days
Past due 61-90
512
-
512
388
-
388
days
Past due > 91 days
1,220
605
615
1,132
819
313
Total
31,234
605
30,629
28,122
819
27,303
Each year trade receivables are reviewed as to col ectability, and where a doubt is identified a provision is
made. Factors considered are the age of the debt, domicile of the debtor, and the type of service provided.
Large receivables are individual y reviewed, whilst for smal debts the historical pattern is used as a guide.
Movements in the provision for impairment of receivables are as fol ows:
2015
2014
Actual
Actual
Balance at 1 July 2014
819
489
Additional provisions made during the year
122
740
Provisions reversed during the year
-
-
Receivables written-off during period
(336)
(410)
Balance at 30 June 2015
605
819
Capital & Coast DHB Annual Report 2014/2015 - Page 78
link to page 59
NOTES TO THE FINANCIAL STATEMENTS
in thousands of New Zealand Dol ars
11
CASH AND EQUIVALENTS
2015
2014
Actual
Actual
Petty cash
13
13
Bank accounts
74
91
HBL cal deposits
19,014
11,993
Cash and Cash equivalents
19,101
12,097
Patient funds
The DHB administers certain funds on behalf of patients. These funds are held in separate bank accounts and
interest earned is al ocated to the individual patients. The funds are not included in the above balances.
Bank facility
Capital & Coast DHB is party to the “DHB Treasury Services Agreement” between Health Benefits Limited
(HBL) and the participating DHBs. This Agreement enables HBL to “sweep” DHB bank accounts daily and invest
surplus funds on their behalf.
The DHB Treasury Services Agreement provides for individual DHBs to have a debit balance with HBL, which
wil incur interest at on-cal interest rate received by HBL plus an administrative margin. The maximum
working capital facility limit for CCDHB is $51.9m. (2014:$51.8m). The highest overdrawn bank balance during
financial year 2014/15 was $6m.(2014: $31.4m).
Reconciliation of surplus for the year with net cash flows from operating activities:
2015
2014
Actual
Actual
Surplus/(deficit) for the year
(3,982)
(5,899)
Add back non-cash items:
Depreciation & amortisation
37,775
34,508
Revaluation gain
-
-
Add back items classified as investing activity:
Net loss/(gain) on disposal of property, plant and equipment
(461)
97
Interest income on financial assets
(2,514)
(1,131)
Add back items classified as financing activity:
Interest expense on financial liabilities
16,148
16,573
Movements in working capital:
(Increase)/decrease in trade and other receivables
(1,713)
(1,380)
(Increase)/decrease in trust funds
(505)
-
(Increase)/decrease in inventories
712
(165)
Increase/(decrease) in trade and other payables
(11,565)
17,501
Increase/(decrease) in employee benefits
2,019
1,162
Increase/(decrease) in provisions
24
79
Net movement in working capital
(11,028)
17,197
Net cash inflow/(outflow) from operating activities
35,938
61,345
Capital & Coast DHB Annual Report 2014/2015 - Page 79
link to page 59
NOTES TO THE FINANCIAL STATEMENTS
in thousands of New Zealand Dol ars
12
TRUST AND SPECIAL FUNDS
Special funds are funds donated or bequeathed for a specific purpose. The use of these assets must comply
with the specific terms of the sources from which the funds were derived and are accounted for separately
through the DHB’s trust ledger. The revenue and expenditure in respect of these funds is included in the
statement of comprehensive revenue and expense.
The DHB also administers funds on behalf of certain patients. Patient fund transactions are not recognised
in the statement of comprehensive revenue and expense, but are recorded in the statement of financial
position as both an asset and a liability.
Al trust and special funds are held in bank accounts that are separate from the DHB’s normal banking
facilities.
2015
2014
Non patient funds
Actual
Actual
Balance at 1 July 2014
6,961
6,812
Monies received
1,987
2,128
Interest received
300
264
Payments made
(1,767)
(2,243)
Balance at 30 June 2015
7,481
6,961
Patient funds
Balance at 1 July 2014
155
148
Monies received
177
172
Interest received
2
2
Payments made
(196)
(167)
Balance at 30 June 2015
138
155
Total trust and special funds
7,619
7,116
Capital & Coast DHB Annual Report 2014/2015 - Page 80
link to page 59
NOTES TO THE FINANCIAL STATEMENTS
in thousands of New Zealand Dol ars
13
INTEREST BEARING LOANS AND BORROWINGS
2015
2014
Actual
Actual
Current
Secured Ministry of Health loans
34,000
71,000
Unsecured EECA loans
326
240
Finance leases
-
8
34,326
71,248
Non-current
Secured Ministry of Health loans
305,000
268,000
Unsecured EECA loans
954
1,107
305,954
269,107
Secured loans
The DHB secured loans are from the Ministry of Health. The details of terms and conditions are as fol ows:
2015
2014
Interest rate summary
Actual
Actual
Ministry of Health
3.34% - 6.37%
2.74% - 7.13%
Health Benefit Limited
4.22% - 5.28%
4.55% - 5.07%
Finance leases
6.50%
6.50%
Energy Efficiency and Conservation Authority (EECA)
0%
0%
2015
2014
Loan repayable as fol ows:
Actual
Actual
Within one year
34,326
71,240
One to two years
34,326
34,285
Two to five years
201,628
130,777
Later than five years
70,000
104,045
340,280
340,347
Capital & Coast DHB Annual Report 2014/2015 - Page 81
link to page 59
NOTES TO THE FINANCIAL STATEMENTS
in thousands of New Zealand Dol ars
13
INTEREST BEARING LOANS AND BORROWINGS (CONTINUED)
2015
2014
Analysis of finance leases
Actual
Actual
Minimum lease payments payable
Within one year
-
9
One to two years
-
-
Two to five years
-
-
Later than five years
-
-
Total minimum lease payments
-
9
Future finance charges
-
(1)
Present value of minimum lease payments
-
8
Present value of minimum lease payments payable
Within one year
-
8
One to two years
-
-
Two to five years
-
-
Later than five years
-
-
Total present value of minimum lease payments
-
8
2015
2014
Term loan facility limits
Actual
Actual
Ministry of Health loan
339,000
339,000
Energy Efficiency and Conservation Authority (EECA)
1,280
1,347
340,280
340,347
Security and terms
The loan facility is provided by the Ministry of Health. $311m facility limit expires in December 2021. $28m
facility limit expires in April 2022. Without the Ministry’s prior written consent the DHB cannot perform
the fol owing actions:
• create any security over its assets except in certain defined circumstances
• lend money to another person or entity (except in the ordinary course of business and then only
on commercial terms) or give a guarantee
• make a substantial change in the nature or scope of its business as presently conducted or
undertake any business or activity unrelated to health and
• dispose of any of its assets except disposals at ful value in the ordinary course of business
• provide services to or accept services from a person other than for proper value and on
reasonable commercial terms.
The DHB is not required to meet any covenants. The NZ Government does not guarantee term loans.
The total borrowings with the Debt Management Office is $339m. Of this $6m is maturing in November
2015 and $28m is maturing in April 2016.
Capital & Coast DHB Annual Report 2014/2015 - Page 82
NOTES TO THE FINANCIAL STATEMENTS
in thousands of New Zealand Dol ars
14
EMPLOYEE ENTITLEMENTS
2015
2014
Actual
Actual
Current liabilities
Liability for long service leave
1,702
2,010
Liability for sabbatical leave
268
290
Liability for retirement gratuities
1,030
1,000
Liability for annual leave
36,711
35,509
Liability for sick leave
1,096
1,727
Liability for continuing medical education leave and expenses
7,369
8,171
Salary and wages accrual
13,180
11,152
61,356
59,859
Non-current liabilities
Liability for long service leave
4,237
3,697
Liability for sabbatical leave
403
350
Liability for retirement gratuities
1,596
1,728
Liability for continuing medical education leave and expenses
1,073
1,012
7,309
6,787
Defined benefit plans
The DHB has employees who are members of defined benefit plans. The funding liability of these plans is
assumed by central government.
Other employee entitlement liabilities
Liability for salaries and wages accrued is recognised as at current actual salaries.
Liability for annual leave is calculated as the greater of average weekly earnings for the 12 months
immediately before the end of the last pay period before the annual holiday is taken or the employee’s
ordinary weekly pay as at the beginning of the annual holiday.
Actuarial valuations have been obtained for the remaining liabilities. The actuarial valuations include a
salary growth factor of 2.5%, (2014:3.5%) and a discount rate ranging from 2.97% to 4.29% (2014: 3.42%
to 4.95%) from 1-10+ years.
If the discount rate were to differ by 1% from that used, with al other factors held constant, the carrying
amount of the retirement and long service leave liability would be an estimated $0.4m higher/lower.
If the salary inflation factor were to differ by 1% from that used, with al other factors held constant, the
carrying amount of the retirement and long service leave liability would be an estimated $0.4m
higher/lower.
Capital & Coast DHB Annual Report 2014/2015 - Page 83
link to page 59
NOTES TO THE FINANCIAL STATEMENTS
in thousands of New Zealand Dol ars
15
PROVISION
2015
2014
Actual
Actual
Current provisions
ACC Partnership Programme
363
350
Non current provisions
ACC Partnership Programme
292
281
2015
2014
ACC Partnership Programme
Actual
Actual
Undiscounted amount of claims at balance date
577
515
Discount
13
18
Central estimate of present value of future payments
590
569
Risk margin
65
62
655
631
The movement in provisions is represented by:
ACC
Partnership
Programme
2014
Balance at 1 July 2013
552
Additional provisions during the year for the risks borne in current period
308
Decrease in provisions relating to a reassessment of risks in a previous period
321
Subtotal
1,181
Amounts used during the year
550
Total liability
631
(Decrease) / increase in provision
79
ACC
Partnership
Programme
2015
Balance at 1 July 2014
631
Additional provisions during the year for the risks borne in current period
439
Additional provisions relating to a reassessment of risks in a previous period
248
Subtotal
1,318
Amounts used during the year
663
Total liability
655
(Decrease) / increase in provision
24
Capital & Coast DHB Annual Report 2014/2015 - Page 84
link to page 59
NOTES TO THE FINANCIAL STATEMENTS
in thousands of New Zealand Dol ars
15
PROVISION (CONTINUED)
ACC Partnership Programme
The ACC Partnership Program (APP) offers the DHB the option to accept injury management and financial
responsibility for employees who suffer work-related il ness or injury for a specified period. In return, the accredited
employer’s ACC premiums are reduced. Participation in the APP is an insurance contract between the employer and
the employee, as the employer (insurer) accepts significant insurance risk from the employee (policyholder) by
agreeing to compensate the employee if a work-related injury (the insured event) adversely affects the employee.
The value of this liability represents the expected future payments in relation to accidents and il nesses occurring up
to the balance sheet date for which the DHB has responsibility under the terms of the Partnership Programme.
The liability is measured at the present value of anticipated future payments to be made in respect of the employee
injuries and claims up to the reporting date using actuarial techniques. Consideration is given to expected future
wage and salary levels, and experience of employee claims and injuries. The liability for claims reported prior to
balance date has been determined by assuming that the future experience for each current claim is consistent with
historical claim information since the commencement of the programme.
The value of the liability includes a risk margin that represents the inherent uncertainty of the present value of the
expected future payments. The DHB manages its exposure arising from the programme by promoting a safe and
healthy working environment by:
• implementing and monitoring health and safety policies
• induction training on health and safety
• actively managing work place injuries to ensure employees return to work as soon as practical
• recording and monitoring work place injuries and near misses to identify risk areas and implementing
mitigating actions
• identification of workplace hazards and implementation of appropriate safety procedures
The DHB is not exposed to any significant concentrations of insurance risk as work related injuries are general y the
result of an isolated event to an individual employee.
An external independent actuarial valuer, Mr M Lardies, Bsc.FIA of Aon New Zealand Ltd, has calculated the DHB’s
liability. The valuer has attested he is satisfied as to the nature, sufficiency and accuracy of the data used to
determine the outstanding claims liability. There are no qualifications contained in the actuarial valuer’s report.
Average inflation has been assumed as 2.10% for the year ending 30 June 2015. A discount rate of 3% has been used
for the year ended 30 June 2015.
The value of the liability is not material for the DHB’s financial statements; therefore any changes in assumptions wil
not have a material impact on the financial statements.
Capital & Coast DHB Annual Report 2014/2015 - Page 85
link to page 59 link to page 59
NOTES TO THE FINANCIAL STATEMENTS
in thousands of New Zealand Dol ars
16
TRADE AND OTHER PAYABLES
2015
2014
Actual
Actual
Payables under exchange transactions
Trade payables
6,778
19,553
Income in advance / Deferred Revenue
358
687
Capital charge due to the Crown
-
4,197
Other non-trade payables and accrued expenses
44,431
45,135
Total payables under exchange transactions
51,567
69,572
Payables under non-exchange transactions
Income in advance
2,416
212
GST and other taxes payables
14,170
11,796
Total payables under non-exchange transactions
16,586
12,008
Total Payables
68,153
81,580
Trade and other payables are non-interest bearing and are normal y settled on 30-day terms, therefore the
carrying value of trade and other payables approximates their fair value.
17
PATIENT AND RESTRICTED FUNDS
2015
2014
Patient funds
Actual
Actual
Balance at 1 July 2014
155
148
Monies received
178
172
Interest received
2
2
Payments made
(196)
(167)
Balance at 30 June 2015
139
155
Patient funds are held in a separate bank account. Any interest earned is al ocated to the individual patient
balances. Patient fund transactions during the year ended 30 June 2015 are not recognised in the statement of
comprehensive revenue and expense, but are recorded in the statement of financial position as at 30 June
2015, both as an asset and a liability.
2015
2014
Holiday homes funds
Actual
Actual
Balance at 1 July 2014
75
72
Monies received
21
18
Interest received
2
2
Payments made
(26)
(17)
Balance at 30 June 2015
72
75
Hutt Valley DHB Portion ¼ of holiday homes total
18
19
Total patient and restricted funds
157
174
Capital & Coast DHB Annual Report 2014/2015 - Page 86
NOTES TO THE FINANCIAL STATEMENTS
in thousands of New Zealand Dol ars
18
EQUITY
2015
2014
Actual
Actual
Contributed capital
Balance at 1 July
420,687
418,171
Capital contribution
5,600
6,000
Repayment of capital
(3,484)
(3,484)
Balance at 30 June
422,803
420,687
Property revaluation reserves
Balance at 1 July
23,606
23,606
Balance at 30 June
23,606
23,606
Accumulated surplus / (deficit)
Balance at 1 July
(329,128)
(323,229)
Surplus / (deficit) for the year
(3,982)
(5,899)
Balance at 30 June
(333,110)
(329,128)
Total equity
113,299
115,165
Capital & Coast DHB Annual Report 2014/2015 - Page 87
NOTES TO THE FINANCIAL STATEMENTS
in thousands of New Zealand Dol ars
19
OPERATING LEASES
Leases as lessee
Non-cancel able operating lease rentals are payable as fol ows:
2015
2014
Actual
Actual
Less than one year
2,340
2,819
Between one and five years
3,499
3,730
More than five years
785
-
6,624
6,549
During the year ended 30 June 2015, $2.7m was recognised as an expense in the statement of
comprehensive revenue and expense in respect of operating leases (2014: $2.6m)
The DHB:
• leases a number of buildings, vehicles and items of medical equipment under operating leases.
•
leases are on normal commercial terms and include restrictions on sub-leasing. For leased
buildings some leases have ratchet clauses, and most have rights of renewal.
• leases include no contingent rentals.
• operating lease payments are recognised as an expense on a straight line basis over the term of
the lease.
• leased properties are not subleased by the DHB.
Leases as lessor
The DHB leases out various surplus properties under operating leases. The future minimum lease
payments under non-cancel able leases are as fol ows:
2015
2014
Actual
Actual
Less than one year
259
184
Between one and five years
825
626
More than five years
1,044
1,427
2,128
2,237
During the year ended 30 June 2015, $2.3m was recognised as rental income in the statement of
comprehensive revenue and expense (2014: $2.2m)
The DHB has:
• a long term agreement with the University of Otago for the provision of medical consultancy services
and facilities from which they operate these services.
• long term ground leases in operation where the lessee owns al the improvements.
• medium term leases (consulting rooms) in two separate health centres.
• 28 short term commercial leases, al subject to 6 month termination notice.
Capital & Coast DHB Annual Report 2014/2015 - Page 88
NOTES TO THE FINANCIAL STATEMENTS
in thousands of New Zealand Dol ars
20
FINANCIAL INSTRUMENTS
Exposure to credit, interest rate and currency risks arise in the normal course of the DHB's operations.
Derivative financial instruments are used to hedge exposure to fluctuations in foreign exchange rates and
interest rates.
Credit risk
Financial instruments, which potential y subject the DHB to concentrations of risk, consist principal y of
cash, short-term deposits and accounts receivable.
The DHB places its cash and short term deposits with high quality financial institutions and the DHB has a
policy that limits the amount of credit exposure to any one financial institution.
Concentrations of credit risk from accounts receivable are limited due to the large number and variety of
customers. The Ministry of Health is the largest single debtor, approximately 48.05% in 2015 (2014:
55.94%). It is assessed to be a low risk and high quality entity due to its nature as the government funded
purchaser of health and disability support services.
At the balance sheet date there were no significant other concentrations of credit risk.
Interest rate risk
Cash flow interest rate risk is the risk that cash flows from a financial instrument wil fluctuate because of
changes in market interest rates. Investments and borrowings issued at variable rates expose the DHB to
cash flow interest rate risk.
The DHB adopts a policy of having a spread of interest rate repricing dates on borrowings to limit the
exposure to short term interest rate movements. The DHB wil from time to time utilise hedge instruments
when term borrowings are to be renewed. The DHB borrowings are al fixed term and fixed interest rate,
except for the overdraft facility for working capital, which is on a floating rate basis and subject to an
interest rate swap.
The only financial instrument that DHB measures at fair value in the statement of financial position is the
interest rate swap. The fair value of the interest rate swap is determined using a valuation technique that
uses observable market inputs (level 2).
The net fair value of the interest rate swap at 30 June 2015 was nil (2014: $nil)
Sensitivity analysis
If the Official Cash Rate had been 100 basis points higher, the working capital facility interest rate and the
interest on surplus funds would be higher. The net impact on the DHB would have been favourable
$0.50m in 2015. (2014: $0.03m).
In managing interest rate and currency risks the DHB aims to reduce the impact of short-term fluctuations
on the DHB’s earnings. Over the longer-term, however, permanent changes in foreign exchange and
interest rates would have an impact on consolidated earnings.
At 30 June 2015, it is estimated that a general increase of one percentage point in interest rates would
decrease the DHB’s surplus by approximately $3.4m (2014: $3.4m). It is estimated that a general increase
of one percentage point in the value of NZD against other foreign currencies to which the DHB had direct
exposure would have decreased the DHB’s surplus before tax by approximately $0.00086m for the year
ended 30 June 2015 (2014: $0.00025m).
Capital & Coast DHB Annual Report 2014/2015 - Page 89
NOTES TO THE FINANCIAL STATEMENTS
in thousands of New Zealand Dol ars
20
FINANCIAL INSTRUMENTS (CONTINUED)
Effective interest rates and repricing analysis
In respect of interest-bearing financial liabilities, the fol owing table indicates their effective interest rates at balance sheet date and the periods in which they reprice.
2015 Actual
2014 Actual
Effective
More Effective
More
interest
6 mths
6-12
than 5 interest
6 mths
than 5
rate
Total
or less
mths
1-2 yrs
2-5 yrs
yrs rate
Total
or less 6-12 mths
1-2 yrs
2-5 yrs
yrs
%
%
C
Loans:
ap
NZD fixed rate loan*
5.16
28,000
28,000
5.16
28,000
28,000
ita
l & C
NZD fixed rate loan*
3.43
6,000
6,000
3.43
6,000
6,000
NZD fixed rate loan*
3.65
9,000
9,000
3.65
9,000
9,000
oa
NZD fixed rate loan*
4.04
34,000
34,000
4.04
34,000
34,000
st DH
NZD fixed rate loan*
4.15
6,000
6,000
4.15
6,000
6,000
B
NZD fixed rate loan*
3.72
25,000
25,000
3.72
25,000
25,000
A
n
NZD fixed rate loan*
3.61
8,000
8,000
3.61
8,000
8,000
nu
NZD fixed rate loan*
3.51
34,000
34,000
3.51
34,000
34,000
al R
NZD fixed rate loan*
3.38
28,000
28,000
3.38
28,000
28,000
ep
NZD fixed rate loan*
6.37
62,000
62,000
6.37
62,000
62,000
ort
NZD fixed rate loan*
6.30
-
6.30
20,000
20,000
2014/
NZD fixed rate loan*
7.13
-
7.13
12,000
12,000
NZD fixed rate loan*
6.57
-
6.57
11,000
11,000
2015
NZD fixed rate loan*
6.95
-
6.95
19,400
19,400
-
NZD fixed rate loan*
6.39
-
6.39
8,600
8,600
Page
NZD fixed rate loan*
3.57
28,000
28,000
3.57
28,000
28,000
90
NZD fixed rate loan*
3.34
36,000
36,000
-
-
NZD fixed rate loan*
3.37
35,000
35,000
-
-
NZD unsecured loan
0
1,280
163
163
326
628
0
1347
240
285
777
45
Finance leases*
6.5
-
6.50
8
8
340,280
6,163
28,163
34,326 201,628
70,000
340,355
8
71,240
34,285 130,777 104,045
* These liabilities bear interest at fixed rates.
NOTES TO THE FINANCIAL STATEMENTS
in thousands of New Zealand Dol ars
20
FINANCIAL INSTRUMENTS (CONTINUED)
Contractual maturity analysis of financial liabilities
The table below analyses the DHB’s financial liabilities into relevant maturity groupings based on the remaining period at the
balance date to the contractual maturity date. The amounts disclosed are the contractual undiscounted cash flows and include al
interest payments.
Carrying
Contractual
Less than
More than
2015
amount
cash flows
1 year
1-2 years
2-5 years
5 years
Creditors and other payables
68,153
68,153
68,153
-
-
-
Secured loans
339,000
387,257
47,865
46,242
219,897
73,253
Unsecured loans
1,280
1,280
326
326
628
-
Finance leases
-
-
-
-
-
-
Patient and restricted funds
157
157
157
-
-
-
Total
408,590
456,847
116,501
46,568
220,525
73,253
2014
Creditors and other payables
81,580
81,580
81,580
-
-
-
Secured loans
339,000
392,803
86,644
45,507
150,063
110,589
Unsecured loans
1,347
1,347
240
285
777
45
Finance leases
8
9
9
-
-
-
Patient and restricted funds
174
174
174
-
-
-
Total
422,109
475,913
168,647
45,792
150,840
110,634
Contractual maturity analysis of financial assets
The table below analyses the DHB’s financial assets into relevant maturity groupings based on the remaining period at the balance
date to the contractual maturity date.
Carrying
Contractual
Less than 1
More than
amount
cash flows
year
1-2 years
2-5 years
5 years
2015
Cash and cash equivalents
19,101
19,101
19,101
-
-
-
Debtors and other receivables
45,858
45,858
45,858
-
-
-
Trust and special funds - bank
546
546
546
-
-
-
Trust and special funds – term
deposit
6,900
7,000
7,000
-
-
-
Trust and special funds – debtors
60
60
60
-
-
-
Total
72,465
72,565
72,565
-
-
-
2014
Cash and cash equivalents
12,097
12,097
12,097
-
-
-
Debtors and other receivables
44,145
44,145
44,145
-
-
-
Trust and special funds - bank
714
714
714
-
-
-
Trust and special funds – term
deposit
5,800
5,920
5,920
-
-
-
Trust and special funds – debtors
464
464
464
-
-
-
Total
63,220
63,340
63,340
-
-
-
Capital & Coast DHB Annual Report 2014/2015 - Page 91
NOTES TO THE FINANCIAL STATEMENTS
in thousands of New Zealand Dol ars
20 FINANCIAL INSTRUMENTS (CONTINUED)
Maximum exposure to credit risk
The DHB’s maximum credit exposure for each class of financial instrument is as fol ows:
2015
2014
Actual
Actual
Cash and cash equivalents
19,101
12,097
Debtors and other receivables
45,858
44,145
Trust and special funds – bank
546
714
Trust and special funds – term deposit
6,900
5,800
Trust and special funds – debtors
60
464
72,465
63,220
2015
2014
Counterparties with credit ratings
Cash at bank and term deposits
26,547
18,611
AA- (Standard & Poor)
26,547
18,611
Debtors and other receivables mainly arise from the DHB’s statutory functions, therefore there are no procedures
in place to monitor or report the credit quality of debtors and other receivables to internal or external credit
ratings.
Foreign currency risk
The DHB is exposed to foreign currency risk on purchases that are denominated in a currency other than NZD. The
currencies giving rise to this risk are primarily US Dol ars and AUD Dol ars.
The DHB hedges large transactions denominated in a foreign currency. The DHB uses forward exchange contracts to
hedge its foreign currency risk. The DHB has no forward exchange contracts as at the balance sheet date.
Forecasted transactions
The DHB classifies its forward exchange contracts hedging forecasted transactions as cash flow hedges and states
them at fair value. The net fair value of forward exchange contracts used as hedges of forecasted transactions at 30
June 2015 was $nil (2014: $nil), comprising assets of $nil (2014: $nil) and liabilities of $nil (2014: $nil) that were
recognised in fair value derivatives.
Recognised assets and liabilities
Changes in the fair value of forward exchange contracts that economical y hedge monetary assets and liabilities in
foreign currencies and for which no hedge accounting is applied are recognised in the statement of comprehensive
revenue and expense. Both the changes in fair value of the forward contracts and the foreign exchange gains and
losses relating to the monetary items are recognised as part of “Net loss on derivative classified as fair value
through statement of comprehensive revenue and expense. The fair value of forward exchange contracts used as
economic hedges of monetary assets and liabilities in foreign currencies at 30 June 2015 was $nil (2014: $nil)
recognised in fair value derivatives.
Capital & Coast DHB Annual Report 2014/2015 - Page 92
NOTES TO THE FINANCIAL STATEMENTS
in thousands of New Zealand Dol ars
20
FINANCIAL INSTRUMENTS (CONTINUED)
Fair values
The fair values together with the carrying amounts shown in the statement of financial position are as fol ows:
Carrying
Carrying
amount
Fair value
amount
Fair value
2015
2015
2014
2014
Note
Actual
Actual
Actual
Actual
Trade and other receivables
10
45,858
45,858
44,145
44,145
Cash and cash equivalents
11
19,101
19,101
12,097
12,097
Secured loans
13
(339,000)
(350,414)
(339,000)
(342,998)
Unsecured loans
13
(1,280)
(1,280)
(1,347)
(1,347)
Finance leases
13
-
-
(8)
(9)
Trade and other payables
16
(68,153)
(68,153)
(81,580)
(81,580)
(343,474)
(354,888)
(365,693)
(369,692)
Unrecognised (losses)/gains
(11,414)
(3,999)
Estimation of fair value analysis
The fol owing summarises the major methods and assumptions used in estimating the fair values of financial
instruments reflected in the table.
Derivatives
Forward exchange contracts are either marked to market using listed market prices or by discounting the
contractual forward price and deducting the current spot rate.
Where discounted cash flow techniques are used, estimated future cash flows are based on management’s best
estimates and the discount rate is a market related rate for a similar instrument at the balance sheet date. Where
other pricing models are used, inputs are based on market related data at the balance sheet date.
Interest bearing loans and borrowings
Fair value is calculated based on discounted expected future principal and interest cash flows.
Finance lease liabilities
The fair value is estimated as the present value of future cash flows, discounted at market interest rates for
homogeneous lease agreements. The estimated fair values reflect change in interest rates.
Trade and other receivables and payables
For receivables and payables with a remaining life of less than one year, the notional amount is deemed to reflect
the fair value. Al other receivables and payables are discounted to determine the fair value.
Interest rates used for determining fair value
The entity uses the government bond rate as at 30 June 2015 plus an adequate constant credit spread to discount
financial instruments. The interest rates used are as fol ows:
2015 Actual %
2014 Actual %
Derivatives
N/A
N/A
3.34, 3.37, 3.38, 3.43,
3.38, 3.43, 3.51, 3.57,
3.51, 3.57, 3.61, 3.65,
3.61, 3.65, 3.715, 4.04,
3.715, 4.04, 4.15, 5.16,
4.15, 5.16, 6.295, 6.37,
Loans and borrowings
6.37
6.39, 6.57, 6.95, 7.13
Capital & Coast DHB Annual Report 2014/2015 - Page 93
NOTES TO THE FINANCIAL STATEMENTS
in thousands of New Zealand Dol ars
21
RELATED PARTIES TRANSACTIONS
CCDHB is a whol y owned entity of the Crown.
Related party disclosures have not been made for transactions with related parties that are within a normal
supplier relationship on terms and condition no more or less favourable than those that it is reasonable to expect
the DHB would have adopted in dealing with the party at arm’s length in the same circumstances. Further,
transactions with other government agencies (for example, Government departments and Crown entities) are not
disclosed as related party transitions when they are consistent with the normal operating arrangements between
government agencies and undertaken on the normal terms and conditions for such transactions.
Remuneration
Key management personnel remuneration is as fol ows:
2015
2014
Actual
Actual
Board Members
Remuneration
$370
$362
Number of members
12
17
Leadership Team
Remuneration
$3,100
$3,057
Ful -time equivalent members
17
14
Total key management personnel remuneration
$3,470
$3,419
Total members and full time equivalent personnel
29
31
Capital & Coast DHB Annual Report 2014/2015 - Page 94
NOTES TO THE FINANCIAL STATEMENTS
in thousands of New Zealand Dol ars
21
RELATED PARTIES TRANSACTIONS (CONTINUED)
The Board has taken insurance cover for Board members, Board Committee members, and employees for
personal loss caused by wrongful acts in the course of their duties where indemnity is not available from the
organisation. The Board has also taken insurance cover covering personal accident and travel risk for Board
members, Board Committee members and employees where injury or loss occurs whilst on DHB business.
Board members
Board Fees
Committee Fees
Current board members as at 30 June 2015
2015
2014
2015
2014
Dr Virginia Hope, MNZM, Chair
Elected
53
53
3
5
Mr Derek Milne, Deputy Chair
Appointed
32
19
3
1
Dr Judith Aitken
Elected
26
26
3
2
Mr David Choat
Elected
26
26
1
2
Mr Peter Douglas
Appointed
26
26
1
2
Ms Helene Ritchie
Elected
26
26
1
2
Mr Darrin Sykes
Appointed
26
26
2
3
Ms Sue Kedgley
Elected
26
15
1
1
Mr Chris Laidlaw
Elected
26
15
2
1
Mr Nick Leggett
Elected
26
15
-
1
Mr Roger Jarrold
Appointed
26
15
2
1
Board members who left during the year
Mr Peter Glensor
Appointed
-
13
-
3
Ms Barbara Donaldson
Elected
-
11
-
1
Ms Margaret Faulkner
Elected
-
13
-
4
Mr Keith Hindle
Appointed
-
11
-
4
Mr Robert Francis
Appointed
-
11
-
1
Crown monitor
Dr Margaret Wilsher
Appointed
32
-
-
-
Ms Debbie Chin
Appointed
-
7
-
-
351
328
19
34
Committee members (other than Board members and employees)
2015
2014
Hospital Advisory Committee
Lynn McBain
-
1
Karen Coutts
-
1
-
2
Capital & Coast DHB Annual Report 2014/2015 - Page 95
NOTES TO THE FINANCIAL STATEMENTS
in thousands of New Zealand Dol ars
22
EMPLOYEE REMUNERATION
The number of employees or former employees who received remuneration and other benefits of $100,000 or more
per annum within specified $10,000 bands were as fol ows:
Number of
Number of
Employees 2015 Employees 2014
100 – 110
141
129
110 – 120
76
63
120 – 130
70
57
130 – 140
45
62
140 – 150
43
42
150 – 160
23
18
160 – 170
23
20
170 – 180
15
16
180 – 190
26
20
190 – 200
22
14
200 – 210
11
9
210 – 220
13
19
220 – 230
20
11
230 – 240
19
20
240 – 250
17
17
250 – 260
5
8
260 – 270
13
11
270 – 280
12
13
280 – 290
7
12
290 – 300
9
10
300 – 310
8
2
310 – 320
4
7
320 – 330
4
5
330 – 340
6
4
340 – 350
7
10
350 – 360
9
3
360 – 370
4
4
370 – 380
4
4
380 – 390
2
1
390 – 400
3
4
400 – 410
1
1
410 – 420
3
1
420 – 430
2
3
430 – 440
-
2
440 – 450
1
1
460 – 470
-
1
480 – 490
-
1
490 – 500
1
-
510 – 520
1
-
520 – 530
-
1
530 – 540
1
1
540 – 550
1
-
550– 560
1
-
580 – 590
1
-
674
627
Capital & Coast DHB Annual Report 2014/2015 - Page 96
NOTES TO THE FINANCIAL STATEMENTS
in thousands of New Zealand Dol ars
22
EMPLOYEE REMUNERATION (CONTINUED)
Of the 674 employees shown above, 459 are or were medical or dental employees and 215 are or were neither
medical nor dental employees. This represents an increase of 47 staff in total over the previous year.
If the remuneration of part-time employees were grossed-up to an FTE basis, the total number of employees with
FTE salaries of $100,000 or more would be 1,509 compared with the actual total number of 674.
23
TERMINATION PAYMENTS
During the year ended 30 June 2015, 7 (2014: 11) employees received compensation and other benefits in relation
to cessation total ing $0.2m (2014: $0.3m).
No Board members (2015: nil) received compensation or other benefits in relation to cessation (2014: nil).
24
EXPLANATIONS TO FINANCIAL VARIANCES FROM BUDGET
Section 154(3)(c) of the Crown Entities Act requires the Annual Financial Statements to include the forecast
financial statements (Budget numbers) prepared at the start of the financial year for comparison with the actual
financial statements. The Budget numbers are obtained from the Statement of Performance Expectation Budget
approved by the DHB Board and tabled in Parliament. The ‘Original 2015 Budget’ column relates to the initial
break-even Budget agreed with the Ministry of Health and tabled in Parliament.
However subsequent to the original submission, due to on-going negotiations with the Ministry of Health, the
Budget numbers were later revised to reflect an agreed $4m deficit for financial year 2014/15. The ‘Revised 2015
Budget’ column reflects the latest Budget numbers and have been disclosed for additional information.
Explanation of significant variances from the ‘Revised 2015 Budget’ in the Statement of Intent when compared to
actual figures for the year ended 30 June 2015 are provided below.
Statement of comprehensive revenue and expense
The DHB recorded a deficit of $3.9m compared with the budgeted deficit of $4m.
Revenue for 14/15 was greater than budget due to increased MOH and IDF revenue due to higher levels of
activities.
Expenditure was higher than budget for the reasons noted below:
• Personnel and clinical supply costs were above budget due to higher levels of activity as a result of
increased acute demand.
• Increased outsourced cost due to higher outsourced services to meet health targets.
• Increased infrastructure costs mainly related to increased facility maintenance and affiliation fees for
regional initiatives.
Statement of changes in Equity
• The variance in equity balance is mainly due to the phasing of the Nga Taihoi project over financial years
2014/15 and 2015/16.
Statement of financial position
Major variances were:
• The Cash balance is significantly favourable to budget due to regular review of the supplier payment
terms and better cash management.
• Trade and other payables were higher mainly due to the timing of supplier payments.
Statement of cash flows
Major variances were:
• Cash flow from operating activities is in line with the budget.
• Cash flow from investing activities is less than budget due to various National and Regional Information
Technology initiatives resulting in less spend.
• Cash flow from financing activities is in line with the budget.
Capital & Coast DHB Annual Report 2014/2015 - Page 97
NOTES TO THE FINANCIAL STATEMENTS
in thousands of New Zealand Dol ars
25
CAPITAL MANAGEMENT
The DHB’s capital is its equity, which is comprised of equity contribution, accumulated funds and other reserves.
Equity is represented by net assets.
The DHB is subject to the financial management and accountability provisions of the Crown Entities Act 2004,
which impose restrictions in relation to borrowings, acquisition of securities, issuing guarantees and indemnities
and the use of derivatives.
The DHB manages its equity as a by-product of prudently managing revenues, expenses, assets, liabilities,
investments, and general financial dealings to ensure that it effectively achieves its objectives and purpose, whilst
remaining a going concern.
Capital & Coast DHB Annual Report 2014/2015 - Page 98
NOTES TO THE FINANCIAL STATEMENTS
in thousands of New Zealand Dol ars
26
SUMMARY REVENUE AND EXPENSES BY OUTPUT CLASS
Early detection and
Intensive assessment and
Prevention services
management
treatment
Rehabilitation and support
Total DHB
2015 Actual
2014 Actual
2015 Actual
2014 Actual
2015 Actual
2014 Actual
2015 Actual
2014 Actual
2015 Actual
2014 Actual
Revenue
Crown
7,399
8,991
184,070
177,733
677,940
667,065
97,428
95,940
966,837
949,729
Other
-
-
-
-
29,379
25,928
11
-
29,390
25,928
Capita
Total revenue
7,399
8,991
184,070
177,733
707,319
692,993
97,439
95,940
996,227
975,657
l & C
Expenditure
oa
Personnel
144
-
3,089
-
408,269
403,810
1,858
5,285
413,360
409,095
st DH
Depreciation
-
-
-
1
37,775
34,509
-
-
37,775
34,510
B A
Capital charge
-
-
-
-
8,382
8,578
-
-
8,382
8,578
n
nu
Provider payments
7,254
8,454
163,580
159,002
66,456
65,877
88,648
87,834
325,938
321,167
al R
e
Other
1
550
17,401
18,738
190,431
186,055
6,921
2,863
214,754
208,206
po
rt
Total expenditure
7,399
9,004
184,070
177,741
711,313
698,829
97,427
95,982
1,000,209
981,556
2014/
Net surplus/(deficit)
0
(13)
0
(8)
(3,994)
(5,836)
12
(42)
(3,982)
(5,899)
2015
Actual revenue and expenditure has been mapped to output classes in accordance with guidance on classifications from the Ministry of Health. Al expenditure paid from the Funder
- P
Arm is matched to a purchase unit code, and then mapped to the relevant output class. This is done at a detailed transactional level and accounts for the majority of the DHB’s
age
revenue and expenditure.
99
The DHB’s remaining activity is within the Provider Arm, and as a result has been assumed to come under the Intensive assessment and treatment output class.
NOTES TO THE FINANCIAL STATEMENTS
in thousands of New Zealand Dol ars
Reconciliation to retained earnings (Original)
Provider
Governance
Funder
Consolidated
Original
Original
Original
Original
2015
2015
2014
2015
2015
2014
2015
2015
2014
2015
2015
2014
Actual l
Budget
Actual
Actual l
Budget
Actual
Actual l
Budget
Actual
Actual l
Budget
Actual
Opening
(298,936)
(19,573)
(27,727)
(336,924)
balance
(311,181)
(289,737)
(17,160)
(17,221)
(787)
(16,271)
(329,128)
(323,229)
Surplus/(de
ficit) for the
Cap
year
(29,588)
(21,926)
(21,444)
1
-
61
25,605
21,926
15,484
(3,982)
-
(5,899)
ital
Closing
(320,862)
(19,573)
(5,801)
(336,924)
& C
balance
(340,769)
(311,181)
(17,159)
(17,160)
24,818
(787)
(333,110)
(329,128)
oas t DH
B A
Reconciliation to retained earnings (Updated)
nnu
Provider
Governance
Funder
Consolidated
a
l R
Updated
Updated
Updated
Updated
ep
2015
2015
2014
2015
2015
2014
2015
2015
2014
2015
2015
2014
ort
Actual l
Budget
Actual
Actual l
Budget
Actual
Actual l
Budget
Actual
Actual l
Budget
Actual
2014/
Opening
(298,936)
(19,573)
(27,727)
(336,924)
balance
(311,181)
(289,737)
(17,160)
(17,221)
(787)
(16,271)
(329,128)
(323,229)
2015
Surplus/(de
-
ficit) for the
Pa
year
(29,588)
(23,926)
(21,444)
1
-
61
25,605
19,926
15,484
(3,982)
(4,000)
(5,899)
ge
(322,862)
(19,573)
(7,801)
(340,924)
100
Closing
balance
(340,769)
(311,181)
(17,159)
(17,160)
24,818
(787)
(333,110)
(329,128)
Document Outline