
The Productivity Commission aims to
provide insightful, well-informed and
accessible advice that leads to the best
possible improvement in the wellbeing
of New Zealanders.
Improving state
sector productivity
Final report of the measuring and improving
state sector productivity inquiry, volume 1
August 2018
The New Zealand Productivity Commission
Te Kōmihana Whai Hua o Aotearoa1
The Commission – an independent Crown entity – completes in-depth inquiry reports on topics
selected by the Government, carries out productivity-related research and promotes
understanding of productivity issues. The Commission aims to provide insightful, well-informed
and accessible advice that leads to the best possible improvement in the wellbeing of
New Zealanders. The New Zealand Productivity Commission Act 2010 guides and binds the
Commission
.
Information on the Commission is available at
www.productivity.govt.nz
How to cite this document: New Zealand Productivity Commission. (2018).
Improving state
sector productivity. Final report of the measuring and improving state sector productivity inquiry,
vol. 1. Wellington: New Zealand Productivity Commission.
Disclaimer
The contents of this report must not be construed as legal advice. The Commission does
not accept any responsibility or liability for an action taken as a result of reading, or reliance
placed because of having read any part, or all, of the information in this report. The
Commission does not accept any responsibility or liability for any error, inadequacy,
deficiency, flaw in or omission from this report.
ISBN: 978-1-98-851919-7 (print)
ISBN: 978-1-98-851921-0 (online)
This copyright work is licensed under the Creative Commons Attribution 3.0 license. In essence
you are free to copy, distribute and adapt the work, as long as you attribute the source of the
work to the New Zealand Productivity Commission (the Commission) and abide by the other
license terms.
To view a copy of this license, visit
http://creativecommons.org/licenses/by/3.0/nz/. Please note
that this license does not apply to any logos, emblems, and/or trademarks that may be placed
on the Commission’s website or publications. Those specific items may not be reused without
express permission.
Inquiry contacts
Administration Robyn Sadlier
Website
www.productivity.govt.nz
T: (04) 903 5167
E: [New Zealand Productivity Commission request email]
Twitter
@NZprocom
Other matters
Judy Kavanagh
Linkedin NZ ProductivityCommission
Inquiry Director
T: (04) 903 5165
E: [email address]
1 The Commission that pursues abundance for New Zealand.
link to page 7 link to page 8 link to page 11 link to page 12 link to page 19 link to page 23 link to page 23 link to page 24 link to page 25 link to page 26 link to page 28 link to page 32 link to page 35 link to page 37 link to page 43 link to page 44 link to page 44 link to page 45 link to page 48 link to page 54 link to page 58 link to page 63 link to page 64 link to page 65 link to page 69 link to page 71 link to page 77
Contents
Foreword
i
About this inquiry
ii
1
Why state sector productivity matters
1
1.1
Higher state sector productivity is important .......................................................... 2
1.2
Innovation is key to productivity improvement ....................................................... 9
2
The New Zealand state sector – features and experience
13
2.1
Barriers to lifting state sector productivity ............................................................. 13
2.2
An absence of demand for productivity measures ................................................ 14
2.3
Some officials are hostile to the concept of productivity ..................................... 15
2.4
Closed and risk-averse agency cultures inhibit innovation ................................... 16
2.5
Narrow commissioning and poor policy practices limit opportunities ................ 18
2.6
Input controls, input-based or restrictive funding models stifle innovation ........ 22
2.7
Budget processes reward volumes and inputs, rather than productivity ............ 25
2.8
Patchy monitoring, evaluation and data use make governments myopic ........... 27
2.9
Conclusion ................................................................................................................ 33
3
System-level changes for a more productive state sector
34
3.1
Making sure everyone plays their part ................................................................... 34
3.2
Put productivity improvement on the ministerial agenda .................................... 35
3.3
Make better use of productivity measures ............................................................. 38
3.4
Raise the bar on new expenditure .......................................................................... 44
3.5
Focus effort and attention on improving agency processes and cultures ........... 48
3.6
Understand where the frontier is, and be a “fast follower” .................................. 53
3.7
Conclusion ................................................................................................................ 54
Findings and recommendations
55
Appendix A
Public consultation
59
References
61
Terms of reference
67
link to page 9 link to page 12 link to page 12 link to page 13 link to page 14 link to page 14 link to page 15 link to page 16 link to page 16 link to page 18 link to page 24 link to page 38 link to page 41 link to page 47 link to page 60 link to page 62 link to page 62
ii
Improving state sector productivity
Tables and figures
Figure 0.1 State sector productivity inquiry outputs ............................................................................... iii
Table 1.1
Production measure of GDP, 2016 .......................................................................................... 2
Table 1.2
Government (non-market) provision in selected service sectors, 2016 ................................ 2
Figure 1.1 Average annual growth rates in labour productivity, 1996–2014 .......................................... 3
Table 1.3
Annual changes in labour, capital and multifactor productivity by sector, 1996–2017 ........ 4
Table 1.4
Average annual rates of growth in labour productivity, 1996–2014 ...................................... 4
Figure 1.2 Real per-student school funding and average PISA scores, 2003–16 ................................... 5
Figure 1.3 Indices of core government expenditure, 1972–2016 ............................................................ 6
Figure 1.4 Crime rate, police numbers and prison muster, 1878–2018 .................................................. 6
Figure 1.5 National age structure projections, 2016–68 .......................................................................... 8
Figure 2.1 Barriers to lifting state sector productivity ............................................................................ 14
Figure 2.2 Stylised public management performance cycle ................................................................. 28
Figure 2.3 Health sector information “wiring diagram” ........................................................................ 31
Table 3.1
Roles ministers can play to support innovation .................................................................... 37
Figure 3.1 Continuum of funding models .............................................................................................. 50
Table 3.2
PIF elements and lead questions dealing with culture ........................................................ 52
Table 3.3
Examples of modified PIF questions around learning, innovation and change ................. 52
Acknowledgements
Commissioners Murray Sherwin, Professor Sally Davenport and Dr Graham Scott oversaw
the inquiry and the preparation of this report. We acknowledge and thank the work and
dedication of the inquiry team: Judy Kavanagh (inquiry director), Nicholas Green (lead
author of
Improving state sector productivity), Huon Fraser, Terry Genet, Mike Hayward,
Dave Heatley, Kevin Moar, Sandra Moore, Patrick Nolan and James Soligo. The team are
grateful for the help and support of Louise Winspear and Robyn Sadlier.

Foreword
i
Foreword
The Government has made raising New Zealand’s productivity a priority, and for good reason. It
is very difficult to improve individual and community wellbeing in a low-productivity environment.
Raising the productivity of the state sector is one of the most important contributions
government can make to national productivity.
This report is a summation of both specific research conducted for this inquiry and of findings
from the Commission’s earlier work. Many of the Commission’s earlier inquiries have explored or
touched on the productivity of public organisations and services. Over the course of these
inquiries, the Commission has encountered recurring themes and problems with the operation of
the state sector: poor monitoring, evaluation and use of data; risk-averse public agencies; overly
restrictive rules and funding systems; and few rewards for improvements.
However, these problems are resolvable, with the right focus and determination. If there was one
message to take from this report, it is that productivity improvements in core public services are
possible. New Zealand’s state sector management system is designed to make departments and
other agencies responsive to ministers’ priorities, and to generate the information needed to
measure productivity. The fact there has been little progress on measuring and improving
productivity in public services is largely due to a lack of prioritisation and demand for
improvement.
The recommendations in this report are aimed at creating and sustaining a demand for higher
productivity from the state sector. They include proposals to report on service productivity more
regularly and consistently, build capability for effective productivity measurement, provide
stronger financial encouragement for service improvements, and create checks to ensure state
sector agencies have the right processes and mindsets needed to change their services for the
better.
Measuring state sector productivity, the companion volume to this report, is the
Commission’s guide to measuring the productivity of public services for officials and other
interested parties.
A recurring theme in discussions about state sector productivity is the potential and
opportunities for innovation in service delivery created by new technology. This focus makes
sense, given the expansion of technology in market services, increasing public expectations of
“seamless” 24/7 access to services, and a strong correlation between ICT spending and
productivity. Accordingly, many of the recommendations outlined in this report – including
clearer and higher expectations from ministers, better use of data and linking of existing
datasets, higher quality commissioning and policy practice, and stronger rewards for
performance – are designed to promote innovation in the way services are delivered.
A heightened focus on improving the productivity of the state sector will take some effort.
However, there are opportunities and rewards for doing so, including the chance to better shape
what the state does and how well it does it. The outcome should be public services that better
meet the changing needs of New Zealanders, today and into the future.
Murray Sherwin, Chair, Productivity Commission
ii
Improving state sector productivity
About this inquiry
The terms of reference ask the Commission to undertake an inquiry into measuring and
improving productivity in public services, and to provide guidance and recommendations on:
how to measure productivity in “core” public services (health, education, justice and social
support) at sector and service level;
what role productivity measures should play in public sector performance frameworks; and
how to develop the culture, capability and systems needed within government agencies to
measure, understand and improve productivity.
Because of the broad scope of the terms of reference covering the health, education, justice and
social support sectors – and in the interests of providing more accessible material and better
tailoring the advice to different audiences – the Commission has produced two main documents:
advice and recommendations to ministers and state sector leaders aimed at
improving state
sector productivity (this document); and
guidance for officials on
measuring state sector productivity.
Together, these documents fulfil the requirements of the terms of reference.
With respect to building capability, the guidance document will be turned into an online
resource on the Commission’s website, and the Commission is building a network of people
across the state sector who can provide help and advice to officials when needed. The
Commission has conducted case studies – from creating simple labour productivity ratios using
routinely collected police call centre data, to constructing quality-adjusted productivity indices
for tertiary education – to illustrate the range of measurement issues analysts may encounter.
The Commission explored cultural attitudes to efficiency and performance improvement in the
state sector – canvassing the views of 20 current and former state sector leaders. Victoria
University of Wellington's survey of Public Service Association (PSA) members provided insights
into state sector organisations' ability to handle change, learn from mistakes and find new ways
of working.
This is important because innovation is key to productivity improvement, opening up the
possibility of providing more or better services using fewer resources. However, innovative ways
of working or the adoption of new technology can only happen in an environment open to
change.
To better understand how innovations take hold and spread in the provision of services, the
Commission looked at an innovation in the delivery of primary health care services and the
adoption and use of a new medical procedure in secondary care.
Together the research undertaken for this inquiry provides a richer picture, than has been
available to date, of the “productivity landscape” and the potential for improvement in public
link to page 9


About this inquiry
iii
services
. Figure 0.1 lists the full set of inquiry outputs. They are available on the Commission’s
website
: www.productivity.govt.nz/statesectorprod
Figure 0.1 State sector productivity inquiry outputs
Guidance and Recommendations
Guidance
Advice and
about how
recommendations
to measure
about how to
productivity
improve state
sector productivity
State sector productivity research
Fraser, H. & Nolan, P (2017).
Understanding health sector productivity.
Measurement
Gemmell, N., Nolan, P. & Scobie, G. (2017).
Public sector productivity: quality adjusting sector-
case studies
level data on New Zealand schools
Gemmell, N., Nolan, P. & Scobie, G. (2017).
Estimating quality-adjusted productivity in tertiary
education: methods and evidence for New Zealand
Genet, T. (2017).
Productivity measurement case study: courts
Genet, T & Hayward, M. (2017).
Productivity measurement case study: police
Green, N. (2017).
Productivity measurement case study: early childhood education
Moore, S. & Hayward, M. (2017)
Productivity measurement case study: Ministry of Social
Development
Pickens, D. (2017).
Efficiency and performance in the New Zealand State sector
Staff & leader
Plimmer, G., Cantal, C. & Qumseya, T. (2017).
Staff perceptions of performance and
perspectives
effectiveness in the New Zealand State Sector: further analysis of the 2016 Public Service
Association survey on workplace dynamics.
Fraser, H., Gemmell, N. & Nolan, P. (2018 ).
Measuring the diffusion of innovation among
Innovation
hospitals in New Zealand
research
Middleton, L., Dunn, P., O’Loughlin, C. & Cumming, J. (2018 ).
Taking stock: primary care
innovation.
Pacheco, G. & Dasgupta, K. (forthcoming).
Health care homes
Performance
Knopf, E. (2017). History of efficiency measurement by the New Zealand health sector post-2000
management
Soligo, J. (2018).
Promoting the utilisation of productivity measures
research
Promoting understanding of state sector productivity
Gemmell, N., Nolan, P. and Scobie. G. (2018 ). Quality Adjusting Education Sector Productivity,
Articles
Policy Quarterly, 14(3 )
Nolan, P. (2017). How to price public sector productivity,
Public Finance, April, p. 20 (associated
blog posted on Public Finance International)
Nolan, P. (2018). Measuring health sector productivity,
Policy Quarterly, 14(3 )
Measuring and improving state sector productivity, Judy Kavanagh, Presentation to Health
Presentations
Roundtable New Zealand Chapter, 23 November 2017, Auckland
Improving the Productivity of Government Services , Professor Patrick Dunleavy (London School
of Economics), Presentation to Productivity Hub Conference on Technical Change and
Productivity, 13 February 2018, Te Papa, Wellington
Growing the Productivity of Government Services, Judy Kavanagh, Presentation to Productivity
Hub Conference on Technical Change and Productivity, 13 February 2018, Te Papa, Wellington
Measuring State Sector Productivity, Patrick Nolan, Presentation at the 59th Annual Conference
of the New Zealand Association of Economists (NZAE), 27-29 June 2018, AUT, Auckland
The diffusion of innovation in the hospital sector, Patrick Nolan, Presentation at the 59th Annual
NZAE Conference
Measuring public sector productivity, Professor Norman Gemmell and Patrick Nolan, 24 March
2017, New Zealand Productivity Commission, Wellington
Chapter 1 | Why state sector productivity matters
1
1 Why state sector
productivity matters
At its most basic, state sector productivity is a measure of how well a government uses its
available resources to deliver services to its citizens. Whatever the level of resources committed
to public services, higher productivity allows government to provide more services or better
quality services to achieve the greatest possible value for the community. Higher state sector
productivity also contributes to gains in national productivity and, through that avenue, higher
incomes and an expanded tax base.
To a significant extent, gains in state sector productivity will come from innovation. This mirrors
what happens in the wider economy, where
growth comes largely from doing new things and shifting resources from less socially
valuable old things to more socially valuable new things. Dynamic efficiency – which
includes the reallocation of resources over time – counts for far more than simply getting
more output (be it in terms of quantity or quality) per unit of input…policy makers need to
pay particular attention to the factors that encourage or impede the development of new
ways of doing things and the reallocation of resources. (Cullen & Ergas, 2014, p.4)
The New Zealand state sector is not alone in its need to innovate to boost productivity. The
OECD has noted governments around the world are confronted with increasingly complex
challenges, and that
…[g]overnments cannot meet these challenges by doing less, but most governments can no
longer afford to do more of the same. More importantly, they are discovering that many
traditional prescriptions have not been sufficient or effective, and that new, more agile and
innovative solutions are needed. Failure to deliver risks a loss of trust and legitimacy. In
order to keep pace with their changing environment, governments need to take immediate
and bold action to catalyse the critical elements that support public sector innovation.
(OECD, 2014, p.1)
Over the course of its past inquiries, the Commission has encountered impediments that stymie
the efforts of New Zealand’s state sector to deliver more or better services. In preparing this
report, the Commission has drawn upon its previous work, as well as new research and case
studies for this inquiry, to better understand productivity in the state sector and make
recommendations to raise it. This report:
discusses how improving state sector productivity is critical for raising both national
productivity levels and improving the services the state provides for its citizens;
outlines the features of a state sector required for productivity improvement, and describes
what the Commission has observed about the state sector in New Zealand; and
provides advice about system changes that can overcome the barriers to and encourage
improvements in the productivity of the state sector.
link to page 12 link to page 12
2
Improving state sector productivity
1.1
Higher state sector productivity is important
The state makes up a significant share of the economy
The Government has made raising national productivity a policy priority (Robertson, 2018a;
Robertson, 2018b). Raising the productivity of the state sector is one of the most important
contributions a government can make to national prosperity and wellbeing. The state makes up
a significant share of the economy
(Table 1.1) and is a major employer, accounting for around
one in five full-time jobs. As a result, state sector productivity has a direct bearing on overall
economic performance.
Table 1.1 Production measure of GDP, 2016
$ million
Industry output (minus intermediate inputs)
233 137
Of which, public sector
36 831 (15.8%)
Of which, public administration & safety
10 300 (4.4%)
Of which, education & training
11 436 (4.9%)
Of which, health care & social assistance
15 095 (6.5%)
GST on production and import duties
21 566
GDP (production measure)
254 703
Source: Statistics New Zealand.
Like other developed countries, New Zealand is an increasingly service-based economy, with the
service sector making up more than two-thirds of gross domestic product. Through funding or
direct provision, government makes up the lion’s share of social services of importance to
individual and community wellbeing
(Table 1.2).
Table 1.2 Government (non-market) provision in selected service sectors, 2016
Service sector
Non-market provision
Public administration & safety
92.4%
Education & training
85.8%
Health care & social assistance
55.6%
Source: Statistics New Zealand GDP tables; Productivity Commission.
link to page 13 link to page 14
Chapter 1 | Why state sector productivity matters
3
The productivity of core public services is not regularly measured
The productivity of many core public services is not regularly measured by departments, and
barely features in public official accountability or performance documents (such as non-financial
performance information in departmental annual reports or the budget estimates). The
Commission encountered some examples where components of productivity are measured
within the departments and agencies which are the focus of this inquiry. For example, the
Ministry of Justice has developed measures of court efficiency and district health boards (DHBs)
have developed means of weighting the complexity of their activities. The Commission has
worked with the Ministry of Social Development and the New Zealand Police to develop
indicators or frameworks for future measurement (Moore & Hayward, 2017; Genet & Hayward,
2017). Beyond this, however, activity and interest from social sector agencies in measuring
service productivity is limited.
Available data suggests state sector productivity has often been poor
National and sector-level data suggest that productivity in the state sector has been persistently
low or has lagged growth in the wider economy. At a national level, Statistics New Zealand
productivity data shows that labour productivity growth in the state sector as a whole, and also in
the education and training sector (which is largely delivered through the state sector), has fallen
well short of the measured sector (the private sector) and total economy
(Figure 1.1).
Figure 1.1 Average annual growth rates in labour productivity, 1996–2014
1600
1400
ytivitcudo 1200
r
p ruobal ni 1000etar htworg 800egare
Av
600
400
1996
1998
2000
2002
2004
2006
2008
2010
2012
2014
Year
Measured sector
Public sector
Total economy
Source: Statistics New Zealand.
At an industry level, education and training and health and social assistance have lagged behind
the measured sector on every measure of productivity over a 20 year period, with education and
training experiencing negative productivity
(Table 1.3).
link to page 14
4
Improving state sector productivity
Table 1.3 Annual changes in labour, capital and multifactor productivity by
sector, 1996–2017
Labour productivity Capital productivity
MFP
Education & training
-1.4%
-2.7%
-1.7%
Health care & social assistance
0.8%
-0.8%
0.6%
Measured sector
1.5%
-0.1%
0.8%
Source: Statistics New Zealand.
There has been a reliance on more employees as a means of producing
more services
There are many reasons for these disappointing productivity results, discussed in more detail
later in this report. However, one significant contributor is the heavy reliance on increasing
labour inputs to produce more services
(Table 1.4).
Table 1.4 Average annual rates of growth in labour productivity, 1996–2014
Health & social
Education &
Central
Local
assistance
training
government
government
Output
4.0
1.1
2.8
2.6
Labour input
2.9
2.5
2.3
0.4
Labour productivity growth
1.1
-1.4
0.3
2.2
Share of public sector
38.0
32.0
27.0
3.0
Source: Statistics New Zealand; Productivity Commission.
But more resources don’t always guarantee better results
In a submission to this inquiry, Te Puni Kōkiri commented that: “each year, considerable amounts
of funding and investment are directed through the state sector [therefore] improvements in
productivity have the potential to deliver meaningful additional benefits for all New Zealanders,
including Māori” (sub. DR27, p.2).
However, in its
Better public services results for Māori report, Te Puni Kōkiri said:
The reality is that achievements are not being made for Māori to the same extent as for the
total population, as evidenced in this report. While progress towards targets for the total
population in the areas targeted is tracking positively and many might be achieved in the
timeframe, progress for Māori is further away from doing so. (2017, p.5)
In its submission, Te Puni Kōkiri noted the need for a greater focus on system improvements and
the connection of inputs to outcomes (sub. DR27, p.1).
There is a marked “disconnect” between inputs and outcomes in two areas of government
spending, discussed further below.
link to page 15 link to page 16 link to page 16
Chapter 1 | Why state sector productivity matters
5
In school education, real per-student funding increased by over 25% over 2003 to 2016, but
student achievement appears to have decline
d (Figure 1.2).
Figure 1.2 Real per-student school funding and average PISA scores, 2003–16
540
$6,000
530
$5,000
520
$4,000
ing
d
e 510
unf
scor
$3,000
SAI 500
udent
P
ts-
$2,000
er
p
490
al
Re
$1,000
480
470
$0
2003
2004
2005
2006
2007
2008
2009
2010
2011
2012
2013
2014
2015
2016
Average PISA score - science
Average PISA score - reading
Average PISA score - mathematics
Average real per student school funding
Source: Ministry of Education; Productivity Commission.
Note: Per-student funding numbers include property, operational and salaries funding for State and State-integrated schools.
Nominal funding rates deflated by June CPI results. PISA – the Programme for International Student Assessment – is a
worldwide study of 15 year olds’ academic performance on mathematics, science and reading. It is run by the OECD
and held every three years.
In the justice sector, expenditure on prisons and police has grown at a faster rate than other
sectors
(Figure 1.3), and it has continued to increase despite crime rates steadily declining from
the mid-1990s
(Figure 1.4).The Prime Minister’s former Chief Science Advisor reported that the
“total cost [of] prisons has doubled since 2005, and tripled since 1996. Since 1972, criminal justice
costs have grown twice as fast as any other category of government spending, and three times
faster than GDP” (2018, p.12). Sir Peter Gluckman went on to note that it is “well established that
incarceration rates are predominantly independent of crime rates”, and concluded it is
…important to consider whether these extremely high costs represent value for money for
New Zealand, in terms of helping victims recover, keeping communities safe, reducing
offending and reoffending, and getting people off the ‘prison pipeline’ (the apparently
almost inevitable path from initial offending to escalating contact and eventual
imprisonment, often with recidivism). Cost-benefit analyses, and research evidence, suggest
they do not. (pp.5, 12)
6
Improving state sector productivity
Figure 1.3 Indices of core government expenditure, 1972–2016
12000
10000
8000
6000
4000
2000
0
4
9
7
72
73
7
75
76
77
78
7
80
81
82
83
84
85
86
87
88
89
90
91
92
93
94
95
96
9
98
99
00
01
02
03
04
05
06
07
08
09
10
11
12
13
14
15
16
9
9
9
19
19
1
19
19
19
19
1
19
19
19
19
19
19
19
19
19
19
19
19
19
19
19
19
19
1
19
19
20
20
20
20
20
20
20
20
20
20
20
20
20
20
20
20
20
Social security and welfare, GSF
Health
Education
Core Government Services
Law and order
Defence
Transport and communications
Economic and Industrial Services
GDP
Note: The large increase in “economic and industrial services” expenditure from 2008 is due to the introduction of KiwiSaver
and associated subsidy costs.
Figure 1.4 Crime rate, police numbers and prison muster, 1878–2018
250
20,000
n 200
o
ulati
p
n
o
o
p
15,000
0
ulati
00
p
0 150
o
p
10
0
er
00
p
0
er t
10
us
10,000
er
m
p
n 100
e
o
atr
isr
e
p
imr
C
and
lice
5,000
o
P
50
-
0
1878
1882
1886
1890
1894
1898
1902
1906
1910
1914
1918
1922
1926
1930
1934
1938
1942
1946
1950
1954
1958
1962
1966
1970
1974
1978
1982
1986
1990
1994
1998
2002
2006
2010
2014
2018
Police force
Prison muster
Crime rate
Source: Prime Minister’s Chief Science Adviser, 2018; Ministry of Justice.
link to page 18
Chapter 1 | Why state sector productivity matters
7
These costs are projected to rise. The Department of Corrections’ most recent briefing to the
incoming minister noted that:
49% of released prisoners will be re-imprisoned within five years, generating costs to
Corrections of approximately $650 million over the next five years
the estimated welfare liability of people on community based sentences is estimated to be
$4 billion over the next 15 years. (2017, p.7)
There are concerns about the sustainability of current spending patterns
There is no doubt public services have made significant contributions to improved wellbeing. For
example, it is estimated that
health care contributed approximately one-third of the dramatic gain in health made by the
New Zealand population over the past quarter century (approximately two years out of a six
year gain in life expectancy). (Tobias & Yeh, 2009, p.77)
However, these gains have come at significant fiscal cost, with health spending growing at a
much faster rate than GDP in all OECD countries, which has “generated concern about health
system efficiency and motivated efforts to reform national health systems so as to raise
productivity” (Tobias & Yeh, 2009, p.70).
Successive statements from the Treasury on New Zealand’s long-term fiscal position have raised
questions about the country’s ability to afford the same or growing levels of public services into
the future. The most recent Treasury statement projected government revenue and expenditure
out to 2060, based on historical spending patterns and expected changes in New Zealand’s
demography (New Zealand Treasury, 2016). This model incorporates the fiscal pressures
expected from an aging population.
The share of the population aged 65 and over is projected to grow from around 15% in 2016 to
over 28% in 2068
(Figure 1.5).
People aged 65 and over consume more public services and resources than they contribute
through the tax system, reflecting their retirement from the labour market, New Zealand
Superannuation expenses, and higher health costs in the last two years of life (Aziz, Gemmell &
Laws, 2013).
The Treasury’s projections see healthcare costs grow from 6.2% of GDP in 2015 to 9.7% in 2060,
driven by rising demand and prices and demographic change. Superannuation expenses will
similarly increase from 4.8% of GDP in 2015 to 7.9% in 2060 (New Zealand Treasury, 2016).
8
Improving state sector productivity
Figure 1.5 National age structure projections, 2016–68
100%
90%
80%
70%
60%
50%
40%
30%
20%
10%
0%
2016
2018
2023
2028
2033
2038
2043
2048
2053
2058
2063
2068
0-14 years
15-64 years
65 years and over
Source: Statistics New Zealand.
Note: Graph shows the median (50th percentile) projection.
Technological disruption of labour markets is likely to create further pressures for governments
worldwide. Around 14% of jobs in OECD countries face a “high risk of automation”, with a
further 32% likely to experience “significant changes to how they are carried out” (OECD, 2018).
Rapid change in employment patterns in New Zealand may see an increased demand for
education services (for retraining) and more frequent interruption to individual earnings (and tax
contributions). The Government has signalled that New Zealand needs to be prepared for
technological disruption to employment, rapid labour displacement and the resulting
distributional impacts (Robertson, 2018c). Higher state sector productivity will be a key part of
any well-designed and coordinated government response to harness the changes presented by
disruptive technology, in order to maximise New Zealanders' wellbeing.
Lifting state sector productivity can provide better services and wider
benefits
The scale of the potential gains that can be made by improving state sector productivity was
modelled by the Treasury for its 2009 long-term fiscal statement:
A lift in public sector productivity would have a positive impact on the notional basket of
services that could be delivered to the average New Zealander for a given level of
spending. A 0.5 percentage point increase in our baseline assumption for annual public
sector productivity growth, if sustained, would result in around 20% more public services per
person after 40 years. (New Zealand Treasury, 2009, p.33)
Beyond helping to meet fiscal sustainability challenges, higher state sector productivity in core
public services, like health and education, supports greater economic growth. As Cullen and
Ergas (2014) note, health and education spending can be considered, at least in part, as
investment rather than consumption:
link to page 19
Chapter 1 | Why state sector productivity matters
9
Human capital in the form of education … contributes to economic growth by altering the
quality of labour inputs. Similarly, human capital in the form of health, which influences
worker energy, effort and reliability, also contributes to economic growth. Initial work
strongly suggested that health status was an important contributor to economic growth.
More recent attempts to quantify this contribution have produced some dramatic results. A
2004 study found that a one-year improvement in a population’s life expectancy contributes
to an increase of 4 per cent in output. In the Australian context, a recent study found that a 1
per cent decrease in cancer mortality rates would result in a 1.6 per cent increase in GDP
per capita. (p.15)
Improvements in health also influence “life cycle savings and capital accumulation, as individuals
respond to the prospect of more years of retirement by increasing savings”, thereby contributing
to output growth through both labour productivity and a larger capital stock (Cullen & Ergas,
2014, p.16).
F1.1
Raising the productivity of the state sector is one of the most important
contributions a government can make to national productivity and wellbeing.
Higher state sector productivity would generate benefits for individuals and
communities (in the form of better outcomes and more services), and the
government (in the form of less pressure on public finances).
1.2
Innovation is key to productivity improvement
While more resources do not always generate better results, can fewer resources produce better
results?
There are many examples of where doing things differently can both lower costs and improve
quality – leading to higher productivity and better outcomes
. Box 1.1 illustrates one example.
Box 1.1
Cost reduction comes at the expense of quality? Not for takahē
Innovations in conservation have led to higher productivity – lower per-unit cost and
improved quality outcomes for the takahē population.
Takahē once lived throughout the South Island. Yet, only four takahē were sighted in the
late 19th century and, by the early 20th century, they were considered extinct. Following
their rediscovery in Fiordland in 1948, experts believed the 250 surviving takahē were safest
left alone. Their haven in the Murchison Mountains was declared a “special area”, off limits
to all except a few scientists and deer cullers.
Takahē numbers continued to decline due to predation by stoats and competition with
deer for food, reaching a low point of 112 in 1981. Since then, a huge effort has gone into
studying and protecting takahē. Actions have included deer and predator control,
manipulating wild nests and eggs, artificially incubating eggs, and captive breeding.
Wild takahē lay two to three eggs but generally can only raise one chick. Much effort has
gone into turning “excess” eggs into chicks that can grow to become successful parents.
Early attempts at captive breeding produced chicks that thought they were bantams or
humans. Later, chicks were fed and brooded using glove puppets and models to minimise
10
Improving state sector productivity
contact with people. Puppet rearing chicks helped save takahē from extinction, but birds
re-introduced to the wild were often poor parents of their next generation.
Chicks can learn food collection and parenting skills from foster parents, and these birds
have been found to have better parenting success than puppet-reared chicks. While foster
parenting has always been a part of the takahē breeding programme, the innovation was in
scaling-up foster parenting and allocating excess eggs to takahē pairs with dependable
parenting records, including infertile pairs.
With less human intervention required, costs fell from around $15,600 per hand-reared
chick to $3,300 per foster-parented chick. The breeding centre is now producing around 35
chicks per annum, up from eight previously, within the same annual budget.
Higher numbers, together with improved chick quality, has allowed the rapid recovery of
the species. The official takahē population is now 347 birds, aged one year and older. The
species' 2016-17 growth rate of 13% was the highest on record. Importantly the number of
breeding pairs – over 100 – has doubled since 2008. Suitable habitat in the Murchison
Mountains is nearly full, so the Department of Conservation recently relocated 30 birds to
Kahurangi National Park in an attempt to establish a second wild population. The species’
long-term prospects are the best they have been for many decades.
Source: Department of Conservation, n.d.; Department of Conservation, 2018; Department of Conservation, 2017;
Grezelewski, 2018; Grezelewski, 2012; Wickes et al., 2009; Lindsay Wilson, Department of Conservation, pers.
comm., 12 July 2018; Glen Greaves, Department of Conservation, pers. comm., 12 July 2018.
Note: Per-chick costs exclude the infrastructure costs of both the new breeding programme and those required to
continue the old programme. Available information suggests that, discounted over the expected infrastructure
lifetime, these capital costs are small relative to operating costs on a per-chick basis.
An “innovation” can be a new idea, process or business model. It can lead to more effective
services and better outcomes to meet existing needs. Innovation can also be the application of
better solutions to meet new requirements or unarticulated or unmet needs.
In many cases, innovation will be made possible through the application of new (potentially
disruptive) technology. The Government has a vital role in how it chooses to promote the
innovative use of technology in the state sector.
Yet, the adoption of new technology or innovative ways of working can only happen in an
environment open to change. Therefore, much of this inquiry has focussed on the characteristics
and features of the state sector and the environment state sector agencies operate within
(Chapter 2). The recommendations in Chapter 3 emphasise making changes to the authorising
environment to promote innovation in public service delivery.
What are the characteristics that make an organisation more likely to generate and adopt
innovation? Most research in this area has been conducted on private sector firms and
organisations, much less so on the state sector. However, there are some generally applicable
themes that emerge from the literature.
link to page 21 link to page 21
Chapter 1 | Why state sector productivity matters
11
Organisations that are more likely to generate or adopt innovation:
are often structured around semi-autonomous departments or units (Tornatzky & Klein, 1982),
revolve around specific professional knowledge, and have decentralised decision-making
structures (Damanpour 1991, 1992, 1996);
tend to have leaders that champion new ideas and foster a culture of learning,
experimentation and continuous improvement (Kimberly & Evanisko, 1981; Nystrom,
Ramamurthy & Wilson, 2002; Meyer & Goes, 1988);
can systematically identify and interpret information, and absorb new knowledge (Ferlie et
al., 2001; Barnsley, Lemieux-Charles & McKinney, 1998);
tend to be open to new ideas and ways of operating: staff can challenge existing practices,
resources are allocated to understanding current performance, and staff are encouraged to
seek out better ways of operating (Schein, 2010);
are ready for change – for example, staff in the organisation may recognise the current way of
operating is unsustainable or flawed (Greenhalgh et al., 2008); and
are “boundary spanners” – because connections with other organisations provide the
opportunity to share learning and transfer technical know-how (Damanpour,1991;
Greenhalgh et al., 2008).
Many of these organisational characteristics are evident in the Takahē Recovery Programme
(Box
1.2).
Box 1.2
Q & A: Innovation in takahē breeding
Recalling the improvement in the productivity of rearing takahē (Box 1.1), the Commission
was interested to know how this innovation happened and whether the Takahē Recovery
Programme exhibited some of the characteristics listed above. Glen Greaves at the
Burwood Takahē Breeding Centre was generous in answering the Commission’s questions.
Q: Did the innovation emerge from a specific research programme or was it “a bright idea
from the front line”?
A: It was the latter. Really just taking the time, firstly to realise that the programme needed
a new approach, and secondly to observe what aspects were working and could be
expanded.
To get the growth needed to get out of the peak/trough population cycle, we could take
two very different pathways: we could expand on the artificial incubation and puppet
rearing methodology or, instead, recognise that takahē do a very good job on their own
and try getting pairs to foster a chick.
At the same time, we were completing the analysis of the success of puppet-reared
individuals following release into the wild. This question was on the takahē critical research
to-do list for quite some time, but required a sufficient sample size to be of any value. The
results aided the decision to scale up fostering.
12
Improving state sector productivity
Q: Was the organisation open to trying a new approach and championing it?
A: Once presented to the team and the local manager, there was very good support. Given
the context, where the Takahē Recovery Programme was under review and clearly in need
of a new approach, upper management was very supportive and provided the
infrastructure investment funding. This was a low-risk option, as the proposed regime had
already been done on a small scale. We could therefore estimate with some accuracy how
successful the new approach would be.
Q: Were there any institutional obstacles that needed to be overcome?
A: None that I can recall.
Q: Has the approach diffused to other species or other areas?
A: The only obvious example is the kākāpō recovery programme but, as the hand-reared
birds are appearing to do well and adult kākāpō seem to do a poor job at rearing their
young, hand-rearing is critical for increasing kākāpō chick survival.
We intend to publish the results once time allows, and modelling is updated with more
recent data. Particularly interesting is whether the puppet-reared effect is inter-
generational, and what affect the suppressed productivity has had on the Murchison
Mountains takahē population performance.
The
external environment also affects organisational innovation. For example, the state sector
operates under rules, procedures and regulations designed to promote accountable, fair and
transparent government. Ideally, these rules protect society’s democratic values while providing
room for socially beneficial innovation. However, if not well-designed and implemented, such
rules can create inflexible organisations that impede innovation. The
political environment is
another key factor influencing state sector innovation. The importance politicians (particularly
ministers) place on innovation can have a significant impact on the willingness of state sector
organisations to experiment and innovate.
F1.2
Innovation is key to improving state sector productivity. There are
organisational characteristics that make an agency more (or less) likely to
innovate or adopt new ways of working. Political and external environments
also make a difference to whether state sector agencies are encouraged to
innovate to improve productivity.
link to page 24
Chapter 2 | The New Zealand state sector – features and experience
13
2 The New Zealand state
sector – features and
experience
The state sector comprises many organisations, with varying missions, different customers, and
complex relationships. Raising the productivity of public services is ultimately the responsibility
of individual chief executives or, in the case of Crown entities, the boards of each organisation.
Ministers can, however, affect the performance of agencies through the environment and
expectations they set and the policy choices they make. At a high level, achieving productivity
gain in public services requires a combination of actions, traits, and freedoms, by both elected
representatives and public servants. These include:
a determination from ministers, and strong signals to agencies, that productivity
improvements are a priority;
openness to new and potentially disruptive processes and technologies, including those from
outside the state sector;
agency commitment to the careful design of services, which considers the full range of
delivery options, the outcomes the agency wants to achieve, the preferences and needs of
clients, and evaluation requirements;
rewards to agencies that achieve gains in productivity;
an authorising environment that both sets high expectations and supports experimentation;
and
freedom for agencies, providers and other decision-makers to substitute, replace, or move
inputs and resources, and decision rights set at the level where there is the best information
to make decisions.
The state sector’s current and recent operating environment lacks many of these characteristics.
This chapter discusses barriers to improving state sector productivity, drawing on work
conducted for this inquiry and the Commission’s observations from earlier inquiries. The chapter
also points to some promising advancements in the development and delivery of public services,
which could be leveraged in future.
2.1
Barriers to lifting state sector productivity
Seven features of the state sector’s performance and operating environment act as constraints
on productivity growth
(Figure 2.1).


14
Improving state sector productivity
Figure 2.1 Barriers to lifting state sector productivity
Absence of demand fro m leaders
Input co ntro ls, input-
and Ministers fo r productivity
based and restrictive
measures
Ho stility to the co ncept
funding models
o f pro ductivity and
measurement
P atchy evaluatio n,
mo nito ring and use
Clo sed and risk averse
o f data
agency culture
Budget processes
State secto r pro ductivity
Narro w
that reward vo lumes
co mmissioning and
and inputs
po o r policy practices
2.2
An absence of demand for productivity measures
At first blush, the New Zealand state sector is well placed to measure its productivity. Its financial
management system is based around the clear
ex ante specification of outputs purchased by the
Government, and performance standards for those outputs. Outputs must be costed (including,
where relevant, depreciation and capital charge expenses) and expected performance specified
in terms such as quantity, quality, cost, time and place of delivery. Departmental chief executives
also have a statutory responsibility for ensuring “the efficient and economical delivery of the
goods and services provided by the department…and how effectively those goods or services
contribute to the intended outcomes” (section 32(1)(h), State Sector Act 1988). The intent of this
model is to promote clarity of objectives for the Government and its agents, incentives for
performance, and accountability to Parliament and the public.
However, many departmental leaders do not seek the information needed to support efficiency
gains. A summary of the first round of Performance Improvement Framework (PIF) reviews of
state sector agencies by the State Services Commission (SSC) noted there is “a lack of demand
from senior managers for the sort of information and analysis they need to improve efficiency
and, unsurprisingly, this is associated with a weak supply response” (SSC, 2013, p.34). This was
due in part to “a lack of value placed by senior executives on strategic financial analysis that
informs options and decision-making.” (ibid).
The lack of demand for productivity-related performance information by agency leaders may
also reflect the low importance placed on this information by ministers. During engagements
with departments responsible for the core public services at the heart of this inquiry, a senior
official told the Commission that productivity measures “were not a priority” for his Minister and
hence would not be high on his agenda. This low prioritisation may be due to the fact that
performance information can be a double-edged sword for elected representatives. As Van
Dooren (2005) explains:
Performance measurement does not make politicians win or lose an election. However, the
data that the performance measurement system yields may show weak performance. For
link to page 33
Chapter 2 | The New Zealand state sector – features and experience
15
politicians, everything they measure can be used against them, so they claim the right to
remain silent and not to measure. Politicians may indeed have a disincentive to collect data.
(p.374)
F2.1
There appears to be little demand for, and little inclination to supply,
productivity-related performance information on core public services.
2.3
Some officials are hostile to the concept of productivity
Some agencies and public officials appear to be averse to the concept of “efficiency” or
“productivity” in public services. They can be actively hostile to requests for efficiency
information and measurement. This occurs for several reasons.
One commonly held view is that measuring efficiency will distract energy (and resources) away
from the “real” work of the agency – to provide services and improve outcomes for clients.
In our view, requiring agencies to measure more in order to provide the data needed to
generate productivity calculations will create compliance issues and divert energy and
resources…from other work supporting innovation and other aspects of performance. (New
Zealand Public Service Association, sub. DR22, p.4)
Yet, the act of measuring activities can prompt service improvement. One such example is
discussed in Box 2.1. The example shows that measurement conducted for productivity and
business improvement can help uncover issues that improve a service by making it more client-
centred and more responsive to client needs.
Box 2.1
Call management in a primary health care service
One of the service elements of the new Health Care Homes model of primary health care
(discussed later in
Box 2.4) is for telephones to be “answered in a timely manner”. Thus,
Health Care Homes accreditation requires patient call demand to be measured and
monitored routinely by the service provider, with an enhanced call management approach
and “time to answer” standards in place.
One community health service provider serving a very high-needs population reported
initially being concerned that this type of measurement and monitoring might be too
onerous (and not especially useful). However, the provider found that measurement forced
it to look at its call drop-off rates and think about why patients were hanging up if their calls
weren’t answered straight away. Once the provider realised the reason was because most of
their patients used cell phones, and waiting for a call to be answered was creating a cost
barrier for them, it was more motivated to address the issue to provide a better service for
its patients.
Source: A health service provider.
The argument that measuring productivity is a distraction and requires a lot of resources implies
that the process of measuring productivity is very onerous, and requires a lot of new information
to be collected. In fact, many agencies already collect a large volume of administrative data
link to page 53 link to page 48
16
Improving state sector productivity
which could be re-purposed to measure efficiency if the agency were motivated to do so. Some
agencies are already doing this for some programmes (Moore & Hayward, 2017).
Another view is that focusing on efficiency might create perverse incentives that could
undermine the achievement of outcomes or drive down service quality.
What did come through strongly in interviews was that social sector leaders and their staff
are focused on making a difference for their communities. In this context, efficiency often
carried with it negative connotations of cost cutting and compromised service delivery.
(Pickens, 2017, p.5)
...a focus on productivity measurement as a public management tool is likely to result in
perverse incentives in non-transactional services. Output measures are prone to gaming
and, especially in the social sector, tend to have poor fit with improved outcomes for New
Zealanders. (SSC, sub. 19, p.2)
It is true that measures can be gamed; see, for example, the discussion about Health Targets
(Box 3.4). And
sole measures are likely to skew incentives, so that “what gets measured gets
managed”. The Commission’s argument is there are benefits to including measures of service
productivity alongside other measures. This can ensure a balanced picture of overall
performance is obtained, and send stronger signals about the importance of productivity for
achieving the Government's policy objectives. Principles for developing measures, and the place
of productivity measures in the overall performance management framework are outlined in
sectio
n 3.3.
The Commission has found some resistance to the measurement of productivity across the state
agencies that are the focus of this inquiry, in submissions to the inquiry, and in the interviews of
state sector leaders undertaken by Pickens (2017).
F2.2
There is some active resistance to the concept of productivity and efficiency,
based either on concerns about the effort required to collect information for
productivity measurement, or concern that a focus on inputs and outputs will
undermine the achievement of positive outcomes for New Zealanders.
2.4
Closed and risk-averse agency cultures inhibit innovation
The ability of agencies and providers to identify, develop and expand better ways of delivering
public services depends to a significant degree on the cultures within those organisations.
“Culture” in this context means the norms, values and beliefs shared by staff working in an
organisation or within a profession. These include norms of behaviour and accepted wisdom
about the factors that are important for organisational or professional success, and how this
success is best achieved (NZPC, 2014).
The
More effective social services inquiry found that, in many cases, agency or professional
cultures do not appear to be conducive to innovation, experimentation and improvement
(NZPC, 2015). Data, openness to debate, flexibility, and adaptability to change all matter for the
performance of organisations (NZPC, 2014; 2015; 2017). As the SSC noted in a summary report of
the first round of PIF reviews, discovering successful policies and practices depends in part on
having “a willingness to question existing practice, try new things and review the effectiveness of
different approaches” (2013, p.13).
Chapter 2 | The New Zealand state sector – features and experience
17
Available evidence suggests the cultures in many core public service agencies do not reward and
promote innovation and learning, nor do they tolerate failure. A survey of PSA members found
indifferent to negative perceptions of state sector organisations' ability to handle change; their
ability to learn from mistakes; and agencies' openness to learning and finding new ways of
working (Plimmer, Cantal & Qumseya, 2017).
Others have pointed to the insular nature of state sector agencies as a barrier to service
improvements:
The state sector also tends to do too much itself, leaning towards the status quo and not
always looking for opportunities where others could provide the same – or better – services
at better value. (Better Public Services Advisory Group, 2011, p.19)
…the state sector is generally a hermetically sealed system; self-informing and self-
reliant…this is probably the greatest barrier of all to innovation by the public sector: that it
relies upon the closed loop of its own society to deliver new ideas…(Methodist Mission
Southern, sub. DR18, p.2)
More broadly, several commentators have highlighted risk aversion within the state sector and
asymmetric rewards for innovation. GovTec World submitted to the inquiry:
A risk-averse, must not fail, output-focused culture in New Zealand government means
agencies are reluctant to use risky innovative approaches. (sub. DR31, p.4)
Senior state sector leaders interviewed for this inquiry agreed that:
Government is too risk averse. In their experience, politicians and the public both tended to
overreact to failure, even when failure was a small part of total activity and is necessary for
innovation. This led to state agencies becoming reluctant to try new things in case of failure,
and not sharing information on failure even though it may be useful to others. (Pickens,
2017, pp.27-28)
The Better Public Services Advisory Group concluded that:
Innovation is being stifled by a lack of capability, and an undue degree of risk aversion on
the part of chief executives, boards and Ministers and little consideration of how to manage
risk in this context. (2011, p.20).
Risk aversion is not just a feature of the sectors that are the focus of this inquiry. Risk aversion
manifests itself in the state sector's operation in multiple ways: including rigid and hierarchical
management structures, prescriptive internal approval processes, inflexible procedures for
sharing information, and restrictive funding contracts. Many of these procedures and processes
are designed to manage perceived risks to the agency or to ministers.1
Risk aversion in the state sector, to some extent, stems from the adversarial nature of the
parliamentary system. In democracies, political debate and external scrutiny help promote
transparent and accountable government, and provide an important check on the state’s
1For example, the Commission found that the culture of some regulators placed “significant weight on managing risks to the
organisation, at the expense of the efficient management of social harm” (NZPC, 2014, p.98). Notably, almost half (48%) of
regulatory chief executives surveyed by the Commission agreed with the statement "agencies are often too risk-averse when
enforcing regulations"(NZPC, 2014, p.96).
18
Improving state sector productivity
coercive powers. As such, political friction is a central and essential component of New Zealand’s
system of government.
Yet, all democracies must strike a balance between political accountability on the one hand and
creating an environment conducive to innovation on the other. An unsophisticated approach,
which seeks to minimise rather than manage risk, stifles innovation and limits the opportunity for
productivity gains. The Commission considers that a more robust understanding of risk,
including taking a “portfolio” approach to public services instead of focusing on individual
failures and successes, would better ensure the responsible use of public funds, and enable the
innovation that supports improved services and greater productivity.
F2.3
The New Zealand state sector is intolerant of failure, which has the effect of
stifling innovation.
2.5
Narrow commissioning and poor policy practices limit
opportunities
Good policy practice and effective commissioning processes are critical to lifting state sector
productivity.
Policy practice
Good policy practice ensures state agencies are delivering the right types and set of services, by
ensuring:
services are designed to best meet the needs and characteristics of customers, thereby
reducing the probability and incidence of “failure demand” (described below);
there is a clear intervention logic between services and desired social outcomes, minimising
waste, or misdirected effort; and
existing services are reviewed to assess their impact, so they remain relevant, effective,
efficient and well-targeted over time.
Policy capability and performance within the state sector has been under the microscope for
some time, with:
a government-appointed committee to review expenditure on policy advice in 2010;
changes to state sector legislation in 2013 to strengthen the obligation on departmental chief
executives to ensure their organisations have the “organisational health, capability, and
capacity to offer free and frank advice to successive governments” [State Sector Act 1988,
section 32(1)(c)], and
the appointment of the chief executive of the Department of the Prime Minister and Cabinet
(DPMC) as the Head of the Policy Profession and the “senior sponsor” of the Policy Project,
which aims to lift “the policy game across the system” (Policy Project, 2015, p.2).
Chapter 2 | The New Zealand state sector – features and experience
19
This attention does not seem to have led to consistent, system-wide improvement. The Policy
Project found that:
Where agencies run internal quality panels they tend to concentrate on review before sign out of
Cabinet papers and RIS [Regulatory Impact Statements]. Only a few agencies use panels for ex-
ante planning for quality, and real time feedback to colleagues, managers and teams.
Ex-post assessments tend to be a compliance exercise, often a once-a-year exercise to enable
reporting of a quality score; less than half of the responding agencies reported that the findings
of ex-post assessment led to agency or team level improvement initiatives. (2017, p.2)
Another Policy Project report commented that:
Most policy agencies rely on external reviews of their policy quality. These reviews are useful for
benchmarking and tracking changes in the quality of papers over time. However, most
assessments are limited to periodic reviews of papers which are assessed without any
background information on context or process. Many agencies concede that they derive little
added value from assessments…Agencies that have invested most in lifting the quality of advice
have introduced a range of tools and processes – such as checklists, guidance, peer and panel
reviews – and use reviews of quality for learning and development purposes. In short, building a
culture of constructive challenge and feedback and a commitment to quality assurance is critical
to lifting quality and consistency of policy advice. (Policy Project, n.d, p.10)
F2.4
Many agencies lack the systems or cultures necessary for ensuring the quality
of policy advice.
Commissioning processes
“Commissioning” is a subset of policy development and refers to “a set of inter-related tasks
that need to be undertaken to turn policy objectives into effective social services” (NZPC, 2015,
p.128). Commissioning is the process of selecting the right service delivery model (including, but
not limited to, delivery through public agencies), and includes several steps, namely:
assessing customer needs, and understanding gaps or overlaps in current service provision;
designing solutions, including identifying the most appropriate service model;
identifying and selecting the best way to deliver, structure and fund the services;
monitoring ongoing performance to ensure effectiveness, sustainability and continuous
improvement; and
evaluating and monitoring outcomes, including comparing performance against original
expectations. (Social Investment Agency, 2018)
Better commissioning, and the resulting alignment of service design and delivery with client
needs and characteristics, can raise productivity. The OECD (2011) has noted that empowering
and more directly involving clients in the delivery of services (eg, by providing greater choice of
provider, or offering client-directed budgets) “can offer a new approach to deliver more or the
same with less by tapping into individual resources and reducing the need for expensive
services…[and] can help increase service effectiveness” (p.33).The Commission also found its
inquiry into
More effective social services that there is good evidence that (under the right
circumstances) empowering people to make these choices significantly improves their wellbeing.
link to page 30
20
Improving state sector productivity
An example of how one agency is applying commissioning techniques to improve the access
and effectiveness of respite care can be see
n in Box 2.2.
Box 2.2
Rethinking service models: Transforming Respite Strategy
The Ministry of Health (MoH) spends approximately $61 million per year on disability
respite services. Traditionally, most respite services have been supplied through contracts
with respite providers (with some services also purchased via Individualised Funding).
In consultation with people with disabilities and their families/whānau, MoH identified
numerous problems with this model of service delivery, including:
inflexible services that did not meet people’s needs;
difficulties in accessing services;
respite options that did not provide value for money; and
inconsistency in the services available throughout the country.
In 2017, MoH released
Transforming Respite: Disability Support Services Respite Strategy
2017 to 2022. The strategy signalled a movement away from a funding model focused on
centrally-purchased services, towards a model that prioritises outcomes and greater choice
and control for people with disabilities. The strategy notes:
The Ministry would like to move to outcomes-based respite models. This will require
reconsideration of the current funding model so that we can move away from paying
for respite beds that may not be used and focus the available funding on providing
choice for families/ whānau that deliver value for money. (p.11)
A key component of the strategy is to offer family/whānau a flexible respite budget.
Budgets can be used to meet the specific respite needs of the family/whānau – whatever
those needs are. This approach is expected to stimulate innovation, and lead to a wider
range of high-quality respite options within two years.
Source: Ministry of Health, 2017.
However, the Commission concluded in its inquiry into
More effective social services that, in
general, social sector agencies do not consider the full range of service models available,
preferring instead to rely on a smaller number of options (eg, in-house provision, contracting out
for services, and managed markets).
Traditional service options often leave limited or no room for customers to choose their provider
or affect the nature of delivery. These also provide few incentives for providers to respond to
client preferences or feedback. Methodist Mission Southern wrote in its submission to this
inquiry:
Notably, the customers /clients / students / patients / users of state sector or state sector
purchased services do not usually have easy recourse to an alternative supplier. In the case
of social service clients, even where there are alternative providers in the same market, the
link to page 31
Chapter 2 | The New Zealand state sector – features and experience
21
clients’ knowledge of those services, their willingness, and their ability to switch, even if they
recognise that the service they are receiving of insufficient quality, are profoundly limited.
It is simply not possible in social services for the customer to signal to state sector providers
their desire or interest in product or service differentiation or iteration. With no feedback
from the primary users, the sector innovates – if it does at all – in the absence of any real
customer information. (sub. DR18, pp.1-2)
The Commission also found unresponsiveness to customer preferences during its inquiry into
New models of tertiary education:
Students may change their mind about a field of study or provider, or want to change the
qualification level they are studying towards. Students may be unhappy with the quality or
type of education they are receiving or may just realise they have made a mistake. But the
system does not support students to change their path or to have their credit or prior
learning recognised. The way government measures and rewards provider performance
means providers have little incentive to help students change their course of study. (NZPC,
2017, p.5)
In some services, greater client choice is neither practical nor desirable (eg, the location of, and
access to, specialist medical services), but agencies often do not seek to compensate for this by
creating alternative customer feedback loops, or by using existing client feedback to improve
services.
Similar conclusions were reached by the Better Public Services Advisory Group, which noted a
“weak customer focus” in the state sector and “feedback mechanisms [that] are not well
developed” (2011, p.19). The Advisory Group attributed this poor focus to “agency capability
and a reluctance to open up areas of information and decision-making that have traditionally
been out of bounds” (p.35).
The
More effective social services inquiry also found that commissioning approaches were often
poorly targeted to client needs, leading to ineffective delivery and failure demand (NZPC, 2015,
p 98). “Failure demand” is a term, often used in the call centre environment, to describe
situations where clients interact many times with the service provider because the original service
didn’t meet their needs. This creates what appears to be “demand”, which requires more
resources to meet. Multiple calls from schools to Education Payroll Ltd (EPL) to sort out problems
is an example of failure demand that was tackled in 2015, after the roll out of a new payroll
system for schools in 2012
. (Box 2.3)
Box 2.3
Failure demand in Education Payroll Ltd
EPL was established in late 2014 to take over the management of paying teacher and
school employee salaries from the troubled previous provider (Novopay). In the course of
trying to understand the source of the problems with the payroll system, EPL staff
discovered that much of the traffic with schools was driven by poor quality initial service:
We needed real information, so from November 2015 we embarked on a process of
“
understanding” where we mobilised our people to listen to what the schools wanted
and capture details of how they interacted with us. We traced how individual
transactions flowed through from schools to EPL and back again – often many times!
We collected a massive amount of data. We spent time visiting schools and in the call
link to page 47
22
Improving state sector productivity
centres observing and listening to our people to understand the system they operate
in.
We found that the majority of our interactions with schools were not adding value to
the purpose – and this was not efficient for schools or EPL. They also were the root of
dissatisfaction and frustration for schools and our people. These were called
failure
demands and a result of processes not working well but most importantly showed that
we were not focused enough on what the school administrators needed.
Source: 2017 IPANZ Excellence Award application; Stephen Crombie.
The EPL experience demonstrates that reducing failure demand can improve satisfaction with
services
and decrease costs. EPL reported that, by early 2017, there had been a 12% increase in
schools’ satisfaction with the overall quality of service delivery. Yet, in the busy period of 2016/17,
the costs of additional labour reduced by 28%. New debts generation (a key “end to end”
indicator) had reduced by 48% (pers. comm.).
F2.5
Agencies’ approach to commissioning can leave limited room for customer
input into design and delivery; and can be poorly targeted, leading to
ineffective delivery and failure demand. Traditional commissioning
approaches limit the scope for innovation and improved productivity in service
delivery.
2.6
Input controls, input-based or restrictive funding models
stifle innovation
New Zealand’s public sector management system is based on government purchase of outputs,
and on managerial freedom to choose inputs. Despite this, many agencies face controls on the
use of their own inputs, or apply rigid or input-based funding models when commissioning
services from other providers. These controls can stifle innovation and inhibit productivity
improvement.
Redesigning existing services and processes to achieve greater effectiveness and efficiency can
require changing the mix of inputs used. For example, the automated passenger clearance
system SmartGate, which allows people to enter and leave New Zealand at international airports
without being manually processed by immigration staff, involved replacing people with
technology. SmartGate has allowed the New Zealand Customs Service to process more
passengers more quickly and with shorter queues, manage New Zealand’s increasing passenger
volumes (without compromising security),and do so with no need for extra staffing or airport
space (SSC, 2012; Tyson, 2014; New Zealand Customs Service, 2017).
In the case of SmartGate, the change in input mix was driven by ministers and by external
factors.2 The Australian Customs and Border Protection Service were trialling SmartGate and had
made it available to the New Zealand Customs Service to trial, and the Australian and New
Zealand Prime Ministers had agreed to streamline and simplify trans-Tasman air travel (Tyson,
2 Se
e Table 3.1 for the roles Ministers can play in supporting innovation.
link to page 33
Chapter 2 | The New Zealand state sector – features and experience
23
2014). However, in many cases, this type of innovation will rely on agency managers having the
freedom to innovate and change input mixes.
Another example is the primary health care model Health Care Homes, which aims to provide
faster, better-targeted services by changing the traditional input mix in primary health care –
making greater use of nurse practitioners, health care assistants, and technology
(Box 2.4).
Box 2.4
Health Care Homes
The Health Care Home (HCH) model of care is a new primary care service model being
implemented in about 128 general practices across New Zealand. Practices are changing
the mix of inputs (in the form of staff time, practitioner tools, and business activities) to
better manage the mix of acute, routine and preventive treatments.
The HCH model was originally adapted by the Pinnacle Midlands Health Network Primary
Health Organisation (PHO) from a model used by Group Health in the United States. The
HCH model then began operation in three practices in Hamilton in 2010. An HCH
Collaborative was formed in 2016 by the four largest PHOs in New Zealand, to support
general practices to implement HCH, and to undertake formal accreditation of practices
against the HCH model of care requirements published [by the Collaborative] in 2017. Some
DHBs and the Royal College of General Practitioners are also members of the Collaborative.
The HCH model aims to address primary care sustainability issues – such as increasing
demand, a growing GP shortage, an ageing population, increasing pressure on hospital
services (both emergency department and inpatient services), and finite resources – by
increasing efficiency, expanding staff roles, and giving practitioners tools to better manage
their time and resources. The HCH model also aims to improve patient access and
outcomes with a more patient-centred approach, which enhances and simplifies the patient
experience.
The HCH model has four domains: urgent and unplanned care, proactive care (for patients
with more complex needs), routine and preventive care, and business efficiency. Each
domain has a set of 20 service elements and 42 characteristics, which are over and above
the traditional general practice model.
The “characteristics” describe inputs (or activities) that can be varied or extended to fully
implement the HCH model. These include: having a care plan in place for patients;
providing a named care coordinator for complex needs patients; using population
stratification to identify complex needs patients; actively monitoring or managing patient
waiting times; using GPs for telephone triage; and using an interdisciplinary approach.
These inputs (or activities) can all be expanded and changed over time to achieve the goals
of the model.
Source: Ernst & Young, 2017.
While, in the case of SmartGate, ministers supported innovation in passenger clearance through
a change in input mix, input controls on state sector activities are common and more pervasive.
Input controls are typically used to limit expenditure when there are budgetary pressures or for
political “optics”. For example, governments have imposed caps or limits on public service
24
Improving state sector productivity
staffing, or directed that expenditure should be used to increase “front line” staff rather than
back office services.
Such controls can be a necessary “second-best” option when other approaches are inadequate
or politically unavailable, but tend to have perverse impacts over time. The recent Cabinet paper
removing the cap on core government administration staff noted that controls on the number of
staff can inhibit innovation by restricting “the ability of agencies to improve services through
transformational change”, as large-scale transformational change “often requires a significant
initial investment in staff” (Office of the Minister of State Services, 2018, p.2).
Another barrier to the pursuit, spread, or scaling-up of innovations are prescriptive, input-based
funding models. The Commission encountered these in its inquiries into
More effective social
services and
New models of tertiary education.
[In the social services sector] the need for accountability and political risk management
favours the use of prescriptive contracts, short contract periods and onerous reporting
requirements. These factors work against the development and spread of innovation.
(NZPC, 2015, p.7)
The tertiary education system is controlled by a series of prescriptive regulatory and funding
rules that dictate the nature, price, quality, volume and location of much delivery. These
controls have extended over time as a result of different financial, quality and political risks.
Together they constrain the ability of providers to innovate, drive homogeneity in provision,
and limit the flexibility and responsiveness of the system as a whole. (NZPC, 2017, p.3)
In the case of the tertiary education system, the funding approach had the effect of discouraging
providers from enrolling “hard-to-reach, hard-to-teach” students, thereby acting against
government’s objective of improving equitable access.
The DHBs commented in their submission to this inquiry that the health sector’s funding models
discouraged the pursuit of lower-cost service approaches.
The health system is currently trapped in a model that compares limited sets of this year’s
activity against the plan/budget with no longitudinal or trend view and little incentive to
invest in activity that will reduce the future need of a population for health services. In fact in
many facets of the current construct there is an absolute disincentive to become more
efficient or move services to a lower cost form of delivery. (sub. DR29)
Undemanding approaches to contract management can discourage providers from seeking new
and better ways of delivering services. Methodist Mission Southern observed that:
It has also become the habit of funders such as MSD and Oranga Tamariki to roll over
contract provision, removing the stress for ‘successful’ providers of reapplication and
contest. This is a kind of ‘contracting for a satisfactory minimum’ and acts, inadvertently, as a
barrier to innovation. (sub. DR18, pp.2-3)
Another consequence of current funding models is limited reallocation of funds from poorly-
performing programmes. Even where new pilots or new programmes are found to be failing to
meet their objectives, or are inefficient in meeting their goals, many of these are not ended.
(Pickens, 2017)
Chapter 2 | The New Zealand state sector – features and experience
25
F2.6
Overly prescriptive funding models are constraining innovation in public
services. Prescribing how inputs are to be deployed, or setting decision rights
at the wrong level, can also increase the costs of services without leading to
greater effectiveness.
2.7
Budget processes reward volumes and inputs, rather than
productivity
The budget system currently provides weak incentives for agencies to seek productivity
improvements in core public services. These weak incentives are the result of several factors:
The weakness of review mechanisms. The initial stage of the annual budget cycle is meant to
encourage examination of how well existing baselines are being used (New Zealand
Treasury, 2011) but, in practice, most effort and attention is directed towards proposals for
new spending (Norman, 2003; Pickens, 2017). There is little regular and systematic review of
the value for money from existing expenditure.3
The dominance of volume- or input-based funding formulae in core public services, such as
in education and health.
Conflicting priorities: a state sector leader interviewed for this inquiry “evidenced an
occasion where they offered up savings to their Minister, only to have that offer declined.
‘Waste is not always top of mind, they said.’” (Pickens, 2017, p.22)
The public sector financial management system does have built-in processes to encourage
efficiency and review, such as fixed nominal baselines and four-year plans. Under the former,
appropriations are fixed and, in general, only change where a specific decision is taken to
change appropriations. Agencies are expected to absorb price increases – they are, effectively,
subject to an efficiency dividend equivalent to the rate of inflation. Some senior state sector
leaders interviewed by Pickens argued these constraints were positive for productivity.
Some interviewees felt government budget disciplines provide a strong incentive for
innovation, in particular with respect to productive efficiency. One described how, when
confronted with
severe budget constraints, an organisation may have to think outside the
square to prevent organisational failure or severe hardship for clients. One interviewee
suggested efficiency only becomes a top priority when entities are in trouble – for example,
when they are at risk of overspending. Another said the tighter budget constraints
accompanying the global financial crisis had encouraged efficiencies. (2017, p.21)
However, for some core public services, the constraint of fixed nominal baselines has only limited
effect. Increases to volume-based funding models through the annual budget round are
commonplace.
3 However, there have been occasional exercises to seek across the-board efficiencies, such as the 2009 “line-by-line review”
and a one-off “efficiency dividend” sought from departmental baselines in 2011.
26
Improving state sector productivity
Four-year plans (4YP) are designed to provide an integrated view of an agency or sector’s
medium-term strategy. SSC and Treasury guidance states that:
The 4YP shows how a department plans to create increasing value for New Zealanders (or
particular target groups). It gives a view of strategy and delivery plans across the next four
years, set in the context of the department’s strategic objectives.
It is an integrated strategy for the department’s interventions, people and other resources
to move towards the department’s strategic objectives. Where demand or ambition
exceeds resources, the plan should identify the choices to manage pressures and
challenges within baselines…
The purpose of a 4YP is for Ministry leaders, in consultation with Ministers and the
Corporate Centre to shape and set out the medium-term view for a department. The 4YP is
a key strategic planning document, giving assurance that departments are fulfilling their
stewardship obligations (under the State Sector Act 1988) and focussed on sustainability (as
required by the Public Finance Act 1989). (SSC / Treasury, 2017, p.7)
The Office of the Controller and Auditor-General has been critical of many departments’ four-
year plans, commenting that:
Preparing four-year plans was not always fully integrated into a department’s boarder
strategic planning process. This is important so that a four-year plan provides a complete
and consistent view of a department’s medium-term strategy that aligns with other strategic
plans and policies.
I expected four-year plans to provide good information and discussion about the trade-offs
a department intends to make. This did not always occur. For example, a department that
identified funding shortfalls did not always consider how it would address these shortfalls.
This made it difficult to understand and assess any trade-offs needed, such as changes to
service levels.
The guidance published by the Treasury and the State Services Commission makes clear
that four-year plans should include financial information for all the Votes and appropriations
administered by departments. However, there was little information in four-year plans on
capital and asset management using this broader lens. For the departments my staff
reviewed, departmental expenditure was only 21% of total Vote expenditure and
departmental assets were only 29% of the total asset value of the department and the
Crown entities they monitor (OAG, 2017a, pp.3-4).
In some cases, government has attempted to shift away from volume-based funding. For
example, the 2001
Primary Health Care Strategy introduced capitation-based funding for primary
health care, in an attempt to shift the focus from maximising patient consultations to new models
of care that would improve health outcomes among the enrolled population. However, as
Middleton et al. (2018) noted in a paper prepared for the Commission:
Despite the moves to capitated funding, a significant proportion of general practice income
is still derived (and continues to derive) from patient co-payments. The result has been that
incentives over the years have continued to prioritise the volume of primary care over new
models of care. This was a concern in 2008 and was still apparent when those we
interviewed explained the importance of the careful positioning of an innovation like
telephone triage as part of the HCH model of care. The introduction of telephone triage, it
was explained to us, could result in less practice income from co-payments, which has
Chapter 2 | The New Zealand state sector – features and experience
27
meant PHOs have needed to provide additional funding or demonstrate that practice visit
volumes would be maintained. In Canterbury, early changes to the configuration of primary
care funding were made to overcome the incentive for general practices to prioritise the
volume of care. In other parts of the country, despite the early expectations that capitation
would shift incentives, the existence of patient co-payments continues to blunt the impact
of capitation. (p.26)
Greater attention has also been paid in recent budget rounds to strengthening evidentiary and
evaluation requirements for new spending initiatives, including those listed below.
The introduction of formal cost-benefit templates (“CBAx”) for many new proposals in the
2016 and 2017 Budgets. CBAx draws off existing government datasets on individual
education, health and other social outcomes, and encourages agencies to illustrate the net
social benefit from their proposed new initiatives.
Dedicated funding allocations for rigorous, data-based proposals (“Track 1” in Budget 2017,
which comprised $321 million). This funding came with tougher evaluation expectations, and
was designed to test new ways of improving the lives of vulnerable people.
Budget 2018 did not have an equivalent “Track 1” process, in part because the Government is
formally reviewing how it will use investment and analytic models in future (Kirk, 2017).
F2.7
Despite built-in processes to encourage efficiency and review, and some
recent improvements to evidentiary and evaluation expectations, the
incentives in the budget system for agencies to seek productivity gains in core
public services are weak.
2.8
Patchy monitoring, evaluation and data use make
governments myopic
Designing and implementing effective and efficient services is often an iterative process, with
regular feedback and review required to ensure the desired impacts are achieved. This is
typically presented as a cycle (Figure 2-2).
For this process to work well, policy designers need to think about their information needs at the
design stage, collect the data and monitor trends, and then adjust policy settings accordingly.
For established programmes, government agencies should look to expand and improve
information sources over time, in order to better understand performance. Information on
performance can take many forms, from the informal (eg, client feedback) and immediate (eg,
data on output production), to longer-term and more sophisticated options (eg, formal
evaluations, exploring the impact of the service on outcomes). The appropriate information
source will depend on the issue, policy, or service under consideration. Middleton et al. (2018)
noted that, in highly devolved sectors, spreading or institutionalising innovative models of
service delivery that have been developed “bottom-up” can be challenging without strong
evaluative evidence about what works.
link to page 39


28
Improving state sector productivity
Figure 2.2 Stylised public management performance cycle
Review system
New ideas
performance
Experiment with new
approaches and test
old approaches
Review
performance of
programmes and
Select and spread what
providers
Monitor and
works, amend or
evaluate
discard what does not
work
Identify what does or
does not work and
why
Source: NZPC, 2015.
Pockets of good practice and promising developments
There are pockets of good practice in policy review and data use within the state sector. In its
summary report on key lessons from the first round of PIF reviews, the SSC identified Inland
Revenue, the Ministry of Economic Development (now the Ministry of Business, Innovation and
Employment (MBIE)), and Statistics New Zealand as strong performers:
The key elements of good practice highlighted by these assessments are that a culture of
review is embedded so success indicators are well developed (and developed ‘at birth’ for
new activity); regular review is expected and undertaken on the basis of clear priorities;
strong evaluation capacity is developed (typically by a dedicated review group); and
appropriate action taken on the basis of reviews undertaken. (2013, p.32)
The Commission has similarly noted the role of the Education Review Office and Pharmac in
carrying out “structured, systematic evaluations of service effectiveness that guide continuing
refinement of services.” (NZPC, 2015, p.198)
Over this and previous inquiries, the Commission also noted a number of promising
developments within government agencies with the use of data to inform policy and service
development. These developments are at their early stages, but have the potential to help
government better understand the needs of citizens who use its services, provide greater
confidence in the likely impact on social outcomes, and move resources from less to more
effective programmes. The Ministry of Social Development's (MSD) reviews of the effectiveness
of Employment Assistance programmes is one example of how better data can improve
allocative efficiency and the overall effectiveness of expenditure
(Box 2.5).
link to page 39
Chapter 2 | The New Zealand state sector – features and experience
29
Box 2.5
Employment assistance evaluation
MSD has, for the past few years, been conducting effectiveness evaluations of its existing
programmes aimed at helping people back into work and increasing independence from
welfare. In the most recent evaluation, MSD made use of Statistics New Zealand’s
Integrated Data Infrastructure (IDI) to assess the impact of individual programmes on
employment and income outcomes, and to estimate these programmes' impact on future
outcomes. In the 2014/15 review, $190 million worth of programmes (out of a total of $462
million) were evaluated. The key findings were that:
$121 million worth of interventions were rated as “effective or promising”, with the
amount spent on such programmes increasing over the past five years;
the second largest amount of spending ($66 million) was on interventions rated as
“mixed”; and
$2.9 million worth of interventions were assessed as either making no difference or
having a negative effect. These programmes were being, or had already been,
terminated.
An additional $45 million of spending was assessed as “too soon to rate”, but with short-
term impact suggesting they would have a “mixed” or negative rating in the next evaluation
report. MSD was using these results to make changes to programmes “to try to improve
their effectiveness” (p.6).
The inclusion of IDI information had allowed a richer picture of effectiveness to be drawn,
and had changed some ratings awarded in earlier years. In particular, MSD found “some
interventions that have no impact on welfare independence but increase income and time
in employment” (p.6).
Source: De Boer and Ku, 2017.
Better data sets have also improved agencies' ability to “identify and successfully channel
services to previously under-served client groups, including youth and sole parents” (NZPC,
2015, p.207). MSD’s redesign of services for disengaged youth led to gains in young people
participating and achieving success in education (NZPC, 2015).
Service improvements do not necessarily require collection of new data. More effective use and
re-use of existing information collected by the state sector can also help inform service design,
support evaluation, and improve delivery. Recent efforts to link existing datasets have helped
reduce duplication and failure demand
(Box 2.6).
Box 2.6
Sharing data across a network (of agencies and independent actors)
HealthOne is a secure IT platform that stores individual patient records such as GP records,
prescribed medications and test results of all health providers in the Canterbury region.
HealthOne can only be accessed at the point of care by clinicians that are treating the
30
Improving state sector productivity
patients concerned, such as GPs, community nurses, pharmacists and authorised hospital
staff in the Canterbury health system.
This means all the health professionals who might treat a patient can see that patient’s
entire health record, including radiology, lab tests, hospital treatment, and GP visits and
care plans. This was a shift from the previous situation, where GPs, secondary care and
allied health professionals all kept their own records and relied on manually notifying each
other when they treated the same person.
Having more complete information available to clinicians providing patient care results in
better service (clinicians have information even when patients are not able to provide it –
such as in an emergency). HealthOne has also reduced duplication, in particular, of tests
that may have already been done or are not needed. For example, Canterbury DHB claims
that that the use of the new system has reduced the volume of radiology it carries out, as
clinicians know when a patient has already had a test and can access the results.
Source: Canterbury DHB; HealthOne.
F2.8
Agencies’ greater use and connection of data, analytic and investment models
in policy development and resource allocation is a positive step forward.
While the use of evidence in policy design and performance assessment is
growing, it is far from universal.
There is still room to improve elsewhere
Despite these developments, most core public services, and expenditure on these services, are
not subject to regular review. Indeed, over successive inquiries, the Commission has found that
relatively little effort is put into the monitoring, review and evaluation of policy or existing “core”
business, and that the results generated by monitoring and review seldom lead to substantial
change. Far too often, there is little visibility of what works and what does not.
The Better Public Services Advisory Group has observed that many state sector leaders lack the
information to effectively and efficiently steer their agencies:
Leaders are not using information effectively to drive their business, and lack the metrics to
determine the effectiveness and efficiency of their business model and operations. (Better
Public Services Advisory Group, 2011, p.21)
In some cases, evaluation or performance monitoring is not possible because the necessary
information has not been collected by the responsible agency. In their investigation of delays in
High Court civil cases, Toy Cronin et al. (2017) concluded:
There is an urgent need to improve data about who uses our courts, whether or not they are
represented, and how their cases proceed. Without this information, we are unable to
design a civil justice system that responds to the needs of those using the court and that
protects its important public function…
link to page 41 link to page 42
Chapter 2 | The New Zealand state sector – features and experience
31
The larger issue is that New Zealand continues to lack basic information about its civil justice
system. This study makes a contribution to increasing this knowledge but it has also
highlighted the lack of reliable data that is readily available about who is using our courts,
why, whether the litigants are accessing with or without representation, and how cases
progress once they are in the system. (pp.ii, 117)
Elsewhere, information is available but not well-connected. In the health system, for example,
considerable data is available on health events, costs and complexities, but this information is
collected at different points, using different standards and without links at the right levels. Fraser
and Nolan (2017) developed a “wiring diagram” to describe the complicated distribution and
flows of information within the health sector
(Figure 2.3).
For example, Downs (2017) noted that the Ministry of Health does not hold much data about
“quality, utilisation and outcomes of different types of primary care services” (p.5), but the
Commission found relatively rich information is available at the general practice level. The
Commission sourced some of this information to investigate the impact of an innovation in the
delivery of primary health care services
(Box 2.7).
Figure 2.3 Health sector information “wiring diagram”
Governance
Funding
Health System Vote
Health System
Frameworks and Targets
Performance Programme
National Services
National Collections
DHB Payment Data
Population
Based Funding
Health Quality and Safety
DHB Reporting
Commission
DHB Funding
Package
National Accounts
National Cost Collection
Measures
and Pricing Programme
Other Funders
Provision
Provider Arm (DHB of Domicile)
Funding Arm
· Inpatients
· General Practice
· Outpatients
· Private hospitals (DHB provision)
· Other direct provision
· Pharmacies
· Residential aged care
· Mental Health services
· Others, e.g. disability services,
Provider Arm (DHB of Care Outside District)
·
community laboratories, Plunket and
Inpatients
·
Wellchild, etc.
Outpatients
· Other direct provision
Source: Fraser and Nolan, 2017; Productivity Commission.
link to page 33
32
Improving state sector productivity
Box 2.7
Measuring innovation in primary health care
As part of a case study on innovation in primary health care, the Commission investigated
the impact of Health Care Homes in the Greater Wellington region
(Box 2.4). The analysis
had two key goals. The first was to look at the impact of Health Care Homes on the
capacity of general practices to service their enrolled populations. The other was to look at
the impact of Health Care Homes on the demand for hospital services.
The study required data from the General Practice Patient Management Systems (held by
Compass Health PHO) to be matched with data from the National Minimum Dataset (a
national collection of public and private hospital discharge information). IT staff at
Compass Health and the Capital & Coast District Health Board (CCDHB) matched the data
using patients’ National Health Identifier. In accordance with the Privacy Act 1993, IT staff
then encrypted the data with a different number and sent it to researchers at Auckland
University of Technology (AUT) for analysis.
Health organisations are, understandably, cautious with sharing data. Obtaining data for
the analysis was only possible because of the good relationship between CCDHB and
Compass Health PHO (and the PHO’s member general practices). Trust was also
established between the Commission, staff at CCHB and Compass Health PHO, and AUT
academics.
The Commission’s experience demonstrates it is possible to extract significant value from
the rich data held by PHOs and DHBs. However, doing so requires agreed processes for
sharing data, and a commitment to developing trusted relationships with data owners.
In other cases, information may not be used because of concerns about possible poor results. As
the Commission found in its inquiry into
More effective social services:
…the Government and its agencies sometimes have strong incentives to suppress results
that show a programme is performing poorly. New initiatives are often associated with an
agency or political brand, and a perception of poor performance puts that brand at risk.
One senior official, in meeting the Commission, described a government agency’s internal
evaluation unit as a “bomb factory” because evaluations were late and found faults. (NZPC,
2015, p.198)
Concern about the adequacy of policy-relevant evaluation and performance information has
been a recurring issue in New Zealand’s public management system. A review of expenditure on
policy advice in 2010 found that:
The New Zealand policy advisory system’s use of evaluation is limited by contrast with some
governments… Furthermore, there is evidence – gathered in the course of this Review,
anecdotally, and derived from other reviews – that much evaluation in practice is summative
evaluation conducted by small groups of specialised researchers unconnected with policy
advice groups, and is expensive and time consuming… There is evidence that monitoring
activities do not focus sufficiently on indicators of the effectiveness of policy. (Committee
Appointed by the Government to Review Expenditure on Policy Advice, 2010, p.47)
Chapter 2 | The New Zealand state sector – features and experience
33
Similar concerns were expressed almost 20 years ago. In 1999, the SSC released a paper
discussing outcome evaluation “and other risky feats”, which concluded that “very few
departments actually monitor, review, or evaluate the extent to which the policy outputs they
produce contribute to government strategic priorities” (p.5). Research conducted by the SSC
found that:
…only 7% of policy proposals suggested any ex-post review of results. Evaluation is typically
not built into the policy advice at the outset, thereby making future review problematic…
Where evaluation does occur, it tends not to be systematically integrated into policy
processes. (SSC, 1999, p.8)
The lack of attention paid by agencies to monitoring, evaluation, and performance information
reflects wider incentives within the political and public management system, and mirrors the
Commission’s earlier finding about a lack of interest in productivity-related performance
information. Cumming and Forbes (2012) cite a “range of barriers in New Zealand that mean we
pay far less attention to evaluation and performance information than other comparable
countries or that should occur with a strategic management approach to public policy and public
management” (p.53). These barriers include:
…a lack of real demand for evaluations from Parliament and some ministers; a focus by
central agencies on compliance, particularly on financial accountability and accountability in
delivering key outputs rather than outcomes; and a lack of legislative or other ‘pull’ factors
for outcome and evaluation information. (p.53)
F2.9
The attention paid by agencies to monitoring, review and evaluation of core
public services is generally inadequate. This limits the ability of ministers and
agencies to understand what works, where improvements need to be made,
and how resources should be best allocated.
2.9
Conclusion
The weak innovation and productivity performance of the New Zealand state sector is the result
of many factors including the capability of its staff, the quality of its internal processes, the
ambition of its leaders, and the policies and priorities set by ministers. Low state sector
productivity growth is a reflection of all these factors. New Zealand is not the only country that
faces these challenges, but responses need to be tailored to our specific circumstances and
institutions. Chapter 3 makes recommendations on how to lift state sector productivity and
encourage innovation – all of which can be implemented within the existing legislative
environment.
34
Improving state sector productivity
3 System-level changes for a
more productive state
sector
The task of lifting productivity in core public services requires actions at many levels, some of
which will be specific to the sectors and Votes involved. This inquiry has not explored each core
public service sector in detail but has instead focused on systemic changes that would help drive
productivity improvements across the state sector. The Commission has concentrated on the two
main groups of levers that can shift departmental and agency behaviour: the performance
management system and the budget process.
The recommendations in this chapter are made based on current legislative frameworks, which
provide sufficient scope to improve state sector productivity. The Commission understands there
are proposals to refresh or update these frameworks, with the aim of placing wellbeing
objectives more centrally in the public sector management system. Such changes would provide
an opportunity to embed some of the changes recommended in this chapter.
3.1
Making sure everyone plays their part
Making sustained productivity gains in public services will depend on efforts by ministers, agency
leaders and central agencies, and the recommendations in this chapter focus on these three sets
of actors.
Each actor plays a distinct role. As the Cabinet Manual notes, “Ministers decide both the
direction of and the priorities for their departments. They are generally not involved in their
departments’ day-to-day operations” (Cabinet Office, 2017, p.42). Ministers also set expected
short- and medium-term performance standards for departments and Crown entities, particularly
though accountability documents such as statements of intent and strategic intentions, and
information supporting the budget estimates.
Departmental chief executives have a range of responsibilities under the State Sector Act 1988
for ensuring the ongoing and efficient delivery of services, and for the “financial management,
performance, and sustainability of their departments” under the Public Finance Act 1989. Chief
executives’ responsibilities include (but are not limited to):
the “tender of free and frank advice to Ministers”;
“stewardship of the department or departmental agency, including of its medium- and long-
term sustainability, organisational health, capability, and capacity to offer free and frank
advice to successive governments”; and
“the efficient and economical delivery of the goods or services provided by the[ir]
department… and how effectively those goods or services contribute to the intended
outcomes” (section 32, State Sector Act 1988).
link to page 45
Chapter 3 | System-level changes for a more productive state sector
35
Finally, central agencies (and their ministers) set and manage the processes which promote
performance, efficiency and responsiveness to the government’s priorities. These include annual
performance reviews of chief executives, semi-regular reviews of agency performance and
capability (such as the PIF reviews), the annual budget round, and the enforcement of financial
management rules.
3.2
Put productivity improvement on the ministerial agenda
Ministerial expectations matter
The setting of expectations and standards by ministers has an important role to play in lifting
state sector performance. One senior state sector leader interviewed by Pickens (2017)
commented that:
Good Ministers could be significant catalysts for improving performance, challenging
established thinking, identifying clearly what they want and to what level, providing good
direction and cutting through the ‘bullshit’. (p.27)
Other interviewees “spoke of politicians who wanted to cut down on waste, ensure their
interventions are successful, and encourage innovation in the public interest. Interviewees
provided specific examples of ministers being the catalysts of performance improvement” (p.32).
One obvious way to encourage productivity improvement in core public services is for the
relevant responsible ministers to set clear expectations to boards and chief executives about the
importance of achieving such gains. Possible mechanisms for doing so are outlined in
Box 3.1.
Box 3.1
State sector and public finance management levers for ministers
Under the State Sector Act 1988 (SSA), Crown Entities Act 2004 (CEA) and Public Finance
Act 1989 (PFA) (and associated processes), ministers have several tools they can use to alter
agency work or prioritise its efforts.
Strategic intentions: a department must provide information to its minister(s) on its
strategic intentions over at least the following three financial years. This information
includes “the nature and scope of the department’s functions and intended operations”
and “any other matters that may be specified by the Minister” for understanding its
intentions and capability. Under section 38A of the PFA, a minister can require a
department to provide new information on strategic intentions “at any time”. The
department must also provide information on its progress in relation to these intentions in
its annual report (s.45, PFA).
Chief executive performance reviews: under section 43 of the SSA, the State Services
Commissioner is “responsible to the appropriate Minister or appropriate Ministers for
reviewing” the performance of departmental chief executives. Ministers can signal areas
(such as productivity gains in key services) of specific priority to them in assessing a chief
executive’s performance, while not getting too deeply into specific performance
management issues.
Statements of intent and statements of performance expectations: Under the CEA, Crown
entities must prepare statements of intent (SOIs) and statements of performance
expectations (SPEs). SOIs must, among other things, “explain how the entity proposes to
link to page 23 link to page 47
36
Improving state sector productivity
assess its performance” (section 141(2)(d)). Ministers are able to make comments on draft
SOIs, which entities must consider and may “specify the particular form in which any
information in the statement of intent must be disclosed” (section 145(b)).
SPEs are designed to “enable the responsible Ministers to participate in the process of
setting annual performance expectations” and “provide a base against which actual
performance can be assessed” (section 149b, CEA). SPEs must identify the Crown entity's
reportable outputs for the coming financial year, describe its intended effect, outlined
proposed revenue and expenses and “include a concise explanation of how the
performance of the class of outputs will be assessed” (section 149E, CEA). Ministers have
similar rights to provide comments and specify disclosure, as with SOIs.
Responsible Ministers may also issue Letters of Expectation to Crown Entities, outlining the
Ministers’ “expectations for [the] entities’ strategic direction and their specific priorities for
the planning period” (SSC, 2014, p.45). These Letters are not statutory documents but are
typically taken into account by entity boards as they prepare their SOIs and SPEs.
Ideally, setting productivity expectations should take place through a performance dialogue
between ministers and chief executives or boards, in which ministers set system-level goals, and
agencies are:
challenged to identify areas for improvement aligned with system-level goals; and
invited to set measures that reflect the reality of service delivery.
These performance dialogues should also incorporate other, less easily-measurable attributes
that contribute to productivity improvements. Chief amongst these are internal agency cultures
that enable debate, learning and constructive challenge, and strong internal capabilities that
allow agency leaders to fully understand their operating models and cost drivers, and make
suitable changes. These have been enduring weaknesses in state sector agencies, as successive
PIF reports have noted.
The State Services Commission should redesign the annual processes for
R3.1
setting and expressing ministerial expectations and standards to prompt the
identification of opportunities for productivity gains in public services.
Support and make space for innovation and productivity improvement
While responsibility for the day-to-day performance of agencies rests with chief executives, there
is much ministers can do to influence a culture of innovation and productivity improvement in the
state sector. Ministers can support agency efforts to improve services by acting as champions for
innovation and change, by publicly reinforcing their expectations of productivity improvement,
by celebrating success, and by recognising that change involves experimentation (which involves
the potential for failure). In the private sector, experimentation and “fast failure” are features of
the process of innovation. However, as noted in section
2.1, failure in the state sector can be met
with harsh criticism, which, in turn, acts as a deterrent to innovation. The OECD (2017) highlights
seven “roles” politicians (particularly ministers) can play in promoting state sector innovation
(Table 3.1).
Chapter 3 | System-level changes for a more productive state sector
37
Table 3.1 Roles ministers can play to support innovation
Role
How ministers can support innovation
Driver
Ministers can be the force behind a specific innovation. They can shepherd ideas
through the system and help agencies overcome political or administrative
obstacles. Ministers can act as the “popular face” of an innovation, garnering
political and public support for change.
Experimenter
Ministers can encourage the public service to test out new approaches and ideas.
They can provide “permission” to fail and to learn from unsuccessful experiments.
Experimenters can help discover what is possible, and help other politicians and
the public to see the possibilities.
Convenor
Ministers can use their influence to bring together stakeholders around particular
problems or innovations. Rather than driving a specific idea, the convenor helps to
create the conditions needed for innovations to develop. In this role, ministers can
provide visible political leadership to help enable and push groups to come
together to solve difficult and persistent public policy issues.
Stickler
Ministers can use existing performance reporting frameworks to support state
sector innovation. By paying specific attention to an area of poor performance,
ministers can signal the need for innovation and improvement.
Scout
Ministers can bring attention to a previously unnoticed issue or an emerging
problem. By doing so, they can kick-start the innovation process within agencies.
Alternatively, ministers can identify potential opportunities early on and advocate
that the state sector pursue these opportunities.
Regulator
Just as the regulatory environment can work against innovation in the private
sector, internal rules, procedures and structures can act as a barrier to innovation
in the private sector. Prescriptive funding requirements, rigid approval processes,
and outdated rules can work against the development and spread of innovations.
Ministers can play an important role in removing or modifying rules that can
hamper innovation, or by insisting on rules that allow state sector innovation to
occur. Ministers can “regulate” for innovation through the performance
frameworks placed on government agencies.
Protector
Innovation often involves experimentation and, by definition, failure. Yet, failure in
the state sector can meet media scrutiny and public criticism, which can deter
officials from trying new things. Ministers can help encourage innovation by
providing officials with political cover and the safety needed to innovate. This can
be through:
− setting expectations, for example, “this is an experiment, and it may not work,
but that is okay because it will provide us with valuable information that can
feed into improving services”; or
− supporting the public service when an experiment has not worked. for
example, “while it is unfortunate the initiative has encountered difficulties, we
need to acknowledge that expecting something as innovative as this to work
perfectly straight away is both unrealistic and unfair”.
Source: OECD, 2017.
link to page 49
38
Improving state sector productivity
F3.1
Ministers have a role to play in supporting agency efforts to improve
productivity by championing innovation in public service delivery.
3.3
Make better use of productivity measures
Measuring productivity levels and change is an important step in understanding performance
and identifying areas for further investigation. As Dunleavy and Carrera (2013) note, "[you] can
rarely improve any aspect of organizational performance that has not been fixed and quantified
in some degree” (p.299).
Yet, there is a difference between quantifying performance and using that information to inform
decisions. Soligo (2018) explores the literature on the factors that influence the use of
performance information to inform management decisions. The Commission drew on this
literature to identify principles that can help productivity measurement become accepted and
used, so that measurement can contribute to achieving agencies’ objectives. The principles of
productivity measurement are:
collect productivity data as part of business-as-usual activity;
complement productivity measures with outcome measures;
use productivity measures as one input into performance evaluation;
use productivity measures primarily as the basis for learning how to improve services;
involve staff who deliver services in the design of productivity measures; and
ensure agency leaders actively support the use of productivity measures.
One example of the benefits of productivity measurement is the Ministry of Justice’s “cost of
case” model, which estimates the staff time and departmental costs of the different types of
cases progressing through the District Court. This model has allowed the Ministry to identify
variations between different courthouses and at different stages of a court case, and to allocate
resources to where the need is greatest.
Similarly, the Commission’s case study with the New Zealand Police on responses to mental
health incidents drew on existing data in the Police central dispatch system. The case study
revealed differences between districts in the amount of officer time taken to respond to mental
health incidents. The study did not adjust for differences in the operating environment that may
affect the timeliness of responses, but further investigation may identify good practices that
could be replicated across Police districts (Genet & Hayward, 2017).
Simple productivity measures can highlight important questions. In its inquiry into
New models
of tertiary education, the Commission used publicly available data to assess the capital
productivity of New Zealand’s Tertiary Education Institutions (TEIs). This small measure prompted
some big questions
(Box 3.2).
Chapter 3 | System-level changes for a more productive state sector
39
Box 3.2
Simple analysis, important questions: capital use in Tertiary
Education Institutions
The Office of the Controller and Auditor-General (OAG, 2017b) undertook an audit of TEIs.
As part of the audit, the Controller and Auditor-General calculated an “investment
effectiveness” measure based on the net assets that TEIs were using to “produce”
equivalent full-time students (EFTS). The Commission adapted the investment effectiveness
concept to produce a simple measure of the capital productivity of teaching activities – the
results of which are shown below.
The graph shows teaching assets per EFTS by TEI for 2015. Lower column height means
higher productivity. The results show wide dispersion in capital productivity across New
Zealand TEIs. The most productive TEI had 13 times the capital productivity of the least
productive TEI. This observation prompted questions on the possible causes of the wide
dispersion. For instance, can the dispersion:
be explained by differences in the business models used by TEIs?
be the result of weak pressure to make effective use of capital assets?
reflect historical endowments, high surpluses and further capital asset accumulation?
$70 000
$60 000
$50 000
$40 000
$30 000
$20 000
$10 000
$
Universities
ITPs
Wānanga
Source: NZPC, 2017.
The Commission has used available data to construct simple or partial productivity measures.
Among the agencies and sectors that are the focus of this inquiry, the Commission has found
that measurement efforts are hampered (to varying degrees) by a lack of capacity, capability and
management focus, rather than a lack of data.
link to page 50
40
Improving state sector productivity
F3.2
The ability to quantify and measure is important for improving state sector
performance, but agencies often lack the capacity, capability and inclination
to measure productivity.
Build agency capability for productivity measurement
Productivity measurement is most usefully conducted close to service delivery and with the
involvement of staff. To build this capability, the Commission recommends that central agencies
(as the organisations with responsibility for state sector performance) establish a network of
officials to share knowledge, expertise and experience in productivity measurement. The
network could take several forms:
· An informal network like the Productivity Hub, where interested agencies or staff collaborate
to share experience and learn from each other4.
· A work stream under the Head of Government Finance Profession. This would align with the
findings of successive PIF reviews that strategic finance functions “provide the information,
intelligence and analysis that form the basis for decision-making that underpins strong
organisational effectiveness and efficiency” (SSC, 2013, p.33). The Head of Government
Finance Profession and Chief Government Accountant is already taking steps to improve
strategic financial management, and the Treasury has established a Financial Development
Programme to strengthen the role of finance staff across the state sector. This network could
be leveraged to include productivity measurement capability development, as part of
integrating strategic finance functions into the public sector performance management
system.
· A formal initiative, with its own dedicated funding and hosted by a lead agency. One model
for this is the Government Regulatory Practice Initiative
(Box 3.3).
Box 3.3
The Government Regulatory Practice Initiative
G-REG is a network of central and local government regulatory agencies, established to
lead and contribute to regulatory practice initiatives. G-REG is hosted by MBIE, and works
on actions that improve leadership, culture, regulatory practice, and workforce capability in
regulatory organisations and systems.
G-REG has three areas of focus:
· developing organisation capability: from sharing approaches to compliance activities
and developing guidance material;
· developing people capability: from structured and formal training and shared informal
learning; and
· developing a professional community of regulators: both resulting from, and enabling
the development of, organisation and people capability over time.
The initiative also oversees the implementation of the New Zealand Qualifications
Authority-listed Regulatory Compliance Qualifications.
Source: MBIE, 2017.
4
www.productivity.govt.nz/research/productivity-hub.
Chapter 3 | System-level changes for a more productive state sector
41
Until decisions are made on formal capability development options, the Commission will
continue to support the development of an informal network in productivity measurement
through holding regular Productivity Hub and Government Economics Network sessions.
The ability to accurately measure the productivity of public services should be a core
competency of state sector organisations, as it underpins the ability to understand service
performance and to provide robust advice on improvements.
The companion volume to this report,
Measuring state sector productivity, provides guidance on
productivity measurement. In addition, the Commission has developed numerous measurement
case studies (eg, Genet, 2017; Green, 2017; Moore & Hayward, 2017; Genet & Hayward, 2017;
Fraser & Nolan, 2017). These are available on the Commission’s website
As part of the recent decision to remove the cap on central government administration staff and
strengthen public service capability, the State Services Commissioner conveyed to chief
executives government’s “expectations that state services agencies consider more of a ‘build
your own’ rather than ‘buy external expertise’ approach to ensure there is the ability to deliver
long-term value to New Zealanders” (Office of the Minister of State Services, 2018, p.4). The
State Services Commissioner would “actively set those expectations in his regular discussions
with chief executives and…monitor progress” (ibid). Similar expectations could be
communicated regarding the capability to measure the productivity of public services.
The Treasury and State Services Commission should establish and support a
R3.2
community of practice to share knowledge, expertise and experience in state
sector productivity measurement.
The State Services Commissioner should convey his expectations to
R3.3
departmental chief executives that they build and sustain the capability to
measure the productivity of public services.
Report regularly on the efficiency of core public services
Regular collection and publication of information on expenditure on core public services (such as
annual per-client or unit costs for schooling, court trials and imprisonment) would promote
greater official attention to productivity trends and performance. A similar exercise is conducted
annually in Australia, where the Australian Productivity Commission (APC) (on behalf of the
Council of Australian Governments) collects and publishes a raft of public service performance
information (covering both efficiency and effectiveness) across a range of fields in all Australian
States and Territories (APC, 2018). Elements of the reporting framework used by the APC could
be adopted in New Zealand (and adapted to suit local conditions, where required).
Regular collection and publication of public service expenditure information would have several
benefits:
It could generate additional incentives for agencies and services to seek ongoing
performance improvements. The APC’s
Report on Government Services has played a useful
role in spreading good practice and identifying areas for improvement in the state sector
(Banks & McDonald, 2012).
42
Improving state sector productivity
It would provide consistent, longer-term information on service efficiency, whereas the
ministerial expectations for productivity improvement (discussed above) would most likely
change over time, reflecting the priorities of different governments, and may not cover all
“core” public services.
It would improve transparency about public expenditure. Information about the full costs for
some core New Zealand public services is not readily available, or able to be calculated using
existing public material (for an example of this problem, see Genet, 2017).
The creation and publication of service cost information need not be particularly burdensome for
agencies. Indeed, some agencies already publish some of this information. For example, the
Ministry of Education’s Education Counts website has data on per-student funding by year of
schooling from 2003 to 2016.
The Treasury should collect and regularly publish information on expenditure
R3.4
on core public services, including (but not limited to) annual per-client or unit
costs for schooling, court trials and imprisonment.
Use performance measures wisely
The terms of reference for this inquiry ask the Commission to provide advice on “the appropriate
role of identified efficiency/productivity measures in public sector performance frameworks”. The
Commission considers that there is a place for quantitative productivity measures in public sector
performance tools, provided they are well-designed and used with care. The main benefit of
including productivity measures in the formal state sector performance system is to ensure that a
balanced picture of performance is obtained, and to send stronger signals about the relative
importance of productivity.
Several submitters and stakeholders expressed concerns about using quantitative productivity
measures in the public sector performance system. Concerns commonly expressed included
that:
performance targets or measures can create perverse incentives;
some public services are not readily amenable to measurement;
measurement can create significant financial and opportunity costs, which may outweigh the
benefits;
measures focused on inputs and outputs risk diverting attention from outcomes; and
productivity measures can be divorced from the reality of service delivery, and thus unhelpful
for service improvement.
There is merit to some of these criticisms. In particular, productivity indicators should not be the
only performance measure used and should not have high stakes incentives attached. That said,
the relevant risks with quantitative productivity measures can be managed. The companion
volume to this report,
Measuring state sector productivity, provides advice on how to plan and
design such measures.
However, designing and implementing effective performance indicators is not simply a technical
measurement exercise. It also requires work to develop data sources, and gain the support of
link to page 53
Chapter 3 | System-level changes for a more productive state sector
43
delivery staff, managers, and other stakeholders. The experience with health sector targets
provides lessons about implementing performance metrics
(Box 3.4).
Box 3.4
Performance measures: Lessons from the health targets
Stakeholder engagement and support for implementation, 2007
The first set of 10 health targets were established by the Ministry of Health in 2007. While
they were instigated by the Ministry and the Minister of Health, the targets were developed
with extensive input and agreement from clinical experts and DHBs, and they were
implemented in exchange for a reduction in other DHB reporting requirements.
The targets operated as a group, covering a range of services (hospital and non-hospital,
prevention and acute services) that were relevant to the wider sector; were action and
results oriented; were measurable (ie, there was useful data available); and had leadership
and analytical support provided by central government (each target had a national
champion and ongoing analytical support from the Ministry of Health).
A departure in 2009 – the introduction of inpatient volume measures, driven centrally
In 2009, the number of targets was reduced to six. Five of the initial target areas were kept
(with some changes to the specific details and the performance indicators) and one new
target was added. This second set of targets was more closely led by the Minister of Health
and was focused on hospital services and specialist waiting times.
There are indications that the target to improve access to elective surgery may have
prevented the shift of simple elective procedures into primary care settings or resulted in
procedures being moved out of primary care and back into hospital settings (Fraser,
Gemmell & Nolan, 2018). This could be because the second set of targets were developed
with less involvement of health sector stakeholders and experts, or because the electives
target focused on measuring volumes rather than outcomes. The focus on volumes could
have incentivised the sector to move services from where they were not counted as part of
the target (primary care) to where they are counted (hospitals). This was despite the explicit
goal of the Better, Sooner, More Convenient Health Care initiative for moving more
resources to the front line.
The need to continually take account of factors in the institutional environment
When designed and implemented well, health targets can be a successful performance
measure and can focus the health system on key priorities. In a review of efficiency
measures used by the health sector, Knopf (2017) noted that health targets had become an
“enduring significant component of the health system performance framework” (p.4). Yet, it
remains important to consider the range of organisational and institutional factors that
influence a performance measure's effectiveness. Factors include the process and buy-in for
the measure, the metric itself and how it complements, or has the potential to undermine,
other introduced measures or goals. Finally, the measure may need to be re-negotiated if
there is a change in the parties to the performance agreement.
Source: Knopf, 2017; Tenbensel, 2009; Fraser, Gemmell and Nolan, 2018, Middleton et al., 2018; Ministry of Health.
44
Improving state sector productivity
The experience with the health sector targets suggests that productivity measures should be
introduced into public sector performance management tools with care. Before making the
indicators formal accountability measures, agency leaders and ministers should ensure that:
there has been appropriate consultation and input from stakeholders, especially those
involved in service delivery;
the indicators align well with desired outcomes;
sufficiently robust data sources and collection processes are in place; and
leaders and middle managers support the indicators' use and application.
Agency leaders should also be conscious that performance measures have “use-by dates”. They
should have processes in place to regularly review the use and impact of the measures, and test
whether they are still relevant and beneficial.
F3.3
There is a place for well-designed quantitative productivity measures in public
sector performance systems. The main benefits of including such measures is
to ensure that a balanced picture of performance is obtained, and to send
stronger signals about the relative importance of productivity.
Agency leaders should introduce productivity measures into public sector
R3.5
performance management systems with care. Before making such indicators
formal accountability measures, agency leaders should ensure that:
there has been appropriate consultation and input from stakeholders,
especially those involved in service delivery;
the indicators align well with desired outcomes;
sufficiently robust data sources and collection processes are in place;
leaders and middle managers support the indicators' use and application;
and
there are processes in place to regularly review the indicators, and test they
continue to suit the operating environment.
3.4
Raise the bar on new expenditure
As discussed in Chapter 2, the current operation of the budget round provides weak incentives
to seek productivity improvements in core public services, due to little systemic review of “base”
expenditure or prioritisation of productivity, and the dominance of volume- or input-based
funding models. As the submission from Te Puni Kōkiri noted:
The annual budgeting process is based on a cost plus approach with the focus largely on
new funding… The automated ‘roll over’ of baseline funding does not encourage agencies
to reflect on the effectiveness of their current programmes, or to consider alternative
innovative approaches that may yield more effective outcomes for the clients they serve.
(sub. DR27, p.2-3)
Chapter 3 | System-level changes for a more productive state sector
45
The Commission proposes that the Government should look to improve productivity by:
building the capability of agencies to effectively measure productivity;
improving incentives in existing funding models, and strengthening internal agency cultures
and processes;
enhancing evaluation and monitoring to identify lower-performing programmes that can be
closed or improved; and
raising the quality and impact of new spending.
Raise the quality and impact of new spending
One way of strengthening agencies' incentives to lift productivity is to raise the bar for new
spending proposals and provide greater rewards for those that have a high probability of
generating productivity gains. The Commission recommends two steps.
The first is to expand and develop the use of data, analytics and investment models in the
preparation and consideration of budget bids. This will help ensure that new initiatives are well-
targeted and have a stronger likelihood of success.
The second step is to shift the balance of new spending from volume- and input-based initiatives
to higher-impact and productivity-enhancing proposals. This could be done by setting aside a
distinct portion of the annual budget operating allowance dedicated to agency proposals that
have a high probability of making a significant impact on wellbeing (eg, as evidenced through
robust business cases and returns on investment), and then progressively increasing that share of
the allowance. For example, in Budget 2017, $321 million out of $7 billion was allocated to
“social investment” (also known as “Track 1”) initiatives, which targeted people experiencing
high degrees of disadvantage.
This requires processes to test the robustness of business cases and evidence, but the Treasury
has been developing these over successive budgets. These include convening panels of external
experts, including the departmental science advisers and senior leaders from non-government
organisations (NGOs) and other state agencies, to review, refine and provide advice on
proposed new spending initiatives.
Setting up distinct shares of the budget allowance may create perverse incentives, such as
discouraging some agencies from entering the more rigorous funding channel. While this may
be inevitable, the risk could be managed by raising evidence and quality expectations over time
for all budget initiatives, and credibly signalling that the proportion of future allowances
available for “business-as-usual” initiatives will shrink over time.
The process of progressively shifting the balance of new operating allowances from business-as-
usual bids to higher-quality initiatives will, of necessity, be gradual and incomplete. Budgets are
inherently political tools, which need to accommodate election, coalition, and other
commitments. However, even small shifts in resource priorities can have significant impacts on
agency behaviour.
46
Improving state sector productivity
The Treasury should continue to raise expectations on agencies seeking new
R3.6
funding in annual budget rounds to:
use data, analytics and other investment models to design new initiatives
and demonstrate their benefits; and
provide robust evaluation plans for new initiatives.
As part of future budgets, the Minister of Finance should set aside a distinct
R3.7
portion of the operating allowance dedicated to “high impact initiative”
proposals that have a high probability of making a significant impact on social
wellbeing (eg, as evidenced through robust business cases and returns on
investment), and then progressively increase the share of the budget
allowance devoted to that portion.
Tighten the link between future allocations and past performance
As noted earlier, the annual budget round includes an initial stage aimed at assessing how well
the “base” of expenditure has been used. In theory, this is designed to encourage spending
agencies to ensure they are using existing resources effectively and efficiently. In practice,
however, this assessment stage has failed to provide much incentive, because of:
the low priority placed by agency leaders and ministers on achieving productivity gain;
insufficient time and effort devoted to scrutinising past expenditure;
inadequate information about past agency performance;
the political salience of proposed new spending initiatives; and
the lack of consequences for failing to demonstrate past efficiency and effectiveness.
Applying consequences for a failure to demonstrate past performance is challenging, especially
in areas where there is high demand for public services. Consequences obviously need to be
applied with care. That said, this is an essential component of encouraging greater productivity
in future.
There are several ways in which the incentives for using the base of expenditure more effectively
and efficiently could be strengthened. This could include taking an efficiency dividend off all new
spending initiatives or capping new funding allocations until the department has satisfied
Cabinet that it is making the best use of its existing baselines. Such options, however, may be
perceived as unduly blunt and punitive, and could be hard to sustain over time.
Given the recommendation above to shift an increasing share of future budget spending
towards high-quality and –impact initiatives, a better option may be to restrict access to the
“high-impact initiative” portion of future allowances to those departments that have
demonstrated productivity improvement. This would allow agencies to continue to seek new
funding for extensions of existing programmes, but within a gradually tightening constraint. It
would also provide clear rewards for those agencies that can demonstrate improved
Chapter 3 | System-level changes for a more productive state sector
47
productivity. However, to avoid discouraging agencies from developing “high impact initiative”
proposals, the entry bar should not be set too high, at least in the initial years.
The Minister of Finance should restrict access to the “high-impact initiative”
R3.8
portion of future budget operating allowances to those departments that can
credibly demonstrate productivity gains from existing baselines.
Given that agencies have weak incentives to demonstrate past performance, other changes will
be needed to shift behaviour, such as:
better information from agencies and/or the Treasury on productivity trends in core public
services (the recommendations above to report regularly on spending on core services and
build measurement capability should assist); and
sufficient time, outside the pressures of the annual budget cycle, to examine departmental
baselines.
Retain and clarify an avenue for budget proposals from outside the state
sector
Non-government providers, the private sector, and customers are important sources of
innovative ideas and processes that can improve the delivery of public services (NZPC, 2015;
Dunleavy & Carrera, 2013). Such individuals and groups can, however, find it difficult to influence
the design and delivery of public services, especially when public service cultures are hostile or
unreceptive.
One recent innovation has been to allow organisations from outside the state sector to make
budget bids. Such a mechanism has the benefits of exposing ministers to a wider range of ideas
and proposals, removing roadblocks, and bringing the perspectives of customers and service
providers more closely to the Cabinet table. However, under current arrangements, the relevant
department must accept and support the bid for it to proceed. There is a risk under this
approach that departments may act as “gatekeepers”, blocking proposals that challenge their
existing models. To avoid this occurring, a clear avenue should be created for NGOs and other
providers to make budget bids directly to the Minister of Finance and Treasury, without having
to go through the relevant department. Such bids could be assessed either by the Treasury
directly, or through the use of independent expert advisors, as has occurred in recent years.
There may be a need for new governance arrangements around approved budget proposals
from non-government providers. This will be particularly important where oversight of the
initiative by the relevant department is deemed inappropriate. For example, the Treasury (or
another pre-selected agency) could be given responsibility for managing the contracts for NGO
initiatives and appropriations funded through the budget. Other commentators have proposed
establishing new organisations to manage these contracts (see Social Investment Working
Group, 2016, for a discussion of possible alternative governance arrangements).
To avoid the budget process becoming overwhelmed with proposals, the avenue for NGOs
should not be open-ended. Proposals from outside the state sector could be limited to the high-
impact initiative portion of the operating allowance, and only accepted for priority areas or
outcomes (for example, the Government could seek proposals from NGO providers to advance
its child poverty reduction goals). These priority areas or outcomes could be set by Cabinet at
48
Improving state sector productivity
the start of each budget round and communicated publicly. The higher expectations regarding
data use and evidence for new high-impact initiative proposals outlined above should help
manage demand.
The Minister of Finance should allow non-government organisations to make
R3.9
budget bids directly to the Treasury for the “high-impact initiative” portion of
the operating allowance in specified priority areas or outcomes, without having
to go through the relevant Vote department.
An alternative: relieve budget caps for very strong proposals
An alternative to the creation of the high-impact initiative budget allowance would be for the
Government to signal that it would be willing to spend more than the amount available in the
operating allowance on initiatives where it had confidence that the case and evidence for the
proposal was strong and where the impact on wellbeing was large enough.
It would be particularly important to set rigorous selection criteria. Further policy work would
also be required to assess any undesirable effects of this alternative, and whether such effects
could be mitigated.
3.5
Focus effort and attention on improving agency
processes and cultures
The effective operation of the state sector depends on strong agency cultures, leadership and
capability. There are several areas where action by departmental leaders will be needed to raise
productivity, especially facilitating culture change, improving policy and commissioning practice,
and reforming funding models.
Improve policy and commissioning practices
Policy capability and effective commissioning are core competencies for government
departments, and ministers have the right to expect high standards. Efforts to raise capability
and performance to date have rested largely on provision of information, advice and guidance.
This includes:
the Policy Project, which has developed frameworks for improving policy capability –
including developing methods and tools, providing workshops, and facilitating networks for
policy leaders across the public service to identify and share good practice; and
the appointment of the Social Investment Agency (SIA) by the previous government to lead
on building agency capability (NZPC, 2015, p.11). SIA is currently “working with a range of
organisations to prototype reusable and scalable commissioning tools, templates and
guidance” (SIA, 2018, p.2).
Agencies are left to decide how, when and whether to use guidance, tools and frameworks.
link to page 60
Chapter 3 | System-level changes for a more productive state sector
49
Voluntary approaches based on guidance and information have their place, especially at the
early stages of a change process. However, something more is needed to shift practice in
agencies. The Commission considered several tools and processes that could potentially be
used to promote more rigorous and consistent policy and commissioning practice across the
state sector. Options included:
modifying the PIF reviews to target policy and commissioning practice;
adding a new review mechanism or cycle; or
strengthening the chief executive performance review process to put more emphasis on
policy and commissioning quality.
All options have weaknesses. First, the PIF reviews are too infrequent to make rapid change to
agency practice, and turning the reviews into more of an accountability mechanism risks
undermining their value as a tool for promoting strategic thinking and clarifying organisational
goals and purposes. Second, state sector agencies are already subject to numerous review and
accountability processes. The Commission is wary of adding yet another into a crowded field.
Finally, while chief executive performance reviews are important for driving behaviour change,
these reviews would most likely require some other process to generate information about
agency policy and commissioning processes for the State Services Commissioner to make
reliable judgements on their relative strength.
The Commission did not reach a conclusion about the best way forward for raising the quality of
policy and commissioning practices – other than noting that any new review or accountability
tools should ideally replace an existing process to avoid adding to the compliance burden for
agencies. Central agencies should review existing tools and identify the most effective option.
Make more use of outcome / results-based funding
As noted in Chapter 2, a significant share of funding for public services is delivered through
volume-, process- or input-based models, including resources for schools, tertiary institutions,
and a range of social services. Such models can provide certainty for providers and support
access to services. However, these models also tend to come with weak incentives for innovation
or productivity growth. This is particularly the case when funding rules require specific input
types or numbers, which serve to lock in existing business models. Input-based funding models
can also have perverse outcomes, undermining the very objectives they seek to achieve.
Roughly characterised, funding models sit on a continuum, with each model creating a different
set of requirements and incentives for providers
(Figure 3.1). The further along the continuum,
the greater the scope for the reconfiguration of services to improve efficiency and effectiveness.
50
Improving state sector productivity
Figure 3.1 Continuum of funding models
Input-
Process-
Output-
Results-based
Outcome-based
based
based
based
What impact
What purpose
What
What process
How many
will the service
will the service
resources
will deliver
services will
have on
achieve?
are
the services?
be
clients?
required?
delivered?
Source: NZPC, 2015.
Input- or process-based funding models may still be appropriate for some services, such as those
where specific inputs or processes are important to ensure quality provision (eg, where specialist
staff or specific procedures are necessary for safe care). However, there are opportunities to
move more towards results- and outcomes-based funding systems, easing constraints and
providing greater rewards for better-designed services. The Commission has identified possible
changes in two major public service sectors.
In tertiary education, the Commission recommended that the funding system should:
remove any reference to “learning hours” in its definition of an equivalent full-time student
(the main unit of funding) in order to remove incentives for providers to inflate the size of new
courses and qualifications, and better allow unbundling of the various components that make
up education delivery (eg, course design, teaching and assessment);
be moved to more of a dynamic price-based model, under which funding (rather than
volume) is redistributed from lower- to higher-performing providers; and
more closely reflect the public value from education, with subsidies for courses with high
private returns reduced or eliminated. (NZPC, 2017, p.398)
In social services, the Commission proposed that purchasing and performance incentives could
be improved by:
taking account of service providers’ past performance when assessing funding bids;
adopting a risk-based approach to monitoring providers' contracts; and
expanding the use of contracting for outcomes, “including the use of incentive payments”
(NZPC, 2015, p.324)
There will be similar potential to encourage better results in other core public services. For
example, as noted earlier, Middleton et al. (2018) argue that patient co-payments dull the
incentives in the primary health capitation funding model for more efficient and effective
services. They encourage “face-to-face visits” and have required “'creative workarounds’ from
PHOs to ensure that practices shift from prioritising volumes to delivering proactive care” (p.33).
link to page 62 link to page 62
Chapter 3 | System-level changes for a more productive state sector
51
Agencies responsible for the purchase or delivery of core public services
R3.10 should review their funding models, with a view to moving as many models as
possible towards results- and outcome-based systems, or otherwise improving
incentives for productivity improvements.
Better assess agency openness to change and innovation
Government agencies need to ensure that their internal cultures support innovation, and that
their processes and funding models do not unduly impede improvements to the delivery of
services. Cultures that are open to new ideas are not easily measured and are not assessed in the
current performance management system. Evaluative assessments, based on expert judgement,
are often the most useful mechanisms for provoking internal reflection and improvement.
The main external evaluation mechanism used to assess the performance and strategic focus of
government departments and Crown entities is the PIF. The PIF is:
an analytical framework and a change management process. Reviews are undertaken by
Public Service and Non-public Service Departments and Crown Entities. They are supported
by an independent and experienced set of Lead Reviewers and by Central Agency officials.
The Chief Executive and senior team are the key people involved from the agency having a
PIF review. (Victoria University of Wellington School of Government, 2017a, p.viii)
The PIF has a forward-looking focus on the opportunities for improved performance in the face
of future challenges. It seeks to answer the following question:
What is the future contribution New Zealand needs from this agency? What is the
performance challenge to get there? What would success look like in four years? (Victoria
University of Wellington School of Government, 2017a, pp.viii-ix)
The PIF has been independently reviewed and found to be “a successful and credible
performance improvement tool that has contributed to the development of organisational
strategic thinking within organisations” (VUW School of Government, 2017b, p.8). However, the
model could be refined to add greater value.
The PIF model involves a review of five “critical areas” of organisational management. One of
the areas, “Leadership and Direction”, includes an “element” dealing specifically with values,
behaviour and culture. This element focuses on the culture needed to achieve the agency’s
strategic direction but does not explicitly address openness to innovation and change
(Table
3.2).5
5 Planning for a possible change in purpose and function is covered by one of the lead questions in the PIF. However, the
question focuses on strategic readiness for change rather than cultural openness to change at an operational or policy level.
link to page 62
52
Improving state sector productivity
Table 3.2 PIF elements and lead questions dealing with culture
Critical area
Element
Lead questions
Leadership
Purpose, Vision
How well do the staff and stakeholders understand the agency’s
and Direction
and Strategy
purpose, vision and strategy?
How well does the agency consider and plan for possible
changes in its purpose or role in the foreseeable future?
Leadership and
How well does the senior team provide collective leadership
Governance
and direction to the agency and how well does it implement
change?
How effectively does the board lead the Crown entity? (For
Crown entities only)
Values,
How well does the agency develop and promote the
Behaviour and
organisational values, behaviours and culture it needs to
Culture
support its strategic direction and ensure customer value?
Review
How well does the agency encourage and use evaluative
activity?
Source: SSC, 2015, p.4.
The PIF framework does include a lead question on how well innovation is used to ensure
“outstanding customer experience” (SSC, 2015, p.4). However, the lead questions could be
adapted to provide clearer signals about – and test the extent of – cultures, values and staff
engagement processes that support innovation in service delivery
(Table 3.3).
Table 3.3 Examples of modified PIF questions around learning, innovation and
change
Critical area
Element
Lead questions
Openness to
Understanding
How well do senior leaders understand the prevailing culture(s)
innovation,
of prevailing
within the agency?
learning and
culture
How well does the agency understand the influence of
change
culture(s) on innovation, learning and openness to change?
Active
How well do agency leaders promote a culture of learning and
management of
innovation?
innovation and
How well do agency processes support and encourage learning
learning
and innovation?
How well are performance lessons spread throughout the
agency?
Active
How well does the agency manage changes aimed at
management of
improving service delivery or efficiency?
change
Staff
How well does the agency involve staff in the generation of new
involvement in
ideas and ways of operating?
performance
improvement
Chapter 3 | System-level changes for a more productive state sector
53
The State Services Commission should adapt the Performance Improvement
R3.11 Framework’s lead questions and elements to provide clearer signals about –
and test the extent of – cultures, values and staff engagement processes that
support innovation and productivity in service delivery.
3.6
Understand where the frontier is, and be a “fast follower”
In the measured sector, productivity growth is often driven by the “frontier” – ie, the most
advanced firms, which develop, adopt and adapt new technologies and processes to increase
profitability and output. Industry-wide productivity increases as these new technologies spread
out to other firms, while the poorest performing businesses shrink and exit, reallocating their
resources to better uses (Conway, 2016).
This process of resource reallocation does not occur in the state sector, because government
agencies are generally monopolies and are effectively immortal (Dunleavy & Carrera, 2013).
However, there
is a frontier for state sector services and activities, and New Zealand can move
closer to it through greater diffusion and international connections. Governments in other
countries provide similar services and pursue similar outcomes to those in New Zealand. There
are, therefore, opportunities to learn about services, processes and other improvements in
overseas jurisdictions that could raise state sector efficiency and effectiveness here. For some
activities carried out within state sector agencies (eg, data collection and processing, and
customer relations), the private sector can and does provide examples of frontier technologies.
A recurring theme in discussions about state sector productivity is the potential and
opportunities for disruption created by technology. Governments the world over have tried to
push state sectors towards taking up digital and information technology in the delivery of public
services. Dunleavy and Carrera (2013) argue that “substantive changes of services” utilising
technology are a central means for lifting state sector productivity:
For instance, don’t try to run the existing local public libraries system more cheaply. Set up a
wholly e-book national lending library in competition, and then see how citizens really want
to read books, and what books they want to read. (p.300)
However, despite the considerable potential for productivity gains, technology-based disruption
in public services is slow at best. Mansell (2015) attributes this to “the curious nature of the state
sector”:
Whole industries, such as media, retail, music, financial, transport and even the accounting
profession have already or are in the process of being disrupted by big data. Yet, the state
sector monopoly seems largely immune to this outside disruption. New kinds of approaches
to personalised health and education, and applying social learning methods to social
challenges, all have the potential to improve social services. Yet these and more radical
innovations in organisational life have all but bypassed the state sector.
Comparatively, the state sector has not adapted at all. For example, the adaptation
happening in Work and Income on the back of welfare reform, although eye-opening to the
state sector, is merely the application of a customer-centred business model first introduced
and refined 20+ years ago in the private sector. (p.9)
54
Improving state sector productivity
This comparative stability of the state sector is due to many factors, including risk aversion
created by the underlying environment (discussed in Chapter 2), the monopolistic nature of
many public services, the ethical and legal obligations that many state sector organisations
operate under (eg, expectations of universal and equal treatment), and little investment in basic
or strategic research into the design and delivery of public services. These factors mean, by and
large, state sector agencies are unlikely to be consistently at the frontier of technology-driven
disruption.
However, state sector agencies can be “fast followers”: identifying, adapting and adopting
proven technologies from the private sector or overseas state sectors to improve service
delivery. Many of the recommendations outlined in this report – including clearer and higher
expectations from ministers, better use of data and linking of existing datasets, higher quality
commissioning and policy practice, and stronger rewards for performance – are designed to
promote this change.
As Dunleavy (2015) noted, many productivity gains lie in:
thinking about restructuring services, really studying our services, really understanding
them, really seizing control of them, really trying to change them and deliver public value as
cheaply and as effectively as we can – including making major investments. (p.35)
3.7
Conclusion
Achieving greater state sector productivity will require sustained focus by many parties, but it
need not require major legislative change. Indeed, reforming existing institutions may have little
impact on productivity if the organisational culture and leadership of agencies is not conducive
to innovation, learning and improvement. The current statutory and institutional frameworks
provide the necessary foundations, and current performance management and resource
allocation tools can be modified or extended to give them more impact, and to progressively
shift effort towards more productive delivery of public services.
Achieving sustained productivity gains in public services will require effort by ministers, agency
leaders and central agencies, reflecting their distinct roles in making the state sector work.
Proposed changes include expectation-setting processes that clearly emphasise productivity
improvements, better measurement and use of measures, improvements to policy and
commissioning practices, and stronger incentives in the allocation of resources to seek and attain
higher productivity.
Measuring the productivity of core public services is a developing field, so approaches will
evolve as techniques and data improve. Improving productivity will similarly require changes in
effort and mindsets. Yet these are not reasons to delay getting started. The imperative to do so
is clear.
Findings and recommendations
55
Findings and recommendations
Chapter 1 – Why state sector productivity matters
Findings
F1.1
Raising the productivity of the state sector is one of the most important
contributions a government can make to national productivity and wellbeing.
Higher state sector productivity would generate benefits for individuals and
communities (in the form of better outcomes and more services), and the
government (in the form of less pressure on public finances).
F1.2
Innovation is key to improving state sector productivity. There are
organisational characteristics that make an agency more (or less) likely to
innovate or adopt new ways of working. Political and external environments
also make a difference to whether state sector agencies are encouraged to
innovate to improve productivity.
Chapter 2 – The New Zealand state sector – features & experience
Findings
F2.1
There appears to be little demand for, and little inclination to supply,
productivity-related performance information on core public services.
F2.2
There is some active resistance to the concept of productivity and efficiency,
based either on concerns about the effort required to collect information for
productivity measurement, or concern that a focus on inputs and outputs will
undermine the achievement of positive outcomes for New Zealanders.
F2.3
The New Zealand state sector is intolerant of failure, which has the effect of
stifling innovation.
F2.4
Many agencies lack the systems or cultures necessary for ensuring the quality
of policy advice.
F2.5
Agencies’ approach to commissioning can leave limited room for customer
input into design and delivery; and can be poorly targeted, leading to
ineffective delivery and failure demand. Traditional commissioning
approaches limit the scope for innovation and improved productivity in service
delivery.
56
Improving state sector productivity
F2.6
Overly prescriptive funding models are constraining innovation in public
services. Prescribing how inputs are to be deployed, or setting decision rights
at the wrong level, can also increase the costs of services without leading to
greater effectiveness.
F2.7
Despite built-in processes to encourage efficiency and review, and some
recent improvements to evidentiary and evaluation expectations, the
incentives in the budget system for agencies to seek productivity gains in core
public services are weak.
F2.8
Agencies’ greater use and connection of data, analytic and investment models
in policy development and resource allocation is a positive step forward.
While the use of evidence in policy design and performance assessment is
growing, it is far from universal.
F2.9
The attention paid by agencies to monitoring, review and evaluation of core
public services is generally inadequate. This limits the ability of ministers and
agencies to understand what works, where improvements need to be made,
and how resources should be best allocated.
Chapter 3 – System-level changes for a more productive state sector
Findings
F3.1
Ministers have a role to play in supporting agency efforts to improve
productivity by championing innovation in public service delivery.
F3.2
The ability to quantify and measure is important for improving state sector
performance, but agencies often lack the capacity, capability and inclination
to measure productivity.
F3.3
There is a place for well-designed quantitative productivity measures in public
sector performance systems. The main benefits of including such measures is
to ensure that a balanced picture of performance is obtained, and to send
stronger signals about the relative importance of productivity.
Recommendations
The State Services Commission should redesign the annual processes for
R3.1
setting and expressing ministerial expectations and standards to prompt the
identification of opportunities for productivity gains in public services.
Findings and recommendations
57
The Treasury and State Services Commission should establish and support a
R3.2
community of practice to share knowledge, expertise and experience in state
sector productivity measurement.
The State Services Commissioner should convey his expectations to
R3.3
departmental chief executives that they build and sustain the capability to
measure the productivity of public services.
The Treasury should collect and regularly publish information on expenditure
R3.4
on core public services, including (but not limited to) annual per-client or unit
costs for schooling, court trials and imprisonment.
Agency leaders should introduce productivity measures into public sector
R3.5
performance management systems with care. Before making such indicators
formal accountability measures, agency leaders should ensure that:
there has been appropriate consultation and input from stakeholders,
especially those involved in service delivery;
the indicators align well with desired outcomes;
sufficiently robust data sources and collection processes are in place;
leaders and middle managers support the indicators' use and application;
and
there are processes in place to regularly review the indicators, and test they
continue to suit the operating environment.
The Treasury should continue to raise expectations on agencies seeking new
R3.6
funding in annual budget rounds to:
use data, analytics and other investment models to design new initiatives
and demonstrate their benefits; and
provide robust evaluation plans for new initiatives.
As part of future budgets, the Minister of Finance should set aside a distinct
R3.7
portion of the operating allowance dedicated to “high impact initiative”
proposals that have a high probability of making a significant impact on social
wellbeing (eg, as evidenced through robust business cases and returns on
investment), and then progressively increase the share of the budget
allowance devoted to that portion.
The Minister of Finance should restrict access to the “high-impact initiative”
R3.8
portion of future budget operating allowances to those departments that can
credibly demonstrate productivity gains from existing baselines.
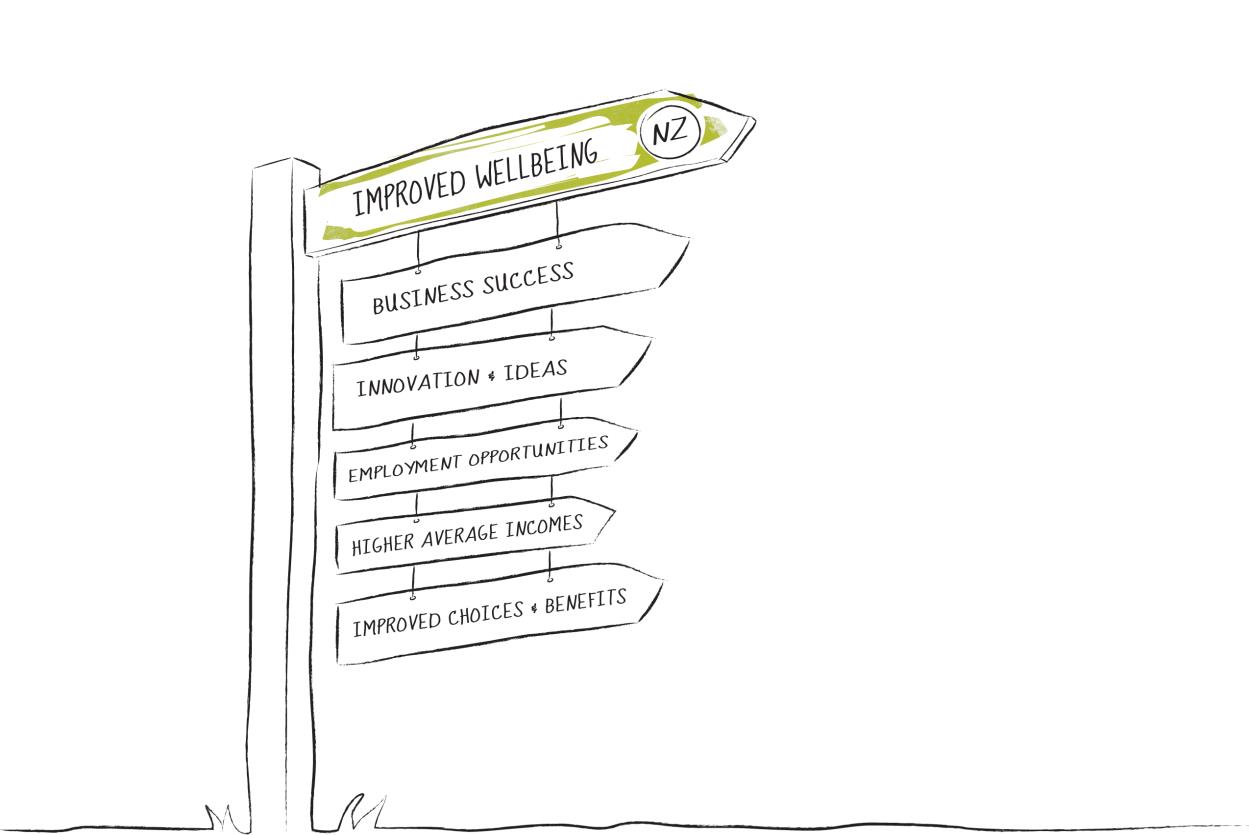
58
Improving state sector productivity
The Minister of Finance should allow non-government organisations to make
R3.9
budget bids directly to the Treasury for the “high-impact initiative” portion of
the operating allowance in specified priority areas or outcomes, without having
to go through the relevant Vote department.
Agencies responsible for the purchase or delivery of core public services
R3.10
should review their funding models, with a view to moving as many models as
possible towards results- and outcome-based systems, or otherwise improving
incentives for productivity improvements.
The State Services Commission should adapt the Performance Improvement
R3.11 Framework’s lead questions and elements to provide clearer signals about –
and test the extent of – cultures, values and staff engagement processes that
support innovation and productivity in service delivery
Appendix A | Public consultation
59
Appendix A Public consultation
Submissions
Individual or Organisation
Submission numbers
Vincent Blackburn
DR26
District Health Boards
17, DR29
Hermann Grobler
5
GovTech World (New Zealand)
DR31
Patricia M Harrison
3
Inland Revenue
7
Bernard Jennings
DR30
Methodist Mission
1
Methodist Mission Southern
DR18
Ministry of Social Development
12, DR21
New Zealand College of Critical Care Nurses
15
New Zealand Council of Trade Unions
9, DR28
New Zealand Kindergartens
10
New Zealand Nurses Organisation
14
NextEra Global
16
OMEP Aotearoa New Zealand
DR24
PEPworldwide NZ Limited
6
Public Service Association
11, DR22
State Services Commission
DR19
Te Puni Kōkiri
DR27
Te Rito Maioha Early Childhood New Zealand
2
The Treasury
DR20
The New Zealand Initiative
8
University of Auckland Dept of Accounting & Finance
DR23
Bruce D White Consulting
13
Waikato Bay of Plenty Chapter OMEP
DR25
Youth Horizons
4
Engagement meetings
Accident Compensation Corporation
Australian Department of Finance
Jon R Blondal, Senior Budget Official of the OECD
Bruce D White Consulting Ltd
Capital and Coast DHB
Canterbury DHB
Central Regional TAS
Debbie Chin
Compass Health Network
Professor Martin Connor, Executive Director, Centre for Health Innovation, Griffith University
Amy Downs, Vice President, Colorado Health Institute, USA
Professor Patrick Dunleavy
60
Improving state sector productivity
Education New Zealand
Education Payroll Limited
Chris Eichbaum
Derek Gill
Dr Ben Gray, Newtown Union Health Centre and Otago School of Medicine
Professor Arthur Grimes, Victoria University of Wellington
Murray Horn
HM Treasury (Jane Cunliffe, Director of Spending)
Justice Sector Deputy Chief Executives Group
Land Information New Zealand
McKinsey Global Institute Council
John Macaskill-Smith, Pinnacle Midlands Health Network
James Mansell
Methodist Mission Southern
Ministry of Education
Ministry of Health
Ministry of Justice
Ministry of Social Development
Ministry for Vulnerable Children, Oranga Tamariki
David Moore and Tom Love, Sapere
Professor Donald Moynihan, Robert M la Follette, School of Public Affairs, University of
Wisconsin
New Zealand Council for Educational Research
New Zealand Council of Trade Unions
New Zealand Customs Service
New Zealand Police
New Zealand Treasury
Ora Toa Community Health Services, Ngāti Toa Rangatira Iwi
The Policy Project, DPMC (Diane Owenga)
The Royal New Zealand College of General Practitioners (Dr Richard Medlicott, Michael Thorn)
Rural Women New Zealand
Social Investment Agency
St John National Headquarters, Lilah Barnett
State Services Commission
Statistics NZ
Roundtables
Official’s workshop on Measuring state sector productivity, Wellington
27 October 2017
The Health Roundtable – NZ Chapter, Wellington
23 November 2017
Conferences and seminars
Empowering Customers & Communities, Wellington
5 July 2017
Dr Richard Meade,
The Economics of Social Services, New Zealand Treasury
17 August 2017
Professor Zoe Radnor,
“Lean” and public sector productivity: panacea or
23 August 2017
paradox?, Reserve Bank of New Zealand
Professor Martin Connor, Executive Director, Centre for Health Innovation,
30 October 2017
Griffith University, Reserve Bank of New Zealand
After 5 Governance in Government
29 May 2018
References
61
References
Australian Productivity Commission (APC) (2018).
Report on government services. Retrieved 26
July 2018 fro
m www.pc.gov.au/research/ongoing/report-on-government-services
Aziz, O., Gemmell, N., & Laws, A. (2013).
The distribution of income and fiscal incidence by age
and gender: some evidence from New Zealand. Wellington: Victoria University of
Wellington.
Banks, G., & McDonald, L. (2012)
Benchmarking and Australia’s report on government services.
Retrieved 20 July 2018 fro
m www.pc.gov.au/research/supporting/benchmarking-federal-
systems/11-benchmarking-federal-systems-chapter9.pdf
Barnsley, J., Lemieux-Charles, L., & McKinney, M. M. (1998). Integrating learning into integrated
delivery systems.
Health care management review,
23(1), 18-28.
Better Public Services Advisory Group. (2011).
Better Public Services Advisory Group report.
Retrieved 26 May 2018 fro
m www.ssc.govt.nz/sites/all/files/bps-report-nov2011_0.pdf
Cabinet Office. (2017).
Cabinet manual 2017. Retrieved 17 June 2018 from
www.dpmc.govt.nz/sites/default/files/2017-06/cabinet-manual-2017.pdf
Committee Appointed by the Government to Review Expenditure on Policy Advice. (2010).
Improving the quality and value of policy advice. Wellington: New Zealand Treasury.
Conway, P. (2016).
Achieving New Zealand’s productivity potential. Wellington: New Zealand
Productivity Commission.
Cullen, D., & Ergas, H. (2014).
Efficiency and productivity in the Australian health care sector.
Paper for the Australian Health Ministers’ Advisory Council, 10 April. Retrieved 26 July 2018
from
www.health.gov.au/internet/main/publishing.nsf/Content/C962FAEB830680A9CA257DCC
007DDB00/$File/15-%20Agenda%20paper%202A%20-
%20Efficiency%20and%20Productivity%20in%20the%20Australian%20Health%20Care%20S
ector%20(D14-2805040).pdf
Cumming, J., & Forbes, S. (2012). Better public services: the case for monitoring and evaluation.
Policy quarterly,
3(8), 49-55.
Damanpour, F. (1991). Organizational innovation: A meta-analysis of effects of determinants and
moderators.
Academy of management journal,
34(3), 555-590.
Damanpour, F. (1992). Organizational size and innovation.
Organization studies,
13(3), 375-402.
Damanpour, F. (1996). Organizational complexity and innovation: developing and testing
multiple contingency models.
Management science,
42(5), 693-716.
62
Improving state sector productivity
De Boer, M., & Ku, B. (2017).
Effectiveness of MSD employment assistance: summary report for
2014/2015 financial year. Wellington: Ministry of Social Development.
Department of Conservation (n.d.) Retrieved 26 May 2018 from
www.doc.govt.nz/nature/native-
animals/birds/birds-a-z/takahe/
Department of Conservation. (2017).
Takahē population 100 breeding pairs strong, press release.
Retrieved 26 May 2018 fro
m www.doc.govt.nz/news/media-releases/2017/takahe-
population-100-breeding-pairs-strong/
Department of Conservation. (2018).
Wild Takahē return to Kahurangi, press release. Retrieved
26 May 2018 from
www.doc.govt.nz/news/media-releases/2018/wild-takahe-return-to-
kahurangi/
Department of Corrections. (2017).
Briefing to the incoming minister. Retrieved 26 May 2018
from
www.corrections.govt.nz/__data/assets/pdf_file/0006/901518/Briefing_to_the_Incoming_M
inister_-_2017.pdf
Downs, A. (2017).
From theory to practice: the promise of primary care in New Zealand. Retrieved
26 July 2018 fro
m www.fulbright.org.nz/wp-content/uploads/2017/09/DOWNS-From-
Theory-to-Practice-The-Promise-of-Primary-Care-in-New-Zealand-.pdf
Dunleavy, P., & Carrera, L. (2013).
Growing the productivity of government services. Cheltenham,
UK: Edward Elgar.
Dunleavy, P. (2015). Public sector productivity: puzzles, conundrums, dilemmas and their
solutions. In J. Wanna, H-A Lee, & S. Yates (Eds.)
Managing under austerity, delivering
under pressure. Canberra, Australia: ANU Press, 25–42.
Ernst & Young. (2017).
Evaluation of the New Zealand Health Care Home, 2010-2016. Hamilton:
Pinnacle Midlands health network.
Ferlie, E., Gabbay, J., Fitzgerald, L., Locock, L., Dopson, S., & Ashburner, L. (2001).
Organisational
behaviour and organisational studies in health care: reflections on the future. Evidence-
based medicine and organisational change: an overview of some recent qualitative
research. Basingstoke: Palgrave.
Fraser, H., & Nolan, P. (2017).
Understanding health sector productivity. Wellington: New
Zealand Productivity Commission.
Fraser, H., Gemmell, N., & Nolan, P. (2018).
Measuring the diffusion of innovation among
hospitals in New Zealand. Presentation at the 59th Annual Conference of the New Zealand
Association of Economists, Auckland University of Technology, 27-29 June.
Gemmell, N., Nolan, P., & Scobie, G. (2017).
Estimating quality-adjusted productivity in tertiary
education: Methods and evidence for New Zealand. Wellington: Victoria University of
Wellington.
Genet, T. (2017).
Productivity measurement case study: Courts. Wellington: NZPC.
References
63
Genet, T., & Hayward, M. (2017). Productivity measurement case study: Police. Wellington:
NZPC.
Green, N. (2017).
Productivity measurement case study: early childhood education. Wellington:
NZPC.
Greenhalgh, T., Robert, G., Bate, P., Macfarlane, F., & Kyriakidou, O. (2008).
Diffusion of
innovations in health service organisations: a systematic literature review. John Wiley &
Sons.
Grzelewski, D. (2012). Great experimentations,
New Zealand geographic magazine. Retrieved 26
April 2018 from
www.nzgeo.com/stories/great-experimentations/
Grzelewski, D. (2018).
Takehe, the bird that came back from the dead, New Zealand Geographic
Magazine. Retrieved 26 July 2018 from
www.nzgeo.com/stories/takahe-the-bird-that-came-
back-from-the-dead/
Kimberly, J. R., & Evanisko, M. J. (1981). Organizational innovation: The influence of individual,
organizational, and contextual factors on hospital adoption of technological and
administrative innovations.
Academy of management journal,
24(4), 689-713.
Kirk, S. (2017).
New government puts social investment approach for vulnerable Kiwis under
review. 8 November, Stuff. Retrieved 13 March 2018 from:
www.stuff.co.nz/national/politics/98623631/new-government-puts-social-investment-
approach-for-vulnerable-kiwis-under-review
Knopf, E. (2017).
History of efficiency measurement by the New Zealand health sector post 2000.
Wellington: New Zealand Productivity Commission.
Mansell, J. (2015).
Handing back the social commons. Retrieved 26 July 2018 from
www.productivity.govt.nz/sites/default/files/social-services-draft-james-mansell.pdf
Meyer, A. D., & Goes, J. B. (1988). Organizational assimilation of innovations: A multilevel
contextual analysis.
Academy of management journal,
31(4), 897-923.
Middleton, L., Dunn, P., O’Loughlin, C., & Cumming, J. (forthcoming).
Taking stock: primary care
innovation. Wellington: NZPC.
Ministry of Business, Innovation and Employment (MBIE). (2017).
Regulatory capability (G-Reg
initiative). Retrieved 26 July 2018 fro
m http://www.mbie.govt.nz/about/our-work/roles-and-
responsibilities/regulatory-systems-programme/cross-cutting-issues/regulatory-capability-
g-reg-initiative
Ministry of Health. (2017)
Transforming respite: disability support services respite strategy 2017
to 2022. Retrieved 12 July 2018 from
www.health.govt.nz/system/files/documents/publications/transforming-respite-dss-respite-
strategy-2017-2022_0.pdf
Moore, S., & Hayward, M. (2017).
Productivity measurement case study: Ministry of Social
Development. Wellington: NZPC.
64
Improving state sector productivity
New Zealand Customs Service (2017).
eGate. Retrieved 26 July 2018 from
www.customs.govt.nz/personal/travel-to-and-from-nz/travelling-to-nz/egate/
New Zealand Productivity Commission (NZPC). (2014).
Regulatory institutions and practices.
Retrieved 1 July 2018 fro
m www.productivity.govt.nz/sites/default/files/regulatory-
institutions-and-practices-final-report.pdf
NZPC (2015).
More effective social services. Retrieved 3 June 2018 from
www.productivity.govt.nz/sites/default/files/social-services-final-report-main.pdf
NZPC (2017).
New models of tertiary education. Retrieved 24 June 2018 from
www.productivity.govt.nz/sites/default/files/New%20models%20of%20tertiary%20educatio
n%20FINAL.pdf
New Zealand Treasury. (2009).
Challenges and choices: New Zealand’s long-term fiscal
statement. Wellington: author.
New Zealand Treasury. (2011).
Putting it together: an explanatory guide to New Zealand’s state
sector financial management system. Wellington: author
New Zealand Treasury. (2016).
He tirohanga mokopuna: 2016 statement on New Zealand’s long-
term fiscal position. Wellington: author.
Norman, R. (2003).
Obedient servants? Management freedoms and accountabilities in the New
Zealand public sector. Wellington: Victoria University Press.
Nystrom, P. C., Ramamurthy, K., & Wilson, A. L. (2002). Organizational context, climate and
innovativeness: adoption of imaging technology.
Journal of engineering and technology
management, 19(3-4), 221-247.
Office of the Controller and Auditor General (OAG). (2017a).
Medium-term planning in
government departments. Wellington: Author.
OAG. (2017b).
Investing in tertiary education assets. Wellington: Author.
OECD. (2011)
Together for better public services: Partnering with citizens and civil society, Public
Governance Reviews.
OECD. (2014).
Innovating the Public Sector: From ideas to impact. Retrieved 20 November 2017
fro
m www.oecd.org/innovating-the-public-sector/Background-report.pdf
OECD. (2017).
Embracing innovation in government: global trends. Retrieved 20 November 2017
fro
m www.oecd.org/gov/innovative-government/embracing-innovation-in-government.pdf
OECD (2018).
Putting faces to the jobs at risk of automation. Retrieved from 3 April 2018 from
www.oecd.org/employment/Automation-policy-brief-2018.pdf
Office of the Minister of State Services. (2018).
Capping of core government administration.
Retrieved 26 July 2018 from
www.ssc.govt.nz/sites/all/files/future-of-capping-core-govt-
admin.pdf
References
65
Pickens, D. (2017).
Efficiency and performance in the New Zealand state sector: reflections of
senior state sector leaders. Wellington: NZPC.
Plimmer, G., Cantal, C., & Qumseya, T. (2017).
Staff perceptions of performance and
effectiveness in the New Zealand State Sector: Further analysis of the 2016 Public Service
Association survey on workplace dynamics. Wellington, New Zealand: New Zealand
Productivity Commission.
Policy Project (n.d).
Policy quality framework: a framework and tools for assessing and assuring
the quality of policy outputs – development, insights and guidance. Retrieved 26 July 2018
from
www.dpmc.govt.nz/sites/default/files/2017-05/policy-quality-framework-
development-insights-and-applications.pdf
Policy Project (2015).
The Policy Project – responsive today, shaping tomorrow: narrative and
direction of travel. Retrieved 26 July 2018 fro
m www.dpmc.govt.nz/sites/default/files/2017-
03/policyproject-narrative-feb2015.pdf
Policy Project (2017).
Pathways to quality: insights on agency policy quality assurance systems
and transition to the Policy Quality Framework. Retrieved 26 July 2018 from
www.dpmc.govt.nz/sites/default/files/2017-06/pathways_to_quality_pqf.pdf
Prime Minister’s Chief Science Advisor. (2018).
Using evidence to build a better justice system.
Retrieved 26 July 2018 fro
m www.pmcsa.org.nz/wp-content/uploads/Using-evidence-to-
build-a-better-justice-system.pdf
Robertson, G. (2018a).
Speech to the Waikato Business Summit (8 February). Retrieved 26 June
2018 from
www.beehive.govt.nz/speech/speech-waikato-business-summit
Robertson, G. (2018b).
Speech to the Productivity Hub on the future of work: adaptability,
resilience, and inclusion. (13 February). Retrieved 26 July 2018 from
www.beehive.govt.nz/speech/speech-productivity-hub-future-work-adaptability-resilience-
and-inclusion
Robertson, G. (2018c).
Fiscal strategy report. Retrieved 26 July 2018 from
https://treasury.govt.nz/sites/default/files/2018-05/b18-fsr.pdf
Schein, E. H. (2010).
Organizational culture and leadership (Vol. 2). John Wiley & Sons.
Social Investment Agency. (2018).
Commissioning and Partnering. Retrieved 26 July 2018 from
https://sia.govt.nz/assets/Documents/Fact-sheet-SIA-Commissioning-and-Partnerships-
Logo-updated-May-2018.pdf
Social Investment Working Group (2016).
Governance and accountability in social investment –
report by a working group to respond to and build on the proposals from Matt Burgess
and Denise Cosgrove. Retrieved 26 July 2018 from
https://treasury.govt.nz/sites/default/files/2017-07/si-governance-accountability-report.pdf
Soligo, J. (2018).
Promoting the utilisation of productivity measures. Wellington: NZPC.
State Services Commission (SSC) (1999).
Looping the loop – evaluating outcomes and other risky
feats. Wellington: author.
66
Improving state sector productivity
SSC. (2012).
Performance improvement framework: formal review of the New Zealand Customs
Service. Wellington: author.
SSC. (2013).
Core guide 3: getting to great; leading reviewer insights from the Performance
Improvement Framework. Wellington: author.
SSC. (2014).
Reference for preparation of governance manuals – guidance for statutory crown
entities: crown agents, autonomous crown entities, independent crown entities (excluding
district health boards and corporations sole). Retrieved 26 July 2018 from
www.ssc.govt.nz/sites/all/files/Guidance-Statutory-Crown-Entities-Governance-Manuals-
March2014_0.pdf
SSC (2015).
Core guide 1: What is the Performance Improvement Framework? Wellington: author
SSC / Treasury (2017).
2018 Four year plan guide. Retrieved 26 July 2018 from
https://www.ssc.govt.nz/sites/all/files/Four%20Year%20Plan%20Guide%20-%202018.pdf
Tenbensel, T. (2009). National health targets revised.
Health policy monitor, October, (14)
Te Puni Kōkiri. (2017).
Better Public Services Results for Māori. Retrieved 26 July 2018 from
www.tpk.govt.nz/en/a-matou-mohiotanga/crownmaori-relations/better-public-services-
results-for-maori
Tobias, M., & Yeh, L. C. (2009). How much does health care contribute to health gain and to
health inequality? Trends in amenable mortality in New Zealand 1981–2004.
Australian and
New Zealand Journal of Public Health, 33(1), 70-78.
Tornatzky, L. G., & Klein, K. J. (1982). Innovation characteristics and innovation adoption-
implementation: A meta-analysis of findings.
IEEE Transactions on engineering
management,
1(1), 28-45.
Toy-Cronin, B., Irvine, B., Stewart, K., & Henaghan, M. (2017).
The wheels of justice:
Understanding the pace of civil High Court cases. Retrieved 27 June 2018 from
http://hdl.handle.net/10523/7762
Tyson, J. (2014).
Arriving at SmartGate: the automated passenger project (ANZSOG case study).
Retrieved 26 July 2018 from
www.anzsog.edu.au/resource-library/case-library/arriving-at-
smartgate-the-automated-passenger-processing-project-b-2014-163-2
Van Dooren, W. (2005). What makes organisations measure? Hypotheses on the causes and
conditions for performance measurement.
Financial accountability & management, 21(3),
363-383.
Victoria University School of Government (2017a).
Independent review of the Performance
Improvement Framework: Wellington: author.
Victoria University School of Government (2017b).
Independent review of the Performance
Improvement Framework: Overview and key messages. Wellington: author.
Wickes, C., Crouchley, D., & Maxwell, J. (2009).
Takahē (porphyrio hochstetteri) 2007-2012
Threatened species recovery plan. Retrieved 26 July 2018 from
https://www.doc.govt.nz/Documents/science-and-technical/tsrp61entire.pdf
Terms of reference
67
Terms of reference
Issued by the Minister of Finance (the “referring Minister”). Pursuant to sections 9 and 11 of the New
Zealand Productivity Commission Act 2010, I hereby request that the New Zealand Productivity
Commission (“the Commission”) undertake an inquiry into how the New Zealand State sector can
effectively measure and improve productivity in core public services, with a particular focus on health,
education, justice and social support.
Context
Improving the productivity of the state sector, the value we are realising from our resources, helps
improve the prosperity of the country, and allows for better outcomes to be achieved from scarce tax
payer resource.
Recent progress has been made in improving value across the different dimensions of value for
money performance. The Better Public Services Results determine priority areas for improvement.
Social Investment and other effectiveness work is getting better at identifying where to invest and
tracking what the impact of investment is.
A third dimension of performance is efficiency/productivity. For many of the core public services that
constitute a large proportion of existing expenditure, there are still opportunities to better
understand efficiency and how to optimise inputs/resources in delivering quality products and
services. Current gaps in good measures of productivity limit assurance Ministers have on
performance and innovation of current delivery models, and Chief Executives ability to understand
and improve their business. It also suggests an opportunity to achieve more from current resources,
and better engage the State sector workforces on opportunities to do things better.
Public services are often complex covering a range of services, clients, and different mechanisms to
achieve a range of desired outcomes. This can make it more difficult than private sector industries to
capture performance, and to take actions to improve it. Internationally, there are few common
productivity measures that capture quality dimensions in key sectors like education and health. But,
there are lessons on how to better understand dimensions like quality in inputs and outputs, leverage
innovation and economies of scale, and improve productivity and efficiency in the public sector.
Scope
The Productivity Commission (the Commission) is to consider New Zealand and international public
and private sector best practice in understanding and improving productivity. This should focus on
the narrower definition of productivity as how efficiently inputs/resources are being utilised to
generate quality outputs/services.
The Commission should take account of broader definitions of performance and productivity, in
considering how to capture elements like quality, and how efficiency measures can complement
dimensions like effectiveness. However, the Commission should not focus advice on the contribution
of services to longer-term outcomes, prioritisation of interventions, or other performance dimensions
already being developed through social investment or other work programmes.
68
Improving state sector productivity
The inquiry should focus on developing practical guidance and recommendations that consider
perspectives and roles of different state sector decision-makers such as Ministers, Chief Executives,
and managers, and how these different needs can be balanced.
The inquiry is to focus on guidance that is relevant to decision-makers across the “core” services in
the health, education, justice and social development sectors, such as: teaching, hospitals and
primary healthcare, policing, courts, corrections, and work and income services.
Having regard to the above, the Commission should undertake an inquiry that considers and provides
advice on:
a)
How to measure efficiency/productivity in each of the identified core public service sectors:
health, education, justice, social support. This should focus on meso (sector) and micro
(function or service) level measures. Guidance should consider key measurement and accuracy
issues, and how imperfect measures are most appropriately and usefully employed.
b)
The appropriate role of identified efficiency/productivity measures in public sector
performance frameworks, with the goal of improving assurance to Ministers and incentives on
agencies for improvement. This should draw on theory and evidence of incentive and
disincentive effects of measurement and other performance approaches on different
workforces.
c)
Developing the capability, culture and systems that can support agencies to better measure,
understand and improve productivity.
The Commission should prioritise its effort by using its judgement as to the degree of depth and
sophistication of analysis it applies to satisfy each part of the Terms of Reference; and to the degree
of depth in each specific sector, while providing advice on best measures in the identified sectors.
Exclusions
The Commission should not carry out in depth analysis or provide detailed recommendations on
specific policies relating to service access or provision in sectors.
The Commission should not duplicate work on issues like where to invest, or service effectiveness,
being developed as part of the social investment approach.
Consultation requirements
In undertaking this inquiry the Commission should consult with key interest groups and affected
parties relevant to the identified sectors and particular services where efficiency measures are
identified. Consultation should include public sector agencies, those in receipt of public services, and
private sector agents who may have relevant insights.
Timeframe
The Commission must publish a draft report and/or discussion document, for public comment,
followed by a final report that must be presented to the Minister of Finance as Referring Minister by
30 August 2018.
HON STEVEN JOYCE, MINISTER OF FINANCE