
Greater Wellington Regional Council
Wellington City Bus Review
Appendix B
Boardings by Time of Day and Day of Week by Route: Go Wellington
Wellington City Bus Review FINAL
24 November 2011
 Average Boardings per Route per Hour
ROUTE 01
ROUTE 02
ROUTE 03
M
Tu
W
Th
F
Sa
Su
M
Tu
W
Th
F
Sa
Su
M
Tu
W
Th
F
Su
Su
0500 - 0600
Average Boardings per Route per Hour
ROUTE 01
ROUTE 02
ROUTE 03
M
Tu
W
Th
F
Sa
Su
M
Tu
W
Th
F
Sa
Su
M
Tu
W
Th
F
Su
Su
0500 - 0600
32.7
42.4
41.4
41.0
42.0
0.0
0.0
0500 - 0600
28.7
31.4
30.0
31.3
28.0
0.0
0.0
0500 - 0600
18.6
47.0
24.3
21.6
33.9
15.0
3.4
0600 - 0700
169.0
223.3
219.9
198.7
218.7
30.0
11.9
0600 - 0700
192.0
195.3
206.7
195.6
190.6
30.7
0.0
0600 - 0700
331.7
330.0
358.0
414.1
323.1
51.1
45.1
0700 - 0800
370.6
386.9
406.9
365.4
354.3
90.4
81.1
0700 - 0800
522.7
578.0
533.6
506.0
487.7
99.4
30.7
0700 - 0800
993.7 1051.9 1059.3 1087.3 1035.4 107.7
67.6
0800 - 0900
443.3
500.4
505.0
484.4
505.1
150.4
88.0
0800 - 0900
316.0
273.1
348.7
339.6
331.4
126.9
88.3
0800 - 0900
737.3
814.4
856.6
755.9
864.6
197.1
127.7
0900 - 1000
298.3
337.4
318.4
320.4
310.4
213.1
82.9
0900 - 1000
250.4
306.1
333.6
279.0
311.3
195.6
146.9
0900 - 1000
378.6
402.0
377.7
458.3
387.7
363.0
233.6
1000 - 1100
230.6
261.6
288.0
260.6
278.7
223.3
123.3
1000 - 1100
198.6
194.4
195.7
214.4
196.7
243.1
139.7
1000 - 1100
361.0
380.4
378.9
370.9
361.7
347.9
284.7
1100 - 1200
269.6
287.6
302.9
311.4
319.1
245.4
140.0
1100 - 1200
204.4
215.9
259.9
235.7
231.1
237.9
178.6
1100 - 1200
338.7
344.4
383.7
373.3
393.3
353.7
330.4
1200 - 1300
282.0
302.6
295.1
305.6
319.0
291.7
207.9
1200 - 1300
224.0
277.1
271.6
320.9
316.4
252.4
176.1
1200 - 1300
421.7
467.6
493.4
490.7
472.9
430.4
331.9
1300 - 1400
303.9
322.4
316.7
377.0
367.4
310.7
192.9
1300 - 1400
267.0
253.9
264.0
277.3
287.6
292.7
165.4
1300 - 1400
417.0
480.6
470.4
452.4
458.3
467.3
321.7
1400 - 1500
346.9
402.4
356.4
349.3
385.0
301.6
232.1
1400 - 1500
271.0
277.7
253.0
301.3
318.9
237.4
168.4
1400 - 1500
543.4
650.4
552.3
640.1
574.7
378.9
317.0
1500 - 1600
385.7
376.4
409.7
412.1
428.1
245.6
211.1
1500 - 1600
304.4
368.0
415.3
342.4
412.1
304.4
179.7
1500 - 1600
665.3
757.4
754.7
719.4
750.3
363.1
323.3
1600 - 1700
450.4
567.1
538.4
540.9
509.3
234.9
170.3
1600 - 1700
414.3
392.3
365.3
406.3
348.0
293.0
185.1
1600 - 1700
993.1
943.6 1045.9 1022.3 934.7
502.7
314.9
1700 - 1800
422.6
424.1
409.0
396.4
426.7
241.1
128.1
1700 - 1800
343.9
341.1
358.6
365.0
308.9
190.1
106.3
1700 - 1800
793.0
878.9
850.6
848.0
798.3
393.4
200.1
1800 - 1900
271.0
321.1
270.7
309.0
319.0
177.3
88.0
1800 - 1900
224.7
263.3
266.3
280.3
300.3
152.0
40.0
1800 - 1900
357.3
380.9
408.3
408.4
455.4
273.6
203.4
1900 - 2000
158.3
172.9
219.3
206.0
243.3
138.6
70.0
1900 - 2000
124.6
157.3
162.3
154.7
178.1
141.6
58.3
1900 - 2000
200.1
238.0
239.1
286.7
319.1
199.3
101.7
2000 - 2100
96.4
135.4
135.3
132.7
178.0
94.7
63.6
2000 - 2100
94.4
96.0
114.6
125.1
138.3
104.7
24.4
2000 - 2100
158.7
180.6
204.7
197.3
219.7
137.6
57.9
2100 - 2200
68.9
65.1
80.6
100.1
116.1
80.1
48.6
2100 - 2200
38.9
52.6
68.4
71.0
95.1
84.4
28.9
2100 - 2200
102.6
126.7
143.4
156.9
212.0
203.4
61.3
2200 - 2300
33.3
40.1
58.9
52.7
76.6
84.1
21.0
2200 - 2300
30.9
27.6
40.9
40.6
59.4
68.1
12.7
2200 - 2300
58.6
86.3
102.4
105.9
192.7
129.9
38.6
2300 - 2400
12.6
12.7
17.6
21.9
74.4
24.9
0.7
2300 - 2400
8.1
14.1
19.9
24.6
27.9
46.0
0.0
2300 - 2400
9.1
11.3
17.4
14.7
49.9
91.6
7.1
2400 - 0100
0.0
0.0
0.0
0.0
4.0
0.4
0.0
2400 - 0100
0.0
0.0
0.0
0.0
0.0
0.3
0.0
2400 - 0100
0.0
0.0
0.0
0.0
10.9
0.0
0.0
1200
1200
1200
1000
000
1000
1000
800
800
800
600
600
600
400
400
400
200
200
200
0
0
0
0600
0700
0800
0900
1000
1100
1200
1300
1400
1500
1600
1700
1800
1900
2000
2100
2200
2300
2400
0100
0600
0700
0800
0900
1000
1100
1200
1300
1400
1500
1600
1700
1800
1900
2000
2100
2200
2300
2400
0100
0600
0700
0800
0900
1000
1100
1200
1300
1400
1500
1600
1700
1800
1900
2000
2100
2200
2300
2400
0100
‐
‐
‐
‐
‐
‐
‐
‐
‐
‐
‐
‐
‐
‐
‐
‐
‐
‐
‐
‐
‐
‐
‐
‐
‐
‐
‐
‐
‐
‐
‐
‐
‐
‐
‐
‐
‐
‐
‐
‐
‐
‐
‐
‐
‐
‐
‐
‐
‐
‐
‐
‐
‐
‐
‐
‐
‐
‐
‐
‐
0500
0600
0700
0800
0900
1000
1100
1200
1300
1400
1500
1600
1700
1800
1900
2000
2100
2200
2300
2400
0500
0600
0700
0800
0900
1000
1100
1200
1300
1400
1500
1600
1700
1800
1900
2000
2100
2200
2300
2400
0500
0600
0700
0800
0900
1000
1100
1200
1300
1400
1500
1600
1700
1800
1900
2000
2100
2200
2300
2400
Wellington City Bus Review
 Average Boardings per Route per Hour
ROUTE 04
ROUTE 05
ROUTE 06
M
Tu
W
Th
F
Sa
Su
M
Tu
W
Th
F
Sa
Su
M
Tu
W
Th
F
Su
Su
0500 - 0600
Average Boardings per Route per Hour
ROUTE 04
ROUTE 05
ROUTE 06
M
Tu
W
Th
F
Sa
Su
M
Tu
W
Th
F
Sa
Su
M
Tu
W
Th
F
Su
Su
0500 - 0600
0.0
0.0
0.0
0.0
0.0
0500 - 0600
2.0
0.0
0.0
0.0
0.0
0500 - 0600
0.0
0.0
0.0
0.0
0.0
0600 - 0700
59.0
68.6
48.0
56.7
57.3
0600 - 0700
20.3
25.9
19.7
22.3
19.9
0600 - 0700
44.9
47.6
56.6
50.6
54.6
0700 - 0800
340.9
337.6
342.7
341.4
327.1
0700 - 0800
269.4
299.7
290.7
297.4
286.9
0700 - 0800
141.3
146.6
126.4
131.1
125.7
0800 - 0900
101.6
101.0
115.4
122.7
119.9
0800 - 0900
233.9
277.1
286.3
260.1
260.7
0800 - 0900
66.0
57.7
51.3
48.7
56.4
0900 - 1000
0.0
0.0
0.0
5.9
0.0
0900 - 1000
4.4
4.7
0.0
5.7
6.7
0900 - 1000
0.0
0.0
0.0
0.0
0.0
1000 - 1100
0.0
0.0
0.0
0.0
0.0
1000 - 1100
0.0
0.0
0.0
0.0
0.0
1000 - 1100
0.0
0.0
0.0
0.0
0.0
1100 - 1200
0.0
0.0
0.0
0.0
0.0
1100 - 1200
0.0
0.0
0.0
0.0
0.0
1100 - 1200
0.0
0.0
0.0
0.0
0.0
1200 - 1300
1.9
0.0
0.0
0.0
0.0
1200 - 1300
0.0
0.0
0.0
0.0
0.0
1200 - 1300
0.0
0.0
0.0
0.0
0.0
1300 - 1400
0.0
0.0
0.0
0.0
0.0
1300 - 1400
0.0
0.0
0.0
0.0
0.0
1300 - 1400
0.0
0.0
0.0
0.0
0.0
1400 - 1500
33.7
48.3
34.7
21.7
26.7
1400 - 1500
31.3
31.3
37.9
39.1
37.1
1400 - 1500
0.0
0.0
0.0
0.0
0.0
1500 - 1600
60.9
44.0
52.4
72.4
61.0
1500 - 1600
158.9
137.6
167.3
150.4
174.6
1500 - 1600
44.4
32.4
60.6
40.9
35.9
1600 - 1700
177.4
167.9
193.1
162.3
145.9
1600 - 1700
115.6
127.7
113.9
122.4
103.1
1600 - 1700
185.3
196.4
127.9
167.7
125.4
1700 - 1800
88.7
101.3
103.9
97.9
102.6
1700 - 1800
85.3
100.0
110.1
125.3
124.9
1700 - 1800
110.7
117.6
148.9
140.1
123.9
1800 - 1900
49.9
51.1
39.7
59.1
43.6
1800 - 1900
30.7
24.4
29.9
19.4
20.4
1800 - 1900
0.0
0.0
1.9
0.0
0.0
1900 - 2000
0.0
0.0
0.0
0.0
0.0
1900 - 2000
0.0
0.0
0.0
0.0
0.0
1900 - 2000
0.0
0.0
0.0
0.0
0.0
2000 - 2100
0.0
7.0
0.0
0.0
0.0
2000 - 2100
0.0
0.0
0.0
0.0
0.0
2000 - 2100
0.0
0.0
0.0
0.0
0.0
2100 - 2200
0.0
0.0
0.0
0.0
0.0
2100 - 2200
0.0
0.0
0.0
0.0
0.0
2100 - 2200
0.0
0.0
3.6
0.0
0.0
2200 - 2300
0.0
0.0
0.0
0.0
0.0
2200 - 2300
0.0
0.0
0.0
0.0
0.0
2200 - 2300
0.0
0.0
0.0
0.0
0.0
2300 - 2400
0.0
0.0
0.0
0.0
0.0
2300 - 2400
0.0
0.0
0.0
0.0
0.0
2300 - 2400
0.0
0.0
0.0
0.0
0.0
2400 - 0100
0.0
0.0
0.0
0.0
0.0
2400 - 0100
0.0
0.0
0.0
0.0
0.0
2400 - 0100
0.0
0.0
0.0
0.0
0.0
1200
1200
1200
1000
000
1000
1000
800
800
800
600
600
600
400
400
400
200
200
200
0
0
0
0600
0700
0800
0900
1000
1100
1200
1300
1400
1500
1600
1700
1800
1900
2000
2100
2200
2300
2400
0100
0600
0700
0800
0900
1000
1100
1200
1300
1400
1500
1600
1700
1800
1900
2000
2100
2200
2300
2400
0100
0600
0700
0800
0900
1000
1100
1200
1300
1400
1500
1600
1700
1800
1900
2000
2100
2200
2300
2400
0100
‐
‐
‐
‐
‐
‐
‐
‐
‐
‐
‐
‐
‐
‐
‐
‐
‐
‐
‐
‐
‐
‐
‐
‐
‐
‐
‐
‐
‐
‐
‐
‐
‐
‐
‐
‐
‐
‐
‐
‐
‐
‐
‐
‐
‐
‐
‐
‐
‐
‐
‐
‐
‐
‐
‐
‐
‐
‐
‐
‐
0500
0600
0700
0800
0900
1000
1100
1200
1300
1400
1500
1600
1700
1800
1900
2000
2100
2200
2300
2400
0500
0600
0700
0800
0900
1000
1100
1200
1300
1400
1500
1600
1700
1800
1900
2000
2100
2200
2300
2400
0500
0600
0700
0800
0900
1000
1100
1200
1300
1400
1500
1600
1700
1800
1900
2000
2100
2200
2300
2400
Wellington City Bus Review
 Average Boardings per Route per Hour
ROUTE 07
ROUTE 08
ROUTE 09
M
Tu
W
Th
F
Sa
Su
M
Tu
W
Th
F
Sa
Su
M
Tu
W
Th
F
Su
Su
0500 - 0600
Average Boardings per Route per Hour
ROUTE 07
ROUTE 08
ROUTE 09
M
Tu
W
Th
F
Sa
Su
M
Tu
W
Th
F
Sa
Su
M
Tu
W
Th
F
Su
Su
0500 - 0600
0.0
0.0
0.0
0.0
0.0
0.0
0.0
0500 - 0600
0.0
0.0
0.0
0.0
0.0
0500 - 0600
0.0
1.1
0.0
4.6
2.4
0600 - 0700
60.7
64.0
65.3
69.6
59.0
1.3
0.0
0600 - 0700
75.7
69.3
88.6
101.9
89.1
0600 - 0700
20.1
16.7
22.1
10.9
13.0
0700 - 0800
315.9
336.6
327.1
336.7
335.3
17.3
5.0
0700 - 0800
108.7
116.4
116.7
86.9
99.0
0700 - 0800
82.7
96.6
85.7
97.6
86.0
0800 - 0900
285.0
294.4
274.7
282.4
283.1
54.4
21.3
0800 - 0900
98.3
96.0
105.9
97.6
90.4
0800 - 0900
83.4
97.6
104.6
94.0
89.9
0900 - 1000
100.1
105.6
100.6
100.6
105.1
62.7
66.9
0900 - 1000
18.4
28.6
27.6
27.1
35.9
0900 - 1000
34.6
27.6
32.4
38.1
38.9
1000 - 1100
90.7
102.3
96.4
102.3
94.9
78.1
65.3
1000 - 1100
28.1
23.7
24.9
25.3
23.7
1000 - 1100
18.3
22.4
17.4
22.3
20.3
1100 - 1200
110.3
108.3
119.1
116.0
108.0
100.6
69.7
1100 - 1200
43.3
40.9
44.7
39.9
43.3
1100 - 1200
24.3
24.1
18.9
17.4
32.7
1200 - 1300
105.3
111.6
120.7
106.7
132.0
100.9
80.1
1200 - 1300
13.3
12.3
13.7
11.4
14.6
1200 - 1300
26.4
23.7
29.3
27.7
25.7
1300 - 1400
116.1
114.3
110.3
114.7
120.6
116.3
83.6
1300 - 1400
24.6
36.3
28.9
35.6
36.7
1300 - 1400
22.0
24.0
29.7
30.4
28.9
1400 - 1500
110.6
131.9
123.1
117.1
115.7
124.7
87.6
1400 - 1500
65.9
74.4
85.1
73.0
66.1
1400 - 1500
21.3
28.9
25.4
31.0
33.0
1500 - 1600
140.1
151.4
136.0
145.3
135.9
131.6
97.1
1500 - 1600
130.7
90.4
98.1
112.7
98.4
1500 - 1600
31.1
34.4
36.1
34.4
34.7
1600 - 1700
299.3
326.9
308.9
294.6
292.9
121.9
64.7
1600 - 1700
117.3
132.3
127.6
135.3
120.0
1600 - 1700
80.0
88.1
74.4
88.3
69.4
1700 - 1800
303.7
275.6
268.1
279.6
255.1
117.4
72.6
1700 - 1800
155.1
147.9
144.1
139.7
129.4
1700 - 1800
49.1
53.6
50.0
45.6
36.1
1800 - 1900
147.0
161.4
156.6
156.6
158.3
97.4
29.6
1800 - 1900
53.9
60.3
77.1
57.6
51.9
1800 - 1900
5.3
17.4
16.3
9.4
12.3
1900 - 2000
90.1
97.3
109.1
112.7
136.0
43.0
27.4
1900 - 2000
11.6
9.4
15.9
10.0
16.4
1900 - 2000
0.0
0.0
0.0
0.0
0.0
2000 - 2100
48.7
61.9
62.6
74.4
66.4
31.0
14.7
2000 - 2100
8.7
12.1
4.7
8.9
11.0
2000 - 2100
0.0
0.0
0.0
0.0
0.0
2100 - 2200
37.1
44.4
52.1
53.4
75.7
32.0
18.4
2100 - 2200
0.0
0.0
0.0
0.0
0.0
2100 - 2200
0.0
0.0
0.0
0.0
0.0
2200 - 2300
21.4
27.6
36.7
34.7
45.0
36.4
12.1
2200 - 2300
0.0
0.0
0.0
0.0
0.0
2200 - 2300
0.0
0.0
0.0
0.0
0.0
2300 - 2400
4.4
5.7
7.6
4.6
12.3
10.1
1.0
2300 - 2400
0.0
0.0
0.0
0.0
0.0
2300 - 2400
0.0
0.0
0.0
0.0
0.0
2400 - 0100
0.0
0.0
0.0
0.0
0.0
0.0
0.0
2400 - 0100
0.0
0.0
0.0
0.0
0.0
2400 - 0100
0.0
0.0
0.0
0.0
0.0
1200
1200
1200
1000
000
1000
1000
800
800
800
600
600
600
400
400
400
200
200
200
0
0
0
0600
0700
0800
0900
1000
1100
1200
1300
1400
1500
1600
1700
1800
1900
2000
2100
2200
2300
2400
0100
0600
0700
0800
0900
1000
1100
1200
1300
1400
1500
1600
1700
1800
1900
2000
2100
2200
2300
2400
0100
0600
0700
0800
0900
1000
1100
1200
1300
1400
1500
1600
1700
1800
1900
2000
2100
2200
2300
2400
0100
‐
‐
‐
‐
‐
‐
‐
‐
‐
‐
‐
‐
‐
‐
‐
‐
‐
‐
‐
‐
‐
‐
‐
‐
‐
‐
‐
‐
‐
‐
‐
‐
‐
‐
‐
‐
‐
‐
‐
‐
‐
‐
‐
‐
‐
‐
‐
‐
‐
‐
‐
‐
‐
‐
‐
‐
‐
‐
‐
‐
0500
0600
0700
0800
0900
1000
1100
1200
1300
1400
1500
1600
1700
1800
1900
2000
2100
2200
2300
2400
0500
0600
0700
0800
0900
1000
1100
1200
1300
1400
1500
1600
1700
1800
1900
2000
2100
2200
2300
2400
0500
0600
0700
0800
0900
1000
1100
1200
1300
1400
1500
1600
1700
1800
1900
2000
2100
2200
2300
2400
Wellington City Bus Review
 Average Boardings per Route per Hour
ROUTE 10
ROUTE 11
ROUTE 13
M
Tu
W
Th
F
Sa
Su
M
Tu
W
Th
F
Sa
Su
M
Tu
W
Th
F
Su
Su
0500 - 0600
Average Boardings per Route per Hour
ROUTE 10
ROUTE 11
ROUTE 13
M
Tu
W
Th
F
Sa
Su
M
Tu
W
Th
F
Sa
Su
M
Tu
W
Th
F
Su
Su
0500 - 0600
0.0
0.0
0.0
0.1
0.0
0500 - 0600
40.1
49.7
35.0
48.9
52.4
6.7
0.0
0500 - 0600
21.7
21.9
23.4
22.1
18.0
0600 - 0700
70.4
62.1
79.7
74.9
68.4
0600 - 0700
112.1
101.1
109.9
108.1
111.3
47.4
0.0
0600 - 0700
76.3
86.4
79.0
81.7
82.0
0700 - 0800
98.9
114.0
106.4
94.1
100.0
0700 - 0800
413.0
504.1
523.4
473.6
506.0
61.6
45.3
0700 - 0800
57.1
64.4
59.9
65.4
58.6
0800 - 0900
170.4
171.7
170.4
172.9
180.9
0800 - 0900
443.4
444.3
419.3
468.4
408.1
124.0
69.7
0800 - 0900
0.0
0.0
0.0
0.0
0.0
0900 - 1000
77.1
111.0
96.3
104.0
94.3
0900 - 1000
281.4
292.6
283.9
288.9
237.0
188.9
47.9
0900 - 1000
0.0
0.0
0.0
0.0
0.0
1000 - 1100
59.6
64.7
69.4
82.0
67.6
1000 - 1100
234.1
246.1
262.7
237.6
265.3
205.1
68.7
1000 - 1100
0.0
0.0
0.0
0.0
0.0
1100 - 1200
77.1
79.7
86.7
82.6
68.4
1100 - 1200
228.9
238.6
235.4
233.9
241.0
207.4
104.7
1100 - 1200
0.0
0.0
0.0
0.0
0.0
1200 - 1300
80.0
77.6
80.4
101.7
82.4
1200 - 1300
233.7
260.0
254.1
268.9
247.6
222.9
120.7
1200 - 1300
0.0
0.0
0.0
0.0
0.0
1300 - 1400
94.7
106.6
105.1
103.3
91.1
1300 - 1400
235.7
262.3
250.1
268.1
270.0
227.3
131.7
1300 - 1400
0.0
0.0
0.0
0.0
0.0
1400 - 1500
71.9
79.7
87.3
84.1
77.3
1400 - 1500
333.0
355.9
352.6
356.1
346.7
222.1
144.4
1400 - 1500
0.0
0.0
0.0
0.0
0.0
1500 - 1600
99.0
112.9
118.7
101.7
105.1
1500 - 1600
409.7
455.0
439.1
511.6
496.7
214.4
127.1
1500 - 1600
37.7
41.0
43.4
43.1
29.7
1600 - 1700
158.9
178.6
151.9
154.0
123.6
1600 - 1700
333.1
356.4
358.7
367.0
305.0
240.7
107.6
1600 - 1700
53.3
56.4
57.4
50.9
45.1
1700 - 1800
88.1
116.4
108.3
120.3
100.0
1700 - 1800
218.0
266.3
234.9
261.6
278.9
195.6
108.0
1700 - 1800
0.0
0.0
0.0
0.0
0.0
1800 - 1900
14.4
17.9
16.6
14.7
13.6
1800 - 1900
66.3
82.6
93.9
98.7
89.6
114.9
64.4
1800 - 1900
0.0
0.0
0.0
0.0
0.0
1900 - 2000
0.0
0.0
0.0
0.0
0.0
1900 - 2000
77.7
117.9
104.1
118.6
126.4
105.9
37.7
1900 - 2000
0.0
0.0
0.0
0.0
0.0
2000 - 2100
0.0
0.0
0.0
0.0
0.0
2000 - 2100
64.7
67.1
84.9
89.3
86.6
62.7
26.9
2000 - 2100
0.0
0.0
0.0
0.0
0.0
2100 - 2200
0.0
0.0
0.0
0.0
0.0
2100 - 2200
52.9
64.7
68.6
65.0
86.1
73.7
19.1
2100 - 2200
0.0
0.0
0.0
0.0
0.0
2200 - 2300
0.0
0.0
0.0
0.0
0.0
2200 - 2300
12.0
14.4
25.0
37.7
38.7
65.0
6.6
2200 - 2300
0.0
0.0
0.0
0.0
0.0
2300 - 2400
0.0
0.0
0.0
0.0
0.0
2300 - 2400
2.7
2.3
1.9
6.0
8.1
5.3
0.9
2300 - 2400
0.0
0.0
0.0
0.0
0.0
2400 - 0100
0.0
0.0
0.0
0.0
0.0
2400 - 0100
0.0
0.0
0.0
0.0
0.0
0.0
0.0
2400 - 0100
0.0
0.0
0.0
0.0
0.0
1200
1200
1200
1000
000
1000
1000
800
800
800
600
600
600
400
400
400
200
200
200
0
0
0
0600
0700
0800
0900
1000
1100
1200
1300
1400
1500
1600
1700
1800
1900
2000
2100
2200
2300
2400
0100
0600
0700
0800
0900
1000
1100
1200
1300
1400
1500
1600
1700
1800
1900
2000
2100
2200
2300
2400
0100
0600
0700
0800
0900
1000
1100
1200
1300
1400
1500
1600
1700
1800
1900
2000
2100
2200
2300
2400
0100
‐
‐
‐
‐
‐
‐
‐
‐
‐
‐
‐
‐
‐
‐
‐
‐
‐
‐
‐
‐
‐
‐
‐
‐
‐
‐
‐
‐
‐
‐
‐
‐
‐
‐
‐
‐
‐
‐
‐
‐
‐
‐
‐
‐
‐
‐
‐
‐
‐
‐
‐
‐
‐
‐
‐
‐
‐
‐
‐
‐
0500
0600
0700
0800
0900
1000
1100
1200
1300
1400
1500
1600
1700
1800
1900
2000
2100
2200
2300
2400
0500
0600
0700
0800
0900
1000
1100
1200
1300
1400
1500
1600
1700
1800
1900
2000
2100
2200
2300
2400
0500
0600
0700
0800
0900
1000
1100
1200
1300
1400
1500
1600
1700
1800
1900
2000
2100
2200
2300
2400
Wellington City Bus Review
 Average Boardings per Route per Hour
ROUTE 14
ROUTE 17
ROUTE 18
M
Tu
W
Th
F
Su
Su
M
Tu
W
Th
F
Sa
Su
M
Tu
W
Th
F
Sa
Su
0500 - 0600
Average Boardings per Route per Hour
ROUTE 14
ROUTE 17
ROUTE 18
M
Tu
W
Th
F
Su
Su
M
Tu
W
Th
F
Sa
Su
M
Tu
W
Th
F
Sa
Su
0500 - 0600
18.1
19.4
20.0
16.1
15.9
0.0
0.0
0500 - 0600
0.0
0.0
0.0
0.0
0.0
0500 - 0600
0.0
0.0
0.0
0.0
0.0
0600 - 0700
100.4
95.3
99.9
104.0
105.1
11.9
4.9
0600 - 0700
13.9
8.0
4.7
0.0
0.0
0600 - 0700
0.0
14.4
5.1
8.6
14.4
0700 - 0800
434.3
446.9
470.1
456.1
423.0
37.6
41.4
0700 - 0800
213.4
254.9
235.6
225.1
230.4
0700 - 0800
394.4
361.1
406.4
403.0
386.4
0800 - 0900
354.1
388.1
395.1
399.3
400.7
67.4
55.4
0800 - 0900
301.9
294.3
271.3
266.1
278.1
0800 - 0900
351.0
315.3
336.0
335.3
296.6
0900 - 1000
132.6
136.0
132.4
124.9
122.9
81.3
75.0
0900 - 1000
153.1
182.1
164.3
153.7
161.9
0900 - 1000
247.4
301.6
264.7
288.9
267.6
1000 - 1100
107.7
102.4
103.3
103.3
116.7
110.6
89.1
1000 - 1100
166.0
158.1
165.6
168.0
149.1
1000 - 1100
110.6
134.1
122.9
113.0
127.1
1100 - 1200
127.4
145.6
142.3
156.7
154.4
109.9
103.6
1100 - 1200
100.7
100.0
116.3
113.6
91.0
1100 - 1200
181.1
156.0
209.6
155.9
190.0
1200 - 1300
161.0
170.9
190.0
189.7
157.7
127.4
119.7
1200 - 1300
149.6
185.0
160.1
169.1
162.1
1200 - 1300
158.4
156.0
169.0
167.3
170.7
1300 - 1400
169.4
184.0
176.0
162.7
170.4
120.1
92.9
1300 - 1400
118.3
128.6
123.1
113.9
115.1
1300 - 1400
119.0
113.4
133.7
114.4
150.6
1400 - 1500
160.9
209.7
177.9
180.3
197.1
149.1
107.6
1400 - 1500
101.7
149.6
98.9
100.6
85.6
1400 - 1500
201.4
215.0
211.0
186.4
154.7
1500 - 1600
249.3
240.7
223.0
241.0
230.1
143.7
120.1
1500 - 1600
118.3
142.0
164.7
183.0
134.3
1500 - 1600
259.7
257.7
271.9
292.1
275.6
1600 - 1700
347.1
339.9
372.0
347.7
323.7
122.9
71.7
1600 - 1700
209.3
220.1
175.3
174.4
153.9
1600 - 1700
210.1
225.7
214.9
232.9
186.1
1700 - 1800
355.6
385.9
352.9
380.3
336.1
132.3
95.7
1700 - 1800
104.6
103.4
83.1
86.6
66.0
1700 - 1800
108.3
139.6
144.1
108.0
85.4
1800 - 1900
168.1
180.6
175.4
177.7
185.6
101.7
73.7
1800 - 1900
19.9
29.6
31.7
23.1
16.9
1800 - 1900
17.6
20.0
20.1
23.3
17.7
1900 - 2000
88.4
79.9
90.0
112.4
97.4
80.6
56.7
1900 - 2000
0.0
0.0
0.0
0.0
0.0
1900 - 2000
0.0
0.0
0.0
0.0
0.0
2000 - 2100
63.3
88.4
100.4
76.7
111.7
61.6
39.7
2000 - 2100
0.0
0.0
0.0
0.0
0.0
2000 - 2100
0.0
0.0
0.0
0.0
0.0
2100 - 2200
48.4
60.4
64.9
81.4
87.7
62.3
38.1
2100 - 2200
0.0
0.0
0.0
0.0
0.0
2100 - 2200
0.0
0.0
0.0
0.0
0.0
2200 - 2300
27.9
28.1
44.4
43.0
81.4
54.4
11.6
2200 - 2300
0.0
0.0
0.0
0.0
0.0
2200 - 2300
0.0
0.0
0.0
0.0
0.0
2300 - 2400
8.7
11.1
16.0
18.4
35.0
18.3
0.0
2300 - 2400
0.0
0.0
0.0
0.0
0.0
2300 - 2400
0.0
0.0
0.0
0.0
0.0
2400 - 0100
0.0
0.0
0.0
0.0
0.0
0.0
0.0
2400 - 0100
0.0
0.0
0.0
0.0
0.0
2400 - 0100
0.0
0.0
0.0
0.0
0.0
1200
1200
1200
1000
1000
000
1000
800
800
800
600
600
600
400
400
400
200
200
200
0
0
0
0600
0700
0800
0900
1000
1100
1200
1300
1400
1500
1600
1700
1800
1900
2000
2100
2200
2300
2400
0100
0600
0700
0800
0900
1000
1100
1200
1300
1400
1500
1600
1700
1800
1900
2000
2100
2200
2300
2400
0100
0600
0700
0800
0900
1000
1100
1200
1300
1400
1500
1600
1700
1800
1900
2000
2100
2200
2300
2400
0100
‐
‐
‐
‐
‐
‐
‐
‐
‐
‐
‐
‐
‐
‐
‐
‐
‐
‐
‐
‐
‐
‐
‐
‐
‐
‐
‐
‐
‐
‐
‐
‐
‐
‐
‐
‐
‐
‐
‐
‐
‐
‐
‐
‐
‐
‐
‐
‐
‐
‐
‐
‐
‐
‐
‐
‐
‐
‐
‐
‐
0500
0600
0700
0800
0900
1000
1100
1200
1300
1400
1500
1600
1700
1800
1900
2000
2100
2200
2300
2400
0500
0600
0700
0800
0900
1000
1100
1200
1300
1400
1500
1600
1700
1800
1900
2000
2100
2200
2300
2400
0500
0600
0700
0800
0900
1000
1100
1200
1300
1400
1500
1600
1700
1800
1900
2000
2100
2200
2300
2400
Wellington City Bus Review
 Average Boardings per Route per Hour
ROUTE 20
ROUTE 21
ROUTE 22
M
Tu
W
Th
F
Su
Su
M
Tu
W
Th
F
Sa
Su
M
Tu
W
Th
F
Sa
Su
0500 - 0600
Average Boardings per Route per Hour
ROUTE 20
ROUTE 21
ROUTE 22
M
Tu
W
Th
F
Su
Su
M
Tu
W
Th
F
Sa
Su
M
Tu
W
Th
F
Sa
Su
0500 - 0600
0.0
0.0
0.0
0.0
0.0
0500 - 0600
0.0
0.0
0.0
0.0
0.0
0500 - 0600
0.0
0.0
0.0
2.7
3.1
0600 - 0700
38.3
48.1
34.0
42.0
40.7
0600 - 0700
20.4
29.9
33.9
50.6
21.4
0600 - 0700
68.4
69.9
79.1
79.1
72.6
0700 - 0800
125.4
145.1
120.7
114.7
112.6
0700 - 0800
292.6
274.6
288.1
274.0
281.6
0700 - 0800
264.7
302.1
265.4
324.7
271.9
0800 - 0900
109.9
111.7
114.0
129.9
114.4
0800 - 0900
106.0
123.6
121.9
96.9
125.7
0800 - 0900
164.4
164.0
176.3
144.6
159.7
0900 - 1000
78.1
91.7
90.6
95.3
80.0
0900 - 1000
30.6
22.0
18.9
26.9
27.1
0900 - 1000
63.1
72.9
76.1
75.0
80.0
1000 - 1100
68.0
70.3
84.4
66.0
68.0
1000 - 1100
40.4
60.1
48.6
50.1
55.3
1000 - 1100
43.7
39.3
41.9
49.1
42.0
1100 - 1200
79.1
72.4
73.3
66.1
60.6
1100 - 1200
34.3
35.9
36.9
38.3
29.4
1100 - 1200
75.9
75.0
75.6
75.4
71.4
1200 - 1300
58.9
63.3
64.1
64.0
62.7
1200 - 1300
37.4
39.3
29.3
45.7
29.4
1200 - 1300
72.6
84.1
92.4
98.3
83.0
1300 - 1400
57.0
65.6
54.9
57.0
61.4
1300 - 1400
57.9
47.9
51.7
46.0
45.6
1300 - 1400
93.1
88.4
86.0
96.9
89.1
1400 - 1500
101.3
83.9
69.1
99.6
105.3
1400 - 1500
4.0
27.9
21.4
17.9
42.4
1400 - 1500
121.4
137.1
123.0
114.0
125.4
1500 - 1600
76.0
96.4
111.0
81.0
70.9
1500 - 1600
133.4
135.7
123.1
137.1
114.0
1500 - 1600
211.7
248.4
236.3
254.7
200.6
1600 - 1700
159.3
150.7
154.3
170.0
148.0
1600 - 1700
190.7
208.9
207.6
186.3
165.7
1600 - 1700
312.4
305.1
282.7
263.0
247.7
1700 - 1800
98.3
81.6
62.4
68.4
62.7
1700 - 1800
61.6
69.1
51.4
54.4
47.3
1700 - 1800
158.1
150.0
160.7
177.9
160.3
1800 - 1900
14.0
16.1
19.4
13.4
4.9
1800 - 1900
39.0
43.1
38.9
44.7
56.0
1800 - 1900
56.9
63.0
56.9
57.3
59.6
1900 - 2000
0.0
0.0
0.0
0.0
0.0
1900 - 2000
0.0
0.1
0.7
0.6
3.4
1900 - 2000
0.6
0.0
4.1
0.0
0.0
2000 - 2100
0.0
0.0
0.0
0.0
0.0
2000 - 2100
0.0
0.0
0.0
0.0
0.0
2000 - 2100
0.0
0.0
0.0
0.0
0.0
2100 - 2200
0.0
0.0
0.0
0.0
0.0
2100 - 2200
0.0
0.0
0.0
0.0
0.0
2100 - 2200
0.0
0.0
0.0
0.0
0.0
2200 - 2300
0.0
0.0
0.0
0.0
0.0
2200 - 2300
0.0
0.0
0.0
0.0
0.0
2200 - 2300
0.0
0.0
0.0
0.0
0.0
2300 - 2400
0.0
0.0
0.0
0.0
0.0
2300 - 2400
0.0
0.0
0.0
0.0
0.0
2300 - 2400
0.0
0.0
0.0
0.0
0.0
2400 - 0100
0.0
0.0
0.0
0.0
0.0
2400 - 0100
0.0
0.0
0.0
0.0
0.0
2400 - 0100
0.0
0.0
0.0
0.0
0.0
1200
1200
1200
1000
1000
000
1000
800
800
800
600
600
600
400
400
400
200
200
200
0
0
0
0600
0700
0800
0900
1000
1100
1200
1300
1400
1500
1600
1700
1800
1900
2000
2100
2200
2300
2400
0100
0600
0700
0800
0900
1000
1100
1200
1300
1400
1500
1600
1700
1800
1900
2000
2100
2200
2300
2400
0100
0600
0700
0800
0900
1000
1100
1200
1300
1400
1500
1600
1700
1800
1900
2000
2100
2200
2300
2400
0100
‐
‐
‐
‐
‐
‐
‐
‐
‐
‐
‐
‐
‐
‐
‐
‐
‐
‐
‐
‐
‐
‐
‐
‐
‐
‐
‐
‐
‐
‐
‐
‐
‐
‐
‐
‐
‐
‐
‐
‐
‐
‐
‐
‐
‐
‐
‐
‐
‐
‐
‐
‐
‐
‐
‐
‐
‐
‐
‐
‐
0500
0600
0700
0800
0900
1000
1100
1200
1300
1400
1500
1600
1700
1800
1900
2000
2100
2200
2300
2400
0500
0600
0700
0800
0900
1000
1100
1200
1300
1400
1500
1600
1700
1800
1900
2000
2100
2200
2300
2400
0500
0600
0700
0800
0900
1000
1100
1200
1300
1400
1500
1600
1700
1800
1900
2000
2100
2200
2300
2400
Wellington City Bus Review
 Average Boardings per Route per Hour
ROUTE 23
ROUTE 24
ROUTE 25
M
Tu
W
Th
F
Su
Su
M
Tu
W
Th
F
Sa
Su
M
Tu
W
Th
F
Sa
Su
0500 - 0600
Average Boardings per Route per Hour
ROUTE 23
ROUTE 24
ROUTE 25
M
Tu
W
Th
F
Su
Su
M
Tu
W
Th
F
Sa
Su
M
Tu
W
Th
F
Sa
Su
0500 - 0600
0.0
0.0
0.0
0.0
0.0
0.0
0.0
0500 - 0600
2.3
2.9
0.0
4.0
2.3
0500 - 0600
0.0
0.0
0.0
0.0
0.0
0600 - 0700
74.4
54.3
65.6
58.4
67.3
7.7
0.0
0600 - 0700
57.6
58.3
60.7
56.1
60.7
0600 - 0700
39.4
37.4
40.3
36.6
40.4
0700 - 0800
222.0
257.4
250.6
240.7
210.6
27.7
9.9
0700 - 0800
255.4
272.3
263.1
263.1
255.1
0700 - 0800
244.7
262.0
277.6
274.7
244.7
0800 - 0900
150.1
136.0
144.1
142.1
133.6
84.6
67.0
0800 - 0900
120.4
125.9
133.9
127.7
110.7
0800 - 0900
32.7
7.9
9.3
9.6
27.4
0900 - 1000
73.1
111.1
90.1
75.1
100.0
63.0
94.3
0900 - 1000
33.1
33.9
40.1
39.3
41.0
0900 - 1000
0.0
0.0
0.0
0.0
0.0
1000 - 1100
125.7
111.7
128.7
121.9
133.3
109.6
122.1
1000 - 1100
21.1
24.6
22.3
22.1
27.1
1000 - 1100
0.0
0.0
0.0
0.0
0.0
1100 - 1200
49.3
71.7
45.9
67.9
78.4
146.0
121.6
1100 - 1200
27.3
32.7
27.0
36.6
30.9
1100 - 1200
0.0
0.0
0.0
0.0
0.0
1200 - 1300
53.0
69.1
79.0
67.6
73.9
157.9
86.6
1200 - 1300
35.3
37.0
40.6
37.4
54.1
1200 - 1300
0.0
0.0
0.0
0.0
0.0
1300 - 1400
62.7
60.3
73.7
80.4
81.7
138.7
198.1
1300 - 1400
20.3
34.0
30.9
33.1
33.4
1300 - 1400
0.0
0.0
0.0
0.0
0.0
1400 - 1500
94.1
117.6
95.0
97.7
96.4
131.9
138.0
1400 - 1500
57.7
44.1
58.6
60.4
50.6
1400 - 1500
0.0
0.0
0.0
0.0
0.0
1500 - 1600
176.4
169.3
159.4
189.1
177.1
193.7
98.1
1500 - 1600
22.3
46.3
35.1
42.6
47.3
1500 - 1600
0.0
0.0
0.0
0.0
0.0
1600 - 1700
83.0
109.0
93.3
95.0
79.1
163.9
156.1
1600 - 1700
157.9
164.0
161.7
141.6
146.4
1600 - 1700
0.0
0.0
0.0
0.0
0.0
1700 - 1800
164.4
155.1
171.3
151.9
149.1
102.0
102.4
1700 - 1800
130.3
129.9
128.7
132.9
107.1
1700 - 1800
5.9
0.0
0.0
0.0
0.0
1800 - 1900
119.3
132.1
135.4
145.4
121.0
40.3
68.3
1800 - 1900
44.7
52.4
58.7
71.3
50.0
1800 - 1900
0.0
0.0
0.0
0.0
0.0
1900 - 2000
93.4
110.3
103.0
109.7
132.4
89.7
47.0
1900 - 2000
10.4
18.6
13.3
18.3
18.0
1900 - 2000
0.0
0.0
0.0
0.0
0.0
2000 - 2100
46.6
46.7
52.0
61.9
61.4
88.3
37.6
2000 - 2100
0.0
0.0
0.0
0.0
0.0
2000 - 2100
0.0
0.0
0.0
0.0
0.0
2100 - 2200
30.7
41.4
40.7
35.6
52.4
69.1
2.0
2100 - 2200
0.0
0.0
0.0
0.7
0.0
2100 - 2200
0.0
0.0
0.0
0.0
0.0
2200 - 2300
26.1
24.9
31.9
37.3
68.0
28.1
0.0
2200 - 2300
0.0
0.0
0.0
0.0
0.0
2200 - 2300
0.0
0.0
0.0
0.0
0.0
2300 - 2400
0.0
0.0
2.0
7.6
0.0
22.1
0.0
2300 - 2400
0.0
0.0
0.0
0.0
0.0
2300 - 2400
0.0
0.0
0.0
0.0
0.0
2400 - 0100
0.0
0.0
0.0
0.0
0.0
0.0
0.0
2400 - 0100
0.0
0.0
0.0
0.0
0.0
2400 - 0100
0.0
0.0
0.0
0.0
0.0
1200
1200
1200
1000
1000
000
1000
800
800
800
600
600
600
400
400
400
200
200
200
0
0
0
0600
0700
0800
0900
1000
1100
1200
1300
1400
1500
1600
1700
1800
1900
2000
2100
2200
2300
2400
0100
0600
0700
0800
0900
1000
1100
1200
1300
1400
1500
1600
1700
1800
1900
2000
2100
2200
2300
2400
0100
0600
0700
0800
0900
1000
1100
1200
1300
1400
1500
1600
1700
1800
1900
2000
2100
2200
2300
2400
0100
‐
‐
‐
‐
‐
‐
‐
‐
‐
‐
‐
‐
‐
‐
‐
‐
‐
‐
‐
‐
‐
‐
‐
‐
‐
‐
‐
‐
‐
‐
‐
‐
‐
‐
‐
‐
‐
‐
‐
‐
‐
‐
‐
‐
‐
‐
‐
‐
‐
‐
‐
‐
‐
‐
‐
‐
‐
‐
‐
‐
0500
0600
0700
0800
0900
1000
1100
1200
1300
1400
1500
1600
1700
1800
1900
2000
2100
2200
2300
2400
0500
0600
0700
0800
0900
1000
1100
1200
1300
1400
1500
1600
1700
1800
1900
2000
2100
2200
2300
2400
0500
0600
0700
0800
0900
1000
1100
1200
1300
1400
1500
1600
1700
1800
1900
2000
2100
2200
2300
2400
Wellington City Bus Review
 Average Boardings per Route per Hour
ROUTE 30
ROUTE 31
ROUTE 32
M
Tu
W
Th
F
Su
Su
M
Tu
W
Th
F
Su
Su
M
Tu
W
Th
F
Su
Su
0500 - 0600
Average Boardings per Route per Hour
ROUTE 30
ROUTE 31
ROUTE 32
M
Tu
W
Th
F
Su
Su
M
Tu
W
Th
F
Su
Su
M
Tu
W
Th
F
Su
Su
0500 - 0600
0.0
0.0
0.0
0.0
0.0
0500 - 0600
0.0
0.0
0.0
0.0
0.0
0500 - 0600
0.0
0.0
0.0
0.0
0.0
0600 - 0700
84.0
110.0
101.0
96.7
107.7
0600 - 0700
81.9
63.1
78.0
68.4
64.4
0600 - 0700
67.0
61.7
58.9
76.7
58.0
0700 - 0800
205.3
215.6
210.1
218.9
187.0
0700 - 0800
175.6
222.0
211.4
201.4
199.4
0700 - 0800
133.7
157.1
168.0
155.9
148.9
0800 - 0900
70.9
67.7
69.7
74.1
75.1
0800 - 0900
105.9
86.3
87.4
106.1
83.9
0800 - 0900
74.6
61.1
69.6
68.4
69.4
0900 - 1000
3.4
4.7
5.0
9.4
12.0
0900 - 1000
0.0
0.0
0.1
0.0
0.0
0900 - 1000
0.0
0.0
0.0
0.0
0.0
1000 - 1100
0.0
0.1
0.0
0.0
0.0
1000 - 1100
0.0
0.0
0.0
0.0
0.0
1000 - 1100
0.0
0.0
0.0
0.0
0.0
1100 - 1200
0.0
0.0
0.0
0.0
0.0
1100 - 1200
0.0
0.0
0.0
0.0
0.0
1100 - 1200
0.0
0.0
0.0
0.0
0.0
1200 - 1300
0.0
0.0
0.0
0.0
0.0
1200 - 1300
0.0
0.0
0.0
0.0
0.0
1200 - 1300
0.0
0.0
0.0
0.0
0.0
1300 - 1400
0.0
0.0
0.0
0.0
0.0
1300 - 1400
0.0
0.0
0.0
0.0
0.0
1300 - 1400
0.0
0.0
0.0
0.0
0.0
1400 - 1500
0.0
3.1
0.0
0.0
0.0
1400 - 1500
19.3
14.0
18.0
16.4
12.3
1400 - 1500
0.0
0.0
0.0
0.0
0.0
1500 - 1600
40.0
31.9
25.9
24.7
28.9
1500 - 1600
70.3
56.9
66.4
47.0
44.4
1500 - 1600
0.0
2.0
0.0
0.0
0.0
1600 - 1700
167.7
133.9
143.1
151.3
113.6
1600 - 1700
103.7
117.4
108.0
137.7
85.1
1600 - 1700
115.4
109.4
107.9
100.0
86.1
1700 - 1800
123.3
156.3
128.4
119.0
91.7
1700 - 1800
113.0
113.7
100.6
82.4
82.0
1700 - 1800
42.3
43.4
47.9
40.7
23.4
1800 - 1900
45.3
51.6
52.4
56.4
44.0
1800 - 1900
32.6
38.3
29.6
34.4
30.0
1800 - 1900
0.0
0.0
0.0
0.0
0.0
1900 - 2000
0.0
0.0
0.0
0.0
0.0
1900 - 2000
0.0
0.0
0.0
0.0
0.0
1900 - 2000
0.0
0.0
0.0
0.0
0.0
2000 - 2100
0.0
0.0
0.0
0.0
0.0
2000 - 2100
0.0
0.0
0.0
0.0
0.0
2000 - 2100
0.0
0.0
0.0
0.0
0.0
2100 - 2200
0.0
0.0
0.0
0.0
0.0
2100 - 2200
0.0
0.0
0.0
0.0
0.0
2100 - 2200
0.0
0.0
0.0
0.0
0.0
2200 - 2300
0.0
0.0
0.0
0.0
0.0
2200 - 2300
0.0
0.0
0.0
0.0
0.0
2200 - 2300
0.0
0.0
0.0
0.0
0.0
2300 - 2400
0.0
0.0
0.0
0.0
0.0
2300 - 2400
0.0
0.0
0.0
0.0
0.0
2300 - 2400
0.0
0.0
0.0
0.0
0.0
2400 - 0100
0.0
0.0
0.0
0.0
0.0
2400 - 0100
0.0
0.0
0.0
0.0
0.0
2400 - 0100
0.0
0.0
0.0
0.0
0.0
1200
1200
1200
1000
1000
1000
800
800
800
600
600
600
400
400
400
200
200
200
0
0
0
0600
0700
0800
0900
1000
1100
1200
1300
1400
1500
1600
1700
1800
1900
2000
2100
2200
2300
2400
0100
0600
0700
0800
0900
1000
1100
1200
1300
1400
1500
1600
1700
1800
1900
2000
2100
2200
2300
2400
0100
0600
0700
0800
0900
1000
1100
1200
1300
1400
1500
1600
1700
1800
1900
2000
2100
2200
2300
2400
0100
‐
‐
‐
‐
‐
‐
‐
‐
‐
‐
‐
‐
‐
‐
‐
‐
‐
‐
‐
‐
‐
‐
‐
‐
‐
‐
‐
‐
‐
‐
‐
‐
‐
‐
‐
‐
‐
‐
‐
‐
‐
‐
‐
‐
‐
‐
‐
‐
‐
‐
‐
‐
‐
‐
‐
‐
‐
‐
‐
‐
0500
0600
0700
0800
0900
1000
1100
1200
1300
1400
1500
1600
1700
1800
1900
2000
2100
2200
2300
2400
0500
0600
0700
0800
0900
1000
1100
1200
1300
1400
1500
1600
1700
1800
1900
2000
2100
2200
2300
2400
0500
0600
0700
0800
0900
1000
1100
1200
1300
1400
1500
1600
1700
1800
1900
2000
2100
2200
2300
2400
Wellington City Bus Review
 Average Boardings per Route per Hour
ROUTE 43
ROUTE 44
ROUTE 45
M
Tu
W
Th
F
Su
Su
M
Tu
W
Th
F
Su
Su
M
Tu
W
Th
F
Su
Su
0500 - 0600
Average Boardings per Route per Hour
ROUTE 43
ROUTE 44
ROUTE 45
M
Tu
W
Th
F
Su
Su
M
Tu
W
Th
F
Su
Su
M
Tu
W
Th
F
Su
Su
0500 - 0600
0.6
0.0
4.1
0.0
7.4
0.0
0.0
0500 - 0600
0.0
0.0
1.9
0.0
0.0
1.3
0.0
0500 - 0600
0.0
0.0
0.0
0.0
0.0
0600 - 0700
26.3
31.7
29.7
35.4
24.0
4.1
0.0
0600 - 0700
187.3
212.0
170.7
187.9
185.7
11.3
0.0
0600 - 0700
23.7
18.1
18.0
25.0
13.1
0700 - 0800
136.7
144.6
152.0
149.0
136.1
49.1
11.7
0700 - 0800
379.1
357.7
393.6
405.0
366.3
34.7
0.0
0700 - 0800
86.7
95.4
99.7
100.7
98.6
0800 - 0900
148.1
138.9
163.4
139.3
138.1
55.4
37.3
0800 - 0900
88.9
89.6
77.1
86.7
97.7
59.7
47.9
0800 - 0900
124.0
115.0
111.6
133.1
118.3
0900 - 1000
69.9
95.3
73.0
93.1
105.6
55.3
32.6
0900 - 1000
71.1
90.7
91.7
89.3
63.7
33.6
76.6
0900 - 1000
13.4
9.7
11.3
13.1
9.4
1000 - 1100
79.9
46.9
66.1
69.0
67.4
79.0
25.3
1000 - 1100
66.3
68.9
72.6
83.1
53.7
79.0
64.1
1000 - 1100
0.0
0.0
0.0
0.0
0.0
1100 - 1200
93.1
123.1
100.6
102.0
116.1
86.6
17.4
1100 - 1200
11.9
12.1
27.6
16.1
23.0
70.4
92.9
1100 - 1200
0.0
0.0
0.0
0.0
0.0
1200 - 1300
62.9
53.3
95.6
111.9
93.7
56.6
42.0
1200 - 1300
123.6
138.9
128.0
153.4
114.7
55.9
69.6
1200 - 1300
0.0
0.0
0.0
0.0
0.0
1300 - 1400
89.9
127.9
101.1
107.4
148.6
87.6
39.6
1300 - 1400
8.0
11.9
13.7
10.0
10.1
71.4
82.0
1300 - 1400
4.0
3.4
2.9
4.0
2.4
1400 - 1500
53.6
39.6
59.3
31.1
45.1
13.6
42.9
1400 - 1500
226.3
229.6
232.4
240.1
211.0
71.7
78.1
1400 - 1500
24.6
20.0
18.4
16.6
21.4
1500 - 1600
182.3
170.9
133.9
172.1
175.9
151.6
43.4
1500 - 1600
165.3
181.7
127.6
165.1
165.7
69.7
76.6
1500 - 1600
83.0
73.6
62.0
85.4
63.7
1600 - 1700
169.4
195.7
176.6
247.6
168.4
79.3
21.4
1600 - 1700
177.6
183.0
190.0
168.6
164.3
57.9
77.0
1600 - 1700
75.9
68.6
75.1
61.9
69.1
1700 - 1800
121.4
137.1
159.6
143.7
128.0
78.3
47.4
1700 - 1800
201.3
226.7
254.0
219.3
208.4
77.0
60.6
1700 - 1800
88.0
81.7
77.1
68.4
57.3
1800 - 1900
93.3
106.6
139.9
104.3
124.7
87.1
19.4
1800 - 1900
5.0
4.3
0.0
5.4
7.7
0.0
50.0
1800 - 1900
1.4
9.0
8.6
11.0
17.7
1900 - 2000
131.3
132.9
154.6
187.1
201.0
75.6
23.4
1900 - 2000
0.0
0.0
0.0
0.0
34.6
0.0
17.1
1900 - 2000
0.0
0.0
0.0
0.0
0.0
2000 - 2100
32.6
41.9
74.3
72.6
85.0
50.6
8.7
2000 - 2100
0.0
0.0
0.0
0.0
0.0
0.0
24.9
2000 - 2100
0.0
0.0
0.0
0.0
0.0
2100 - 2200
74.1
102.6
101.7
123.6
153.0
46.4
12.4
2100 - 2200
0.0
0.0
0.0
0.0
0.0
0.0
15.3
2100 - 2200
0.0
0.0
0.0
0.0
0.0
2200 - 2300
16.6
26.1
34.7
31.1
96.6
65.4
2.1
2200 - 2300
0.0
0.0
0.0
0.0
0.0
0.0
8.9
2200 - 2300
0.0
0.0
0.0
0.0
0.0
2300 - 2400
1.1
0.0
0.0
4.9
0.0
0.0
0.0
2300 - 2400
0.0
0.0
0.0
0.0
0.0
0.0
0.0
2300 - 2400
0.0
0.0
0.0
0.0
0.0
2400 - 0100
0.0
0.0
0.0
0.0
0.0
0.0
0.0
2400 - 0100
0.0
0.0
0.0
0.0
0.0
0.0
0.0
2400 - 0100
0.0
0.0
0.0
0.0
0.0
1200
1200
1200
1000
1000
1000
800
800
800
600
600
600
400
400
400
200
200
200
0
0
0
0600
0700
0800
0900
1000
1100
1200
1300
1400
1500
1600
1700
1800
1900
2000
2100
2200
2300
2400
0100
0600
0700
0800
0900
1000
1100
1200
1300
1400
1500
1600
1700
1800
1900
2000
2100
2200
2300
2400
0100
0600
0700
0800
0900
1000
1100
1200
1300
1400
1500
1600
1700
1800
1900
2000
2100
2200
2300
2400
0100
‐
‐
‐
‐
‐
‐
‐
‐
‐
‐
‐
‐
‐
‐
‐
‐
‐
‐
‐
‐
‐
‐
‐
‐
‐
‐
‐
‐
‐
‐
‐
‐
‐
‐
‐
‐
‐
‐
‐
‐
‐
‐
‐
‐
‐
‐
‐
‐
‐
‐
‐
‐
‐
‐
‐
‐
‐
‐
‐
‐
0500
0600
0700
0800
0900
1000
1100
1200
1300
1400
1500
1600
1700
1800
1900
2000
2100
2200
2300
2400
0500
0600
0700
0800
0900
1000
1100
1200
1300
1400
1500
1600
1700
1800
1900
2000
2100
2200
2300
2400
0500
0600
0700
0800
0900
1000
1100
1200
1300
1400
1500
1600
1700
1800
1900
2000
2100
2200
2300
2400
Wellington City Bus Review
 Average Boardings per Route per Hour
ROUTE 46
ROUTE 47
M
Tu
W
Th
F
Su
Su
M
Tu
W
Th
F
Su
Su
0500 - 0600
Average Boardings per Route per Hour
ROUTE 46
ROUTE 47
M
Tu
W
Th
F
Su
Su
M
Tu
W
Th
F
Su
Su
0500 - 0600
0.0
0.0
0.0
0.0
0.0
0500 - 0600
0.0
0.0
0.0
0.0
0.0
0600 - 0700
56.7
52.3
74.7
40.4
57.7
0600 - 0700
0.0
0.0
0.0
0.0
0.0
0700 - 0800
145.3
140.0
130.9
161.0
136.1
0700 - 0800
12.6
32.3
37.7
31.0
26.6
0800 - 0900
14.7
24.7
15.9
16.4
18.3
0800 - 0900
104.9
122.6
94.4
111.1
97.0
0900 - 1000
4.9
0.0
0.0
0.0
0.0
0900 - 1000
55.1
69.4
56.7
62.3
57.7
1000 - 1100
0.0
0.0
0.0
0.0
0.0
1000 - 1100
55.9
72.1
83.0
70.1
49.9
1100 - 1200
0.0
0.0
0.0
0.0
0.0
1100 - 1200
58.0
39.0
59.4
64.7
51.3
1200 - 1300
0.0
0.0
0.0
0.0
0.0
1200 - 1300
41.9
56.4
56.0
52.7
45.1
1300 - 1400
0.0
0.0
0.0
0.0
0.0
1300 - 1400
33.6
41.4
60.0
34.1
26.7
1400 - 1500
0.0
0.0
0.0
0.0
0.0
1400 - 1500
27.9
36.6
34.7
34.3
33.6
1500 - 1600
16.0
11.6
25.4
25.4
8.1
1500 - 1600
15.7
8.9
7.4
12.3
10.3
1600 - 1700
84.3
87.4
75.4
73.1
77.4
1600 - 1700
50.9
48.7
38.6
39.1
42.9
1700 - 1800
61.6
65.6
64.6
62.6
42.9
1700 - 1800
2.7
4.1
10.1
11.6
2.6
1800 - 1900
9.4
6.3
4.1
6.9
9.9
1800 - 1900
0.1
0.1
0.7
0.0
0.0
1900 - 2000
0.0
0.0
0.0
0.0
0.0
1900 - 2000
0.0
0.0
0.0
0.0
0.0
2000 - 2100
0.0
0.0
0.0
0.0
0.0
2000 - 2100
0.0
0.0
0.0
0.0
0.0
2100 - 2200
0.0
0.0
0.0
0.0
0.0
2100 - 2200
0.0
0.0
0.0
0.0
0.0
2200 - 2300
0.0
0.0
0.0
0.0
0.0
2200 - 2300
0.0
0.0
0.0
0.0
0.0
2300 - 2400
0.0
0.0
0.0
0.0
0.0
2300 - 2400
0.0
0.0
0.0
0.0
0.0
2400 - 0100
0.0
0.0
0.0
0.0
0.0
2400 - 0100
0.0
0.0
0.0
0.0
0.0
1200
1200
1000
1000
800
800
600
600
400
400
200
200
0
0
0600
0700
0800
0900
1000
1100
1200
1300
1400
1500
1600
1700
1800
1900
2000
2100
2200
2300
2400
0100
0600
0700
0800
0900
1000
1100
1200
1300
1400
1500
1600
1700
1800
1900
2000
2100
2200
2300
2400
0100
‐
‐
‐
‐
‐
‐
‐
‐
‐
‐
‐
‐
‐
‐
‐
‐
‐
‐
‐
‐
‐
‐
‐
‐
‐
‐
‐
‐
‐
‐
‐
‐
‐
‐
‐
‐
‐
‐
‐
‐
0500
0600
0700
0800
0900
1000
1100
1200
1300
1400
1500
1600
1700
1800
1900
2000
2100
2200
2300
2400
0500
0600
0700
0800
0900
1000
1100
1200
1300
1400
1500
1600
1700
1800
1900
2000
2100
2200
2300
2400
Wellington City Bus Review

Greater Wellington Regional Council
Wellington City Bus Review
Appendix C
Weekday Load Profiles for Key Routes: Go Wellington
Wellington City Bus Review FINAL
24 November 2011
R01 Inbound ‐ Average Thursday Boardings and Alightings
R01 Inbound ‐ Average Thursday Cumulative Boardings and Pro Rata Alightings
R01 Inbound ‐ Average Thursday Cumulative Boardings and Max Alightings
1000
3000
3000
800
2000
2000
600
1000
1000
400
200
0
0
s
p
p
e
‐
at
s
p
e
‐
at
o
o
re
p
o
rve ‐
ace
St
o
re
ace
St
St
Sh
St
rve ‐
St
Sh
St
0
l Street
se
y Pl
Street
Street
ton
se
y Pl
Street
u
rd
l Street
Street
ton
o
rd
Re
na
u
o
na
s
p
e
‐
at
‐1000
pore
Re
to
e
illis
‐1000
pore
e
p
o
re
ace
Earlier
m
n
sin
lling
m
to
illis
lling
o
rve ‐
St
iddif
urt
n
anners
W
e
Earlier
sin
iddif
urt
anners
W
e
St
Sh
St
rha
Ri
R
Ba
o
W
Ri
R
Ba
o
‐200
l Street
se
y Pl
Street
Street
ton
e
C
M
rha
C
M
W
u
rd
B
e
o
na
B
pore
Re
to
e
illis
Earlier
m
n
sin
lling
Ri
iddif
urt
anners
W
e
‐2000
‐2000
rha
R
Ba
o
W
‐400
e
C
M
B
Board
Board
Board
Alight
Alight
Alight
Onboard
Onboard
‐600
‐3000
‐3000
R01 Outbound ‐ Average Thursday Boardings and Alightings
R01 Outbound ‐ Average Thursday Cumulative Boardings and Pro Rata Alightings
R01 Outbound ‐ Average Thursday Cumulative Boardings and Max Alightings
1000
4000
4000
3000
3000
800
2000
2000
600
1000
1000
400
0
0
at
p
p
y ‐
s ‐
o
Th
at
y ‐
s ‐
o
Th
St
ace
rve ‐
p
ace
p
o
y ‐
St
rve ‐
o
y ‐
200
‐1000
ton
Qua
Street
y Pl
se
y Sh
Qua
Street
y Pl
se
y Sh
n
Sh
l Street
‐1000
ton
Sh
l Street
na
n
u
Ba
n
na
n
u
Ba
e
Re
Ba
d
e
Re
Ba
d
lling
to
to
d
lling
to
to
d
e
sin
n
sin
n
anners
urt
tow
lan
lan
lan
e
anners
urt
tow
lan
W
o
Ba
Ri
Is
Ri
Is
Is
W
o
Ba
Is
0
‐2000
Lamb
M
C
M
C
New
‐2000
Lamb
New
at
p
y ‐
s ‐
o
Th
St
ace
rve ‐
p
o
y ‐
ton
Qua
Street
y Pl
se
Sh
l Street
y Sh
‐3000
‐3000
Ba
‐200
n
na
Re
n
u
Ba
d
Board
Board
e
lling
to
to
d
Board
sin
n
lan
Alight
Alight
e
anners
urt
tow
lan
W Alight
o
Ba
Ri
Is
Onboard
Onboard
Lamb
M
C
Is
‐4000
‐4000
New
R02 Inbound ‐ Average Thursday Boardings and Alightings
R02 Inbound ‐ Average Thursday Cumulative Boardings and Pro Rata Alightings
R02 Inbound ‐ Average Thursday Cumulative Boardings and Max Alightings
400
2500
2500
2000
2000
300
1500
1500
200
1000
1000
500
500
100
0
0
rli
e
s
g
s
ad
gi
e
g
Ro
s ‐
at
rli
gi
at
0
p
re
p
o
ace
y ‐
ad
s ‐
p
y ‐
Re
illa
St
Ro
p
re
o
illa
ace
St
s
‐500
Da Ro
at
o
St
V
Da Ro
at
o
St
Re
rli
s ‐
e
p
gi
g
at
r ‐
Sh
y Pl
Street
‐500
V
ad
Qua
r ‐
Sh
y Pl
Street
Ro
p
re
o
illa
ace
y ‐
ton
ad
r Sh
ton
n
ton
ad
r Sh
ton
Qua
ton
Da
o
Re
St
aitai
na
ton
n
Ro
e
na
at
St
V
to
aitai
Sh
y Pl
Street
lling
e
to
r ‐
ad
ton
Qua
ton
‐1000
rama
lling
rling
rk Ro
lling
lling
r Sh
rama
e
Hat
urt
e
‐1000
rama rling
rk Ro
e
urt
e
‐100
ton
n
aitai
na
Mi
aledonia
Kilbirnie
o
anners
rama
aledonia
Hat
anners
e
to
Da
Pa
Kilbirnie
o
Mi
C
W
C
M
Lamb
W
Mi Da
Pa
Mi
C
W
C
M
Lamb
W
rama
lling
rling
rk Ro
lling
rama
e
Hat
urt
anners
e
Mi
aledonia
Pa
C
Kilbirnie
W
o
W
‐1500
Da
C
M
‐1500
Mi
Lamb
‐200
‐2000
Board
‐2000
Board
Board
Alight
Alight
Alight
Onboard
Onboard
‐300
‐2500
‐2500
R02 Outbound ‐ Average Thursday Boardings and Alightings
R02 Outbound ‐ Average Thursday Cumulative Boardings and Pro Rata Alightings
R02 Outbound ‐ Average Thursday Cumulative Boardings and Max Alightings
300
2500
2500
250
2000
2000
200
1500
1500
150
1000
1000
100
500
500
50
0
0
at
g
s
e
g
s
e
y ‐
y ‐
at
gi
p
a
s ‐
rra
ad rli
at y ‐
y ‐
at
gi
p
a
s ‐
rra
ad
rli
St
ace
illa
re
re
Re
o
ad
p
St
ace
illa
Re
o
ad
p
0
‐500
Da
Da
V
o
o
Sh
St
Te
Ro
‐500
V
Sh
St
Te
Ro
ton Qua
Qua
Street
y Pl
r ‐
Qua
Qua
Street
y Pl
r ‐
g
gi
s
a
e
n
n
ton
at
p
s ‐
rli
na
Street
ton
r Sh
am
ton
n
n
na
Street
ton
r Sh
am
ton
y ‐
y ‐
ace
at
o
re
rra
ad
e
aitai
tai Ro
e
aitai
tai Ro
St
illa
Re
ad
p
o
Da
lling to
to
rie
rh
lling to
to
rie
rh
‐50
V
Sh
St
Te
Ro
‐1000
e
lling
go
e
rama
lling
go
e
rama
y Pl
anners
urt
Pi
Hat
e
n
rama
rling
‐1000
e
anners
urt
Pi
Hat
e
n
rama
rling
ton
Qua
Qua
Street
ton
r ‐
W
o
Kilbirnie
aledonia
th
Mi
o
Kilbirnie
aledonia
th
Mi
n
n
na
Street
r Sh
am
ton
Lamb
Lamb
M
C
W
Ro
C
Mi
W
W
C
tai Ro
Ro
Da
Lamb
Lamb
M
C
Ro
Mi
Ro
Da
e
aitai
lling
to
to
rie
rh
‐100
e
go
urt
lling
e
Pi
rama
Hat
e
n
rama
rling
‐1500
‐1500
anners
W
o
Kilbirnie
aledonia
th
Mi
Lamb
Lamb
M
C
W
Ro
C
Mi
Ro
Da
‐150
‐2000
Board
‐2000
Board
Board
Alight
Alight
Alight
Onboard
Onboard
‐200
‐2500
‐2500
R04 Inbound ‐ Average Thursday Boardings and Alightings
R04 Inbound ‐ Average Thursday Cumulative Boardings and Pro Rata Alightings
R04 Inbound ‐ Average Thursday Cumulative Boardings and Max Alightings
60
800
800
600
600
40
400
400
20
200
200
0
p
p
‐
s
Re
a
a
Ro
Th
M o
D
o
y ‐
p
ad
ace
o
0
rve ‐
0
y ‐
y ‐
e at
Sh
y Sh
e at
se
y Pl
Street
r St
p
p
‐
s
s
alley
Street
Ro
Street
Qua
Re
a
a
a
p
a
p
‐
Ba
Ba
e
n
Ro
Th
M o
D
o
y ‐
p
Re
Th
M o
D
o
p
‐20
d
V
d
rad Ba
rad
Re
na
ad
ace
o
Ro
ace
y ‐
o
rn
d
pore
e
illis
to
Late
y ‐
y ‐
rve ‐
ad
rve ‐
Pa
laid
m
e at
e at
Sh
y ‐
y ‐
e at
e at
Sh
lan
ve
lan
Pa
e
e
sin
urt
W
‐200
y Sh
Ro
se
y Pl
Street
r St
y Sh
se
y Pl
r St
e lan
anners
Ba
alley
Street
Ba
e
Street
Qua
‐200
alley
Street
Ro
Street
Street
Qua
Is
appy
Se
Is
rha
Ba
o
d
V
rad
n
Ba
Ba
e
n
H
Is
Th
Ad
C
M
rn
d
rad Ba
Re
na
rad
na
Th
e
Lamb
d
pore
e
illis
to
Late
d
V
rn
d
rad Ba
Re
d
pore
e
illis
to
Late
B
lan
ve
lan
Pa
Pa
laid
m
sin
lan
ve
lan
Pa
Pa
laid
m
sin
‐40
Is
e
e
W
appy
urt
e
e
urt
W
Se
Is
e lan
anners
e lan
anners
Is
Th
rha
Ba
o
Is
appy
Se
Is
Is
rha
Ba
o
‐400
H
Th
Ad
e
C
M
Lamb
H
Th
Th
Ad
e
C
M
Lamb
B
‐400
B
‐60
‐600
‐600
Board
Board
Board
Alight
Alight
Alight
Onboard
Onboard
‐80
‐800
‐800
R04 Outbound ‐ Average Thursday Boardings and Alightings
R04 Outbound ‐ Average Thursday Cumulative Boardings and Pro Rata Alightings
R04 Outbound ‐ Average Thursday Cumulative Boardings and Max Alightings
500
500
500
400
400
400
300
300
300
200
200
100
100
200
0
0
s
s
p
a
A
e
e
p
a
A
e
e
o
Re
Re
ad
re
re
Ro
o
ad
re
re
Ro
‐100
St
e at
St
y ‐
‐100
St
e at
St
y ‐
100
Ro
r St
n
Ro
r St
n
e
e
e
rad
alley
Ba
e
rad
alley
Ba
ish
iso
V
d
ish
iso
V
d
laid
Pa
b
laid
Pa
b
‐200
Earlier
e
e
o
rch
lan
Earlier
e
e
o
rch
lan
appy
Is
‐200
appy
Is
Ad
Th
Fr
Mu
H
Ad
Th
Fr
Mu
H
0
s
‐300
‐300
p
a
A
e
e
o
Re
ad
re
re
Ro
St
e at
St
y ‐
Ro
r St
n
e
e
alley
Ba
‐400
rad
Board
‐400
Board
‐100
Board
ish
iso
V
d
Alight
Alight
Earlier
laid
Pa
b
e
e
o
rch
lan
Alight
Is
Onboard
Onboard
appy
Ad
Th
Fr
H
‐500
‐500
Mu
R05 Inbound ‐ Average Thursday Boardings and Alightings
R05 Inbound ‐ Average Thursday Cumulative Boardings and Pro Rata Alightings
R05 Inbound ‐ Average Thursday Cumulative Boardings and Max Alightings
150
800
800
600
600
100
400
400
50
200
200
0
0
0
g
g
g
at
at
y ‐
at
at
ace
ace
at
y ‐
at
at
ace
ace
at
at
illa
St
illa
ace
ace
y ‐
ad
ad
ad
V
ad
St
ad
illa
St
V
V
ad
School
y Pl
y Pl
Street
Qua
ton
‐200
School
y Pl
y Pl
Street
Qua
ton
‐200
School
y Pl
y Pl
Street
Qua
ton
a Ro
na
na
n
a Ro
aitai
a Ro
a Ro
na
na
n
a Ro
n
e
e
aitai
‐50
to
e
e
aitai
a Ro
na
na
aitai
ap
to
lling
aitai
ap
to
to
lling
aitai
ap
e
e
to
p
urt
urt
e
p
Hat
anners
urt
urt
e
p
to
lling
Hat
anners
Hat
urt
urt
e
Hat
o
o
W
Hat
o
o
Wai
W
Hat
anners
C
C
M
Wai
Lamb
C
C
M
Lamb
Wai
o
o
W
Wai
‐400
Wai
‐400
Wai
C
C
M
Lamb
‐100
‐600
‐600
Board
Board
Board
Alight
Alight
Alight
Onboard
Onboard
‐150
‐800
‐800
R05 Outbound ‐ Average Thursday Boardings and Alightings
R05 Outbound ‐ Average Thursday Cumulative Boardings and Pro Rata Alightings
R05 Outbound ‐ Average Thursday Cumulative Boardings and Max Alightings
200
500
500
400
400
150
300
300
200
200
100
100
100
50
0
0
at
‐
g
at
at
‐
g
y ‐
y ‐
at
St
ace
illa
St
ace
illa
‐100
V
‐100
V
ton
Qua
Street
y Pl
School
ton
Qua
y Pl
School
n
na
Street
n
Street
na
Street
0
to
e
aitai
e
aitai
lling
illis
rie
aitai
lling
to
illis
rie
aitai
‐
g
‐200
e
W
urt
Pi
Hat
‐200
e
W
urt
Pi
Hat
at
y ‐
at
W
o
Hat
W
o
Hat
St
ace
illa
Lamb
C
Lamb
C
V
ton
Qua
Street
y Pl
School
‐300
‐300
n
na
Street
‐50
e
aitai
lling
to
illis
rie
aitai
e
W
urt
Pi
Hat
W
o
C
Hat
‐400
Lamb
Board
‐400
Board
Board
Alight
Alight
Alight
Onboard
Onboard
‐100
‐500
‐500
R06 Inbound ‐ Average Thursday Boardings and Alightings
R06 Inbound ‐ Average Thursday Cumulative Boardings and Pro Rata Alightings
R06 Inbound ‐ Average Thursday Cumulative Boardings and Max Alightings
30
300
300
20
200
200
10
0
100
100
n
s
s
s
p
p
a
g
‐
at
y ‐
p
Hu
e at
o
o
ad
illa
ace
o
‐10
y ‐
Sh
V
y Pl
r St
Driv
y Sh
Ro
Street
Qua
Street
Street
na
n
l Ba
on
l Ba
aitai
e
illis
to
Late
0
0
ilt
rie
Hat
Pi
urt
anners
W
n
s
s
Lyal
Kilbirnie
a
g
‐
s
n
s
s
s
‐20
Lyal
am
o
p
p
at
y ‐
p
p
p
a
g
‐
at
Queens
H
C
M
Lamb
o
o
ace
o
y ‐
p
Hu
e at
ad
illa
Hu
e at
o
o
ad
illa
ace
o
y ‐
Sh
V
y Sh
Ro
y Pl
Street
Qua
r St
y ‐
Sh
V
y Pl
r St
Driv
Street
n
Driv
y Sh
Ro
Street
Qua
Street
na
Street
Street
on
na
n
‐30
‐100
l Ba
l Ba
aitai
e
illis
to
Late
‐100
l Ba
on
ilt
rie
l Ba
aitai
e
ilt
rie
illis
to
Late
Hat
Pi
urt
anners
W
W
Lyal
Lyal
Kilbirnie
am
o
Lyal
Kilbirnie
Hat
Pi
urt
anners
Queens
H
C
M
Lamb
Queens
Lyal
am
o
H
C
M
Lamb
‐40
‐200
‐200
‐50
Board
Board
Board
Alight
Alight
Alight
Onboard
Onboard
‐60
‐300
‐300
R06 Outbound ‐ Average Thursday Boardings and Alightings
R06 Outbound ‐ Average Thursday Cumulative Boardings and Pro Rata Alightings
R06 Outbound ‐ Average Thursday Cumulative Boardings and Max Alightings
100
400
400
80
300
300
60
200
200
40
100
100
20
0
0
at
‐
g
s
s
p
C
p
n
at
‐
g
s
s
n
y ‐
y ‐
p
C
p
St
ace
illa
o
at
o
Hu
St
ace
illa
o
at
o
Hu
V
Sh
V
y Pl
Sh
0
‐100
ton
Qua
Street
ad
y Sh
y ‐
‐100
ton
Qua
y Pl
ad
y Sh
y ‐
n
na
n
Street
na
at
‐
g
s
C
s
n
to
e
aitai
Ro
l Ba
e
aitai
Ro
illis
l Ba
y ‐
p
p
lling
u
l Ba
lling
to
illis
u
l Ba
St
ace
illa
o
o
Hu
e
W
at
urt
p
e
W
Hat
e
urt
p
Hat
e
V
Sh
W
o
Kilbirnie
Lyal
Lyal
W
o
Kilbirnie
Lyal
Lyal
‐20
ton
Qua
Street
y Pl
ad
y Sh
y ‐
‐200
Lamb
C
On
‐200
Lamb
C
On
n
na
e
aitai
Ro
l Ba
lling
to
illis
u
l Ba
e
W
urt
p
Hat
e
W
o
Kilbirnie
Lyal
Lyal
‐40
Lamb
C
On
‐300
‐300
Board
Board
Board
Alight
Alight
Alight
Onboard
Onboard
‐60
‐400
‐400
R07 Inbound ‐ Average Thursday Boardings and Alightings
R07 Inbound ‐ Average Thursday Cumulative Boardings and Pro Rata Alightings
R07 Inbound ‐ Average Thursday Cumulative Boardings and Max Alightings
250
1500
1500
200
1000
1000
150
100
500
500
50
0
0
0
s
e
g
a
‐
‐
s
at
er
e
g
a
‐
‐
at
er
s
g
‐
‐
p
rar
y ‐
p
rar
y ‐
p
e
a
y ‐
at
er
o
b
illa
ad
St
o
Av
Av
b
illa
ad
St
o
rar
Av
b
illa
ad
St
‐50
Sh
n
Li
V
n
Ro
Sh
n
Li
V
n
Street
Street
Qua
ton
n
n
Ro
Qua
Sh
n
Li
V
n
n
n
ly
ly
n
ly
n
Street
Street
gto
n
ton
n
n
n
Ro
Street
Street
Qua
ton
ria Univ
gto
ly
ly
ria Univ
gto
ly
ly
n
n
in
illis
illis
to
‐500
in
ly
illis
illis
to
‐500
ria Univ
in
ly
illis
illis
to
gsto
lling
cto
gsto
lling
‐100
rook
W
W
e
W
W
e
cto
gsto
lling
rook
rook
rook
rook
rook
W
W
e
cto
Kin
B
B
rook
Vi
B
W
Kin
B
B
rook
Vi
Lamb
B
Wash
Lamb
W
Kin
B
B
rook
W
Vi
Wash
Wash
B
Lamb
‐150
‐1000
‐1000
‐200
Board
Board
Board
Alight
Alight
Alight
Onboard
Onboard
‐250
‐1500
‐1500
R07 Outbound ‐ Average Thursday Boardings and Alightings
R07 Outbound ‐ Average Thursday Cumulative Boardings and Pro Rata Alightings
R07 Outbound ‐ Average Thursday Cumulative Boardings and Max Alightings
400
2000
2000
1500
1500
300
1000
1000
200
500
500
100
0
0
at
‐
a
g
e
s
at
‐
g
s
y ‐
rar
p
y ‐
a
rar
e
p
St
ad
illa
b
Av
o
St
ad
illa
b
o
V
Li
n
V
Av
Li
n
‐500
ton
Qua
Street
Ro
n
n
Sh
‐500
n
ton
Qua
Ro
n
n
Sh
n
ria Street
n
ly
ly
gto
n
Street
ria Street
n
ly
n
ly
ly
ly
gto
0
lling
to
illis
cto
in
lling
to
illis
in
e
W
‐
g
rook
gsto
e
W
cto
s
rook
rook
gsto
rook
at
y ‐
a
rar
e
p
W
Vi
rook
B
B
Kin
W
Vi
rook
B
B
B
Kin
St
ad
illa
b
Av
o
‐1000
Lamb
Wash
‐1000
Lamb
B
Wash
V
Li
n
ton
Qua
Ro
n
n
Sh
n
Street
ria Street
n
ly
ly
gto
n
‐100
ly
lling
to
illis
in
e
W
cto
gsto
Vi
rook
rook
‐1500
‐1500
W
rook
B
B
Lamb
B
Kin
Board
Board
Wash
Board
Alight
Alight
Alight
Onboard
Onboard
‐200
‐2000
‐2000
R08 Inbound ‐ Average Thursday Boardings and Alightings
R08 Inbound ‐ Average Thursday Cumulative Boardings and Pro Rata Alightings
R08 Inbound ‐ Average Thursday Cumulative Boardings and Max Alightings
80
500
500
400
400
60
300
300
40
200
200
20
100
100
0
0
0
M
a
g
a
‐
‐
at
M
a
g
a
‐
‐
at
M
a
g
‐
‐
rar
y ‐
rar
y ‐
rar
a
y ‐
at
b
illa
ad
St
b
illa
ad
St
b
illa
ad
St
rk ‐
Li
V
‐100
rk ‐
Li
V
‐100
rk ‐
Li
V
‐20
n
n
Ro
Street
Street
Qua
ton
n
n
Ro
Street
Street
Qua
ton
n
n
Ro
Qua
ton
ell Street
a Street
ly
ly
n
n
ell Street
a Street
ly
ly
n
n
ell Street
Street
Street
ly
ly
n
n
ai Pa
ly
to
ai Pa
ly
illis
illis
illis
illis
to
ai Pa
a Street
ly
h
tch
lling
h
tch
lling
h
tch
illis
illis
to
lling
w
rep
rook
rook
W
W
e
‐200
w
rep
rook
rook
W
W
e
‐200
w
rep
rook
W
W
e
Mi
B
B
rook
Mi
Ka
W
Ka
B
B
rook
W
Mi
rook
B
rook
Ko
B
Lamb
Ko
B
Lamb
Ko
Ka
B
B
Lamb
W
‐40
‐300
‐300
‐60
‐400
Board
‐400
Board
Board
Alight
Alight
Alight
Onboard
Onboard
‐80
‐500
‐500
R08 Outbound ‐ Average Thursday Boardings and Alightings
R08 Outbound ‐ Average Thursday Cumulative Boardings and Pro Rata Alightings
R08 Outbound ‐ Average Thursday Cumulative Boardings and Max Alightings
150
600
600
400
400
100
200
200
50
0
0
at
3
5
7
9
1
3
5
7
9
1
3
5
7
9
1
3
at
3
5
7
9
1
3
5
7
9
1
3
5
7
9
1
3
St
t0
t0
t0
t0
t1
t1
t1
t1
t1
t2
t2
t2
t2
t2
t3
t3
St
t0
t0
t0
t0
t1
t1
t1
t1
t1
t2
t2
t2
t2
t2
t3
t3
0
Ou
Ou
Ou
Ou
Ou
Ou
Ou
Ou
Ou
Ou
Ou
Ou
Ou
Ou
Ou
Ou
Ou
Ou
Ou
Ou
Ou
Ou
Ou
Ou
Ou
Ou
Ou
Ou
Ou
Ou
Ou
Ou
ton
ton
at
‐
g
y ‐
a
a
M
‐200
‐200
St
ad
illa
lling
lling
V
rk ‐
e
e
ton
Qua
Street
Ro
n
W
W
n
ria Street
n
ly
ly
a Street
ai Pa
lling
to
illis
h
‐50
e
W
cto
rook
rep
w
W
Vi
rook
B
B
Ka
Ko
‐400
‐400
Lamb
Board
Board
Board
Alight
Alight
Alight
Onboard
Onboard
‐100
‐600
‐600
R09 Inbound ‐ Average Thursday Boardings and Alightings
R09 Inbound ‐ Average Thursday Cumulative Boardings and Pro Rata Alightings
R09 Inbound ‐ Average Thursday Cumulative Boardings and Max Alightings
80
400
400
60
300
300
40
200
200
20
100
100
0
‐
‐
rm
D
at
0
0
St
Te
at
‐
‐
‐
‐
‐20
rm
D
at
rm
D
at
Street
Street
ton
at
St
at
St
Te
Te
illis
illis
Street
Street
lling
‐100
Street
Street
ton
o
‐100
Street
Street
ton
o
W
W
e
‐40
Ar
W
Street
illis
illis
Ar
Street
illis
illis
Street
o
lling
Street
o
lling
o
W
W
e
o
W
W
e
Ar
W
Ar
Ar
W
‐200
‐200
Ar
‐60
‐300
‐300
‐80
Board
Board
Board
Alight
Alight
Alight
Onboard
Onboard
‐100
‐400
‐400
R09 Outbound ‐ Average Thursday Boardings and Alightings
R09 Outbound ‐ Average Thursday Cumulative Boardings and Pro Rata Alightings
R09 Outbound ‐ Average Thursday Cumulative Boardings and Max Alightings
120
300
300
100
200
200
80
60
100
100
40
0
0
at
‐
E
at
‐
20
y ‐
rm
y ‐
E
rm
St
at
St
at
Te
Te
ton
Qua
Street
ton
Qua
n
ria Street
n
Street
ria Street
0
‐100
to
illis
Street
‐100
lling
cto
o
Street
lling
to
illis
Street
e
W
‐
o
e
W
cto
o
Street
o
at
y ‐
E
rm
W
Vi
Ar
W
Vi
Ar
St
at
Lamb
Ar
Lamb
Ar
‐20
Te
ton
Qua
n
Street
ria Street
to
illis
Street
‐200
‐200
lling
e
W
cto
o
Street
o
‐40
W
Vi
Ar
Lamb
Ar
Board
Board
Board
Alight
Alight
Alight
Onboard
Onboard
‐60
‐300
‐300
R10 Inbound ‐ Average Thursday Boardings and Alightings
R10 Inbound ‐ Average Thursday Cumulative Boardings and Pro Rata Alightings
R10 Inbound ‐ Average Thursday Cumulative Boardings and Max Alightings
150
800
800
600
600
100
400
400
50
200
200
0
0
0
e
i
e
i
i
s ‐
at
s ‐
at
s ‐
e
at
rk ‐
p
re
ers
rk ‐
p
re
ers
o
St
St
rk ‐
p
re
ers
o
o
St
St
St
St
Pa
n
Sh
rd
Street
Street
ton
‐200
Pa
n
Sh
rd
Street
Street
ton
‐200
Pa
n
Sh
Street
Street
ton
n
o
aki Street
n
o
y Univ
aki Street
n
rd
y Univ
o
y Univ
aki Street
‐50
tow
lling
tow
lling
tow
tow
ran
e
tow
ran
e
tow
lling
iddif
asse
anners
anners
iddif
asse
anners
anners
iddif
ran
e
R
Ta
W
R
Ta
W
R
asse
anners
anners
Ta
W
New
M
M
M
New
‐400
New
M
M
M
New
‐400
New
M
M
M
New
‐100
‐600
‐600
Board
Board
Board
Alight
Alight
Alight
Onboard
Onboard
‐150
‐800
‐800
R10 Outbound ‐ Average Thursday Boardings and Alightings
R10 Outbound ‐ Average Thursday Cumulative Boardings and Pro Rata Alightings
R10 Outbound ‐ Average Thursday Cumulative Boardings and Max Alightings
350
800
800
300
600
600
250
400
400
200
200
200
150
100
0
0
i
i
at
‐
s ‐
at
‐
y ‐
y ‐
s ‐
St
ers
p
o
rk ‐
St
ers
p
o
rk ‐
50
‐200
ton
Qua
Street
Street
Sh
Pa
n
‐200
ton
Qua
Street
Pa
n
n
n
Street
Sh
n
y Univ
y Univ
n
lling
to
illis
tow
lling
to
illis
tow
0
e
W
tow
e
W
anners
asse
anners
tow
asse
i
W
W
at
‐
s ‐
‐400
Lamb
M
M
y ‐
New
New
‐400
Lamb
M
M
New
New
St
ers
p
rk ‐
‐50
o
ton
Qua
Street
Pa
n
Street
Sh
n
y Univ
n
lling
to
illis
tow
‐600
‐600
‐100
e
W
anners
tow
asse
Board
Board
W Board
Lamb
M
M
New
Alight
Alight
New
Alight
Onboard
Onboard
‐150
‐800
‐800
R11 Inbound ‐ Average Thursday Boardings and Alightings
R11 Inbound ‐ Average Thursday Cumulative Boardings and Pro Rata Alightings
R11 Inbound ‐ Average Thursday Cumulative Boardings and Max Alightings
400
2500
2500
2000
2000
300
1500
1500
200
1000
1000
100
500
500
0
0
0
e
s
e
i
‐
e
s
e
i
‐
s
i
ge
rk
p
s ‐
sp
at
ge
rk
p
s ‐
sp
at
ge
rk
e
p
e
s ‐
sp
‐
at
rk ‐
re
o
re
p
ers
rk ‐
re
o
re
p
ers
o
St
St
rk ‐
re
o
re
p
ers
illa
Pa
Pa
o
St
St
St
Ho
‐500
illa
St
Pa
Sh
Sh
St
Ho
‐500
illa
Pa
o
V
re
Street
Pa
V
re
Street
Pa
St
Sh
St
Ho
‐100
n
n
o
Sh
Street
ton
n
n
o
Sh
Street
ton
n
V
re
Sh
Street
Street
ton
u
u
n
ton
u
y Univ
u
n
ton
y Univ
u
n
o
u
n
ton
table
illis
table
illis
table
y Univ
illis
ato
ato
thm
tow
lling
ato
thm
lling
lling
ns
lling
W
e
‐1000
ato
ns
tow
lling
aledonia
o
e
asse
anners
anners
W
e
‐1000
ato
ato
thm
ns
tow
lling
W
e
Se
Se
Kilbirnie
W
Se
asse
C
C
Se
aledonia
e
M
C
Kilbirnie
o
W
Se
asse
anners
C
Stra
W
M
M
Se
aledonia
Kilbirnie
o
e
Stra
W
M
Stra
C
C
M
W
‐200
New
New
New
W
M
‐1500
‐1500
‐300
‐2000
Board
‐2000
Board
Board
Alight
Alight
Alight
Onboard
Onboard
‐400
‐2500
‐2500
R11 Outbound ‐ Average Thursday Boardings and Alightings
R11 Outbound ‐ Average Thursday Cumulative Boardings and Pro Rata Alightings
R11 Outbound ‐ Average Thursday Cumulative Boardings and Max Alightings
600
2500
2500
2000
2000
500
1500
1500
400
1000
1000
300
500
500
200
0
0
i
s
i
at
100
s ‐
p
rk
at
s
y ‐
y ‐
s ‐
p
rk
St
ers
p
o
o
rk ‐
St
ers
p
o
rk ‐
‐500
Pa
‐500
o
Pa
Sh
Pa
Sh
ton
Qua
Street
Sh
re
o
n
ton
Qua
Street
re
Pa
n
n
u
n
Sh
o
n
y Univ
y Univ
n
u
0
lling
to
thm
lling
to
i
s
‐1000
e
tow
ato
‐1000
e
thm
ato
anners
at
rk
asse
anners
tow
asse
y ‐
s ‐
p
W
Kilbirnie
Se
W
Kilbirnie
Se
St
ers
p
o
rk ‐
Lamb
M
M
Stra
Lamb
M
M
o
Pa
New
New
Stra
‐100
Sh
ton
Qua
Street
Sh
re
Pa
o
n
‐1500
‐1500
n
y Univ
n
u
lling
to
e
tow
thm
ato
‐200
anners
asse
W
Kilbirnie
M
M
Se
Stra
‐2000
Lamb
Board
‐2000
Board
New
Board
Alight
Alight
Alight
Onboard
Onboard
‐300
‐2500
‐2500
R13 Inbound ‐ Average Thursday Boardings and Alightings
R13 Inbound ‐ Average Thursday Cumulative Boardings and Pro Rata Alightings
R13 Inbound ‐ Average Thursday Cumulative Boardings and Max Alightings
35
150
150
30
100
100
25
20
50
50
15
10
0
0
‐
a
a
‐
a
a
ace
y ‐
illa
ad
ace
y ‐
illa
ad
V
ad
ad
V
ad
ad
5
Ro
Norw
Norw
y Pl
Street
Street
nd
Ro
‐
y Pl
Qua
Street
Street
Ro
Street
Street
Qua
nd
Ro
‐
na
n
re
nd
o
ke Ro
gi
gi
na
n
re
nd
ke Ro
gi
gi
‐50
e
illis
to
hla
‐50
e
hla
ro
illis
to
o
hla
m
m
hla
ro
0
urt
anners
W
n
b
iran
iran
urt
W
n
b
iran
iran
o
e
Nort
m
o
anners
e
Nort
‐
C
M
a
a
Lamb
Gl
Nort
Ma
Ma
C
M
m
Lamb
Gl
Nort
Ma
Ma
y ‐
illa
ad
Pe
Pe
ace
ad
ad
‐5
V
Norw
y Pl
Street
Street
Ro
Street
Qua
nd
Ro
‐
n
re
nd
‐100
gi
gi
‐100
na
e
ke Ro
illis
to
o
hla
m
hla
ro
‐10
urt
anners
W
n
b
iran
iran
Board
Board
o
e
C Bo M
Nort
m
ard
Lamb
Gl
Nort
Ma
Ma
Alight
Alight
Pe
Alight
Onboard
Onboard
‐15
‐150
‐150
R13 Outbound ‐ Average Thursday Boardings and Alightings
R13 Outbound ‐ Average Thursday Cumulative Boardings and Pro Rata Alightings
R13 Outbound ‐ Average Thursday Cumulative Boardings and Max Alightings
40
200
200
30
150
150
20
100
100
10
50
50
0
0
0
a
a
ar
‐
a
a
ar
‐
a
a
ar
‐
ad
illa
y ‐
ace
ad
illa
y ‐
y ‐
ad
ad
ad
V
ad
ace
ad
ad
illa
V
ad
ace
Norw
ctu
Norw
ctu
Norw
V
Ro
n
Street
Ro
y Pl
n
Street
Ro
ctu
‐
Ro
nd
y Pl
n
Street
‐10
Qua
Street
‐50
‐
Ro
nd
Qua
Street
‐50
‐
Ro
nd
Qua
Street
y Pl
gi
gi
nd
Sa
en
n
na
gi
gi
nd
ke Ro
Sa
en
n
na
gi
gi
ke Ro
ke Ro
nd
en
n
hla
w
e
hla
to
illis
w
e
hla
Sa
na
ro
hla
ro
hla
to
illis
hla
w
to
illis
e
iran
iran
b
W
iran
iran
Bo
urt
b
W
iran
iran
ro
Bo
arori
urt
b
Bo
W
arori
urt
m
Nort
K
o
m
Nort
K
o
m
Nort
arori
K
o
‐20
Ma
Ma
Nort
C
Pe
Lamb
‐100
Ma
Ma
Nort
C
Pe
Lamb
‐100
Ma
Ma
Nort
C
Pe
Lamb
‐30
‐150
‐150
Board
Board
Board
Alight
Alight
Alight
Onboard
Onboard
‐40
‐200
‐200
R17 Inbound ‐ Average Thursday Boardings and Alightings
R17 Inbound ‐ Average Thursday Cumulative Boardings and Pro Rata Alightings
R17 Inbound ‐ Average Thursday Cumulative Boardings and Max Alightings
400
800
800
600
600
300
400
400
200
200
200
100
0
0
rk
K
ge
er
re
at
rk
K
ge
er
re
at
0
Pa
ll ‐
illa
ce at
St
St
Pa
ll ‐
illa
ce at
St
St
rk
K
ge
er
re
at
‐200
th
Ma
V
rra
ton
‐200
th
Ma
V
or
rra
ton
Pa
ll ‐
St
St
arori
en
ria Univ
arori
en
ria Univ
or
illa
ce at
K
Te
sw
K
Te
th
lling
sw
Ma
V
ton
arori
rsd
cto
e
e
e
arori
e
e
lling
‐100
rra
or
K
K
rsd
cto
e
arori
en
ria Univ
Vi
Th
W
Vi
Th
W
K
Te
Ma
e
sw
lling
‐400
Mol
‐400
Ma
Mol
arori
e
K
rsd
cto
e
Ma
Vi
Th
W
Mol
‐200
‐600
‐600
Board
Board
Board
Alight
Alight
Alight
Onboard
Onboard
‐300
‐800
‐800
R17 Outbound ‐ Average Thursday Boardings and Alightings
R17 Outbound ‐ Average Thursday Cumulative Boardings and Pro Rata Alightings
R17 Outbound ‐ Average Thursday Cumulative Boardings and Max Alightings
1000
1500
1500
800
1000
1000
600
500
500
400
200
0
0
at
er
ar
K
K
at
at
rk
at
er
ar
rk
St
at
at
ce at
ctu
ll ‐
Pa
St
ll ‐
Pa
n
ad
ad
ce at
ctu
ad
ad
0
ton
n
rra
Sa
Ro
Ma
Ro
ton
Ma
arori
rra
Sa
Ro
Ro
K
rk
‐500
ria Univ
ria Univ
arori
at
er
ar
lling
Te
K
‐500
Te
K
at
at
e
e
cto
lling
e
St
ll ‐
Pa
arori
arori
arori
ctu
K
arori
e
cto
ce at
arori
arori
arori
arori
n
ad
ad
W
Th
Vi
K
K
K
K
W
Th
Vi
K
K
K
‐200
ton
rra
Ro
Ma
Ro
ria Univ
Sa
arori
lling
Te
K
e
e
cto
arori
arori
arori
K
arori
‐1000
K
K
‐1000
W
Th
Vi
K
‐400
Board
Board
Board
Alight
Alight
Alight
Onboard
Onboard
‐600
‐1500
‐1500
R18 Inbound ‐ Average Thursday Boardings and Alightings
R18 Inbound ‐ Average Thursday Cumulative Boardings and Pro Rata Alightings
R18 Inbound ‐ Average Thursday Cumulative Boardings and Max Alightings
800
2000
2000
1500
1500
600
1000
1000
400
500
500
200
0
0
s
e
i
K
s
i
p
s ‐
er
a
er
rk
p
s ‐ e
er
a
er
K
rk
0
o
p re
ers
ad
at
o
p re
ers
o
ll ‐
Pa
ad
at
ll ‐
s
i
St
St
ad
e
K
St
o St
ad Pa
p
s ‐
er
a
er
rk
‐500
Sh rd
Street
re
at
s Ro
Ma
‐500
Sh
Street
o
p
ers
n
ad
ll ‐
o
e
Ro arori
n rd
Ma
o
Pa
y Univ
ria Univ
ria Univ
o
s Ro
Ro
y Univ
e
arori
St
St
ad
nee
n
K
nee
ria Univ
n
ria Univ
K
Street
Earlier
Sh rd
Ma
tow
cto
cto
arori
Earlier
s Ro
ssi
arori
tow
Ro
iddif
‐200
n o
asse
e
huz
K
iddif
cto
ssi
cto
arori
arori
y Univ
ria Univ
ria Univ
arori
R
Vi
e
Vi
K
R
asse
huz
Vi
e
Vi
K
K
nee
n
K
G
‐1000
M
Earlier
New
M
‐1000
M
G
arori
New
M
tow iddif
cto
ssi
cto
arori
R
asse
huz
Vi
e
Vi
K
K
M
G
New
M
‐400
‐1500
‐1500
Board
Board
Board
Alight
Alight
Alight
Onboard
Onboard
‐600
‐2000
‐2000
R18 Outbound ‐ Average Thursday Boardings and Alightings
R18 Outbound ‐ Average Thursday Cumulative Boardings and Pro Rata Alightings
R18 Outbound ‐ Average Thursday Cumulative Boardings and Max Alightings
250
1500
1500
200
1000
1000
150
100
500
500
50
0
0
i
s
i
rk
K
0
er
ar
er
s ‐
p
s ‐
rli
rk
K
s
at
at
p
o
p
at
er
at
ar
er
s ‐
s ‐
rli
ers
p
p
o
p
i
s
Pa
ll ‐
K
ctu
o
o
Da
Pa
ll ‐
ers
ad
ad
ctu
o
o
Da
rk
er
at
ar
er
s ‐
p
s ‐
rli
n
Sh
n
Sh
at
ll ‐
ers
p
o
p
Ma
Street
Sh
r ‐
Ma
Street
Sh
r ‐
Pa
ad
ctu
o
o
Da
arori
Ro
r Sh
ria Univ
Street
Sa
ria Univ
y Univ
n
arori
Ro
Street
Sa
n
r Sh
‐50
n
Street
Sh
‐500
K
nee
‐500
K
ria Univ
ria Univ
nee
y Univ
Ma
Sh
r ‐
arori
Ro
Street
Sa
n
r Sh
arori
arori
cto
ipps
cto
tow
ria Univ
ria Univ
y Univ
rama
rama
arori
arori
cto
ipps
cto
tow
rama
K
nee
K
K
Vi
G
arori
Vi
huz
asse
Kilbirnie
K
K
K
Mi
Vi
G
arori
rama
K
Vi
huz
asse
G
rama
M
G
Kilbirnie
arori
Mi
M
Mi
arori
cto
ipps
cto
tow
New
New
Mi
rama
‐100
K
K
Vi
G
arori
asse
K
Vi
huz
Kilbirnie
G
M
Mi
New
Mi
‐1000
‐1000
‐150
Board
Board
Board
Alight
Alight
Alight
Onboard
Onboard
‐200
‐1500
‐1500
R20 Inbound ‐ Average Thursday Boardings and Alightings
R20 Inbound ‐ Average Thursday Cumulative Boardings and Pro Rata Alightings
R20 Inbound ‐ Average Thursday Cumulative Boardings and Max Alightings
150
500
500
400
400
100
300
300
200
200
50
100
100
0
0
0
in
s
H
er
at
‐
p
in
s
ge
H
ge
er
at
‐
p
in
H
s
y ‐
y ‐
ge
er
at
‐
ace
o
ace
o
y ‐
ace
p
rm
at
St
rm
at
illa
illa
St
rm
at
St
o
‐100
‐100
illa
Te
ad
V
ton
Qua
Street
y Pl
r St
Te
ad
V
ton
Qua
Street
y Pl
r St
Te
ad
V
ton
Qua
Street
y Pl
r St
ria Univ
n
na
ria Univ
n
na
ria Univ
n
na
‐50
a Ro
to
illis
e
Late
a Ro
e
lburn
lling
lling
to
illis
Late
a Ro
e
n
lburn
lling
to
illis
Late
e
cto
e
W
urt
‐200
n
e
cto
e
W
urt
‐200
n
lburn
e
cto
e
W
urt
ighbury
K
Vi
W
o
ighbury
K
Vi
W
o
ighbury
K
Vi
W
o
H
Lamb
C
H
Moa
Moa
Lamb
C
H
Moa
Lamb
C
‐300
‐300
‐100
‐400
Board
‐400
Board
Board
Alight
Alight
Alight
Onboard
Onboard
‐150
‐500
‐500
R20 Outbound ‐ Average Thursday Boardings and Alightings
R20 Outbound ‐ Average Thursday Cumulative Boardings and Pro Rata Alightings
R20 Outbound ‐ Average Thursday Cumulative Boardings and Max Alightings
250
800
800
200
600
600
150
400
400
100
200
200
50
0
0
0
r
‐
r
(
‐
r
in
(
at
er
D
in
(
‐
ge
at
er
D
in
ad
ace
ad
ad
ace
ge
ad
at
er
ge
D
ad
ad
ace
St
at
rm
St
at
rm
St
ce at
illa
ce at
illa
ce at
illa
at
rm
‐50
ria Te Ro
Ro
y Pl
ria Te Ro
V
ad
Ro
y Pl
ria Te Ro
Street
ton
rra
Te
‐200
Street
ton
rra
V
ad
Te
‐200
Ro
y Pl
Street
ton
rra
V
ad
Te
cto
er
na
ria Univ
cto
er
na
ria Univ
cto
er
na
ndra
e
illis
Te
ndra
e
a Ro
illis
Te
ndra
e
ria Univ
Vi
lling
e
lburn
Vi
lling
n
e
allis
lburn
a Ro
Vi
illis
Te
a Ro
W
e
cto
allis
‐100
urt
e
W
e
cto
n
allis
lling
e
urt
e
urt
W
e
cto
lburn
e
n
Mt lexa
P
o
W
Th
Vi
K
ighbury
Mt lexa
P
o
W
Th
Vi
K
ighbury
Mt lexa
P
o
W
Th
Vi
K
ighbury
A
C
Moa
H
‐400
A
C
Moa
H
‐400
A
C
Moa
H
‐150
‐600
‐600
‐200
Board
Board
Board
Alight
Alight
Alight
Onboard
Onboard
‐250
‐800
‐800
R21 Inbound ‐ Average Thursday Boardings and Alightings
R21 Inbound ‐ Average Thursday Cumulative Boardings and Pro Rata Alightings
R21 Inbound ‐ Average Thursday Cumulative Boardings and Max Alightings
300
800
800
250
600
600
200
400
400
150
200
200
100
0
0
s
‐
B
s
p
a
y ‐
y ‐
p
‐
a
B
o
o
y ‐
y ‐
ll ‐
ll ‐
St
Street
Street
Street
St
Street
Street
Street
Street
Street
50
‐200
Street
Qua
Qua
Street
n
Ma
‐200
Street
Street
Qua
Qua
Street
n
n
re
n
n
re
Street
n
Ma
o
ie
o
o
illis
to
to
ood
h
pbell
illis
to
to
o
ood
ie
Earlier
m
yd
arori
Earlier
m
h
yd
pbell
anners
W
n
e
o
K
anners
W
n
arori
irdw
Dut
am
e
o
irdw
Cr
Dut
K
M
C
Cr
am
0
‐400
Lamb
Lamb
Gl
B
‐400
M
Lamb
Lamb
Gl
B
C
s
p
‐
a
B
o
y ‐
y ‐
ll ‐
St
Street
Street
Street
‐50
Street
Street
Qua
Qua
Street
Street
Ma
‐600
n
‐600
n
n
re
o
ood
ie
o
Board
Board
illis
to
to
Earlier Board
m
h
yd
pbell
arori
Alight
Alight
anners
W
n
e
o
Alight
irdw
Dut
K
Cr
am
Onboard
Onboard
‐100
M
Lamb
Lamb
Gl
B
C
‐800
‐800
R21 Outbound ‐ Average Thursday Boardings and Alightings
R21 Outbound ‐ Average Thursday Cumulative Boardings and Pro Rata Alightings
R21 Outbound ‐ Average Thursday Cumulative Boardings and Max Alightings
100
600
600
500
50
400
400
300
0
200
B
e
a
ar
‐
s
re
y ‐
p
o
200
ll ‐
St
ctu
Street
Street
n
Street
Ma
r St
Street
Qua
Street
Street
Sa
en
n
‐50
amp
iers
ie
w
to
illis
Late
0
h
100
pbell
arori
ch
rv
K
e
arori
Bo
W
anners
B
e
a
V
am
ar
‐
s
au
Dut
K
y ‐
p
e
C
Lamb
M
ll ‐
re
o
B
St
ctu
Street
Street
n
Street
0
Ma
r St
Street
Qua
Street
Street
Sa
en
n
B
e
a
amp
iers
ie
ar
‐
s
‐100
‐200
w
to
illis
y ‐
p
Late
ch
rv
pbell
h
ll ‐
re
o
arori
e
arori
Bo
W
anners
‐100
St
ctu
K
am
Street
Street
n
Street
au
V
e
C
Dut
K
M
Ma
Street
r St
Lamb
Street
Qua
n
Street
B
amp
iers
ie
Sa
en
w
rv
pbell
h
to
illis
Late
‐200
arori
ch
K
e
Bo
W
au
V
am
arori
anners
‐150
‐400
e
C
Dut
K
M
B
Lamb
Board
‐300
Board
Board
Alight
Alight
Alight
Onboard
Onboard
‐200
‐600
‐400
R22 Inbound ‐ Average Thursday Boardings and Alightings
R22 Inbound ‐ Average Thursday Cumulative Boardings and Pro Rata Alightings
R22 Inbound ‐ Average Thursday Cumulative Boardings and Max Alightings
150
1500
1500
100
1000
1000
50
500
500
0
0
0
p
t
a
e
‐
a
p
t
er
a
e
‐
a
p
t
e
‐
Do
o
n
at
y ‐
ge
illa
ad
Do
o
n
at
er
re
ace
re
ace
y ‐
ge
illa
ad
Do
o
n
at
a
er
a
re
y ‐
ge
illa
ad
ad
rve ‐
ce at
illa
V
ad
Norw
ad
rve ‐
V
ad
rve ‐
ace
ad
y ‐
sce
St
Ro
y ‐
sce
St
ce at
illa
Ro
Norw
y ‐
ad
ce at
illa
V
y Sh
e
se
y Pl
Street
V
y Sh
Qua
nd
‐
e
se
y Pl
Street
V
l Street
nd
‐
y Sh
sce
St
Norw
rd
Street
rra
l Street
Street
Qua
e
se
y Pl
Street
V
Ro
Street
rd
nd
‐
Ba
u
n
nd
gi
Ba
Street
o
na
u
Ba
d
Re
ke Ro
o
na
n
rra
nd
gi
Ba
Street
l Street
rd
Street
Qua
rra
d
e
ria Univ
hla
d
Ba
d
Re
ria Univ
hla
ke Ro
Ba
d
u
o
Re
na
n
nd
ke Ro
gi
‐50
d
y Cr
to
illis
to
Te
‐500
d
y Cr
to
e
illis
to
Te
‐500
d
hla
ro
hla
d
y Cr
ria Univ
ro
to
e
illis
to
Te
hla
n
sin
e
lburn
e
lburn
hla
iran
n
sin
ro
lan
ch
ckley Ro
urt
W
cto
e
b
lan
ch
ckley Ro
lan
iddif
anners
iddif
urt
W
cto
e
b
iran
lan
ch
ckley Ro
n
sin
W
e
cto
lburn
b
iran
Is
Ri
R
Ba
o
Th
Vi
K
Nort
m
Is
lan
Ri
Lavau
R
Ba
o
anners
Th
Vi
K
Nort
m
Is
lan
Ri
iddif
urt
anners
e
Is
Or
Bu
C
M
Is
Ma
Or
Nort
Bu
Lavau
Lamb
C
M
Nort
Ma
Is
Lamb
Or
Bu
Lavau
R
Ba
o
Th
Vi
C
M
K
Nort
m
Lamb
Nort
Ma
Pe
Pe
Pe
‐100
‐1000
‐1000
Board
Board
Board
Alight
Alight
Alight
Onboard
Onboard
‐150
‐1500
‐1500
R22 Outbound ‐ Average Thursday Boardings and Alightings
R22 Outbound ‐ Average Thursday Cumulative Boardings and Pro Rata Alightings
R22 Outbound ‐ Average Thursday Cumulative Boardings and Max Alightings
200
1000
1000
800
800
150
600
600
400
400
100
200
200
50
0
0
a
a
er
t
a
s ‐
a
ge
at
n
at
Do
ge
er
t
ad
illa
y ‐
y ‐
s ‐
at
n
at
Do
ad
ad
ace
rve ‐
p
ad
ad
illa
V
ad
ace
o
ad
ad
V
rve ‐
p
‐200
Norw
Ro
illa
ce at
sce
y ‐
‐200
Norw
o
Ro
illa
ce at
ad
sce
ad
y ‐
‐
Ro
nd
V
Qua
Street
y Pl
se
Sh
l Street
e
‐
Ro
nd
V
Qua
Street
y Pl
se
rra
Sh
l Street
e
gi
gi
nd
n
na
n
u
e Ro
Ba
gi
gi
rra
ke Ro
ria Univ
Re
d
ke Ro
nd
n
n
u
Ba
hla
0
e
hla
ria Univ
na
e Ro
to
y Cr
e
Re
d
ro
hla
Te
to
ro
hla
Te
to
to
y Cr
t
‐400
iran
iran
b
lburn
e
ros
e
cto
urt
sin
tow
n
ckley Ro
ch
lan
‐400
iran
iran
b
lburn
e
ros
a
a
anners
e
cto
urt
sin
tow
n
ckley Ro
ch
lan
illa
ge
er
y ‐
s ‐
at
n
at
Do
m
Nort
K
Vi
Th
o
Ba
Ri
Is
Nort
K
Vi
Th
anners
o
Ba
Ri
Is
ad
ad
ace
p
Ma
Ma
Nort
ad
Lamb
M
C
Bu
Or
Mel
Ma
Ma
m
Nort
M
C
Bu
Or
Mel
Norw
V
illa
ce at
rve ‐
o
ad
ad
Pe
New
Pe
Lamb
New
Ro
sce
y ‐
‐
Ro
nd
V
Street
y Pl
se
e
nd
rra
Qua
Sh
l Street
Ba
‐600
‐600
gi
gi
ke Ro
n
na
Re
n
u
e Ro
‐50
hla
ria Univ
d
hla
Te
to
e
to
y Cr
iran
iran
ro
b
lburn
e
sin
n
ros
e
cto
urt
tow
ckley Ro
ch
lan
Nort
K
Vi
Th
anners
o
Ba
Ri
Is
Ma
Ma
m
Nort
M
C
Bu
Or
Mel
‐800
Lamb
Board
‐800
Board
Pe
New
Board
Alight
Alight
Alight
Onboard
Onboard
‐100
‐1000
‐1000
R23 Inbound ‐ Average Thursday Boardings and Alightings
R23 Inbound ‐ Average Thursday Cumulative Boardings and Pro Rata Alightings
R23 Inbound ‐ Average Thursday Cumulative Boardings and Max Alightings
150
1500
1200
1000
100
1000
800
50
600
500
400
0
s
p
e
‐
er
a
o
(n
ad
re
ace
y ‐
at
ad
0
rve ‐
ad
200
St
ad
Ro
Zoo
St
se
ad
Ro
Norw
s
d
rd
y Pl
Street
Street
Qua
‐
p
e
‐
er
a
‐50
y Ro
ton
o
na
n
Ro
nd
gi
o
(n
ad
re
y ‐
at
ad
Re
ria Univ
ke Ro
rve ‐
ace
ad
se
rlan
e
illis
to
nd
hla
ro
St
ad
Ro
Zoo
St
Earlier
e
lling
sin
se
ad
Ro
Norw
0
d
y Pl
rn
e
iddif
urt
anners
W
cto
b
iran
ton
rd
Street
Street
Qua
‐
th
n
Ro
nd
o
gi
s
R
Ba
Vi
m
y Ro
o
Re
na
ria Univ
ke Ro
W
Upla
p
e
‐
er
a
Ho
Su
C
M
Lamb
Nort
Ma
‐500
se
rlan
e
illis
to
nd
hla
Pe
ro
o
(n
ad
re
y ‐
at
ad
Earlier
e
lling
sin
rve ‐
ace
ad
rn
‐100
th
e
iddif
urt
anners
W
cto
b
iran
‐200
Zoo
St
ad
Ro
ad
Norw
Ba
o
Vi
m
d
St
se
Ro
W
R
M
Upla
rd
y Pl
Street
Street
Qua
‐
Ho
Su
C
Lamb
Nort
Ma
y Ro
ton
o
Pe
Re
na
n
ria Univ Ro
nd
ke Ro
gi
se
rlan
e
e
illis
to
nd
hla
ro
‐400
Earlier
lling
rn
sin
th
e
iddif
urt
W
cto
b
iran
R
Ba
o
anners
Vi
m
‐1000
Ho
Su
W
C
M
Lamb
Upla
Nort
Ma
‐150
Pe
Board
‐600
Board
Board
Alight
Alight
Alight
Onboard
Onboard
‐200
‐1500
‐800
R23 Outbound ‐ Average Thursday Boardings and Alightings
R23 Outbound ‐ Average Thursday Cumulative Boardings and Pro Rata Alightings
R23 Outbound ‐ Average Thursday Cumulative Boardings and Max Alightings
100
1000
1000
800
800
80
600
600
60
400
400
40
200
200
20
0
0
a
a
0
er
a
s ‐
a
ge
ad at
at
(n
Do
ge er
illa
y ‐
y ‐
s ‐
ad at
at
(n
Do
ad
ad
ace
rve ‐
p
Tw
ad
illa
V
ad
ace
o
ad
ad
ad
V
rve ‐
p
Tw
a
a
er
s ‐
‐200
Norw
illa
Ro
ge
at
y ‐
‐200
Norw
illa
o
Ro ad
ad
ad
y ‐
illa
y ‐
ace
p
ad at
at
Tw
(n
Do
‐
Ro
nd
V
Qua
Street y Pl
se
Sh
d
‐
Ro
nd
V
at
Qua
Street y Pl
se
Sh
d
ad
ad
V
illa
rve ‐
o
ad
ad
ad
gi
gi
n
Norw
Ro
na
n
y Ro
y Ro
ad
Ba
gi
gi
y ‐
ke Ro
at
ria Univ
Re
d
ke Ro
n
n
ad
Ba
hla
‐20
y Pl
se
d
e
rlan
hla
ria Univ
na
y Ro
y Ro
‐
Ro
nd
V
Street
to
e
Re
d
Qua
Sh
ro
e se
se
Ro
ro
to
rlan
ad
lburn
e se
se
Ro
gi
gi
ke Ro
n
na
Re
n
y Ro
y Ro
Ba
‐400
iran
iran
b
ria Univ
e cto
urt
sin
tow
rn
rn
w
ckley Ro
lan
‐400
iran
iran
b
lburn
d
anners
hla
th
e cto
urt
sin
tow
rn
rn
w
ckley Ro
lan
to
e
rlan se
se
m
Nort
K Vi
o
Ba
e
Is
Nort
K Vi
anners o
Ba
th
e
Is
ro
lburn
sin
e
Ro
Ma
Ma
Lamb
M C
Su Ho
Ho
cto
Vi
Bu
Ma
Ma
m
M C
Bu
iran
iran
b
e
urt
tow
rn
rn
w
ckley Ro
lan
Pe
New
Pe
Lamb
New
Su Ho
Ho
Vi
‐40
m
Nort
K Vi
anners o
th
e
Is
Ma
Ma
Ba
Lamb
M C
Su Ho
Ho
Vi
Bu
‐600
‐600
Pe
New
‐60
‐800
Board
‐800
Board
Board
Alight
Alight
Alight
Onboard
Onboard
‐80
‐1000
‐1000
R24 Inbound ‐ Average Thursday Boardings and Alightings
R24 Inbound ‐ Average Thursday Cumulative Boardings and Pro Rata Alightings
R24 Inbound ‐ Average Thursday Cumulative Boardings and Max Alightings
250
800
800
200
600
600
150
400
400
100
200
200
50
0
t
G
s
s
W
p
rt
at
er
To
‐
e at
o
e
ace
y ‐ St
0
at
at
rd
Sh
venue
y Pl
t
0
‐200
ad
div
Street
Qua ton
G
s
s
fo
Driv
W
p
ra Street
rt
at
er
r A
ad
t
s
s
u
te
na
n
ria Univ
To
ace
y ‐
m
u
e
at
‐
e at
o
e
St
G
p
at
er
aw
W
o
to
o
rt
ace
y ‐
ay Ro
lling
venue
at
To
‐
e at
e
a Ro
ik
cto
ad
rd
Sh
St
Ro
e
div
y Pl
Street
urt
Qua ton
at
rama
Cr
bha
Kilbirnie
o
anners
Vi
‐200
rd
Sh
Ka
o
at
W
r A
ad
fo
ra Street
Driv
u
te
na
n
ria Univ
‐50
venue
ad
div
y Pl
Street
Qua ton
‐400
Aw
Nev
Mt
C
C
M
Lamb
aw
o
m
u
e
to
fo
Driv
Mi
ra Street
lling
r A
ad
te
na
n
ria Univ
a Ro
ay Ro
ik
u
Ro
e
cto
aw
o
m
u
e
to
rama
Cr
bha
urt
anners
lling
Ka
o
Kilbirnie
o
ay Ro
M
W
Vi
a Ro
Cr
ik
Ro
urt
anners
e
cto
Mi
Aw
Nev
Mt
C
C
Lamb
rama
bha
Kilbirnie
o
Vi
Aw
Nev
Ka
o
C
M
Lamb W
‐400
‐100
Mi
Mt
C
‐600
Board
Board
Board
Alight
Alight
Alight
Onboard
Onboard
‐150
‐800
‐600
R24 Outbound ‐ Average Thursday Boardings and Alightings
R24 Outbound ‐ Average Thursday Cumulative Boardings and Pro Rata Alightings
R24 Outbound ‐ Average Thursday Cumulative Boardings and Max Alightings
140
600
600
120
400
400
100
80
200
200
60
40
0
0
I
s
I
at
‐
e
p
G
at
‐
e
s
y ‐
rk ‐
at
y ‐
p
at
G
St
rad
t (N
o
e at
at
St
rk ‐
ad
rad
t (N
o
e at
at
20
in
Sh
in
ad
venue
Sh
ton
Qua
Street
gi Pa
Ro
ad
ton
Qua
ad
venue
n
ra Street
n
Street
gi Pa
Ro
a Driv
r A
a Driv
ra Street
tal Pa
u
r A
‐200
to
illis
tan
n
ta Po
o
‐200
tal Pa
u
lling
lling
to
illis
tan
n
ta Po
o
0
e
W
ie
e
aro
ik
ay Ro
e
W
ie
e
aro
ik
ay Ro
I
W
Wai
s
Or
Gr
Kilbirnie
aupuia
Ak
Ka
rama
W
Wai
Gr
Kilbirnie
aupuia
rama
‐
e
Lamb
Nev
Lamb
Or
Ak
Ka
at
p
G
M
at
Mi
M
Nev
Mi
y ‐
St
rk ‐
rad
t (N
o
e at
at
‐20
in
ad
Sh
ton
Qua
ad
venue
n
Street
gi Pa
Ro
ra Street
‐400
‐400
tal Pa
a Driv
u
r A
lling
to
illis
tan
n
ta Po
o
‐40
e
W
ie
e
aro
ik
ay Ro
Board
Board
W
Wai
Gr
Kilbirnie
aupuia
rama
Lamb
Board
Or
Ak
Ka
Nev
Alight
Alight
M
Mi
Alight
Onboard
Onboard
‐60
‐600
‐600
No R25 Inbound Data
No R25 Inbound Data
No R25 Inbound Data
R25 Outbound ‐ Average Thursday Boardings and Alightings
R25 Outbound ‐ Average Thursday Cumulative Boardings and Pro Rata Alightings
R25 Outbound ‐ Average Thursday Cumulative Boardings and Max Alightings
40
400
400
300
300
30
200
200
20
100
100
10
0
0
s
rk
B
e
a
p
a
g
‐
at at
er
rk
B
e
a
s
a
g
‐
at
at at
0
re
o
ace
y ‐
re
p
er
o
at
ace
y ‐
Pa
at
ad
ad
illa
St St
Pa
at
ad
ad
illa
St St
St
s
V
St
e
g
‐
Sh
rk
a
a
at at
y Pl
Sh
V
B
p
at
y ‐
er
‐100
re
Street
Ro
Street
Street
Qua
ton ton
‐100
re
Street
y Pl
re
ace
o
o
a Street
o
Street
n
a Street
Ro
Qua
illa
Street
ad
ad
St St
na
Street
Street
n
ton ton
Pa
at
w
tai Ro
on
aitai
e
ria Univ
w
tai Ro
on
aitai
na
St
V
to
e
ria Univ
illis
illis
to
re
Street
Sh
Ro
y Pl
Street
thm
Qua
huriri
ka
a Street
go
ilt
rie
lling lling
thm
Street
ton ton
cto
huriri
ka
a Street
go
ilt
rie
lling lling
‐10
o
a Street
Street
n
A
u
Ir
na
aledonia
n
Hat
Pi
urt
anners
W
e e
A
u
Ir
cto
tai Ro
on
ria Univ
Kilbirnie
aledonia
n
Hat
Pi
urt
anners
W
e e
w
aitai
e
C
am
o
illis
to
M
W W
Vi
C
Kilbirnie
am
o
W W
Vi
a Street
ilt
rie
lling lling
‐200
Stra
Ra
Ro
H
C
Lamb
‐200
Stra
Ra
Ro
H
C
M
Lamb
thm
huriri
ka
go
A
u
Ir
cto
aledonia
n
W
e e
Kilbirnie
Hat
Pi
urt
am
o
anners
Vi
Stra
Ra
C
Ro
H
C
M
Lamb
W W
‐20
‐300
‐300
Board
Board
Board
Alight
Alight
Alight
Onboard
Onboard
‐30
‐400
‐400
R30 Inbound ‐ Average Thursday Boardings and Alightings
R30 Inbound ‐ Average Thursday Cumulative Boardings and Pro Rata Alightings
R30 Inbound ‐ Average Thursday Cumulative Boardings and Max Alightings
100
500
500
400
400
80
300
300
60
200
200
40
100
100
20
0
0
s
p
rk
D
e
‐
at
s
rk
e
‐
at
o
ge
p
D
rk ‐
y ‐
ge
Cav
re
y ‐
at
ace
St
o
rk ‐
Cav
re
ace
St
‐100
St
illa
Pa
Pa
at
Pa
St
‐100
St
illa
St
0
n
V
re
y Pl
Street
Street
Qua
ton
Pa
V
re
y Pl
Street
Street
Qua
ton
u
n
o
n
u
ay at
na
n
n
ay at
o
n
s
e
‐
w
e
u
na
rk
at
illis
to
u
p
ge
D
y ‐
lling
w
e
illis
to
lling
o
rk ‐
Cav
re
ace
St
‐200
Earlier
ato
ato
ad
thm
a Street
urt
W
e
at
‐200
Earlier
ato
ato
ad
thm
a Street
urt
W
e
St
illa
Pa
St
Se
Ir
anners
Ir
anners
Se
o
aledonia
o
Se
o
aledonia
o
Pa
V
re
y Pl
Street
Qua
Br
Stra
C
C
M
Lamb
W
Se
W
‐20
Street
ton
Br
Stra
C
C
M
Lamb
n
u
n
o
u
ay at
na
n
w
e
illis
to
lling
‐300
‐300
Earlier
ato
ato
ad
thm
a Street
urt
W
e
Se
Ir
anners
Se
o
aledonia
C
o
W
‐40
Br
Stra
C
M
Lamb
‐400
Board
‐400
Board
Board
Alight
Alight
Alight
Onboard
Onboard
‐60
‐500
‐500
R30 Outbound ‐ Average Thursday Boardings and Alightings
R30 Outbound ‐ Average Thursday Cumulative Boardings and Pro Rata Alightings
R30 Outbound ‐ Average Thursday Cumulative Boardings and Max Alightings
80
400
400
60
300
300
40
200
200
20
100
100
0
at
‐
e
s
y ‐
y ‐
on
B
ge
p
0
0
St
ace
re
at
Cav
rk ‐
o
St
Dev
illa
Pa
at
‐
e
s
‐
e
s
‐20
Qua
Qua
y Pl
V
r St
y ‐
y ‐
on
B
ge
p
at
on
B
ge
p
ton
n
n
Street
ay at
n
n
St
ace
re
y ‐
y ‐
r ‐
at
Cav
rk ‐
o
ace
re
Cav
rk ‐
o
na
u
u
St
illa
St
at
to
to
illis
e
w
Dev
St
illa
lling
a Street
Late
‐100
ton
Qua
Qua
y Pl
V
Pa
r St
y Pl
Dev
V
Pa
r St
e
W
urt
ad
ato
ato
n
n
Street
n
‐100
ton
Qua
Qua
Ir
na
r ‐
ay at
n
u
n
n
Street
r ‐
ay at
n
n
‐40
o
aledonia
rama
o
Se
e
w
u
na
u
W
Se
e
u
Lamb
Lamb
C
C
Br
lling
to
to
illis
Late
to
to
illis
w
Late
Mi
e
W
a Street
lling
urt
a Street
Ir
ad
ato
ato
e
W
urt
Ir
ad
ato
ato
W
o
aledonia
rama
o
C
Se
Se
W
o
aledonia
rama
o
C
Se
Se
‐200
Lamb
Lamb
C
Mi
Br
‐200
Lamb
Lamb
C
Mi
Br
‐60
‐300
‐300
‐80
Board
Board
Board
Alight
Alight
Alight
Onboard
Onboard
‐100
‐400
‐400
R31 Inbound ‐ Average Thursday Boardings and Alightings
R31 Inbound ‐ Average Thursday Cumulative Boardings and Pro Rata Alightings
R31 Inbound ‐ Average Thursday Cumulative Boardings and Max Alightings
80
500
500
400
400
60
300
300
40
200
200
20
100
100
0
0
0
‐
‐
h
R
ad
rra
s ‐
y ‐
at
h
R
‐
h
Ro
p
ace
h
ad
rra
Ro
s ‐
at
R
at
p
ace
y ‐
h
ad
s ‐
o
St
St
h
rra
Ro
p
ace
y ‐
St
Ro
Te
at
‐100
Ro
Te
at
o
o
y Pl
Street
y Pl
Ro
Qua
Street
‐100
Te
at
y Pl
‐20
r Nort
ad
r Sh
n
ton
r Nort
Qua
Street
Qua
r Nort
ton
am
na
r Nort
ton
am
ad
r Sh
ton
ton
na
n
r Nort
r Nort
ton
am
ad
r Sh
na
n
rh
e
to
rh
e
to
e
lling
lling
rh
e
to
lling
rama
rling
rk Ro
rama
urt
e
‐200
e
anners
rama
e
rama
th
rama
rling
rk Ro
e
o
th
rama
urt
rk Ro
e
o
anners
‐200
rama
rama
rling
th
rama
urt
W
o
anners
Mi
Da
Pa
Mi
C
M
Lamb
Mi
W
W
‐40
Mi
Ro
Mi
Da
Pa
Ro
Mi
C
M
Lamb
Mi
Mi
Da
Pa
Ro
Mi
C
M
Lamb
‐300
‐300
‐60
‐400
Board
‐400
Board
Board
Alight
Alight
Alight
Onboard
Onboard
‐80
‐500
‐500
R31 Outbound ‐ Average Thursday Boardings and Alightings
R31 Outbound ‐ Average Thursday Cumulative Boardings and Pro Rata Alightings
R31 Outbound ‐ Average Thursday Cumulative Boardings and Max Alightings
80
400
400
300
300
60
200
200
40
100
100
20
0
0
at
‐
‐
y ‐
rra
ad
ad
R
h
at
rra
ad
ad
R
0
St
ace
y ‐
St
ace
h
Te
Ro
Ro
Te
Ro
Ro
at
‐
rra
ad
ad
R
‐100
ton
Qua
y Pl
venue
y Pl
venue
y ‐
ace
h
n
Street
‐100
ton
Qua
St
na
am
ton
ton
r Nort
n
Street
am
ton
ton
r Nort
Ro
Ro
e
r A
na
Te
e
r A
y Pl
venue
lling
to
illis
rh
to
illis
rh
ton
Qua
Street
e
W
lling
urt
e
rling
rling
e
‐20
n
am
ton
ton
r Nort
rama
e
W
urt
rling
rling
na
r A
W
o
rama
th
e
W
o
rama
th
rama
lling
to
illis
rh
‐200
Lamb
C
Da
Da
e
Mi
Ro
Mi
‐200
Lamb
C
Da
Da
Mi
Ro
Mi
e
W
urt
rling
rling
W
o
rama
th
rama
Lamb
C
Mi
Ro
Da
Da
Mi
‐40
‐300
‐300
Board
Board
Board
Alight
Alight
Alight
Onboard
Onboard
‐60
‐400
‐400
R32 Inbound ‐ Average Thursday Boardings and Alightings
R32 Inbound ‐ Average Thursday Cumulative Boardings and Pro Rata Alightings
R32 Inbound ‐ Average Thursday Cumulative Boardings and Max Alightings
60
400
400
50
300
300
40
200
200
30
100
100
20
10
0
0
(
p
(
p
y ‐
e
Th
H
o
T
a
y ‐
y ‐
at
e
Th
H
o
T
a
at
ad
ace
y ‐
y ‐
St
y ‐
ad
ace
St
0
Ba
ad
y ‐
e at
e at
Ba
ad
y ‐
e at
e at
‐100
y Sh
Ro
y Pl
Street
y Sh
y Pl
Street
(
p
on
lan
Ba
e
Qua
Qua
ton
‐100
lan
Ro
Qua
Qua
ton
e
Th
H
o
T
a
at
d
rad
Ba
rad
na
n
n
on
Ba
rad
rad
e
na
n
n
y ‐
ace
y ‐
y ‐
d
d
Ba
ad
St
Pa
e
to
to
d
e
to
to
‐10
Ba
ad
y ‐
e at
e at
ught
Esp
lan
Pa
e
laid
lling
Esp
lan
Pa
Pa
e
laid
lling
y Sh
Ro
y Pl
Street
o
e
Is
e
lan
e
urt
anners
e
ught
e
e
Qua
Qua
o
Is
e
lan
e
urt
anners
on
lan
Ba
rad
e
n
n
ton
H
Th
Th
Is
Th
o
W
Th
Is
Th
o
W
d
rad
Ba
na
‐200
Ad
C
M
Lamb
Lamb
H
Th
‐200
Ad
C
M
Lamb
Lamb
e
Esp
Pa
d
Pa
laid
to
to
lling
‐20
ught
e
lan
e
e
o
Is
e
lan
e
urt
anners
H
Th
Th
Is
Th
Ad
o
C
M
Lamb
Lamb
W
‐300
‐300
‐30
Board
Board
Board
Alight
Alight
Alight
Onboard
Onboard
‐40
‐400
‐400
R32 Outbound ‐ Average Thursday Boardings and Alightings
R32 Outbound ‐ Average Thursday Cumulative Boardings and Pro Rata Alightings
R32 Outbound ‐ Average Thursday Cumulative Boardings and Max Alightings
30
200
200
150
150
20
100
100
10
50
50
0
0
0
at
‐
a
T
p
H
at
‐
p
‐
p
y ‐
o
y ‐
y ‐
a
T
o
H
y ‐
at
a
T
o
H
ace
y ‐
St
ad
at
St
ace
ad
at
y ‐
ace
e
e at
Ba
e
St
ad
e at
Ba
e at
ate
Ba
ton
Qua
Street
y Pl
Ro
y Sh
‐50
ton
Qua
y Pl
Ro
y Sh
y Pl
Ro
y Sh
n
na
e
rad
rad
on
n
Street
‐50
ton
Qua
Ba
na
e
rad
rad
on
n
Street
e
rad
rad
on
‐10
to
e
d
e
Ba
na
illis
e
Ba
lling
laid
Pa
Pa
lling
to
illis
Pa
d
to
illis
Pa
d
e
W
urt
e
e
e
ught
e
W
laid
Pa
lling
laid
Pa
urt
e
e
lan
o
lan
e
ught
e
W
urt
e
e
e
ught
W
o
Th
Is
Th
W
o
H
Th
o
lan
Ad
Is
o
C
Th
H
W
o
Th
Is
Lamb
‐100
Lamb
C
Ad
Th
H
‐100
Lamb
C
Ad
‐20
‐150
‐150
Board
Board
Board
Alight
Alight
Alight
Onboard
Onboard
‐30
‐200
‐200
R45 Inbound ‐ Average Thursday Boardings and Alightings
R45 Inbound ‐ Average Thursday Cumulative Boardings and Pro Rata Alightings
R45 Inbound ‐ Average Thursday Cumulative Boardings and Max Alightings
80
250
250
200
200
60
150
150
100
100
40
50
50
20
0
0
a
l
a
a
ill
a
l
at
a
a
y ‐
y a
V
y ‐
at
y a
ill
St
ara R
Ro
Hal
h
St
Ro
Hal
V
‐50
Street
h
n
‐50
ara R
h
lla
Street
h
n
Qua
ton
Qua
rge
w
Qua
Qua
rge
w
lla
n
Street
Street
n
ton
Street
Street
0
to
araw
Go
To
ay
re
to
To
ay
re
lling
h
io
anda
lling
araw
Go
l
so
anda
a
‐100
a
ill
randon
e
io
lw
h
‐100
io
a
randon
e
h
io
lw
so
h
y ‐
at
y a
B
W
orndon
iw
Co
K
B
orndon
iw
K
St
Ro
Hal
V
Lamb
Nga
Nga
My
Lamb
W
Co
My
ara R
h
Th
Ka
Th
Ka
Nga
Nga
Street
h
n
Qua
ton
Qua
rge
w
lla
Street
Street
‐150
n
‐150
‐20
to
To
ay
re
lling
araw
Go
h
io
anda
randon
e
io
lw
so
h
B
W
orndon
iw
K
Nga
Co
My
‐200
Lamb
Nga
Board
‐200
Board
Th
Ka
Board
Alight
Alight
Alight
Onboard
Onboard
‐40
‐250
‐250
R45 Outbound ‐ Average Thursday Boardings and Alightings
R45 Outbound ‐ Average Thursday Cumulative Boardings and Pro Rata Alightings
R45 Outbound ‐ Average Thursday Cumulative Boardings and Max Alightings
50
400
400
300
300
0
i
d
F
ill
a
‐
s
e
at
y ‐
p
at
V
o
h
ara R
200
200
rm
ad
h
te
lla
Qua
r St
School
‐50
a In
a Ro
ay Street
io
anda
b
ya Street
araw
Late
h
ro
rm
h
m
n
orndon
100
100
K
Nga
iw
Ra
Ke
Bu
Bo
Ka
Th
‐100
0
0
i
s
i
d
F
ill
a
‐
p
d
F
ill
a
‐
s
e
V
at
y ‐
e
at
y ‐
p
at
o
at
V
o
rm
h
ara R
h
rm
h
ara R
ad
h
‐100
te
lla
Qua
r St
‐100
ad
te
lla
Qua
r St
School
School
‐150
a In
a Ro
ay Street
b
io
ya Street
araw
Late
a In
a Ro
ay Street
io
anda
h
anda
b
ya Street
araw
Late
n
h
ro
rm
h
m
ro
rm
h
n
K
Nga
Ke
iw
orndon
K
m
Nga
Ke
iw
orndon
‐200
Ra
Bu
Bo
Ka
Th
‐200
Ra
Bu
Bo
Ka
Th
‐200
‐300
‐300
Board
Board
Board
Alight
Alight
Alight
Onboard
Onboard
‐250
‐400
‐400
R46 Inbound ‐ Average Thursday Boardings and Alightings
R46 Inbound ‐ Average Thursday Cumulative Boardings and Pro Rata Alightings
R46 Inbound ‐ Average Thursday Cumulative Boardings and Max Alightings
30
250
250
200
200
20
150
150
10
100
100
0
50
50
e
n
s
‐
s ‐
a
a
O
at
(n
at
s ‐
lit
y a
y ‐
sce
ad
ad
s ‐
St
ace
ad
ad
e
sp
venue
m
‐10
dow
dow
te
A
Ro
Ro
Qua
ton
Qua
Street
y Pl
0
Cr
0
ea
Ro
Ro
ea
u
h
h
n
re
Ar
na
w
to
illis
e
e
n
s
a
a
O
‐
e
n
s
‐
nda
Ro
lling
s ‐
dm
dm
at
s ‐
lit
y a
at
y ‐
s ‐
a
a
O
at
me
ebus
ebus
e
W
urt
(n
la
slo
sce
ad
ad
s ‐
St
ace
(n
at
s ‐
lit
y a
y ‐
anpur
sce
ad
ad
s ‐
St
ace
anpur
m
m
orndon
W
o
‐50
roa
K
roa
C
ad
ad
e
sp
venue
m
‐50
ad
e
sp
K
Na
o
o
On
Lamb
dow
dow
Ro
Ro
‐20
Qua
B
B
Th
Qua
y Pl
dow
ad
dow
venue
m
Cash
H
H
Cr
te
A
ton
Street
te
y Pl
Ro
h
h
A
Ro
Ro
Qua
ton
Qua
Street
ea
Ro
ea
u
Ar
n
na
ea
Ro
Ro
Cr
ea
u
h
h
n
re
w
e
re
Ar
na
to
illis
w
e
dm
nda
dm
Ro
lling
nda
Ro
lling
to
illis
‐100
la
me
ebus
ebus
slo
e
W
urt
‐100
dm
dm
ebus
ebus
e
W
anpur
orndon
o
anpur
la
me
slo
anpur
m
m
orndon
urt
roa
K
K
W
Na
roa
o
o
On
Lamb
C
roa
anpur
K
roa
m
m
W
o
C
‐30
B
B
Th
B
K
Na
B
o
o
On
Lamb
Cash
H
H
Cash
H
H
Th
‐150
‐150
‐40
‐200
Board
‐200
Board
Board
Alight
Alight
Alight
Onboard
Onboard
‐50
‐250
‐250
R46 Outbound ‐ Average Thursday Boardings and Alightings
R46 Outbound ‐ Average Thursday Cumulative Boardings and Pro Rata Alightings
R46 Outbound ‐ Average Thursday Cumulative Boardings and Max Alightings
35
200
200
30
150
150
25
100
100
20
50
50
15
10
0
0
s
‐
O
e
‐
at
a
p
at
O
a
e
s
ace
y ‐
y a
(n
(n
at
ce
o
ace
y ‐
y a
(n
at
ce
p
St
s ‐
ad
St
s ‐
ad
(n
o
ad
ad
5
m
venue
ad
ad
rra
m
venue
ad
ad
rra
‐50
y Pl
Street
Street
Qua
ton
Qua
Ro
A
Ro
r St
‐50
y Pl
Street
Street
Qua
ton
Qua
Ro
A
r St
na
n
Ar
h
n
Ro
Ro
t Te
na
n
Ar
h
Ro
Ro
Ro
e
to
w
re
e
n
t Te
illis
Late
illis
to
re
lling
bus
lling
w
jko
bus
Late
0
urt
anners
W
e
slo
e
me
atio
urt
W
e
e
me
atio
jko
o
orndon
St
anpur
anpur
Ra
o
anners
slo
W
m
‐
e
s
K
W
orndon
m
St
anpur
anpur
C
M
K
Ra
at
O
a
(n
p
‐100
Lamb
Th
On
o
K
‐100
C
M
Lamb
Th
On
o
K
ace
y ‐
y a
at
ce
o
H
Cash
H
Cash
St
s ‐
ad
(n
‐5
ad
ad
y Pl
rra
Street
m
venue
ad
Street
Qua
ton
Qua
Ro
A
r St
na
n
Ar
h
Ro
Ro
Ro
e
n
t Te
illis
to
re
lling
w
Late
‐150
‐150
bus
‐10
urt
jko
anners
W
e
slo
e
me
atio
Board
Board
o
orndon
anpur
C
M
Ra
Board
Lamb
W
m
St
anpur
On
o
K
K
Alight
Alight
Th
H
Cash
Alight
Onboard
Onboard
‐15
‐200
‐200
R47 Inbound ‐ Average Thursday Boardings and Alightings
R47 Inbound ‐ Average Thursday Cumulative Boardings and Pro Rata Alightings
R47 Inbound ‐ Average Thursday Cumulative Boardings and Max Alightings
100
300
300
200
200
50
100
100
0
l
i
St
F
ill
a
ar
er
V
ers
ille
at
h
ad
Hal
n
ctu
0
n
0
ad
lla
Street
Street
e Ro
w
l
i
l
i
onv
n
Sa
ria Univ
y Univ
ce
St
F
ill
a
ar
er
To
St
F
ill
a
ar
er
a Ro
nee
V
ers
V
anda
at
ad
ers
io
cto
alla
ille
h
Hal
‐50
h
n
ctu
ille
at
h
ad
Hal
ctu
Johns
rm
K
ckay
arori
huz
asse
ad
Vi
W
lla
K
w
n
Street
Street
ad
n
lla
w
n
Street
Street
Bu
Co
Nga
G
M
onv
e Ro
Sa
ce
onv
e Ro
n
ria Univ
y Univ
Sa
ce
‐100
a Ro
To
nee
‐100
ria Univ
a Ro
n
To
y Univ
anda
io
anda
nee
rm
h
arori
cto
alla
h
io
cto
alla
Johns
K
ckay
K
Vi
huz
asse
W
Johns
rm
K
ckay
arori
Vi
huz
asse
W
Bu
Co
Nga
G
M
Bu
K
Co
Nga
G
M
‐100
‐200
‐200
Board
Board
Board
Alight
Alight
Alight
Onboard
Onboard
‐150
‐300
‐300
R47 Outbound ‐ Average Thursday Boardings and Alightings
R47 Outbound ‐ Average Thursday Cumulative Boardings and Pro Rata Alightings
R47 Outbound ‐ Average Thursday Cumulative Boardings and Max Alightings
100
400
400
80
300
300
60
200
200
40
20
100
100
0
i
l
e
a
ill
t
0
er
ar
0
n
St
nc
ers
V
i
l
Hal
i
l
‐20
ctu
h
ille
e
n
er
ar
a
ill
t
sce
St
e
n
er
ar
a
ill
t
n
n
St
Street Street
w
lla
e
nc
ers
l Da
Hal
V
h
nc
ers
V
ctu
Sa
onv
n
ille
ctu
Hal
h
y Univ
ria Univ
To
ay Street
Cr
Street Street
n
lla
sce
e
n
n
sce
ille
nee nee
‐100
l Da
w
‐100
l Da
Street Street
w
lla
e
‐40
tiona
cto
io
b
anda
h
y Univ
ria Univ
Sa
onv
asse
arori
m
To
anui
ay Street
Cr
y Univ
Sa
onv
huz huz
nee nee
K
Johns
nee nee
ria Univ
To
ay Street
Cr
Na
Vi
K
R
io
b
anda
b
M
G G
Nga
Bo
tiona
cto
h
tiona
io
anda
asse
huz huz
arori
m
K
anui
Johns
asse
cto
Vi
huz huz
arori
m
h
anui
‐60
Na
M
G G
K
Nga
Bo
R
Na
K
Johns
G G
Vi
K
R
‐200
‐200
M
Nga
Bo
‐80
‐300
‐300
‐100
Board
Board
Board
Alight
Alight
Alight
Onboard
Onboard
‐120
‐400
‐400

Greater Wellington Regional Council
Wellington City Bus Review
Appendix D
Mapping of Boardings and Alighting: Go Wel ington
Wellington City Bus Review FINAL
24 November 2011
Map 2.6:
Go Wellington: Thursday Boardings and Alightings
Services prior to 8:30am. Average of Six Weeks.
Pie Chart of ThursdaysAM
900
450
90
Boardings
Alightings
Train Lines
Bus Routes and Stops
Map 2.7:
Go Wellington: Thursday Boardings and Alightings
Services prior to 8:30am. Average of Six Weeks.
Pie Chart of ThursdaysAM
850
425
85
Boardings
Alightings
Train Lines
Bus Routes and Stops
Map 2.8:
Go Wellington: Thursday Boardings and Alightings
Services between 10:00am and 12:30pm. Average of Six Weeks.
Pie Chart of ThursdaysMid
800
400
80
Boardings
Alightings
Train Lines
Bus Routes and Stops
Map 2.9:
Go Wellington: Thursday Boardings and Alightings
Services between 10:00am and 12:30pm. Average of Six Weeks.
Pie Chart of ThursdaysMid
850
425
85
Boardings
Alightings
Train Lines
Bus Routes and Stops

Greater Wellington Regional Council
Wellington City Bus Review
Appendix E
Boardings by Time of Day and Day of Week, by Route: Mana
Wellington City Bus Review FINAL
24 November 2011
Average Boardings per Route per Hour
ROUTE 211
ROUTE 50
ROUTE 52
M
Tu
W
Th
F
Sa
Su
M
Tu
W
Th
F
Sa
Su
M
Tu
W
Th
F
Su
Su
0500 - 0600
0.0
0.0
0.0
0.0
0.0
0500 - 0600
0.0
0.0
0.0
0.0
0.0
0500 - 0600
0.0
0.0
0.0
0.1
0.0
0.0
0.0
0600 - 0700
0.0
0.0
0.0
0.0
0.0
0600 - 0700
0.0
0.0
0.0
0.0
0.0
0600 - 0700
31.3
32.3
34.0
33.0
31.7
3.4
0.0
0700 - 0800
9.0
14.1
9.9
11.4
11.6
0700 - 0800
0.0
0.0
0.0
0.0
0.0
0700 - 0800
0.1
0.0
0.0
0.0
0.0
21.9
0.0
0800 - 0900
17.1
24.9
21.1
14.1
11.7
0800 - 0900
0.0
0.3
0.0
0.0
0.1
0800 - 0900
52.9
42.9
34.3
52.4
59.9
35.6
17.6
0900 - 1000
24.3
20.7
21.3
24.9
23.1
0900 - 1000
5.0
3.6
5.9
5.0
4.1
0900 - 1000
90.9 104.7 106.1 112.7 90.7
34.3
28.6
1000 - 1100
13.9
13.0
11.1
16.6
14.1
1000 - 1100
2.9
7.1
5.9
5.3
4.3
1000 - 1100
65.4
74.1
72.9
82.1
87.0
54.7
29.0
1100 - 1200
14.3
17.0
21.7
17.4
17.3
1100 - 1200
6.0
4.0
6.6
5.4
4.9
1100 - 1200
65.4
66.0
76.6
75.6
69.6
56.1
37.6
1200 - 1300
16.4
21.9
17.7
20.3
20.3
1200 - 1300
6.3
5.4
5.7
7.9
6.1
1200 - 1300
69.7
75.3
69.0
80.0
74.7
64.4
40.3
1300 - 1400
14.0
15.4
17.0
22.1
16.1
1300 - 1400
4.4
5.1
5.1
5.9
3.4
1300 - 1400
70.3
85.1
79.3
84.1
88.1
56.6
36.0
1400 - 1500
22.7
25.3
26.4
25.3
20.4
1400 - 1500
4.3
4.4
3.1
4.7
6.1
1400 - 1500
97.0 101.9 100.1 108.6 113.6 64.1
31.9
1500 - 1600
92.1
84.0
79.6
72.7
92.4
1500 - 1600
5.0
7.6
5.9
6.1
4.9
1500 - 1600
178.9 178.7 190.3 179.7 185.1 68.0
38.6
1600 - 1700
2.0
2.1
3.0
4.1
4.1
1600 - 1700
5.1
2.9
1.7
3.7
4.6
1600 - 1700
111.6 101.9 105.7 119.7 119.4 63.0
49.3
1700 - 1800
0.0
0.0
0.0
0.0
0.0
1700 - 1800
0.0
0.0
0.0
0.0
0.0
1700 - 1800
20.9
30.6
35.0
27.7
37.0
66.9
34.1
1800 - 1900
0.0
0.0
0.0
0.0
0.0
1800 - 1900
0.0
0.0
0.0
0.0
0.0
1800 - 1900
61.0
50.4
59.0
68.6
72.4
60.6
33.9
1900 - 2000
0.0
0.0
0.0
0.0
0.0
1900 - 2000
0.0
0.0
0.0
0.0
0.0
1900 - 2000
58.6
57.1
61.0
60.0
71.6
28.7
17.9
2000 - 2100
0.0
0.0
0.0
0.0
0.0
2000 - 2100
0.0
0.0
0.0
0.0
0.0
2000 - 2100
36.3
42.9
40.1
50.1
52.6
26.9
19.9
2100 - 2200
0.0
0.0
0.0
0.0
0.0
2100 - 2200
0.0
0.0
0.0
0.0
0.0
2100 - 2200
19.6
20.6
21.6
22.9
25.4
23.7
8.9
2200 - 2300
0.0
0.0
0.0
0.0
0.0
2200 - 2300
0.0
0.0
0.0
0.0
0.0
2200 - 2300
14.9
19.3
17.7
23.9
35.7
17.6
11.4
2300 - 2400
0.0
0.0
0.0
0.0
0.0
2300 - 2400
0.0
0.0
0.0
0.0
0.0
2300 - 2400
7.4
9.4
13.3
16.0
26.9
15.9
1.7
350
350
350
300
300
300
250
250
250
200
200
200
150
150
150
100
100
100
50
50
50
0
0
0
‐…
‐…
‐…
‐…
‐…
‐…
‐…
‐…
‐…
‐…
‐…
‐…
‐…
‐…
‐…
‐…
‐…
‐…
‐…
‐…
‐…
‐…
‐…
‐…
‐…
‐…
‐…
‐…
‐…
‐…
‐…
‐…
‐…
‐…
‐…
‐…
‐…
‐…
‐…
‐…
‐…
‐…
‐…
‐…
‐…
‐…
‐…
‐…
‐…
‐…
‐…
‐…
‐…
‐…
‐…
‐…
‐…
0500
0600
0700
0800
0900
1000
1100
1200
1300
1400
1500
1600
1700
1800
1900
2000
2100
2200
2300
0500
0600
0700
0800
0900
1000
1100
1200
1300
1400
1500
1600
1700
1800
1900
2000
2100
2200
2300
0500
0600
0700
0800
0900
1000
1100
1200
1300
1400
1500
1600
1700
1800
1900
2000
2100
2200
2300
Wellington City
City Bus
Bus Review
Average Boardings per Route per Hour
ROUTE 53
ROUTE 54
ROUTE 55
M
Tu
W
Th
F
Sa
Su
M
Tu
W
Th
F
Sa
Su
M
Tu
W
Th
F
Su
Su
0500 - 0600
0.0
0.0
0.0
0.0
0.0
0.0
0500 - 0600
17.7
21.4
20.0
18.4
20.0
0.0
0.0
0500 - 0600
0.0
0.0
0.0
0.0
0.0
0.0
0.0
0600 - 0700
26.9
23.0
28.4
26.4
24.0
0.0
0600 - 0700
97.9 108.3 107.7 117.0 100.1
0.0
0.0
0600 - 0700
33.7
40.4
44.0
39.6
38.9
0.0
0.0
0700 - 0800
108.7 114.6 110.1 127.4 107.1
0.0
0700 - 0800
329.0 334.3 349.0 337.1 305.0 18.3
0.0
0700 - 0800
172.6 176.9 169.7 179.7 163.1
2.9
0.0
0800 - 0900
70.3
75.9
80.1
64.0
66.7
0.3
0800 - 0900
151.7 147.9 131.4 148.9 139.7 41.6
16.6
0800 - 0900
89.9
93.7
90.6 102.1 96.7
7.3
2.4
0900 - 1000
10.1
6.9
7.3
6.3
4.9
2.7
0900 - 1000
111.6 123.1 115.9 123.9 110.4 60.0
30.7
0900 - 1000
37.1
50.3
41.6
47.0
43.1
3.9
5.4
1000 - 1100
3.0
5.3
5.0
6.6
2.6
2.7
1000 - 1100
75.4
81.1
82.7
86.1
82.3
69.1
30.7
1000 - 1100
24.9
33.6
30.0
32.9
27.6
4.4
4.1
1100 - 1200
5.3
5.0
2.7
4.7
3.7
5.3
1100 - 1200
75.0
78.4
76.4
82.6
78.3
71.6
36.9
1100 - 1200
23.0
24.6
29.7
29.0
29.4
6.7
5.7
1200 - 1300
4.1
4.9
6.4
6.4
7.1
4.0
1200 - 1300
74.1
72.7
75.9
80.3
76.0
87.4
38.9
1200 - 1300
32.1
28.9
33.7
34.1
30.3
5.1
5.0
1300 - 1400
6.4
11.0
9.1
8.7
9.4
4.9
1300 - 1400
84.3
95.1
90.1
90.0
84.4
74.7
36.7
1300 - 1400
27.4
26.6
32.6
32.3
33.6
6.7
6.1
1400 - 1500
7.4
6.7
5.3
6.4
6.0
2.6
1400 - 1500
98.4 123.7 126.3 121.0 115.4 76.7
40.6
1400 - 1500
30.1
34.4
33.1
39.7
33.3
4.4
4.4
1500 - 1600
8.1
8.4
6.9
8.1
6.4
3.7
1500 - 1600
205.1 209.9 203.6 205.0 213.4 83.9
36.0
1500 - 1600
55.6
54.9
58.6
62.0
56.6
6.0
5.0
1600 - 1700
37.9
32.4
33.6
36.0
27.0
2.3
1600 - 1700
288.4 301.1 307.9 306.7 270.3 79.0
41.1
1600 - 1700
85.7
73.4
71.3
70.4
70.0
7.1
7.0
1700 - 1800
136.0 139.6 141.7 139.3 102.9
2.4
1700 - 1800
270.1 269.3 281.9 275.0 253.1 99.0
51.0
1700 - 1800
105.0 105.0 110.6 105.1 86.6
5.3
3.4
1800 - 1900
40.0
32.0
31.4
35.6
28.9
0.4
1800 - 1900
133.9 134.9 137.0 152.1 167.9 68.7
28.0
1800 - 1900
34.3
38.1
42.0
37.4
36.6
6.9
3.7
1900 - 2000
0.0
0.0
0.0
0.0
0.0
0.3
1900 - 2000
54.9
60.1
69.1
65.7
79.6
39.4
21.4
1900 - 2000
14.6
13.1
23.1
21.1
20.7
5.9
1.4
2000 - 2100
0.0
0.0
0.0
0.0
0.0
0.0
2000 - 2100
22.0
34.7
37.3
31.9
41.9
37.1
16.9
2000 - 2100
0.6
0.4
0.4
0.6
2.0
0.0
0.6
2100 - 2200
0.0
0.0
0.0
0.0
0.0
0.0
2100 - 2200
20.3
20.0
23.1
28.1
36.9
19.1
9.6
2100 - 2200
0.0
0.0
0.0
0.0
0.0
0.0
0.0
2200 - 2300
0.0
0.0
0.0
0.0
0.0
0.0
2200 - 2300
12.3
12.1
24.3
20.4
38.1
22.4
1.6
2200 - 2300
0.0
0.0
0.0
0.0
0.0
0.0
0.0
2300 - 2400
0.0
0.0
0.0
0.0
0.0
0.0
2300 - 2400
9.0
9.6
13.3
17.7
28.1
20.6
0.0
2300 - 2400
0.0
0.0
0.0
0.0
0.0
0.0
0.0
350
350
350
300
300
300
250
250
250
200
200
200
150
150
150
100
100
100
50
50
50
0
0
0
‐…
‐…
‐…
‐…
‐…
‐…
‐…
‐…
‐…
‐…
‐…
‐…
‐…
‐…
‐…
‐…
‐…
‐…
‐…
‐…
‐…
‐…
‐…
‐…
‐…
‐…
‐…
‐…
‐…
‐…
‐…
‐…
‐…
‐…
‐…
‐…
‐…
‐…
‐…
‐…
‐…
‐…
‐…
‐…
‐…
‐…
‐…
‐…
‐…
‐…
‐…
‐…
‐…
‐…
‐…
‐…
‐…
0500
0600
0700
0800
0900
1000
1100
1200
1300
1400
1500
1600
1700
1800
1900
2000
2100
2200
2300
0500
0600
0700
0800
0900
1000
1100
1200
1300
1400
1500
1600
1700
1800
1900
2000
2100
2200
2300
0500
0600
0700
0800
0900
1000
1100
1200
1300
1400
1500
1600
1700
1800
1900
2000
2100
2200
2300
Wellington City
City Bus
Bus Review
Average Boardings per Route per Hour
ROUTE 56
ROUTE 57
ROUTE 58
M
Tu
W
Th
F
Sa
Su
M
Tu
W
Th
F
Sa
Su
M
Tu
W
Th
F
Su
Su
0500 - 0600
0.0
0.0
0.0
0.0
0.0
0500 - 0600
0.0
0.0
0.0
0.0
0.0
0500 - 0600
0.0
0.0
0.0
0.0
0.0
0600 - 0700
22.1
24.6
26.6
24.1
25.7
0600 - 0700
38.0
40.4
38.7
37.6
33.9
0600 - 0700
16.6
19.9
19.0
19.0
17.6
0700 - 0800
134.7 131.1 127.0 129.0 121.3
0700 - 0800
163.3 190.3 188.6 176.4 173.6
0700 - 0800
173.7 167.9 163.1 176.1 163.9
0800 - 0900
105.4 95.4
86.6
78.6
81.1
0800 - 0900
92.6
86.7
77.0
89.0
82.0
0800 - 0900
73.0
92.9
90.7
90.9
82.1
0900 - 1000
0.4
0.7
0.7
0.0
0.0
0900 - 1000
20.7
14.3
21.9
17.0
13.3
0900 - 1000
0.0
0.4
1.0
0.0
0.0
1000 - 1100
0.0
0.0
0.0
0.0
0.0
1000 - 1100
0.1
0.0
0.0
0.0
0.0
1000 - 1100
0.0
0.0
0.0
0.0
0.0
1100 - 1200
0.0
0.0
0.0
0.0
0.0
1100 - 1200
0.0
0.0
0.0
0.0
0.0
1100 - 1200
0.0
0.0
0.0
0.0
0.0
1200 - 1300
0.0
0.0
0.0
0.0
0.0
1200 - 1300
0.0
0.0
0.0
0.0
0.0
1200 - 1300
0.0
0.0
0.0
0.0
0.0
1300 - 1400
0.0
0.0
0.0
0.0
0.0
1300 - 1400
0.0
0.0
0.0
0.0
0.0
1300 - 1400
0.0
0.0
0.0
0.0
0.0
1400 - 1500
0.0
0.0
0.0
0.0
0.1
1400 - 1500
0.0
0.0
0.0
0.0
0.0
1400 - 1500
0.0
0.0
0.0
0.0
0.0
1500 - 1600
0.0
0.0
0.0
0.0
0.0
1500 - 1600
0.0
0.1
0.0
0.0
0.0
1500 - 1600
0.0
0.0
0.0
0.0
0.0
1600 - 1700
73.0
82.4
72.3
76.7
64.7
1600 - 1700
61.4
58.7
55.4
64.1
51.4
1600 - 1700
53.3
59.6
51.6
55.7
43.6
1700 - 1800
106.9 96.4 103.4 103.4 84.9
1700 - 1800
138.7 145.9 128.4 139.0 111.0
1700 - 1800
143.0 139.9 127.6 124.1 104.4
1800 - 1900
23.3
24.6
25.6
31.3
21.6
1800 - 1900
15.3
16.3
15.7
17.0
14.1
1800 - 1900
23.1
26.7
27.9
23.9
22.4
1900 - 2000
0.0
1.4
0.0
0.0
0.0
1900 - 2000
0.0
0.0
0.0
0.0
0.0
1900 - 2000
0.0
0.0
0.0
0.0
0.0
2000 - 2100
0.0
0.0
0.0
0.0
0.0
2000 - 2100
0.0
0.0
0.0
0.0
0.0
2000 - 2100
0.0
0.0
0.0
0.0
0.0
2100 - 2200
0.0
0.0
0.0
0.0
0.0
2100 - 2200
0.0
0.0
0.0
0.0
0.0
2100 - 2200
0.0
0.0
0.0
0.0
0.0
2200 - 2300
0.0
0.0
0.0
0.0
0.0
2200 - 2300
0.0
0.0
0.0
0.0
0.0
2200 - 2300
0.0
0.0
0.0
0.0
0.0
2300 - 2400
0.0
0.0
0.0
0.0
0.0
2300 - 2400
0.0
0.0
0.0
0.0
0.0
2300 - 2400
0.0
0.0
0.0
0.0
0.0
350
350
350
300
300
300
250
250
250
200
200
200
150
150
150
100
100
100
50
50
50
0
0
0
‐…
‐…
‐…
‐…
‐…
‐…
‐…
‐…
‐…
‐…
‐…
‐…
‐…
‐…
‐…
‐…
‐…
‐…
‐…
‐…
‐…
‐…
‐…
‐…
‐…
‐…
‐…
‐…
‐…
‐…
‐…
‐…
‐…
‐…
‐…
‐…
‐…
‐…
‐…
‐…
‐…
‐…
‐…
‐…
‐…
‐…
‐…
‐…
‐…
‐…
‐…
‐…
‐…
‐…
‐…
‐…
‐…
0500
0600
0700
0800
0900
1000
1100
1200
1300
1400
1500
1600
1700
1800
1900
2000
2100
2200
2300
0500
0600
0700
0800
0900
1000
1100
1200
1300
1400
1500
1600
1700
1800
1900
2000
2100
2200
2300
0500
0600
0700
0800
0900
1000
1100
1200
1300
1400
1500
1600
1700
1800
1900
2000
2100
2200
2300
Wellington City
City Bus
Bus Review
Average Boardings per Route per Hour
ROUTE 60
M
Tu
W
Th
F
Su
Su
0500 - 0600
0.0
0.0
0.0
0.0
0.0
0600 - 0700
0.0
0.0
0.0
0.0
0.0
0700 - 0800
1.3
0.0
0.0
0.0
0.0
0800 - 0900
2.6
0.0
0.0
0.0
0.0
0900 - 1000
0.0
0.0
0.0
0.0
0.0
1000 - 1100
0.0
0.0
0.0
0.0
0.0
1100 - 1200
0.0
0.0
0.0
0.0
0.0
1200 - 1300
0.0
0.0
0.0
0.0
0.0
1300 - 1400
0.0
0.0
0.0
0.0
0.0
1400 - 1500
0.0
0.0
0.0
0.0
0.0
1500 - 1600
0.0
0.0
0.0
0.0
0.0
1600 - 1700
0.0
0.0
0.0
0.0
0.0
1700 - 1800
0.0
0.0
0.0
0.0
0.0
1800 - 1900
0.0
0.0
0.0
0.0
0.0
1900 - 2000
0.0
0.0
0.0
0.0
0.0
2000 - 2100
0.0
0.0
0.0
0.0
0.0
2100 - 2200
0.0
0.0
0.0
0.0
0.0
2200 - 2300
0.0
0.0
0.0
0.0
0.0
2300 - 2400
0.0
0.0
0.0
0.0
0.0
350
300
250
200
150
100
50
0
‐…
‐…
‐…
‐…
‐…
‐…
‐…
‐…
‐…
‐…
‐…
‐…
‐…
‐…
‐…
‐…
‐…
‐…
‐…
0500
0600
0700
0800
0900
1000
1100
1200
1300
1400
1500
1600
1700
1800
1900
2000
2100
2200
2300
Wellington City
City Bus
Bus Review
Average Boardings per Route per Hour
ROUTE 250CL
ROUTE 250IN
ROUTE 250JC
M
Tu
W
Th
F
Sa
Su
M
Tu
W
Th
F
Sa
Su
M
Tu
W
Th
F
Su
Su
0500 - 0600
0.0
0.0
0.0
0.0
0.0
0.0
0.0
0500 - 0600
0.0
0.0
0.0
0.0
0.0
0500 - 0600
0.0
0.0
0.0
0.0
0.0
0600 - 0700
0.0
0.0
0.0
0.0
0.0
0.0
0.0
0600 - 0700
16.9
18.0
18.6
17.6
15.7
0600 - 0700
0.0
0.0
0.0
0.0
0.0
0700 - 0800
3.6
2.6
2.4
1.4
2.3
4.3
1.7
0700 - 0800
23.4
22.7
21.3
21.9
26.9
0700 - 0800
0.0
0.0
0.0
0.0
0.0
0800 - 0900
61.7
60.6
72.4
29.9
66.3
8.0
2.7
0800 - 0900
8.6
11.1
9.0
6.0
10.7
0800 - 0900
9.6
0.0
0.0
0.7
0.0
0900 - 1000
17.6
20.4
16.0
35.1
17.6
10.4
8.0
0900 - 1000
0.0
0.0
0.0
0.0
0.0
0900 - 1000
0.0
0.0
0.0
0.0
0.0
1000 - 1100
13.9
12.9
14.6
25.1
18.9
15.0
8.3
1000 - 1100
0.0
0.0
0.0
0.0
0.0
1000 - 1100
0.0
0.0
0.0
0.0
0.0
1100 - 1200
16.9
14.9
15.4
16.0
15.4
14.6
10.9
1100 - 1200
0.0
0.0
0.0
0.0
0.0
1100 - 1200
0.0
0.0
0.0
3.9
0.0
1200 - 1300
10.9
16.3
11.0
18.4
16.6
15.6
7.3
1200 - 1300
0.0
0.0
0.0
0.0
0.0
1200 - 1300
0.0
0.0
0.0
0.0
0.0
1300 - 1400
11.1
12.6
10.7
15.1
12.4
13.1
10.7
1300 - 1400
0.0
0.0
0.0
0.0
0.0
1300 - 1400
0.0
0.0
0.0
0.0
0.0
1400 - 1500
19.1
17.6
16.4
22.9
20.0
12.3
9.6
1400 - 1500
0.0
0.0
0.0
0.0
0.0
1400 - 1500
0.0
0.0
0.0
0.0
0.0
1500 - 1600
8.1
10.1
12.3
15.0
7.4
13.3
7.1
1500 - 1600
0.0
0.0
0.0
0.0
0.0
1500 - 1600
40.9
34.6
42.3
32.3
49.3
1600 - 1700
15.3
22.0
18.1
18.7
22.0
12.9
7.6
1600 - 1700
0.0
0.0
0.0
0.0
0.0
1600 - 1700
11.3
9.4
11.6
16.0
13.9
1700 - 1800
15.1
14.0
16.7
18.0
20.6
13.9
4.7
1700 - 1800
0.0
0.0
0.0
0.0
0.0
1700 - 1800
29.1
32.3
25.1
30.1
24.3
1800 - 1900
19.7
17.1
26.0
19.1
21.0
10.6
4.6
1800 - 1900
0.0
0.0
0.0
0.0
0.0
1800 - 1900
9.9
14.6
11.9
11.1
8.4
1900 - 2000
0.9
1.0
1.1
2.4
1.0
0.0
0.0
1900 - 2000
0.0
0.0
0.0
0.0
0.0
1900 - 2000
0.1
0.0
0.6
0.0
0.1
2000 - 2100
0.0
0.0
0.0
0.0
0.0
0.0
0.0
2000 - 2100
0.0
0.0
0.0
0.0
0.0
2000 - 2100
0.0
0.0
0.0
0.0
0.0
2100 - 2200
0.0
0.0
0.0
0.0
0.0
0.0
0.0
2100 - 2200
0.0
0.0
0.0
0.0
0.0
2100 - 2200
0.0
0.0
0.0
0.0
0.0
80
80
80
70
70
70
60
60
60
50
50
50
40
40
40
30
30
30
20
20
20
10
10
10
0
0
0
…
…
…
…
…
…
…
…
…
…
…
…
…
…
…
…
…
…
…
…
…
…
…
…
…
…
…
…
…
…
…
…
…
…
‐
‐
‐
‐
‐
‐
‐
‐
‐
‐
‐
‐
‐
‐
‐
‐
‐
…
…
…
…
…
…
…
…
…
…
…
…
…
…
…
…
…
‐
‐
‐
‐
‐
‐
‐
‐
‐
‐
‐
‐
‐
‐
‐
‐
‐
‐
‐
‐
‐
‐
‐
‐
‐
‐
‐
‐
‐
‐
‐
‐
‐
‐
0500
0600
0700
0800
0900
1000
1100
1200
1300
1400
1500
1600
1700
1800
1900
2000
2100
0500
0600
0700
0800
0900
1000
1100
1200
1300
1400
1500
1600
1700
1800
1900
2000
2100
0500
0600
0700
0800
0900
1000
1100
1200
1300
1400
1500
1600
1700
1800
1900
2000
2100
Wellington City
City Bus
Bus Review
Average Boardings per Route per Hour
ROUTE 250RI
ROUTE 260IN
ROUTE 260OT
M
Tu
W
Th
F
Sa
Su
M
Tu
W
Th
F
Sa
Su
M
Tu
W
Th
F
Su
Su
0500 - 0600
0.0
0.0
0.0
0.0
0.0
0500 - 0600
0.0
0.0
0.0
0.0
0.0
0.0
0.0
0500 - 0600
0.0
0.0
0.0
0.0
0.0
0.0
0.0
0600 - 0700
10.3
12.3
12.7
13.1
13.4
0600 - 0700
18.7
17.9
18.7
15.7
16.7
0.0
0.0
0600 - 0700
0.1
0.1
0.7
0.4
0.9
0.0
0.0
0700 - 0800
16.7
13.7
11.7
13.6
11.7
0700 - 0800
22.3
24.4
21.0
21.7
17.9
3.0
2.1
0700 - 0800
2.4
2.3
2.9
2.0
1.6
0.4
0.1
0800 - 0900
0.0
0.0
0.0
0.0
0.0
0800 - 0900
12.4
8.0
11.6
8.4
12.9
8.6
3.3
0800 - 0900
26.1
28.1
27.7
12.6
22.1
1.1
1.1
0900 - 1000
0.0
0.0
0.0
0.0
0.0
0900 - 1000
15.0
18.0
14.9
20.0
18.0
9.9
7.4
0900 - 1000
3.0
1.3
2.9
13.3
2.4
3.9
1.1
1000 - 1100
0.0
0.0
0.0
0.0
0.0
1000 - 1100
6.9
8.0
10.0
11.0
6.9
6.0
5.0
1000 - 1100
7.3
5.1
6.7
6.7
5.9
6.6
2.3
1100 - 1200
0.0
0.4
0.0
0.0
0.0
1100 - 1200
8.1
6.3
7.7
7.4
7.1
6.1
5.4
1100 - 1200
8.4
11.1
7.7
10.9
13.6
11.0
4.9
1200 - 1300
0.0
0.0
0.0
0.0
0.0
1200 - 1300
6.0
7.3
7.1
8.3
7.7
6.7
4.4
1200 - 1300
8.1
9.1
12.3
9.6
9.4
5.9
5.4
1300 - 1400
0.0
0.0
0.0
0.0
0.0
1300 - 1400
5.4
7.9
3.6
7.0
3.1
6.4
3.4
1300 - 1400
7.1
8.4
14.1
10.3
9.4
11.7
8.7
1400 - 1500
0.0
0.0
0.0
0.0
0.0
1400 - 1500
2.3
3.1
5.3
5.4
3.3
3.3
4.7
1400 - 1500
16.0
16.4
18.9
15.6
16.7
9.7
6.1
1500 - 1600
0.0
0.0
0.0
0.0
0.0
1500 - 1600
46.0
39.3
43.0
29.0
43.9
6.0
1.9
1500 - 1600
11.7
13.3
14.6
14.0
10.1
6.6
5.9
1600 - 1700
0.0
0.0
0.0
0.0
0.0
1600 - 1700
5.1
7.9
12.3
7.1
8.0
3.4
2.1
1600 - 1700
19.7
17.4
20.6
16.4
15.1
5.9
6.0
1700 - 1800
0.0
0.0
0.0
0.0
0.0
1700 - 1800
3.7
5.6
4.9
5.9
4.9
1.0
0.9
1700 - 1800
19.6
17.1
19.7
25.0
20.6
6.0
4.0
1800 - 1900
0.0
0.0
0.0
0.0
0.0
1800 - 1900
3.0
2.7
4.7
3.1
2.1
1.7
2.0
1800 - 1900
18.1
20.3
15.0
17.9
14.9
5.3
2.0
1900 - 2000
0.0
0.0
0.0
0.0
0.0
1900 - 2000
0.9
1.1
1.4
1.0
2.6
0.4
0.0
1900 - 2000
3.0
3.7
4.1
3.1
4.1
3.0
0.0
2000 - 2100
0.0
0.0
0.0
0.0
0.0
2000 - 2100
0.6
0.0
0.4
0.6
1.0
1.4
0.0
2000 - 2100
1.4
1.7
1.9
3.1
7.7
2.9
0.0
2100 - 2200
0.0
0.0
0.0
0.0
0.0
2100 - 2200
0.1
0.6
0.7
0.1
1.1
1.0
0.0
2100 - 2200
0.3
1.3
1.0
2.4
3.1
1.9
0.0
80
80
80
70
70
70
60
60
60
50
50
50
40
40
40
30
30
30
20
20
20
10
10
10
0
0
0
…
…
…
…
…
…
…
…
…
…
…
…
…
…
…
…
…
…
…
…
…
…
…
…
…
…
…
…
…
…
…
…
…
…
‐
‐
‐
‐
‐
‐
‐
‐
‐
‐
‐
‐
‐
‐
‐
‐
‐
…
…
…
…
…
…
…
…
…
…
…
…
…
…
…
…
…
‐
‐
‐
‐
‐
‐
‐
‐
‐
‐
‐
‐
‐
‐
‐
‐
‐
‐
‐
‐
‐
‐
‐
‐
‐
‐
‐
‐
‐
‐
‐
‐
‐
‐
0500
0600
0700
0800
0900
1000
1100
1200
1300
1400
1500
1600
1700
1800
1900
2000
2100
0500
0600
0700
0800
0900
1000
1100
1200
1300
1400
1500
1600
1700
1800
1900
2000
2100
0500
0600
0700
0800
0900
1000
1100
1200
1300
1400
1500
1600
1700
1800
1900
2000
2100
Wellington City
City Bus
Bus Review
Average Boardings per Route per Hour
ROUTE 261IN
ROUTE 261OT
ROUTE 262IN
M
Tu
W
Th
F
Sa
Su
M
Tu
W
Th
F
Sa
Su
M
Tu
W
Th
F
Su
Su
0500 - 0600
0.0
0.0
0.0
0.0
0.0
0.0
0.0
0500 - 0600
0.0
0.0
0.0
0.0
0.0
0.0
0.0
0500 - 0600
0.0
0.0
0.0
0.0
0.0
0.0
0.0
0600 - 0700
33.7
32.3
37.1
34.3
32.6
0.0
0.0
0600 - 0700
0.0
0.0
0.1
0.0
0.0
0.0
0.0
0600 - 0700
38.7
43.3
39.7
43.3
36.6
0.0
0.0
0700 - 0800
35.6
36.7
32.3
35.7
35.0
3.1
1.9
0700 - 0800
0.9
1.3
1.7
1.6
1.1
0.0
0.3
0700 - 0800
36.7
36.1
41.1
38.0
32.3
4.6
3.3
0800 - 0900
24.6
25.9
28.0
13.1
23.0
4.4
1.9
0800 - 0900
3.9
3.7
5.7
5.1
5.0
0.0
0.9
0800 - 0900
55.6
54.7
59.9
33.3
52.7
7.0
4.9
0900 - 1000
15.1
15.4
17.0
34.6
12.7
6.4
2.9
0900 - 1000
1.1
1.7
1.0
2.3
1.4
2.7
0.9
0900 - 1000
19.3
20.6
18.1
41.1
19.9
8.4
6.0
1000 - 1100
8.1
9.4
9.1
9.7
9.6
8.1
7.4
1000 - 1100
3.4
4.7
7.3
6.1
4.4
5.1
1.3
1000 - 1100
11.9
17.0
14.4
15.3
15.6
14.1
9.1
1100 - 1200
5.6
5.1
5.7
7.0
5.6
7.0
4.0
1100 - 1200
5.9
6.6
6.0
8.3
5.7
3.4
3.7
1100 - 1200
9.7
11.1
13.6
11.9
10.9
13.0
5.1
1200 - 1300
3.9
5.4
4.4
8.9
4.4
5.3
5.1
1200 - 1300
4.4
7.3
5.9
7.9
6.6
8.4
3.7
1200 - 1300
9.7
11.1
9.4
13.3
8.0
10.3
7.0
1300 - 1400
3.9
4.6
6.0
6.7
4.7
5.1
7.6
1300 - 1400
5.9
6.1
6.7
7.7
6.0
5.3
2.1
1300 - 1400
7.7
6.7
10.1
14.4
11.4
8.3
5.6
1400 - 1500
2.9
3.0
5.0
3.9
5.7
5.1
4.0
1400 - 1500
12.0
10.6
13.9
12.1
12.6
4.4
4.6
1400 - 1500
8.4
7.4
23.9
12.1
13.6
10.1
5.1
1500 - 1600
7.1
10.1
11.0
12.4
12.9
3.3
4.0
1500 - 1600
13.0
14.4
11.7
18.9
13.3
9.3
3.0
1500 - 1600
62.1
58.7
56.4
53.7
48.6
6.0
3.7
1600 - 1700
4.3
4.6
4.7
5.7
5.0
1.9
2.1
1600 - 1700
24.0
17.9
24.6
20.6
16.3
5.1
4.3
1600 - 1700
14.0
11.7
14.7
9.7
12.4
5.1
2.1
1700 - 1800
1.9
2.0
2.6
2.7
2.6
2.9
0.6
1700 - 1800
39.4
36.1
41.0
40.4
33.6
4.6
4.1
1700 - 1800
9.0
5.1
5.3
7.1
7.0
11.3
2.1
1800 - 1900
0.7
1.9
1.0
1.7
2.1
0.7
0.6
1800 - 1900
29.1
32.3
31.7
27.1
22.0
3.7
2.3
1800 - 1900
2.9
4.1
1.3
3.4
3.7
4.9
2.6
1900 - 2000
0.4
0.7
0.9
0.4
0.3
0.0
0.0
1900 - 2000
0.0
0.0
0.3
0.0
0.1
0.0
0.0
1900 - 2000
1.1
1.7
1.7
1.6
4.1
1.1
0.0
2000 - 2100
0.0
0.0
0.0
0.0
0.0
0.0
0.0
2000 - 2100
0.0
0.0
0.0
0.0
0.0
0.0
0.0
2000 - 2100
0.1
0.6
0.1
1.0
0.6
1.4
0.0
2100 - 2200
0.0
0.0
0.0
0.0
0.0
0.0
0.0
2100 - 2200
0.0
0.0
0.0
0.0
0.0
0.0
0.0
2100 - 2200
0.0
0.1
0.3
0.0
0.3
1.3
0.0
80
80
80
70
70
70
60
60
60
50
50
50
40
40
40
30
30
30
20
20
20
10
10
10
0
0
0
…
…
…
…
…
…
…
…
…
…
…
…
…
…
…
…
…
…
…
…
…
…
…
…
…
…
…
…
…
…
…
…
…
…
‐
‐
‐
‐
‐
‐
‐
‐
‐
‐
‐
‐
‐
‐
‐
‐
‐
…
…
…
…
…
…
…
…
…
…
…
…
…
…
…
…
…
‐
‐
‐
‐
‐
‐
‐
‐
‐
‐
‐
‐
‐
‐
‐
‐
‐
‐
‐
‐
‐
‐
‐
‐
‐
‐
‐
‐
‐
‐
‐
‐
‐
‐
0500
0600
0700
0800
0900
1000
1100
1200
1300
1400
1500
1600
1700
1800
1900
2000
2100
0500
0600
0700
0800
0900
1000
1100
1200
1300
1400
1500
1600
1700
1800
1900
2000
2100
0500
0600
0700
0800
0900
1000
1100
1200
1300
1400
1500
1600
1700
1800
1900
2000
2100
Wellington City
City Bus
Bus Review
Average Boardings per Route per Hour
ROUTE 262OT
ROUTE270CL
ROUTE 280CI
M
Tu
W
Th
F
Su
Su
M
Tu
W
Th
F
Su
Su
M
Tu
W
Th
F
Su
Su
0500 - 0600
0.0
0.0
0.0
0.0
0.0
0.0
0.0
0500 - 0600
0.0
0.0
0.0
0.0
0.0
0500 - 0600
0.0
0.0
0.0
0.0
0.0
0.0
0.0
0600 - 0700
0.4
0.4
0.9
0.3
0.9
0.0
0.0
0600 - 0700
0.0
0.0
0.0
0.1
0.0
0600 - 0700
0.0
0.0
0.0
0.0
0.0
0.0
0.0
0700 - 0800
5.0
6.1
6.1
3.3
4.7
0.4
0.4
0700 - 0800
6.6
6.1
8.4
2.4
5.0
0700 - 0800
0.0
0.0
0.0
0.0
0.0
5.7
1.3
0800 - 0900
37.1
38.0
35.1
12.3
34.4
0.9
0.7
0800 - 0900
9.7
6.4
7.0
1.1
7.4
0800 - 0900
7.4
10.9
9.0
11.9
9.1
7.0
9.6
0900 - 1000
5.3
5.4
4.7
28.4
4.9
3.4
2.3
0900 - 1000
0.3
0.9
1.3
6.7
0.4
0900 - 1000
17.7
25.3
25.3
27.7
20.3
9.3
9.1
1000 - 1100
5.3
8.0
6.9
14.6
7.4
5.4
3.1
1000 - 1100
1.3
1.4
0.9
2.6
1.0
1000 - 1100
13.9
20.0
15.3
20.6
16.6
12.0
10.6
1100 - 1200
9.1
11.4
8.3
11.4
8.1
7.4
4.9
1100 - 1200
1.4
0.6
1.3
1.9
0.6
1100 - 1200
12.7
17.9
16.0
16.4
18.4
13.0
5.4
1200 - 1300
9.3
11.4
9.4
11.3
13.0
9.6
5.7
1200 - 1300
0.6
1.0
0.9
0.7
1.6
1200 - 1300
14.6
19.3
16.4
16.3
15.6
13.1
5.3
1300 - 1400
11.1
12.4
10.7
10.9
11.0
6.7
5.4
1300 - 1400
0.3
0.4
0.4
1.3
0.1
1300 - 1400
14.3
17.6
18.1
18.9
18.4
15.3
7.1
1400 - 1500
18.1
19.3
24.4
18.1
20.7
11.7
5.9
1400 - 1500
0.3
0.7
1.1
0.7
1.4
1400 - 1500
18.4
17.0
18.1
24.0
24.3
15.9
7.0
1500 - 1600
31.4
31.4
30.1
32.6
31.7
5.3
7.1
1500 - 1600
16.7
18.1
16.9
13.0
8.4
1500 - 1600
20.7
26.1
24.3
27.7
27.6
11.3
7.1
1600 - 1700
30.1
27.6
28.0
36.1
26.9
10.9
9.0
1600 - 1700
4.4
2.9
4.4
2.7
3.7
1600 - 1700
24.6
22.1
25.4
26.0
23.0
14.0
6.4
1700 - 1800
41.9
42.9
37.3
35.6
36.0
8.6
9.1
1700 - 1800
3.7
4.3
4.7
4.1
3.6
1700 - 1800
18.3
21.1
20.9
23.3
23.1
6.1
5.7
1800 - 1900
25.7
34.3
28.3
28.0
28.1
9.3
4.9
1800 - 1900
2.1
2.7
1.6
3.1
0.7
1800 - 1900
15.9
16.3
14.4
15.1
13.6
6.3
2.9
1900 - 2000
4.9
4.7
2.1
3.9
6.0
3.4
0.0
1900 - 2000
0.0
0.0
0.0
0.0
0.0
1900 - 2000
4.3
6.9
6.0
3.6
5.4
4.9
0.0
2000 - 2100
3.4
2.7
2.0
2.1
7.1
1.9
0.0
2000 - 2100
0.0
0.0
0.0
0.0
0.0
2000 - 2100
2.9
0.9
3.6
2.9
2.7
3.0
0.0
2100 - 2200
1.9
1.1
1.7
3.3
2.0
2.4
0.0
2100 - 2200
0.0
0.0
0.0
0.0
0.0
2100 - 2200
0.6
1.0
1.3
1.6
2.1
2.4
0.0
80
80
80
70
70
70
60
60
60
50
50
50
40
40
40
30
30
30
20
20
20
10
10
10
0
0
0
…
…
…
…
…
…
…
…
…
…
…
…
…
…
…
…
…
…
…
…
…
…
…
…
…
…
…
…
…
…
…
…
…
…
…
…
…
…
…
…
…
…
…
…
…
…
…
…
…
…
…
‐
‐
‐
‐
‐
‐
‐
‐
‐
‐
‐
‐
‐
‐
‐
‐
‐
‐
‐
‐
‐
‐
‐
‐
‐
‐
‐
‐
‐
‐
‐
‐
‐
‐
‐
‐
‐
‐
‐
‐
‐
‐
‐
‐
‐
‐
‐
‐
‐
‐
‐
0500
0600
0700
0800
0900
1000
1100
1200
1300
1400
1500
1600
1700
1800
1900
2000
2100
0500
0600
0700
0800
0900
1000
1100
1200
1300
1400
1500
1600
1700
1800
1900
2000
2100
0500
0600
0700
0800
0900
1000
1100
1200
1300
1400
1500
1600
1700
1800
1900
2000
2100
Wellington City
City Bus
Bus Review
Average Boardings per Route per Hour
ROUTE 280IN
ROUTE 285IN
ROUTE 285OT
M
Tu
W
Th
F
Su
Su
M
Tu
W
Th
F
Su
Su
M
Tu
W
Th
F
Su
Su
0500 - 0600
1.9
2.7
3.1
2.1
2.6
0500 - 0600
0.0
0.0
0.0
0.0
0.0
0500 - 0600
0.0
0.0
0.0
0.0
0.0
0600 - 0700
16.9
18.6
19.4
14.4
12.9
0600 - 0700
0.0
0.0
0.0
0.0
0.0
0600 - 0700
0.0
0.0
0.0
0.0
0.0
0700 - 0800
15.0
17.1
11.7
16.7
13.6
0700 - 0800
0.0
0.0
0.0
0.0
0.0
0700 - 0800
0.0
0.0
0.0
0.0
0.0
0800 - 0900
6.9
6.1
9.6
7.3
6.1
0800 - 0900
0.0
0.0
0.0
0.0
0.0
0800 - 0900
0.0
0.0
0.0
0.0
0.0
0900 - 1000
0.0
0.0
0.0
0.0
0.0
0900 - 1000
0.0
0.0
0.0
0.0
0.0
0900 - 1000
0.0
0.0
0.0
0.0
0.0
1000 - 1100
0.0
0.0
0.0
0.0
0.0
1000 - 1100
0.0
0.0
0.0
0.0
0.0
1000 - 1100
0.0
0.0
0.0
0.0
0.0
1100 - 1200
0.0
0.0
0.0
0.0
0.0
1100 - 1200
0.0
0.0
0.0
0.0
0.0
1100 - 1200
0.0
0.0
0.0
0.0
0.0
1200 - 1300
0.0
0.0
0.0
0.0
0.0
1200 - 1300
0.0
0.0
0.0
0.0
0.0
1200 - 1300
0.0
0.0
0.0
0.0
0.0
1300 - 1400
0.0
0.0
0.0
0.0
0.0
1300 - 1400
0.0
0.0
0.0
0.0
0.0
1300 - 1400
0.0
0.0
0.0
0.0
0.0
1400 - 1500
0.0
0.0
0.0
0.0
0.0
1400 - 1500
0.0
0.0
0.0
0.0
0.0
1400 - 1500
0.0
0.0
0.0
0.0
0.0
1500 - 1600
0.0
0.0
0.0
0.0
0.0
1500 - 1600
1.0
2.0
1.9
0.3
1.1
1500 - 1600
1.0
2.0
1.9
0.3
1.1
1600 - 1700
0.0
0.0
0.0
0.0
0.0
1600 - 1700
35.9
38.7
37.7
36.0
25.3
1600 - 1700
35.9
38.7
37.7
36.0
25.3
1700 - 1800
0.0
0.0
0.0
0.0
0.0
1700 - 1800
2.1
2.6
2.0
2.6
2.3
1700 - 1800
2.1
2.6
2.0
2.6
2.3
1800 - 1900
0.0
0.0
0.0
0.0
0.0
1800 - 1900
0.0
0.0
0.0
0.0
0.0
1800 - 1900
0.0
0.0
0.0
0.0
0.0
1900 - 2000
0.0
0.0
0.0
0.0
0.0
1900 - 2000
0.0
0.0
0.0
0.0
0.0
1900 - 2000
0.0
0.0
0.0
0.0
0.0
2000 - 2100
0.0
0.0
0.0
0.0
0.0
2000 - 2100
0.0
0.0
0.0
0.0
0.0
2000 - 2100
0.0
0.0
0.0
0.0
0.0
2100 - 2200
0.0
0.0
0.0
0.0
0.0
2100 - 2200
0.0
0.0
0.0
0.0
0.0
2100 - 2200
0.0
0.0
0.0
0.0
0.0
80
80
80
70
70
70
60
60
60
50
50
50
40
40
40
30
30
30
20
20
20
10
10
10
0
0
0
…
…
…
…
…
…
…
…
…
…
…
…
…
…
…
…
…
…
…
…
…
…
…
…
…
…
…
…
…
…
…
…
…
…
…
…
…
…
…
…
…
…
…
…
…
…
…
…
…
…
…
‐
‐
‐
‐
‐
‐
‐
‐
‐
‐
‐
‐
‐
‐
‐
‐
‐
‐
‐
‐
‐
‐
‐
‐
‐
‐
‐
‐
‐
‐
‐
‐
‐
‐
‐
‐
‐
‐
‐
‐
‐
‐
‐
‐
‐
‐
‐
‐
‐
‐
‐
0500
0600
0700
0800
0900
1000
1100
1200
1300
1400
1500
1600
1700
1800
1900
2000
2100
0500
0600
0700
0800
0900
1000
1100
1200
1300
1400
1500
1600
1700
1800
1900
2000
2100
0500
0600
0700
0800
0900
1000
1100
1200
1300
1400
1500
1600
1700
1800
1900
2000
2100
Wellington City
City Bus
Bus Review

Greater Wellington Regional Council
Wellington City Bus Review
Appendix F
Mapping of Boardings: Mana
Wellington City Bus Review FINAL
24 November 2011
Map 2.10:
Mana: Thursday Boardings and Alightings
Boardings from 6am to 9am. Average of Six Weeks.
Pie Chart of ThursdaysAM
400
200
40
ManaBoarding
Train Lines
Bus Routes and Stops
Map 2.11:
Mana: Thursday Boardings and Alightings
Boardings between 10:00am and 1:30pm. Average of Six Weeks.
Pie Chart of ThursdaysMid
100
50
10
ManaBoardings
Train Lines
Bus Routes and Stops

Greater Wellington Regional Council
Wellington City Bus Review
Appendix G
Mapping of All Boardings in AM Peak (Go Wellington, Mana, Johnsonville Rail)
Wellington City Bus Review FINAL
24 November 2011
Map G.1:
Wellington Operators: Thursday Boardings at Stop Level
from 6:30am to 8:30am. Average of Six Weeks.
Boardings by Stop
380
190
38
Go Wellington
Mana
Newlands
Johnsonville Line
Train Lines
Bus Routes and Stops
Map G.2:
Wellington Operators: Thursday Boardings by Mesh Block
from 6:30am to 8:30am. Average of Six Weeks.
Boardinds by Mesh Block
480
240
48
Go Wellington
Mana
Newlands
Johnsonville Rail
Train Lines
Bus Routes and Stops
Map G.3:
Wellington Bus Operators: Thurs Boardings at Stop Level
from 11:00am to 1:00pm. Average of Six Weeks.
Boardings by Stop
380
190
38
Go Wellington
Mana
Newlands
Train Lines
Bus Routes and Stops
Map G.4:
Wellington Bus Operators: Thurs Boardings by Mesh Block
from 11:00am to 1:00pm. Average of Six Weeks.
Boardinds by Mesh Block
480
240
48
Go Wellington
Mana
Johnsonville Rail
Train Lines
Bus Routes and Stops

Greater Wellington Regional Council
Wellington City Bus Review
Appendix H
Peer Assessment – Case Studies
Wellington City Bus Review FINAL
24 November 2011

Greater Wellington Regional Council
Wellington City Bus Review
Case Studies of Transfer Policy Changes
While transfer policy is often debated amongst those in the transport industry, there is a distinct lack of
both collection and reporting surrounding the impacts of changes to transfer policies. It appears
however, that the increasing prevalence of electronic ticketing across major PT networks is providing an
opportunity for both PT authorities and service operators to consider their transfer policies and how these
can be optimised to meet patronage and revenue goals.
This section contains case studies of the two most common transfer changes covered in the literature:
Introduction of travel cards;
Shift from no transfer policy to integrated fares;
The case studies in the second section wil be of most relevance to the Wel ington context
Introduction of travel cards
The most common changes to transfer policy studied extensively in the literature is the introduction of
multi-time passes that al ow for an unlimited number of PT trips within a certain time period (usual y two
hours, one day or one month). These have been introduced in numerous cities worldwide normal y with
goals to increase PT patronage. Whilst in al cases these have had the desired impacts of increased
patronage, the impacts on revenue have been less uniform.
Fitzroy and Smith (1998) in their study of travel cards in Freiburg, Germany found that the introduction of
these cards had increased bus travel between 9% and 14% with no significant deterioration of the
operating deficit of the bus service company. Similarly, London Transports (1993) quantification of their
travel card introduction found high increases in passenger miles (33% for underground, 20% for bus) that
were accompanied by positive effects on revenue as a result of the substantial increases in patronage
across the network.
These results are seen as somewhat atypical in the literature, as they go against the strong findings of
relatively inelastic demand for PT services (Pucher & Kurth, 1996). Doxey (1984, cited in (Prat, 2003))
concludes that travel cards have a negative impact on revenue as a result of the inelastic demand.
However, he ignores additional generation of PT trips that such a fare network might attract. In Pucher
and Kurth’s (1996) analysis of five cities across Germany and Vienna that introduced integrated fare
networks, they found that substantial increases in government subsidies were required. Operating
deficits grew substantial y, with the proportion of csots covered by fare revenues in Zurich fal ing from
78% in 1985 to only 42% in 1993. Again, these results need to be interpreted with caution as a number
of other changes were also implemented in this time, such as service improvements and new vehicles.
Two cities that have introduced travel cards have been the subject of investigation to attempt to isolate
the impacts of the travel card from other changes being undertaken – Melbourne in 1980, and Madrid in
1987.
Melbourne, Australia 1980
Don et al. (1983) and Carolan (1983) undertook analysis fol owing the introduction of an al -day travel
cards (‘Metrocard’) in the Melbourne PT network in 1980. These were introduced to address PT
patronage goals, after it was found that 23% of al current trips currently included a transfer (Don,
Singleton, & Wal is, 1983). The aim was for the PT network to be seen as ful y co-ordinated, with those
Wellington City Bus Review FINAL
24 November 2011

Greater Wellington Regional Council
Wellington City Bus Review
required to change vehicles not being penalised for doing so. These travel cards operated as one-day
passes, al owing unlimited PT trips throughout the day, hence providing for free transfers for those users.
These passes differ from the system Melbourne has today which is one of universal free transfers for al
users.
It was also believed that Metrocard would reduce the complexity of the fare network and be more
attractive to new PT users (Don, Singleton, & Wal is, 1983). Private buses were excluded, but the
Metrocard enabled travel across trains, trams and MMTB (Melbourne Metropolitan Transit Board) buses
within the day of purchase.
Analysing the impacts of the travel card in the 26 week period fol owing the introduction found that 34
mil ion trips (28%) were made on travel cards, compared with 89 mil ion trips (72%) on al other types of
tickets. The split of revenue was remarkably similar, with travel cards associated with revenues of $18m
(28%), compared with other ticket types of $46m (72%) (Don, Singleton, & Wal is, 1983). The revenue
gained from travel cards as a percentage was actual y slightly higher than that of total trips.
Over the period analysed, total PT ridership increased by 2% and PT revenue increased by 12%,
although it is not possible to link these increases directly to the integration of the fare network. Don et al.
(1983) believe that the introduction may have had no substantial impact on PT ridership. Nonetheless,
the average number of trips taken on the travel cards ranged from between 3.3 and 4.3 dependent on
the mode of purchase, averaging 3.75 trips across all travel card users (Don, Singleton, & Wal is, 1983).
With regards to revenue impacts, (Carolan, 1983) notes the unique situation minimised the risks by PT
service agencies in the introduction of the Metrocard. The State Government acknowledged the risk of
declining revenues and provided guarantees to top-up any revenue seen to be lost during the trial period.
However, as noted above, this was unnecessary with increasing revenues coming from a large increase
in PT patronage over the period.
Madrid, Spain, 1987
Prat (2003) examined the historical changes seen in Madrid fol owing a range of changes in the mid-
1980s. These included major improvements of the PT network to be more integrated and of a higher
quality, but also in 1987 the creation of an integrated fare network. This was based on a monthly travel
card that allowed unlimited travel for holders across the entire network.
Prat (2003) first examined the uptake of the travel card option across the two major PT modes in Madrid,
bus and underground (UG). Table 1 summarises her findings.
Table 20: Changes in proportions of ticket types in Madrid, 1987-2001
Bus
Underground
Type of ticket
1987
2001
1987
2001
Single
27 %
4 %
48 %
5 %
Multi-ride ticket
57 %
24 %
37 %
35 %
Travel card
16 %
72 %
15 %
60%
Source: Concorcio Transportes de Madrid (cited in Prat, 2003)
Prat (2003) found that the travel card had replaced nearly all of the single cash fares for both modes.
However, multi-ride tickets remained almost constant on the UG, despite fal ing by over half on bus trips.
Prat explains the difference as a result of the transfer inequality between the two modes. While transfers
are free for al travel card users on al modes, transfers are also free for UG users transferring between
services. Conversely, bus users are required to pay for any transfers, so have a higher incentive to move
Wellington City Bus Review FINAL
24 November 2011
link to page 64

Greater Wellington Regional Council
Wellington City Bus Review
to the travel card than regular UG users. This highlights the unequal impacts that transfer policies can
have on users when not applied uniformly across the whole PT network.
From 1986 to 2001, patronage grew by more than 50% in Madrid and Prat (2003) wanted to
disaggregate the patronage increases to attempt to attribute the rises to the various changes that were
undertaken to the PT network in this time. She undertook a regression analysis of the patronage
increases in relation to fare prices, the total route length of the network components, the travel card
introduction and GDP
22. In doing this, she left the travel card as the blank variable, with the remainder
unexplained by the other factors assumed to be explained by the introduction of the travel card. Table 2
summarises Prat’s findings.
Table 21: Estimated impact on PT patronage of variables, Madrid, 1986-2001
Variable
Impact on bus patronage
Impact on UG patronage
Fare index
- 5.5%
- 15.8%
GDP
+ 12.8%
+ 18.7%
Bus route length
+ 16.3%
n/a
Underground (UG) route length
- 16.1%
+ 27.1%
Petrol price
- 0.4%
n/a
Suburbinisation
+ 15.4%
n/a
Employment
n/a
+ 29.3 %
Travel card (remainder)
+ 7.1%
+ 14.9%
Source: (Prat, 2003)
Prat’s analysis found that the long term impact of the travel card on patronage was an increase of
between 7% (bus) and 15% (underground). This is in line with the increases observed by others fol owing
the introduction of travel cards in Freiburg and London (Fitzroy & Smith, 1998; London Transport
Planning Department, 1993).
In relation to revenue impacts, Madrid also saw a reduction in revenue as a result of the relatively high
penetration of the lower cost travel card (Prat, 2003), similar to that observed in Purcher and Kuth (1996).
In fact, Prat concludes that as a result of high price elasticity of single and multi-ride fares, there is likely to
be scope for Madrid to adopt non-uniform pricing across the PT network and see positive increases in
both PT patronage and revenue.
Shift from no transfer policy to integrated fares
A second type of shift in transfer policy observed in the literature is the introduction of integrated fares
across a network. This type of change has only been practical y possible with the introduction of
integrated ticketing, that is able to accurately determine the correct price for each trip, and minimise
issues of fare evasion that are far higher in paper based networks (Perk, Volinski, & Kamp, 2004). In an
integrated network, users are charged based on the total fare for travel ing between zones within a
network, regardless of the number of transfers that are made to get to the final destination. This is similar
to the change that is proposed for Wel ington.
22 Prat also included measures of petrol prices and suburbanisation for bus travel, and a measure of employment for underground
travel
Wellington City Bus Review FINAL
24 November 2011

Greater Wellington Regional Council
Wellington City Bus Review
New York, USA, 1997
In 1997 New York took the opportunity to implement a number of initiatives that helped to improve public
transport usage across the network, while moving to electronic ticketing (the MetroCard). Arguably the
most successful of these was the removal of fares for transferring – in that customers transferring
between services (including inter-modal transfers i.e. between subway and bus) were not charged for a
new trip, but for the whole journey from start to finish regardless of transfers (Scal er, 1998).
In the six months immediately fol owing the introduction of the Metrocard there were no other initiatives
undertaken, so this data is the best proxy for identifying the real impacts on patronage and revenue of the
new fare network. Table 3 summarises the short term impacts for the two main modes, and also across
the whole PT network. It found that increases in patronage were strong (particularly for travel on the
subway), but that these were not enough to offset the fal s in average fare by removing the cost of the
transfer. In total, the change lead to a short term reduced revenue of 1.2%.
Table 22: Short term Impacts of Metrocard introduction in New York, 1996-1997
Variable
Local bus
Underground
Total PT network
Impact on patronage
+ 2.7 %
+ 18.6 %
+ 7.2 %
Impact on average fare
- 4.2 %
- 15.4 %
- 7.8 %
Impact on total revenue
- 1.6 %
+ 0. 4%
- 1.2 %
Source: New York City Transit
The medium-term impacts of these changes were stronger than expected. While 9% of subway
commuters lived in two-fare zones, and hence were expected to enjoy the benefits of such a scheme,
there was widespread uptake of free transfers, and patronage rapidly increased (Scal er, 1998). In
particular:
Bus patronage rose 18% in the second half of 1997 (compared with 3% in the first half)
Subway patronage rose 3.6% over the same period (compared with 1.3% in the first half)
Uptake of the MetroCard increased from 15% to 59%
The medium term impacts on subway patronage levels are shown in the following figure.
Wellington City Bus Review FINAL
24 November 2011

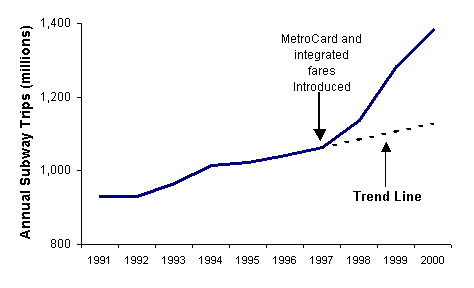
Greater Wellington Regional Council
Wellington City Bus Review
Figure H.1: Patronage on New York subway, 1991-2000
Source: (Scaller, 1998)
The success of the programme was also seen in relation to other schemes introduced such as the “11 for
10 trips” frequent-user discount introduced in 1998. While these increased patronage further, they did
not do so to the extent as was seen with free transfers. This is likely due to the fact that while the “11 for
10” offer addressed the cost issue of public transport, the free transfer scheme not only reduced the cost
of transfers, but also increased the flexibility, convenience and simplicity of the network for users (Scal er,
1998).
Gwangju, South Korea, 2006
In 2006, Gwangju, the sixth-largest city in South Korea, introduced a system of free intermodal transfers
along it PT network (buses and one subway line). While flat fares were already in place along the subway
line operating in the city, free transfers connected the bus network to the subway line, al owing for
increased connectivity of the network and increased convenience for users. Free transfers must be used
within a certain time period (one hour after boarding a bus, and thirty minutes after alighting from the
subway) to apply, and are only facilitated with the use of the smart card (‘traffic card’).
Free transfers cannot be used between services of the same type (i.e. between two different bus
services). As there is only one subway line at present, this means that the total number of transfers per
journey would be two (bus-subway-bus). Whilst no links to the transfer network can be proved,
continual y increasing PT patronage in Gwangju has been sufficiently high that a second subway line is
scheduled for completion in 2012. There wil likely a need to revisit the transfer policy at this time.
Singapore, 2010
The Public Transport Council (PTC) in Singapore introduced that a new fare network to address transfers
in July 2010. By implementing a ‘journey distance’ based network for determining fares along the entire
network, PTC removed the fare penalties that had existed under the previous operational model. Users
are now charged one fare for their entire journey and allowed to make any number of transfers they
between services and modes, within some eligibility constraints.
Wellington City Bus Review FINAL
24 November 2011
link to page 67

Greater Wellington Regional Council
Wellington City Bus Review
Prior to the implementation, PTC acknowledged that there would be differential impacts of the new fare
and transfer policy on current users. Namely, those that typical y took longer distance trips with a higher
number of transfers would receive higher cost savings than those taking short trips with minimal transfers,
as the new network increased the base fare in order to reduce the distortion of fare penalties. PTC
determined the likely impact on users would be:
63% of commuters would have reduced costs of around $25 a year
24% of commuters would have increased costs of around $16 a year
While not stated, it is unlikely that PTC would have shifted to a new fare structure that would lead to
projected revenue losses based on current usage patterns. As such, it is likely that the generation rate of
new PT trips would balance out any revenue lost. From the figures above, if PT usage patterns remained
unchanged, for every 100 passengers, the PTC would have reduced revenues of $1,191 per annum.
However, as the network is now better integrated, it is likely to be of increased attractiveness to both
existing and new users, and PTC would need to believe that patronage would increase by 9 trips per year
per person
23 (between 2-3%) to breakeven under the new fare structure.
It should be noted that there has been publicised public distrust of the new network, highlighting the
importance of both public consultation and on-going information to clarify the changes and the impacts
of these for PT users.
23 At an average journey cost of $1.40 assuming 2010 PT usage rates of ~1 trip per person per day
Wellington City Bus Review FINAL
24 November 2011

Greater Wellington Regional Council
Wellington City Bus Review
Case Studies of Network Rationalisation
and Simplification
Similar to the issues surrounding quantifying the impacts of transfer policy, there are difficulties in
determining the actual impact of simplifications to PT networks. This is because these changes are often
undertaken at the same time that numerous other changes are also made. The fol owing sub-sections
outline examples of simplified PT networks, often built around core lines with an emphasis on increased
transfers.
Melbourne, Australia and Toronto, Canada
Mees (2000) completed a comparison of Toronto in Canada with Melbourne in Australia to attempt to
understand the impacts of the more connected Toronto network with that of Melbourne. The two cities
have similar populations, incomes and urban forms (Mees et al., 2010), but Mees (2000) asserts that the
integration of PT services in Toronto is responsible for the large differences in PT trends between the two
cities from 1960 to 1990. In particular, he points to the integration of rail with bus services that lead to a
more intensive and cost-efficient use of the rail lines in Toronto. The competition between the separate
train and tram agencies in Melbourne was also seen as a barrier to increased PT usage.
From 1960-1990, the number of annual PT journeys increased by 22% in Toronto, while they fel by 56%
in the same time period in Melbourne. The share of PT trips also held stable in Toronto at 33%, while it
fel from 42% to 19% in Melbourne. This is despite the fact that Toronto not only has a smal er rail
network, but also receives significantly lower public subsidies.
Zürich, Switzerland
Zürich is seen as many transport professionals as the best example of PT provision, with some of the
highest PT usage rates in the developed world. Comparing Zürich can be compared to both Auckland
and Wel ington in relation to size and PT usage. The population of the City of Zürich is comparable to
that of Wel ington region (360,000 vs. 450,000), while the Canton (State) of Zürich is roughly the same of
that of the wider Auckland region (approximately 1.3 mil ion residents). However, Zürich’s capita PT
usage is around five times that of Wellington, and over ten times that achieved in Auckland (Mees et al.,
2010). Neilsen et al. (2005) also note that PT supply and demand in Zürich are both well above the level
seen in cities of a similar size and structure, and that most of the increase has been at the expense of
private automobile travel. Indeed in Zürich, 40.7% of al work trips are taken by PT, and 47.2% by private
vehicle, compared with 17.1% by PT, and 69.6% by private vehicle in Wellington.
While the PT network is seen as high quality, it is the comprehensive network planning that has been
undertaken in Zürich (Mees et al., 2010). Neilsen et al., 2005 state that:
Analyses of the public transport network show that the density of lines and the high frequency of
services are key factors in the success of Zürich… Moreover, in Zürich the lines run in many
directions, not only between a suburb and the city centre. The lines form a proper network and the
high frequency means that the waiting times at the large number of interchanges are short. (Neilsen et
al., 2005, 90-92).
Comprehensive off-peak, cross-city and intra-suburb services are also supported by policies that restrict
parking and road space allocation for cars, as well as priority for PT on al roads that has been in place for
30 years. In comparison to Frankfurt, Zürich has increased per capita PT demand by 60% since 1970,
Wellington City Bus Review FINAL
24 November 2011

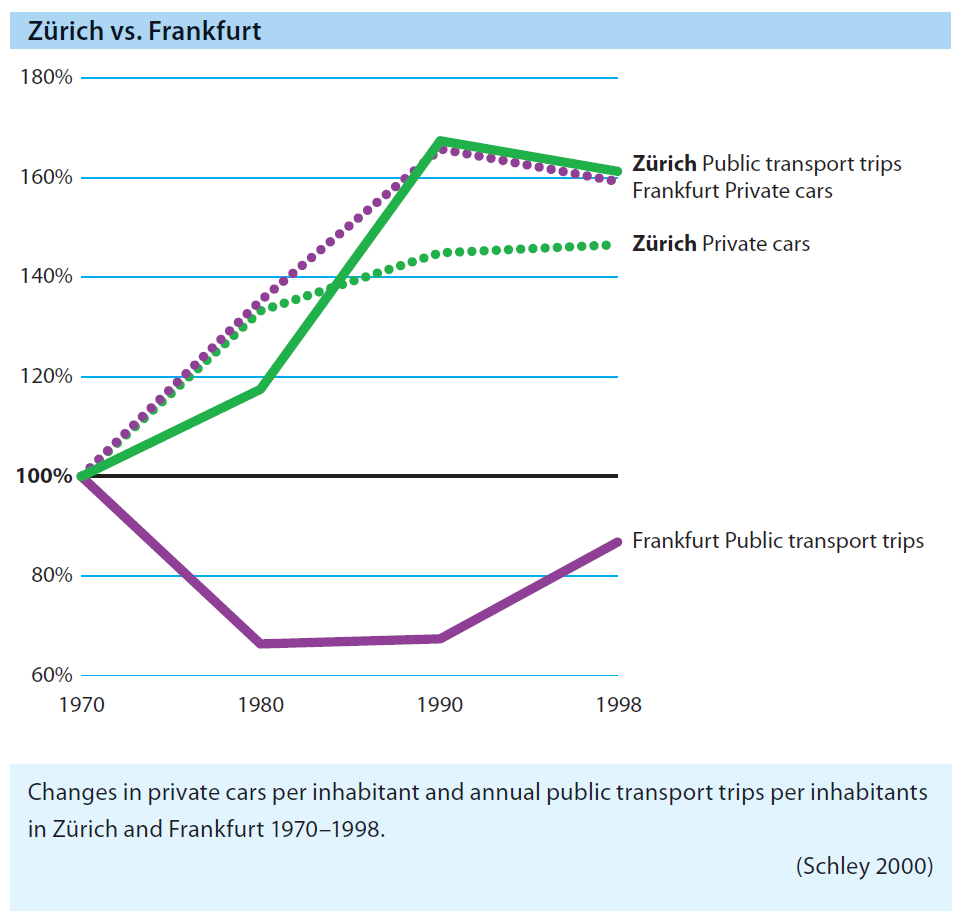
Greater Wellington Regional Council
Wellington City Bus Review
whereas Frankfurt has decreased 14% (Schley, 2000 cited in Neilsen et al., 2005), as shown in Figure
H.2.
Figure H.2: Percentage changes in private cars and PT trips in Frankfurt and Zürich, 1970-1998
Source: Schley (2000, as presented in Neilsen et al., 2005, p89).
Jönoköping, Sweden
Jönoköping is a smal city of 81,000 in Sweden. In 1996, the PT network of Jönoköping was overhauled,
with the existing network of numerous low frequency and direct lines replaced by three main pendulum
lines running across the urban centre, with al other lines connecting to one of these three lines. This was
seen as a radical change for residents and in some cases, these were supplemented by additional feeder
routes (Neilsen and Lange, 2009).
The simplification of routes in Jönoköping was complemented by a modernised bus fleet and also
upgrades to interchanges, as transfers between services were now facilitated by the network design.
The new main pendulum lines attracted so many passengers that services were increased to run at 5-10
minute frequencies throughout most of the day, rather than just at peak times (Neilsen and Lange, 2009).
Prior to the restructure of the network, Jönoköping was experiencing declines in PT patronage of around
1-2% annual y. Fol owing the network simplification, patronage began to increase, rising 15% from 1996
to 2002. This was set across a backdrop of declining PT patronage across comparable Swedish cities.
Furthermore, the total share of trips increased from 19% to 22% and farebox recovery ratio has increased
13% since 1996. Neilsen and Lange (2009) argue that these statistics al point to the positive impacts of
network rationalisation, where these focus on simple and frequent routes and efficient systems for
transferring to replace low-frequency direct routes.
Lemgo, Germany
Lemgo is a smal city in the Lippe district of North Rhine-Westphalia in Germany. In 1994, the bus
network in the city undertook a network rationalisation that led to the creation of four pendulum routes
across the city – three connecting to the city centre and the fourth to a major industrial centre (Neilsen
Wellington City Bus Review FINAL
24 November 2011

Greater Wellington Regional Council
Wellington City Bus Review
and Lange, 2009). Lemgo had a population of 30,000 at the time of network reconfiguration, and a
similar program was also undertaken in the nearby Lindau with 24,000 residents.
The new trunk routes in Lemgo meant that each line had an immediate catchment of 8,000 residents
within a short walking distance. The initial frequencies of the lines were 30 minutes throughout the day,
with the frequency doubling in peak periods. Lemgo also implemented a ‘pulse’ timetable schedule with
buses on al four lines synchronising their arrival at the central bus station. (Neilsen and Lange, 2009).
Neilsen and Lange (2009) assert that the impacts on bus patronage continue to be impressive. 80% of
PT passengers in the immediately fol owing year were new PT customers, and the city achieves total
patronage of nearly 2,000,000 PT trips annual y. Public subsidies required to fund the PT network
previously also fell dramatically, from 7.5DM to 0.5DM. This was drive by an increase in farebox recovery
associated with the increased patronage, which rose to 70% of total operating costs.
London, United Kingdom
White et al. (1992) undertook a review of transport in London that sought to examine the impacts of a
change in bus frequencies in North West London. Bus services currently running at 20 minute
frequencies were replaced by minibuses which were able to run at 10 minute headways. They found that
there was a distinct change in behaviour of PT users, in that they now simply arrived at any time at the
stop rather than planning their trip in advance as they had done with lower frequencies. White et al.
assert that this is due to the significant decrease in potential wait time, and that this can lead to increased
patronage as users face less of a time penalty in waiting for services.
These findings are in line with the assertion of Dodson et al. (2011) that direct routes with higher
frequencies attract higher frequencies by removing the requirement to plan for PT trips. Network
planning should limit the deviations in physical routes for bus lines and increase frequency rather than
increase spatial coverage to better increase patronage.
Spokane, Washington, USA
Spokane in Washington State, USA has undertaken a number of changes to their networks and in the
last 15 years. The impacts on PT patronage have been largely as expected. Increases in fares in 2000
and 2009 saw decreases in patronage, in line with inelastic PT demand. In relation to network
rationalisation and simplification however, both a major system redesign in 1999, and the extension of
operating hours in 2007 led to significant increases in patronage, as shown in Figure H.3.
Wellington City Bus Review FINAL
24 November 2011

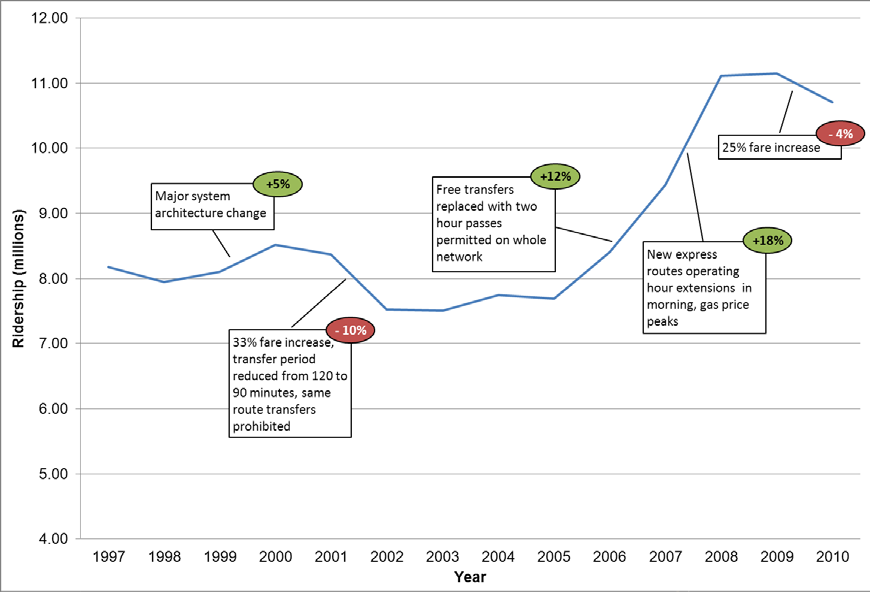
Greater Wellington Regional Council
Wellington City Bus Review
Figure H.2: Public Transport ridership in Spokane, 1997-2010
Source: Spokane Transit
Wellington City Bus Review FINAL
24 November 2011

Greater Wellington Regional Council
Wellington City Bus Review
Appendix I
Potential Impacts of Transfer Penalty Removal in Wellington
Wellington City Bus Review FINAL
24 November 2011
link to page 73

Greater Wellington Regional Council
Wellington City Bus Review
To examine the potential impacts of the proposed changes in transfer policy in Wellington, we have also
undertaken an analysis of the current level of transferring within the current network. This is only available
for those passengers using electronic ticketing (Snapper cards) as these provide a complete data set of
boarding and alighting behaviour, as well as times and bus stops used. This data has been completed
examining only NZBus data due to the availability of information. However, given that all other operators
currently al ow free transfers between their own services, this is unlikely to have too much of a
distortionary impact on the results.
The data presented in this section refers to only Snapper users, so caution should be taken in the
interpretation of these. However, we have no reason to believe that Snapper users as a whole present a
significantly different composition to the total PT population. It has also assumed that al trips in the
database handled were single trips, so the impacts of monthly passes have been excluded from this
analysis. We have also excluded the potential impacts of a fare zone cap on transfer revenues, as this is
a fare issue that wil be handled separately from that of transfers. However, we note that such a policy
would further help to offset any lost revenue from the removal of transfer fares.
Using this database of linked trips, we calculated the number of transfers that occur on a daily basis in
the period from 28 February through until 17 April 2011. Transfers were identified where two trips were
taken by the same passenger ID number from the Snapper system in the same day, where:
The second boarding is within 30 minutes of the first alighting; and
The second boarding stop is less than 400m from the first alighting stop.
The number of total transfers identified the number of linked trips in this subset and the percentage of
these trips is summarised in
Table 4. This covers transfers in the week of 28 Feb – 6 March 2011, and
also a weekly total, and a total for the whole sample period.
Table 23: Transfer total of linked trips in Wel ington, 28 Feb – 17 April
Day/Date
Total transfers
Total linked trips
Percentage
Monday 28 Feb
1,002
33,821
3.0%
Tuesday 1 Mar
1,042
35,450
2.9%
Wednesday 2 Mar
1,100
36,734
3.0%
Thursday 3 Mar
1,063
35,703
3.0%
Friday 4 Mar
1,122
35,974
3.1%
Saturday 5 Mar
437
9,375
4.7%
Sunday 6 Mar
235
6,025
3.9%
Weekly total
6,001
193,082
3.1%
Period total (28 Feb – 17 Apr)
40,904
1,369,404
3.0%
The table highlights that transfers are not a large part of the system, with an average of al trips around
3% across the period. Transfers appear to be slightly higher on weekends, which potential y highlights
that weekend PT users are more likely to rely on these services than those travel ing during the week
(especial y commuters).
The possible revenue impacts of a change in transfer policy are difficult to calculate, as the exact elasticity
of demand and attractiveness of transfers are impossible to calculate for the Wel ington context. From
the experiences discussed in the preceding sections however, we know there wil be two major drivers of
change. The first is a fall in the average trip fare that arises as existing transfers become free, rather than
being paid as a separate fare in the current situation. The second is an increase in patronage generated
due to the improvement in connectivity of the network and ease of travel for both existing and new users.
Wellington City Bus Review FINAL
24 November 2011
link to page 74 link to page 73


Greater Wellington Regional Council
Wellington City Bus Review
The revenue impact is difficult to estimate as the exact type of transfer behaviour across the network
cannot be easily determined. We have identified three predominant types of transfer that exist within the
system. These are presented in
Figure 0.4:
In the first example, the second trip is within the destination zone, so from a pricing perspective, the
total distance of the trip does not change. This results in a one zone revenue loss for the transfer
trip, with the second trip now free. Under Snapper pricing, this would be $1.60.
In the second example, the second trip continues the journey into a further fare zone. This will result
in a smaller impact on revenue, as the free transfer is offset by an increased journey fare. However,
instead of paying two one-zone fares, the passenger wil only pay one two-zone fare. Under Snapper
pricing, the revenue impact of this trip would be $0.74 (the difference between two one-zone fares,
and a two zone fare).
The third example is likely to be less common, but is possible within the system. The second trip is
either a return in the same direction, or in a perpendicular direction that shifts it into a zone previously
passed through. This would have the largest impact on revenue, and the trip shown in the figure
would now only incur a one-zone fare, having previously paid a two-zone fare, and a one-zone fare.
Under Snapper pricing, this would have a revenue impact of $2.64.
Figure 0.3: Transfer types
Zone One
Zone Two
Zone Three
Recognising that the most likely transfers in the system are likely to be the first or second type from the
above example, we have used an average revenue loss of $1.44, which assumes a split of 6:3:1 for the
three types of transfer trips identified. We have used the new fares implemented on November 1, 2011,
and also the prices for Snapper rather than cash fares. It is likely that users would need to be using
Snapper cards or some other form of electronic ticketing to be eligible for free transfers.
We now take the average revenue loss and the average level of transfers in the system (from
Table 4) to
calculate the total impact given the current level of trips. In the 2009/10 financial year, the total number of
bus trips was 23,650,000, which equates to roughly 455,000 trips per week across al operators. Under
these assumptions, the potential farebox revenue impact would be $19,650 per week, or $1,000,000 per
annum. However, this figure excludes any new trip generation resulting from a more connected network
for both existing and new users.
Patronage gains experienced as a result of changes in transfer policy alongside other improvements have
ranged from 3% (buses in New York) through to 15% (underground in Madrid) and as high as 33% in
London. To break-even revenue with the change of transfer policy in Wel ington, new trip revenue would
need to equal that lost as a result of free transfers.
Table 5 summarises the calculations in relation to
Wellington City Bus Review FINAL
24 November 2011
link to page 75

Greater Wellington Regional Council
Wellington City Bus Review
both the total number of new trips required, and also what this would mean on a per capita basis for
Wellington
24.
Table 24: New trips needed to break-even fare revenue under new transfer policy (per annum)
Trip type
Number of new trips req.
Per capita trip increase
Percentage of total trips
One zone trips
640,000
3.7
2.7%
Two zone trips
420,000
2.4
1.8%
Three zone trips
310,000
1.8
1.3%
The analysis shows that the required trip generation per capita to breakeven are low, and in fact below
the patronage increases seen in the international literature, which generally see an increase of between 5-
10% fol owing the implementation of free transfers. As such, it is likely that implementing free transfers
would have both a positive impact on both revenue and patronage for PT in Wel ington.
24 Population base for the study area population used - 172,000 in 2006.
Wellington City Bus Review FINAL
24 November 2011