
GWRC Bus and Rail
Patronage, Revenue and
Costing Analysis
Andy Ford (GWRC) & Ian Wallis (Ian Wallis Associates)
3rd September 2012

Contents
•
Introduction
•
Bus Data
•
Rail Data
•
Costs, Revenue, Cost Recovery
–
Rail, by Service and Segment
–
Bus, by Area
–
Combined Bus & Rail
•
Summary
•
Any Questions?

Rail Data
•
Survey data from WPTM model build & WPTM demand matrices
•
Estimates of patronage, revenue and pax km by:
–
Time period (AM, IP), Service & Segment;
–
Passenger (Adult / Child / Supergold) and Fare (Cash, 10-trip, monthly); and
–
Annualized to obtain yearly estimates
•
Controlled at a line level to GWRC patronage and revenue - 12/13 totals
•
Costings obtained from GWRC
–
Operating costs - allocated by service / line
–
Capital costs – allocated proportionately
•
Outputs Op Costs, Revenue, Subsidy, Cost Recovery by Service & Segment

Bus Data
•
ETM data used for WPTM model build
•
Estimates of patronage / revenue and pax km by:
–
Time period & Line
–
Passenger (Adult / Child / Supergold) and Fare (Purse, Cash, Other)
–
Across whole region, inc school buses
•
Controlled to GWRC patronage and revenue 12/13 totals and used as input to BPM
•
Costings obtained from GWRC
–
Allocated to line / area
–
Input into BPM
–
Validated against GWRC costings
•
Outputs from BPM Op Costs, Revenue, Subsidy, Cost Recovery by Area

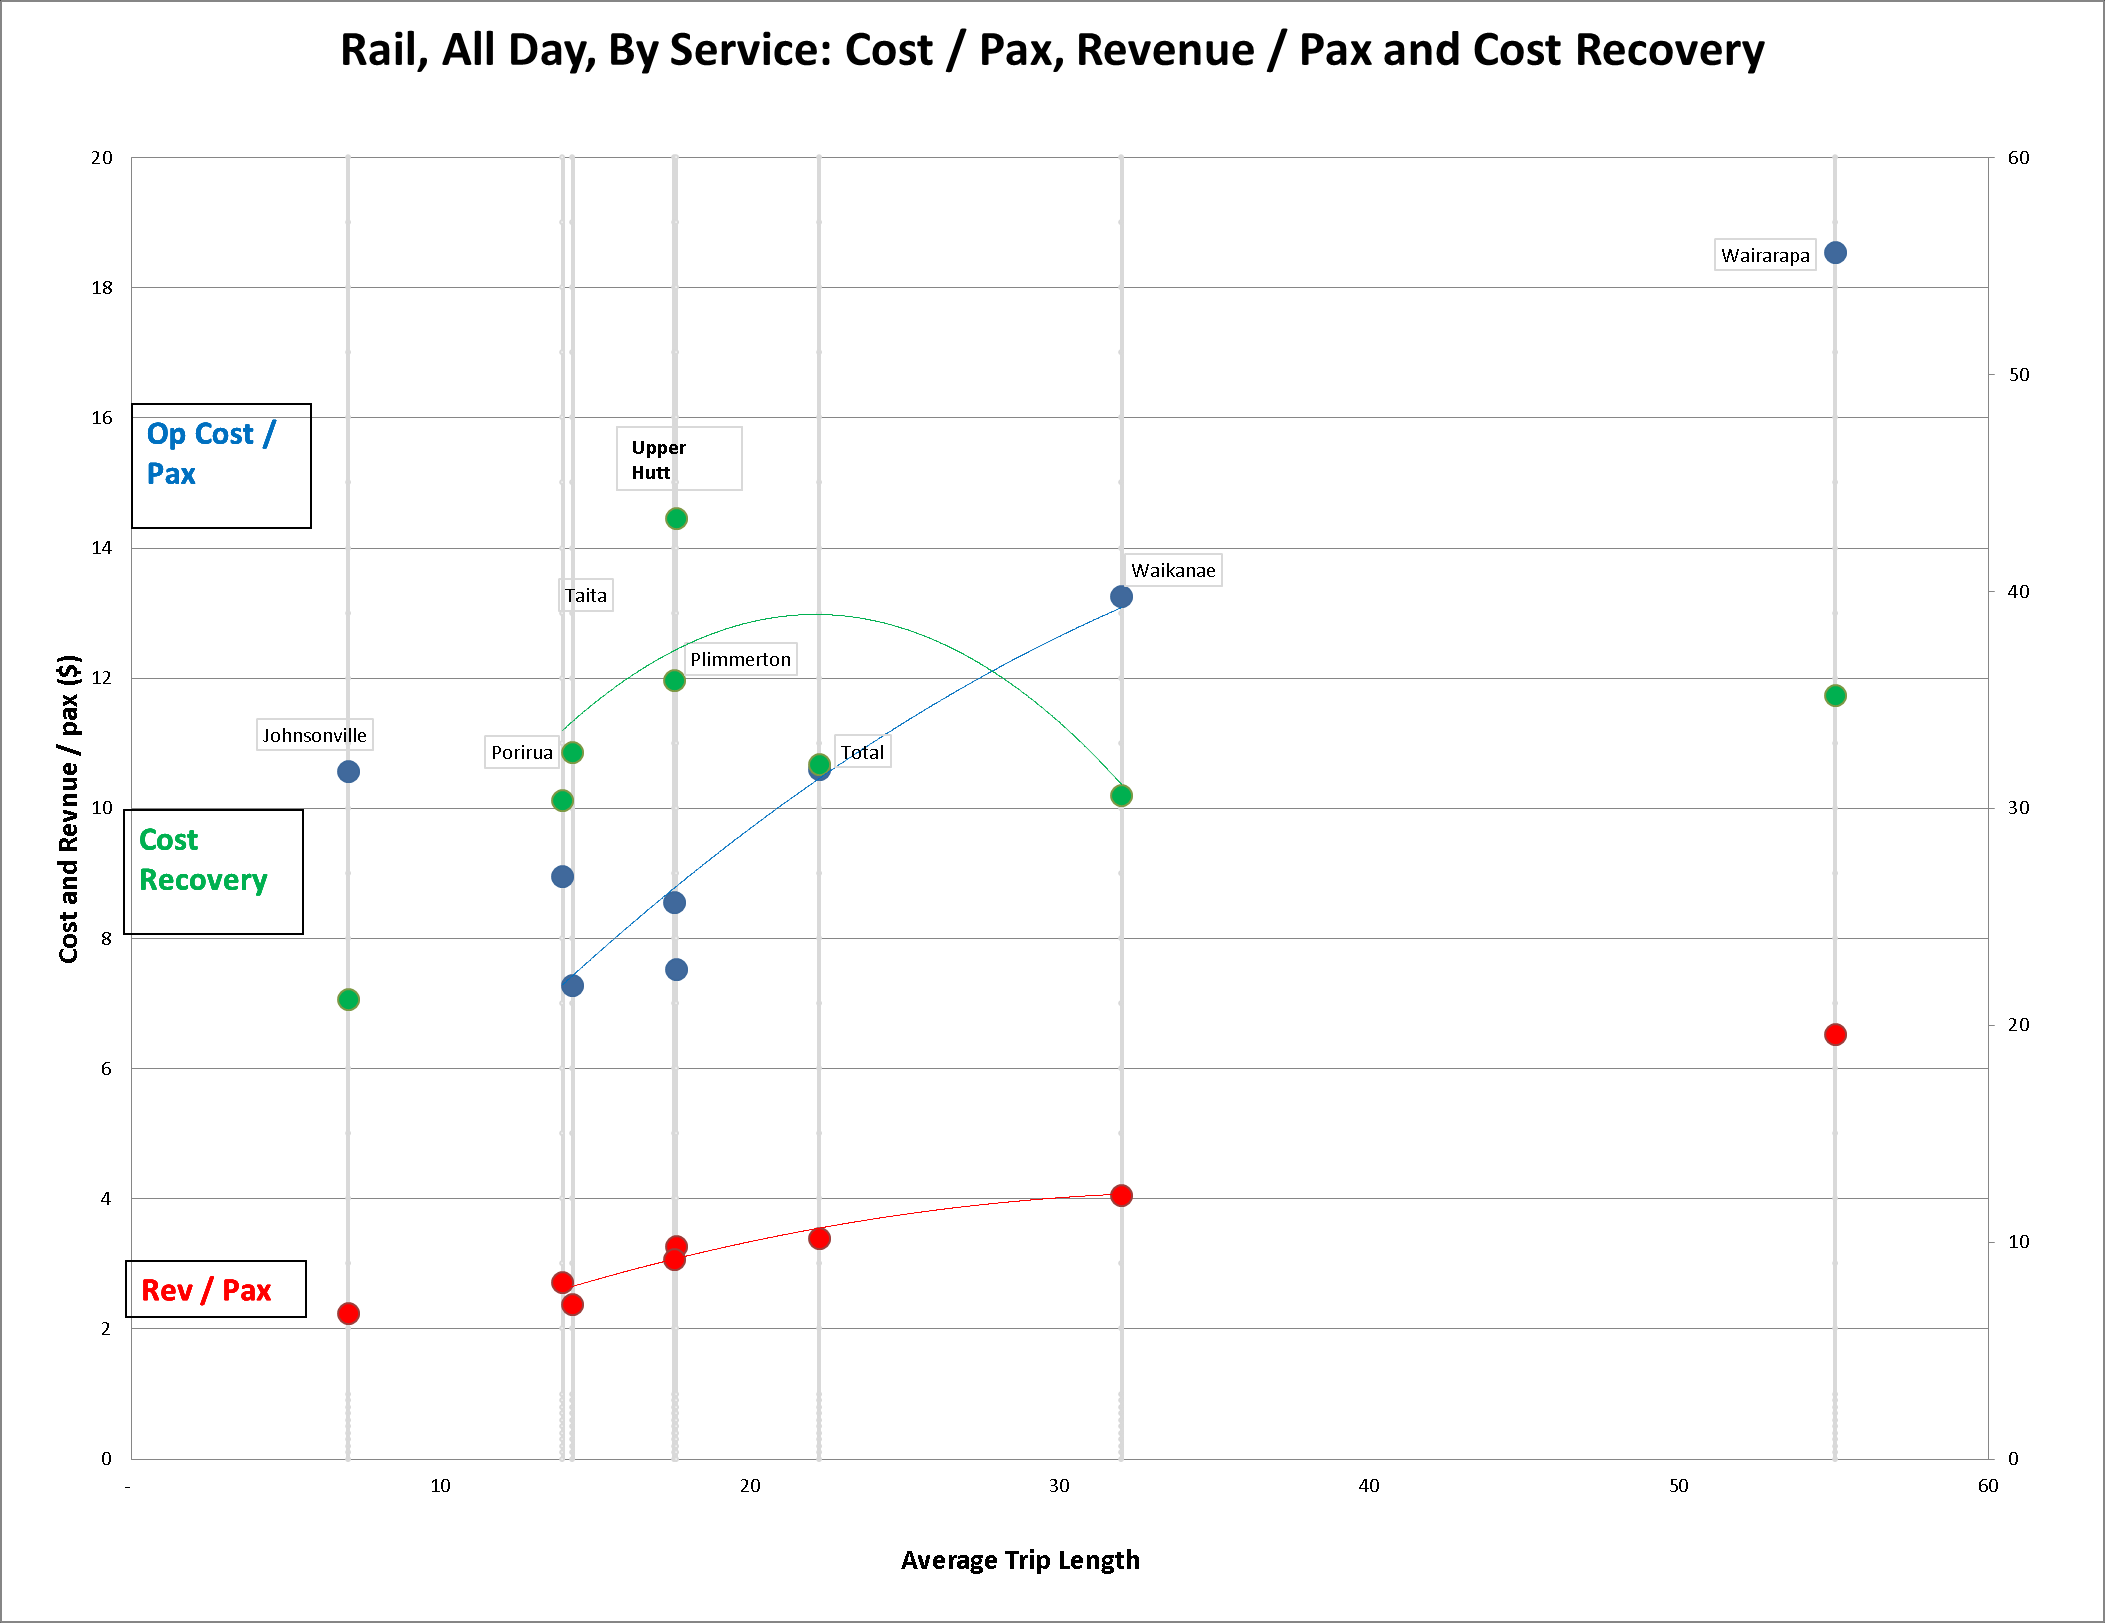
Rail All Day, Service, Pax v Avg TL
Rev / Pax
Linear relationship
with Avg TL
Released under LGOIMA, data not current
Op Cost / Pax
WRL = High
Por / Tai / Plim =
Low
Linear
Diverging from Rev /
Pax
Cost Recovery
Between 30% to
43%, Avg = 32%

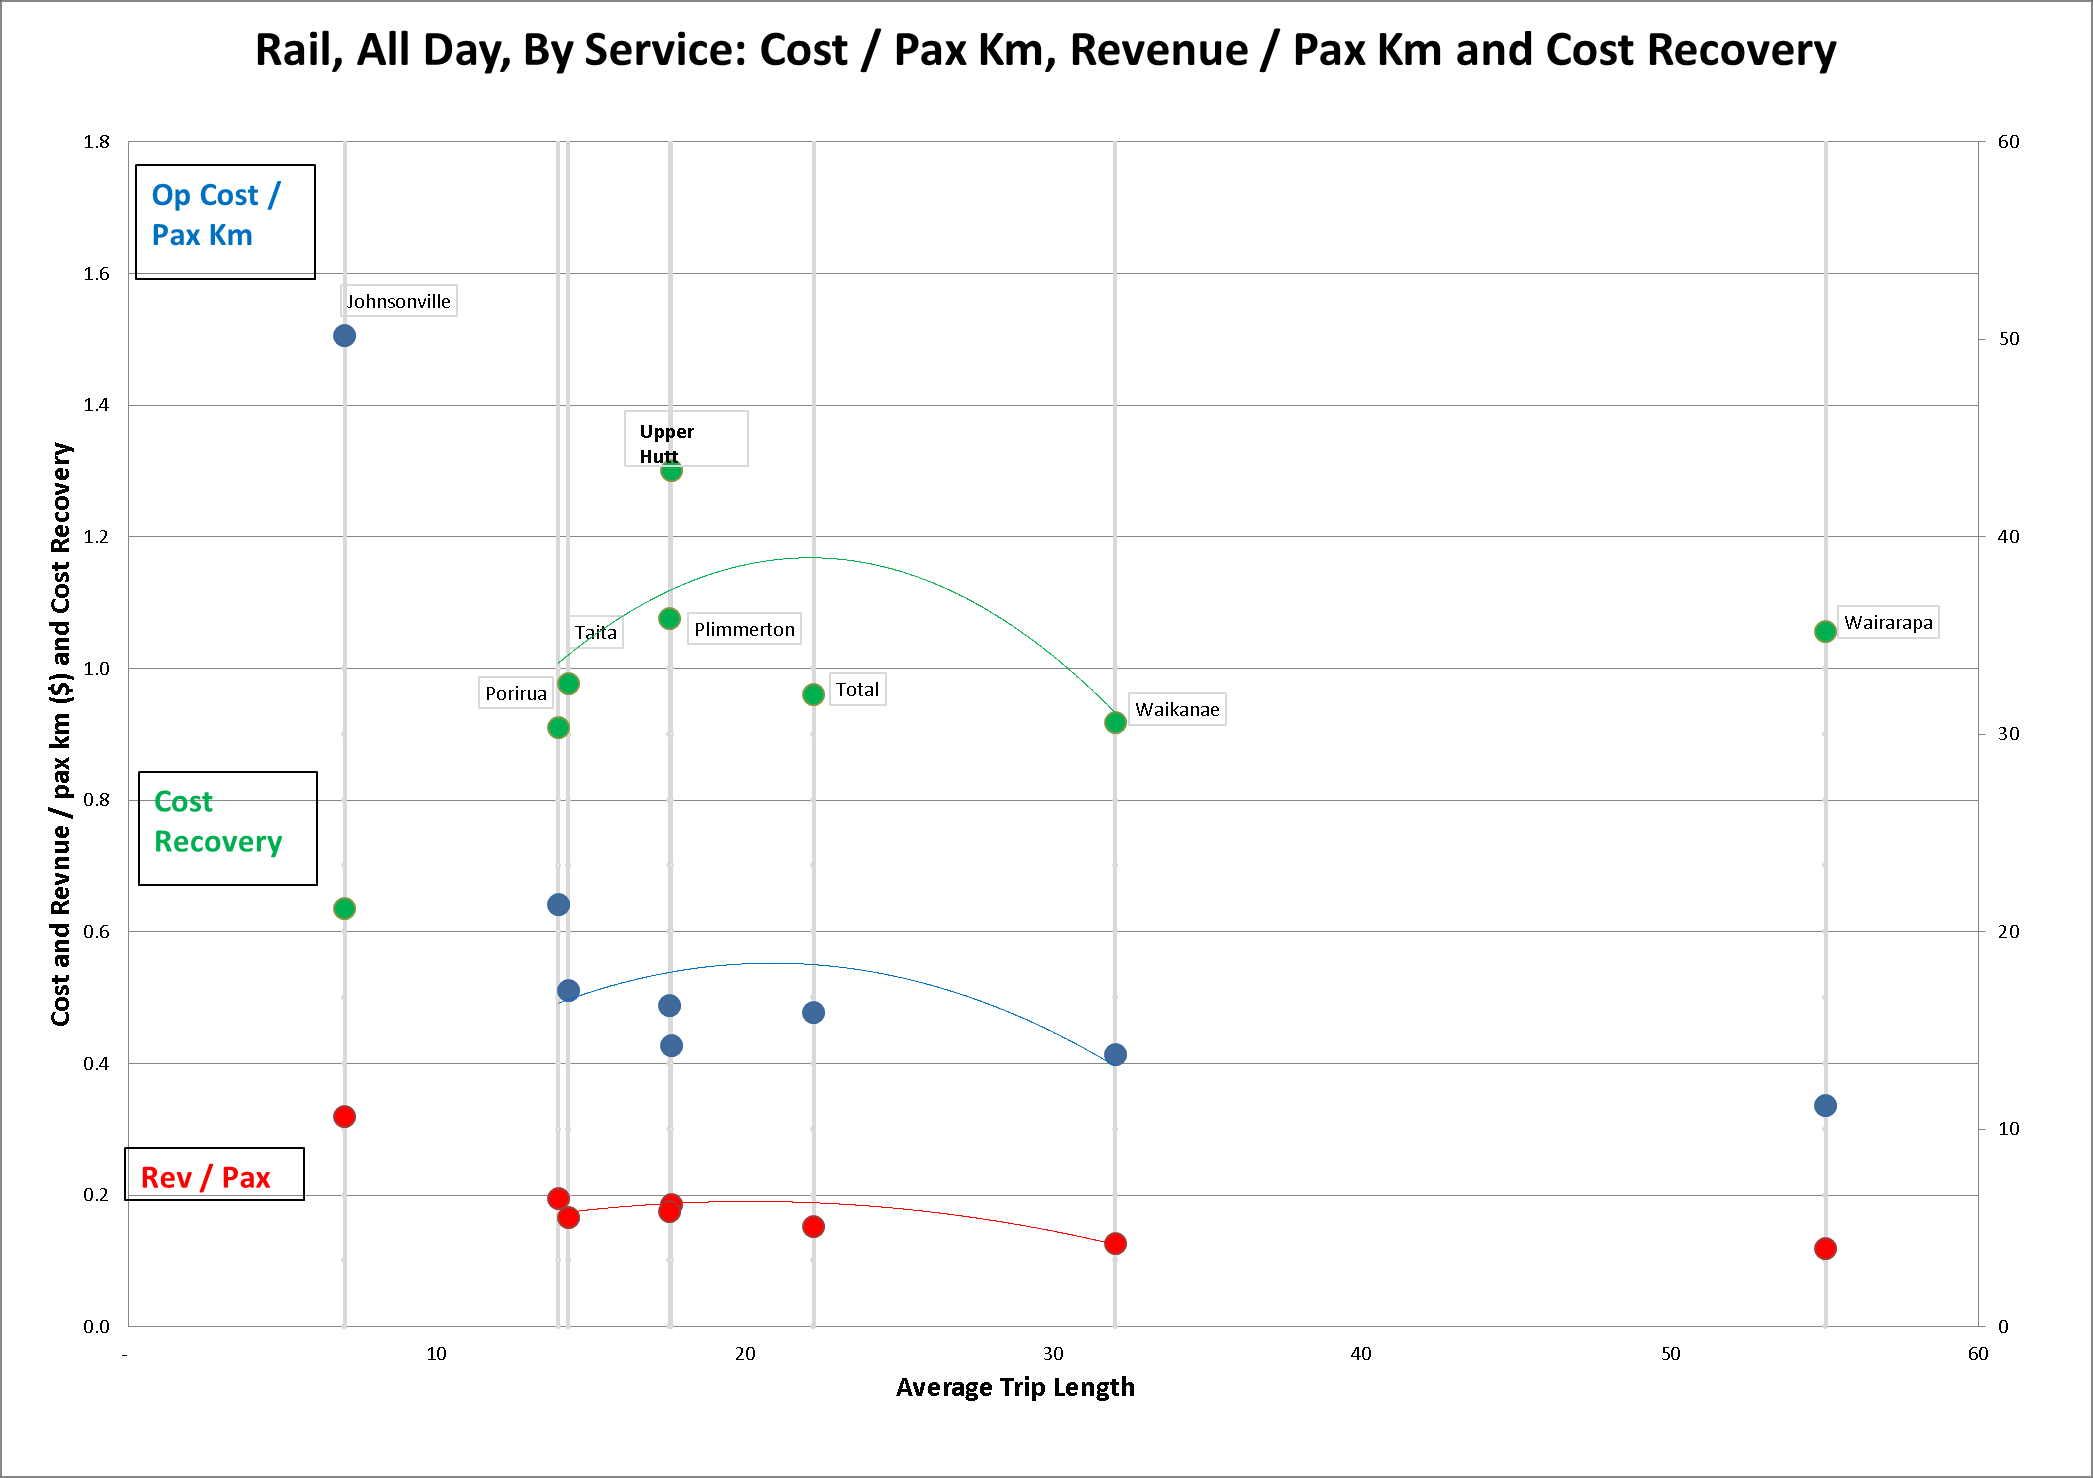

Rail All Day, Service, Pax Km v Avg TL
Rev / Pax Km
Decrease with Avg
TL
Op Cost / Pax Km
Decrease with Avg
TL.
Higher than Rev /
Pax Km
Cost Recovery
As per previous slide

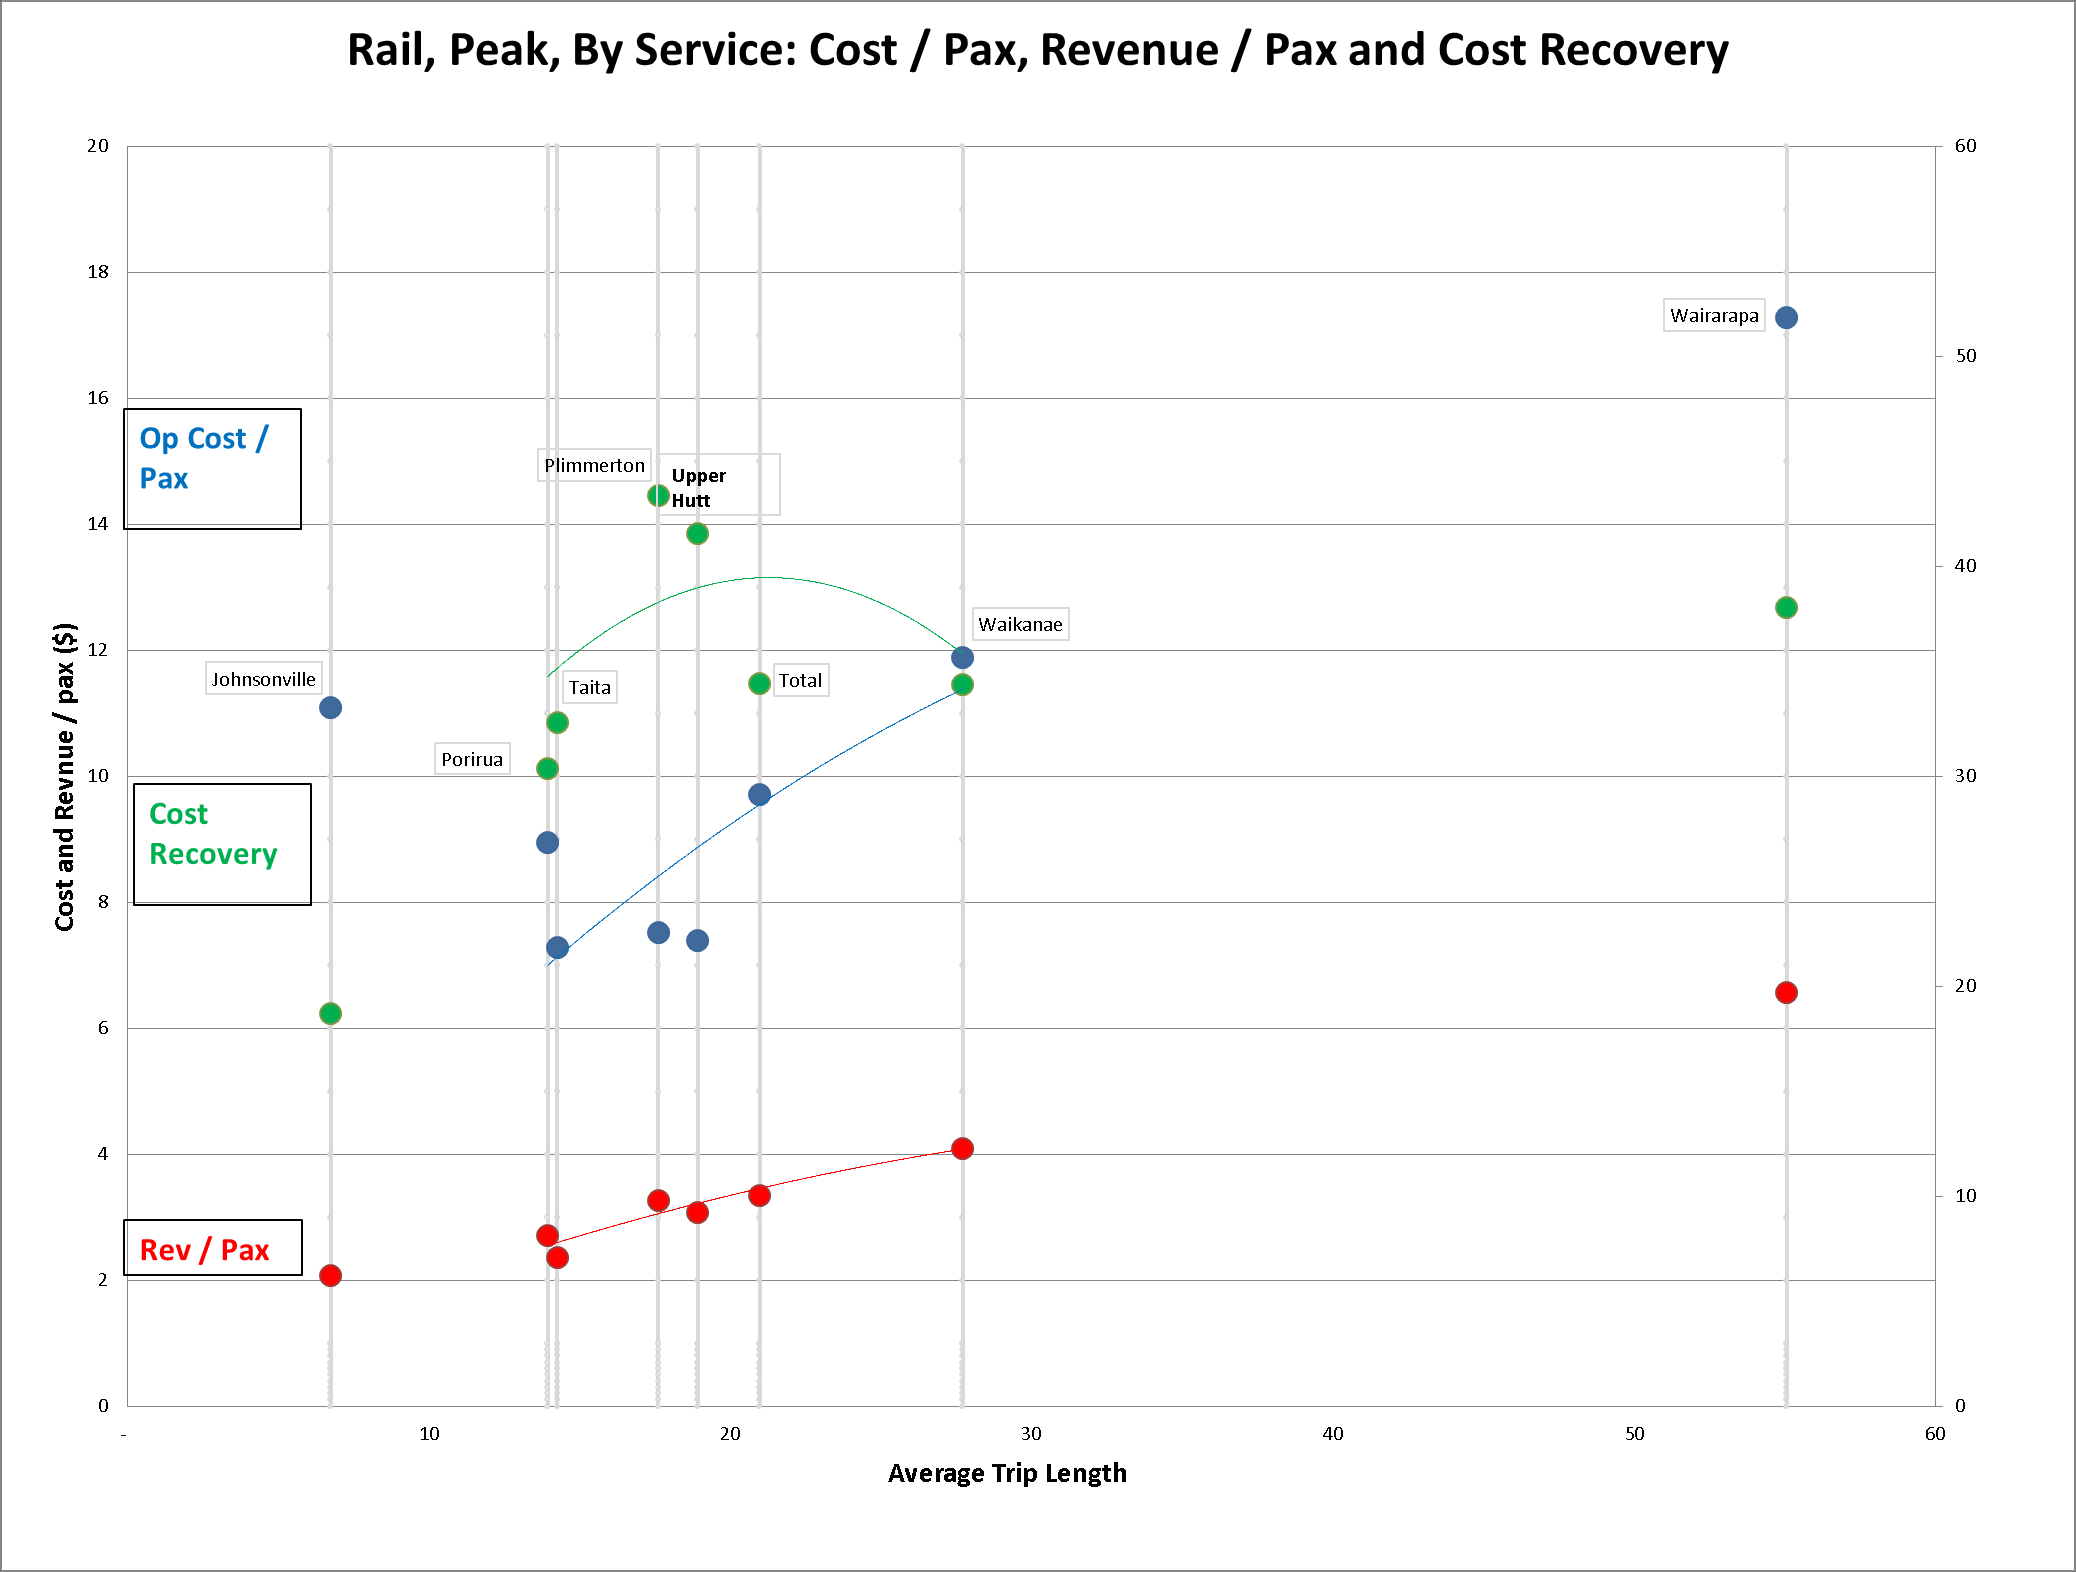
Rail Peak, Service, Pax v Avg TL
Rev / Pax
Linear Relationship with
Avg TL
Op Cost / Pax
Released under LGOIMA, data not current
Linear Relationship
with Avg TL
Cost Recovery
Marginally higher than
all day
JVL = Low
Medium distance lines
(UH, Plim) = Best

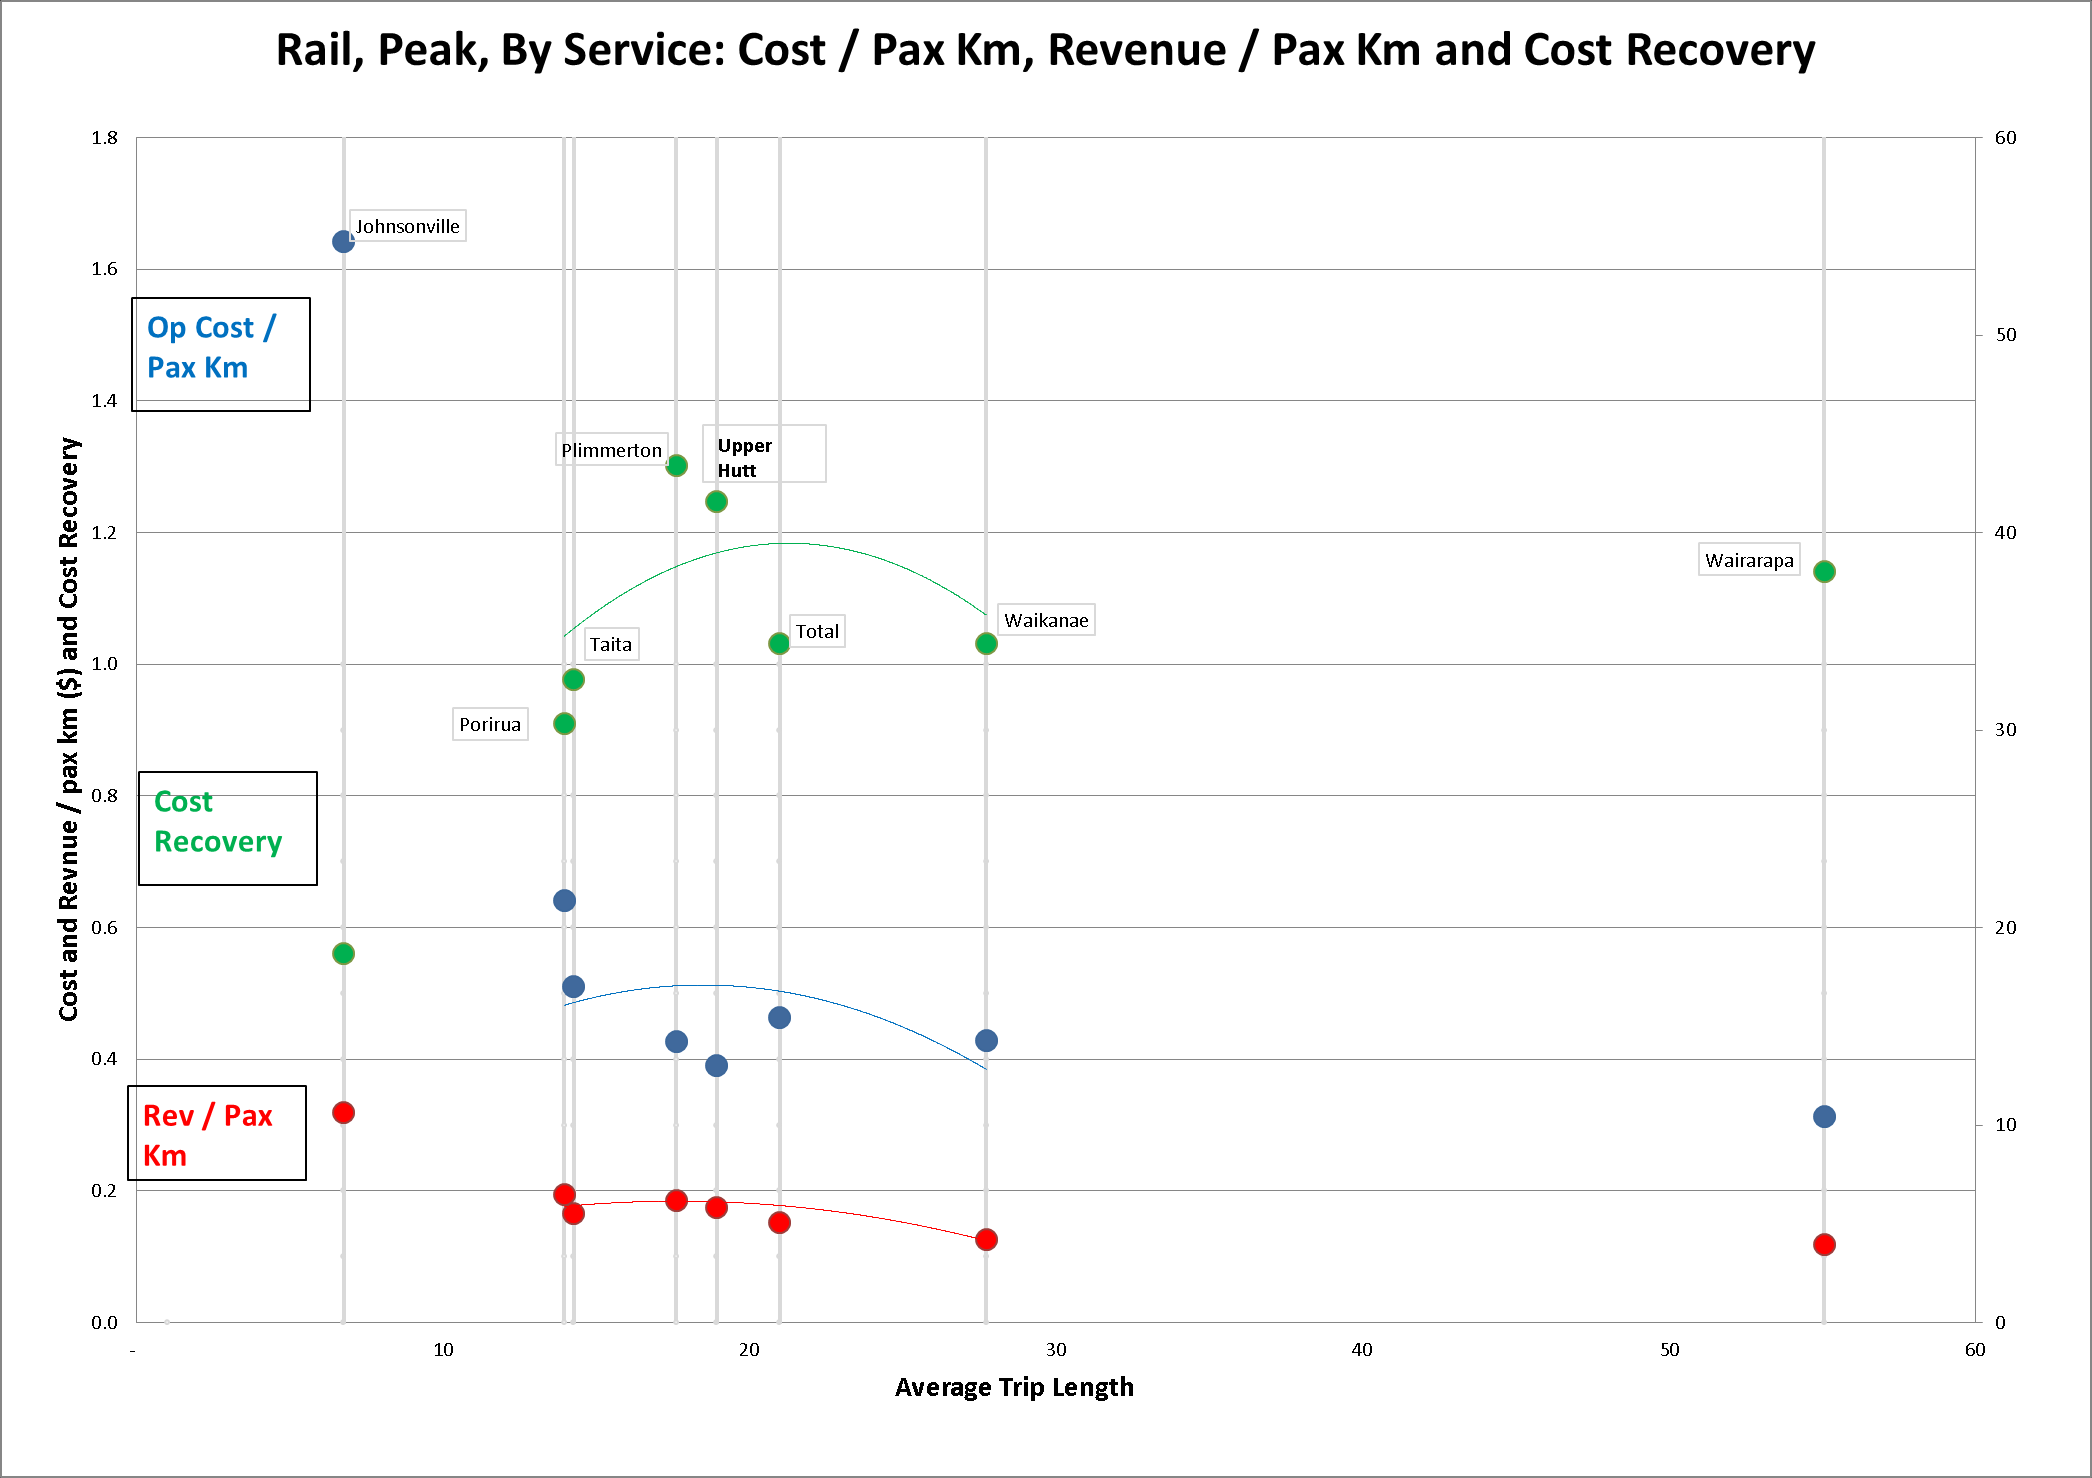
Rail Peak, Service, Pax Km v Avg TL
Rev / Pax Km
Decrease as TL
increase
Op Cost / Pax Km
Avg TL Increases, Op
Released under LGOIMA, data not current
Cost / Km Decreases
JVL = High Op Cost /
Pax Km
Cost Recovery
As per previous slide

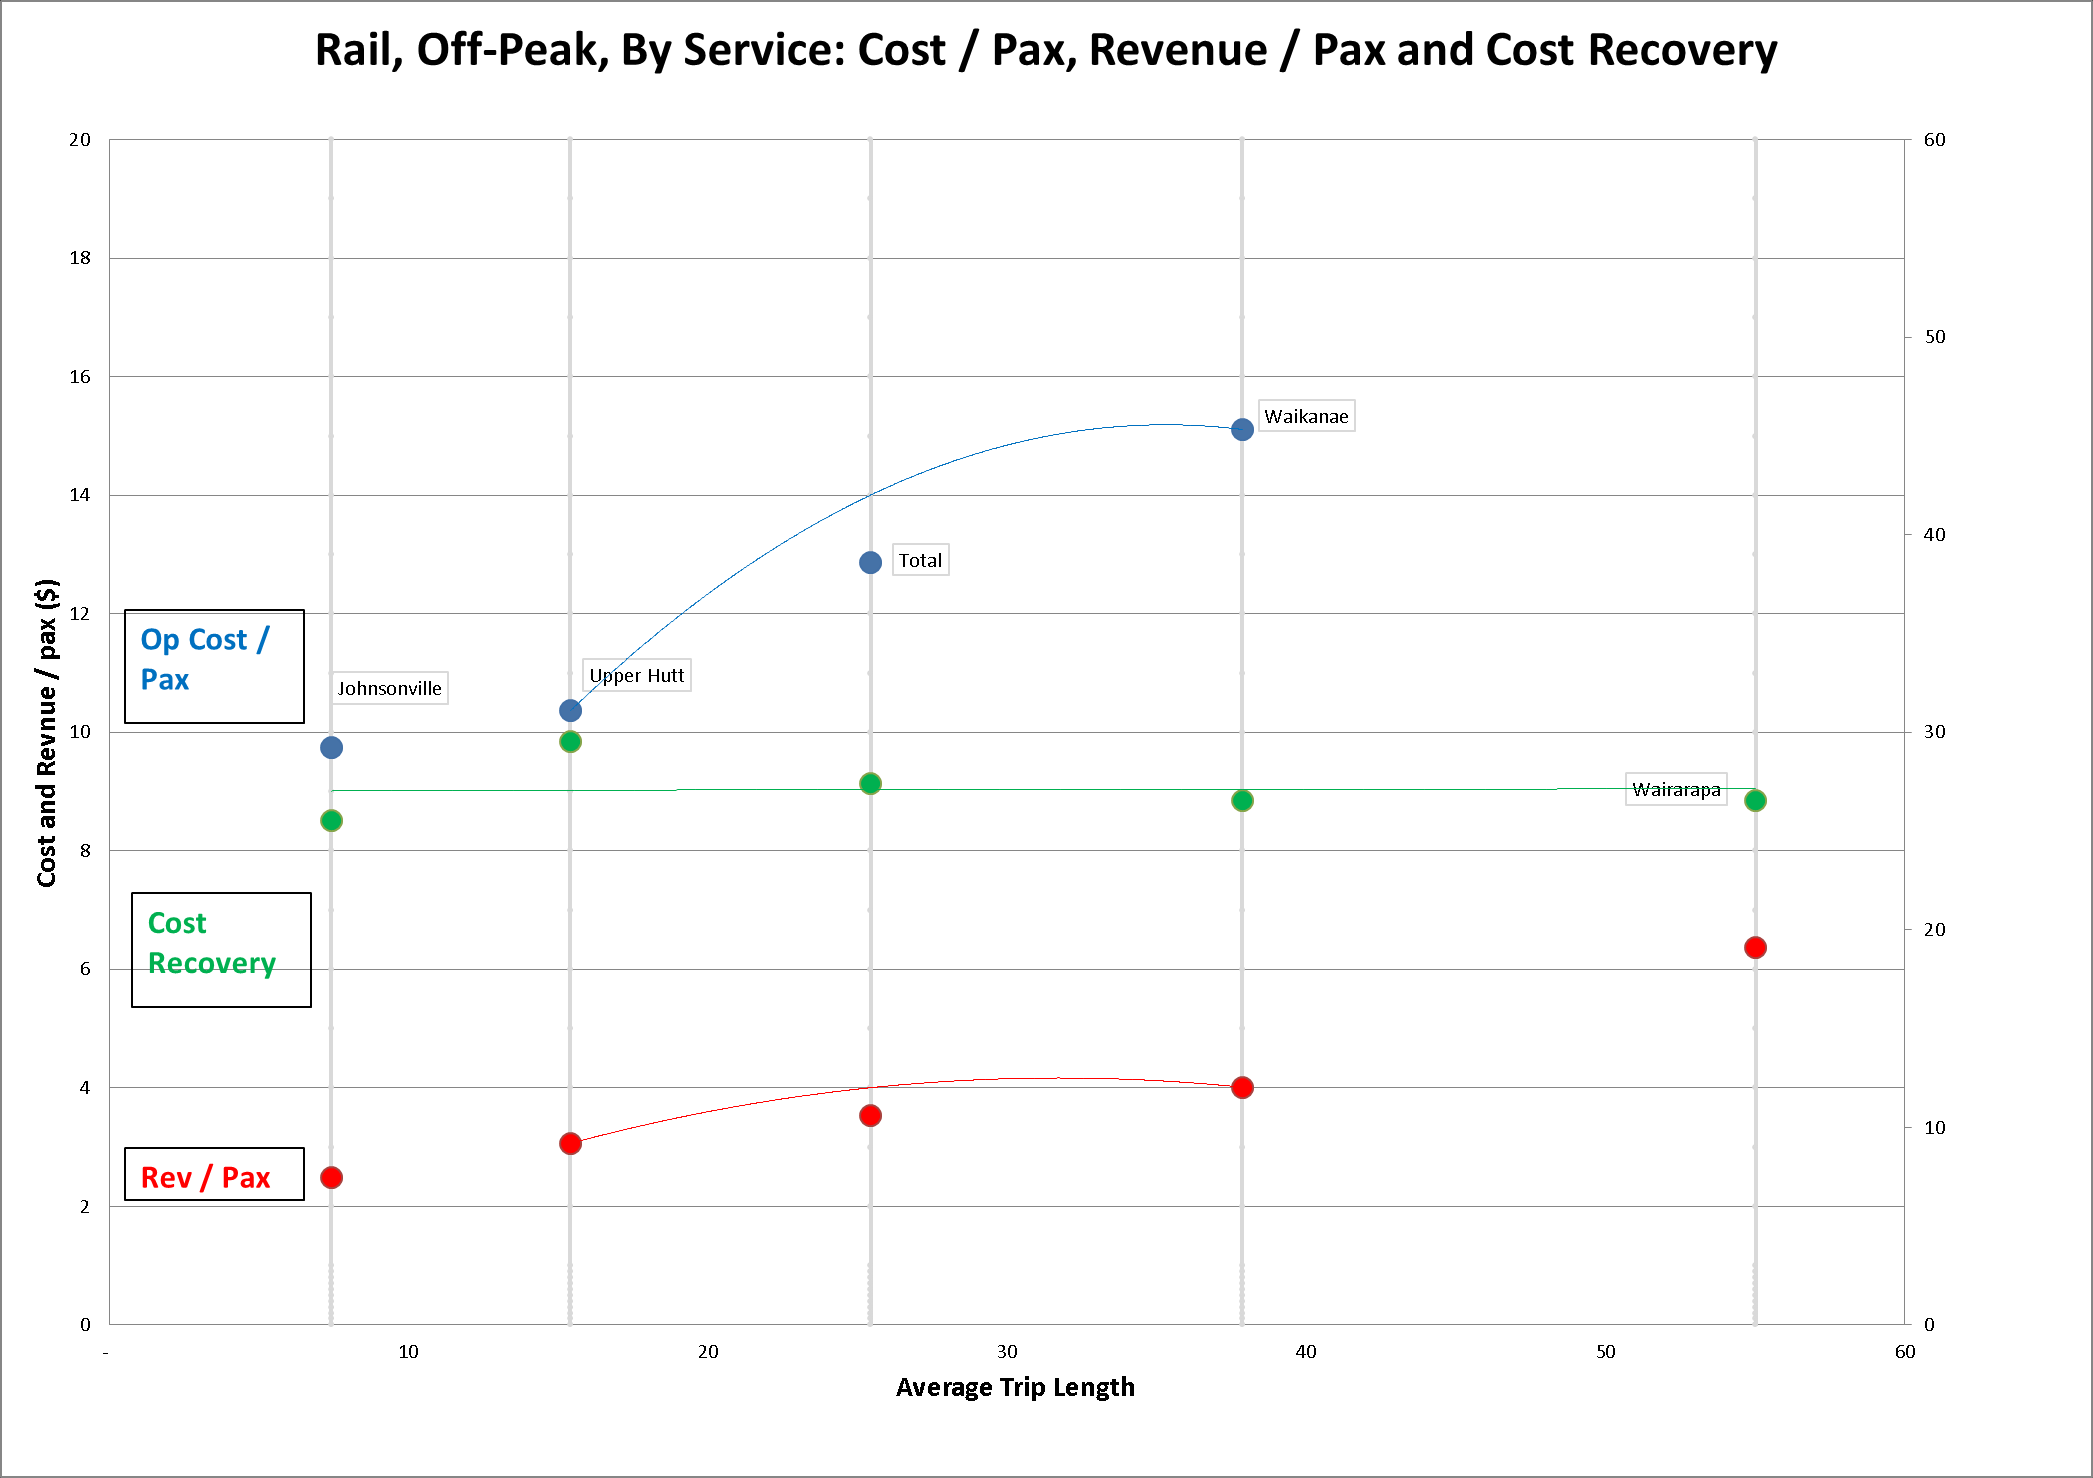
Rail Off Peak, Service, Pax Km v Avg TL
Rev / Pax
Increases with Avg
Released under LGOIMA, data not current
TL
Op Cost / Pax
Increases with Avg
TL
Faster rate of
increase than Rev /
pax
Cost Recovery
27 to 29% across all
lines
Flat
Less than Peak

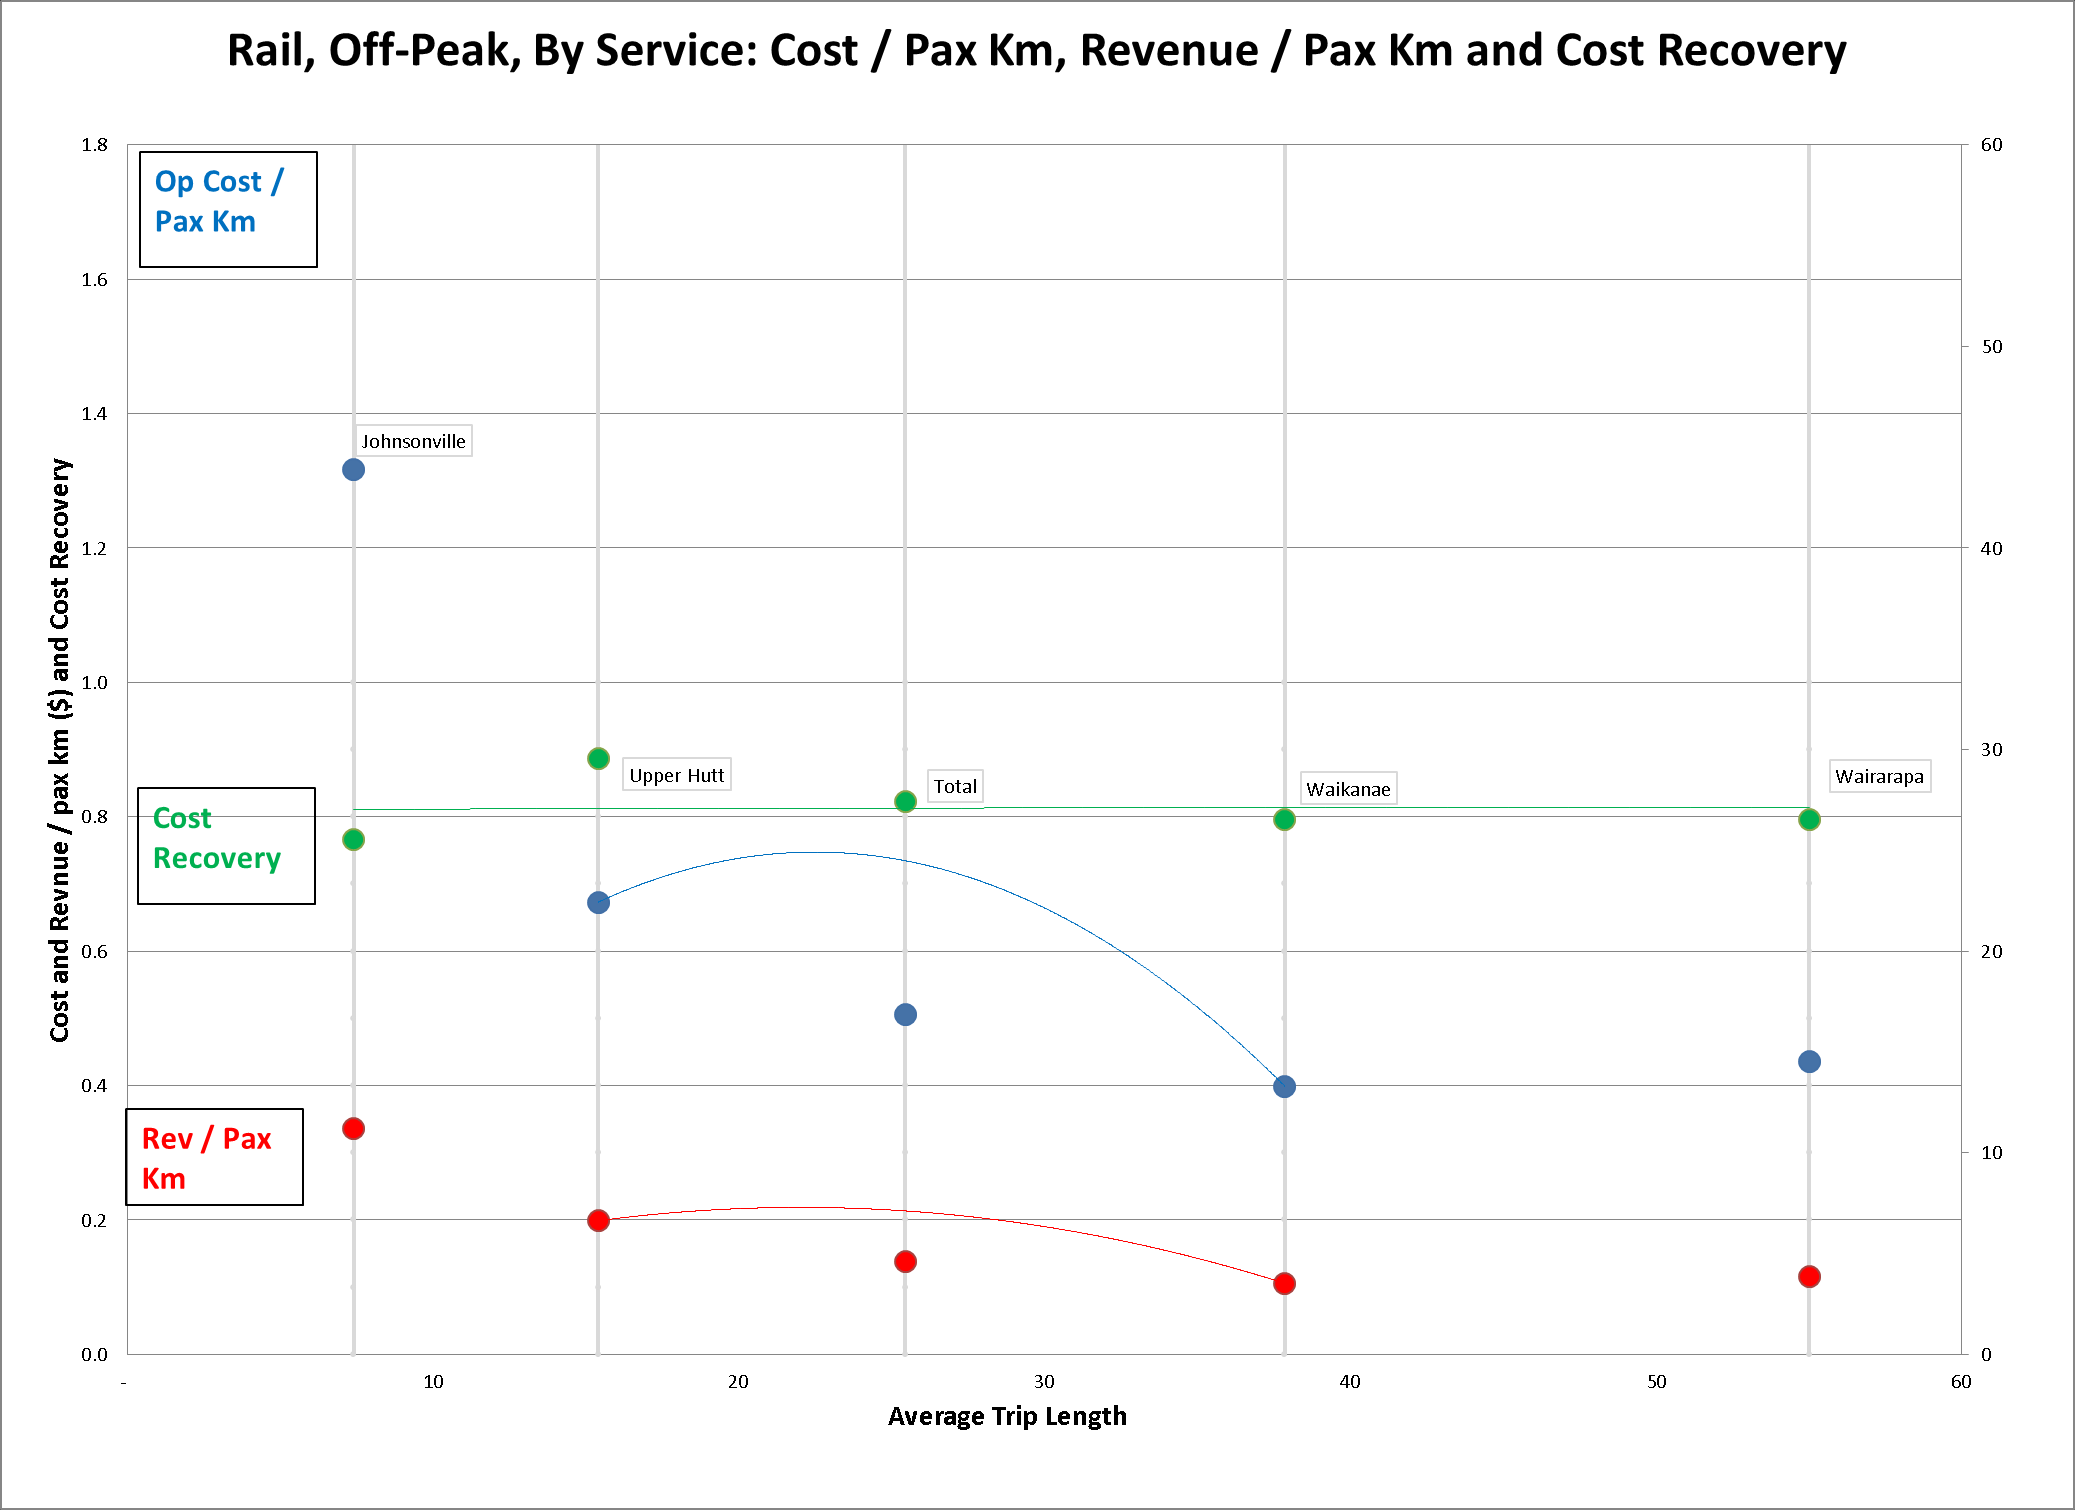
Rail Off Peak, Service, Pax Km v Avg TL
Rev / Pax Km
Decreases with Avg
Released under LGOIMA, data not current
TL
Op Cost / Pax Km
Decreases with Avg
TL
Cost Recovery
As per previous slide
Flat
Less than Peak

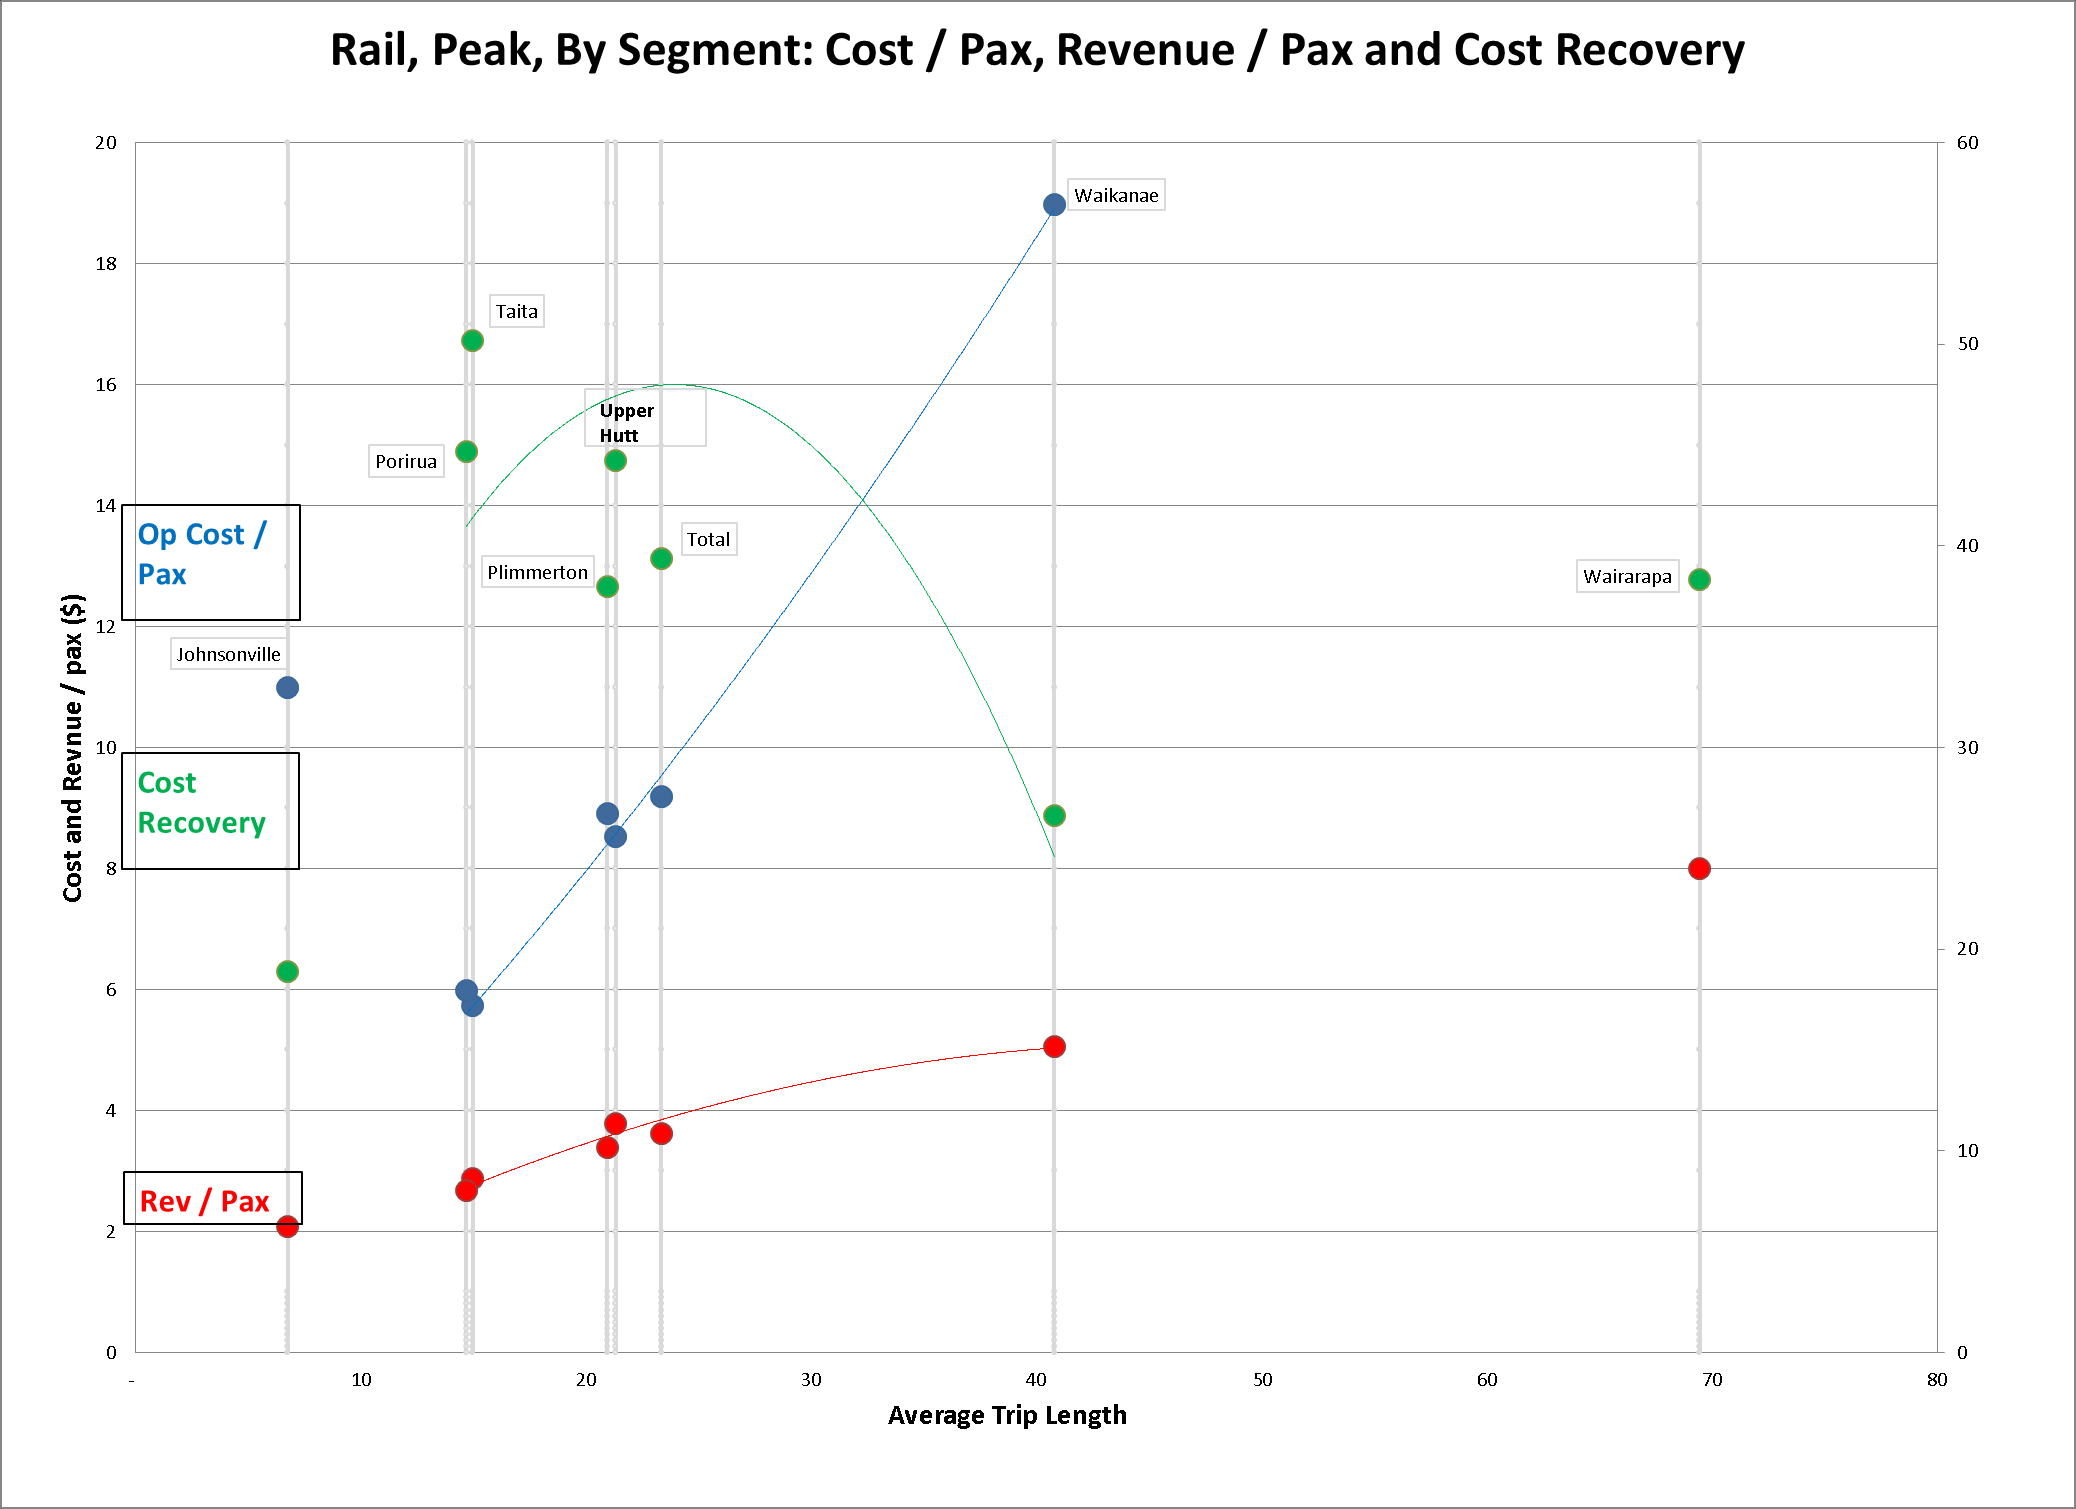
Rail Peak, Segment, Pax v Avg TL
Rev / Pax
Increases with Avg TL
Op Cost / Pax
Increases with Avg TL
Faster rate of increase
than Rev / pax
JVL = Outlier
Cost Recovery
Lower Avg TL = Higher
Avg Load Factors
Released under LGOIMA, data not current
CR = Higher for shorter
segments

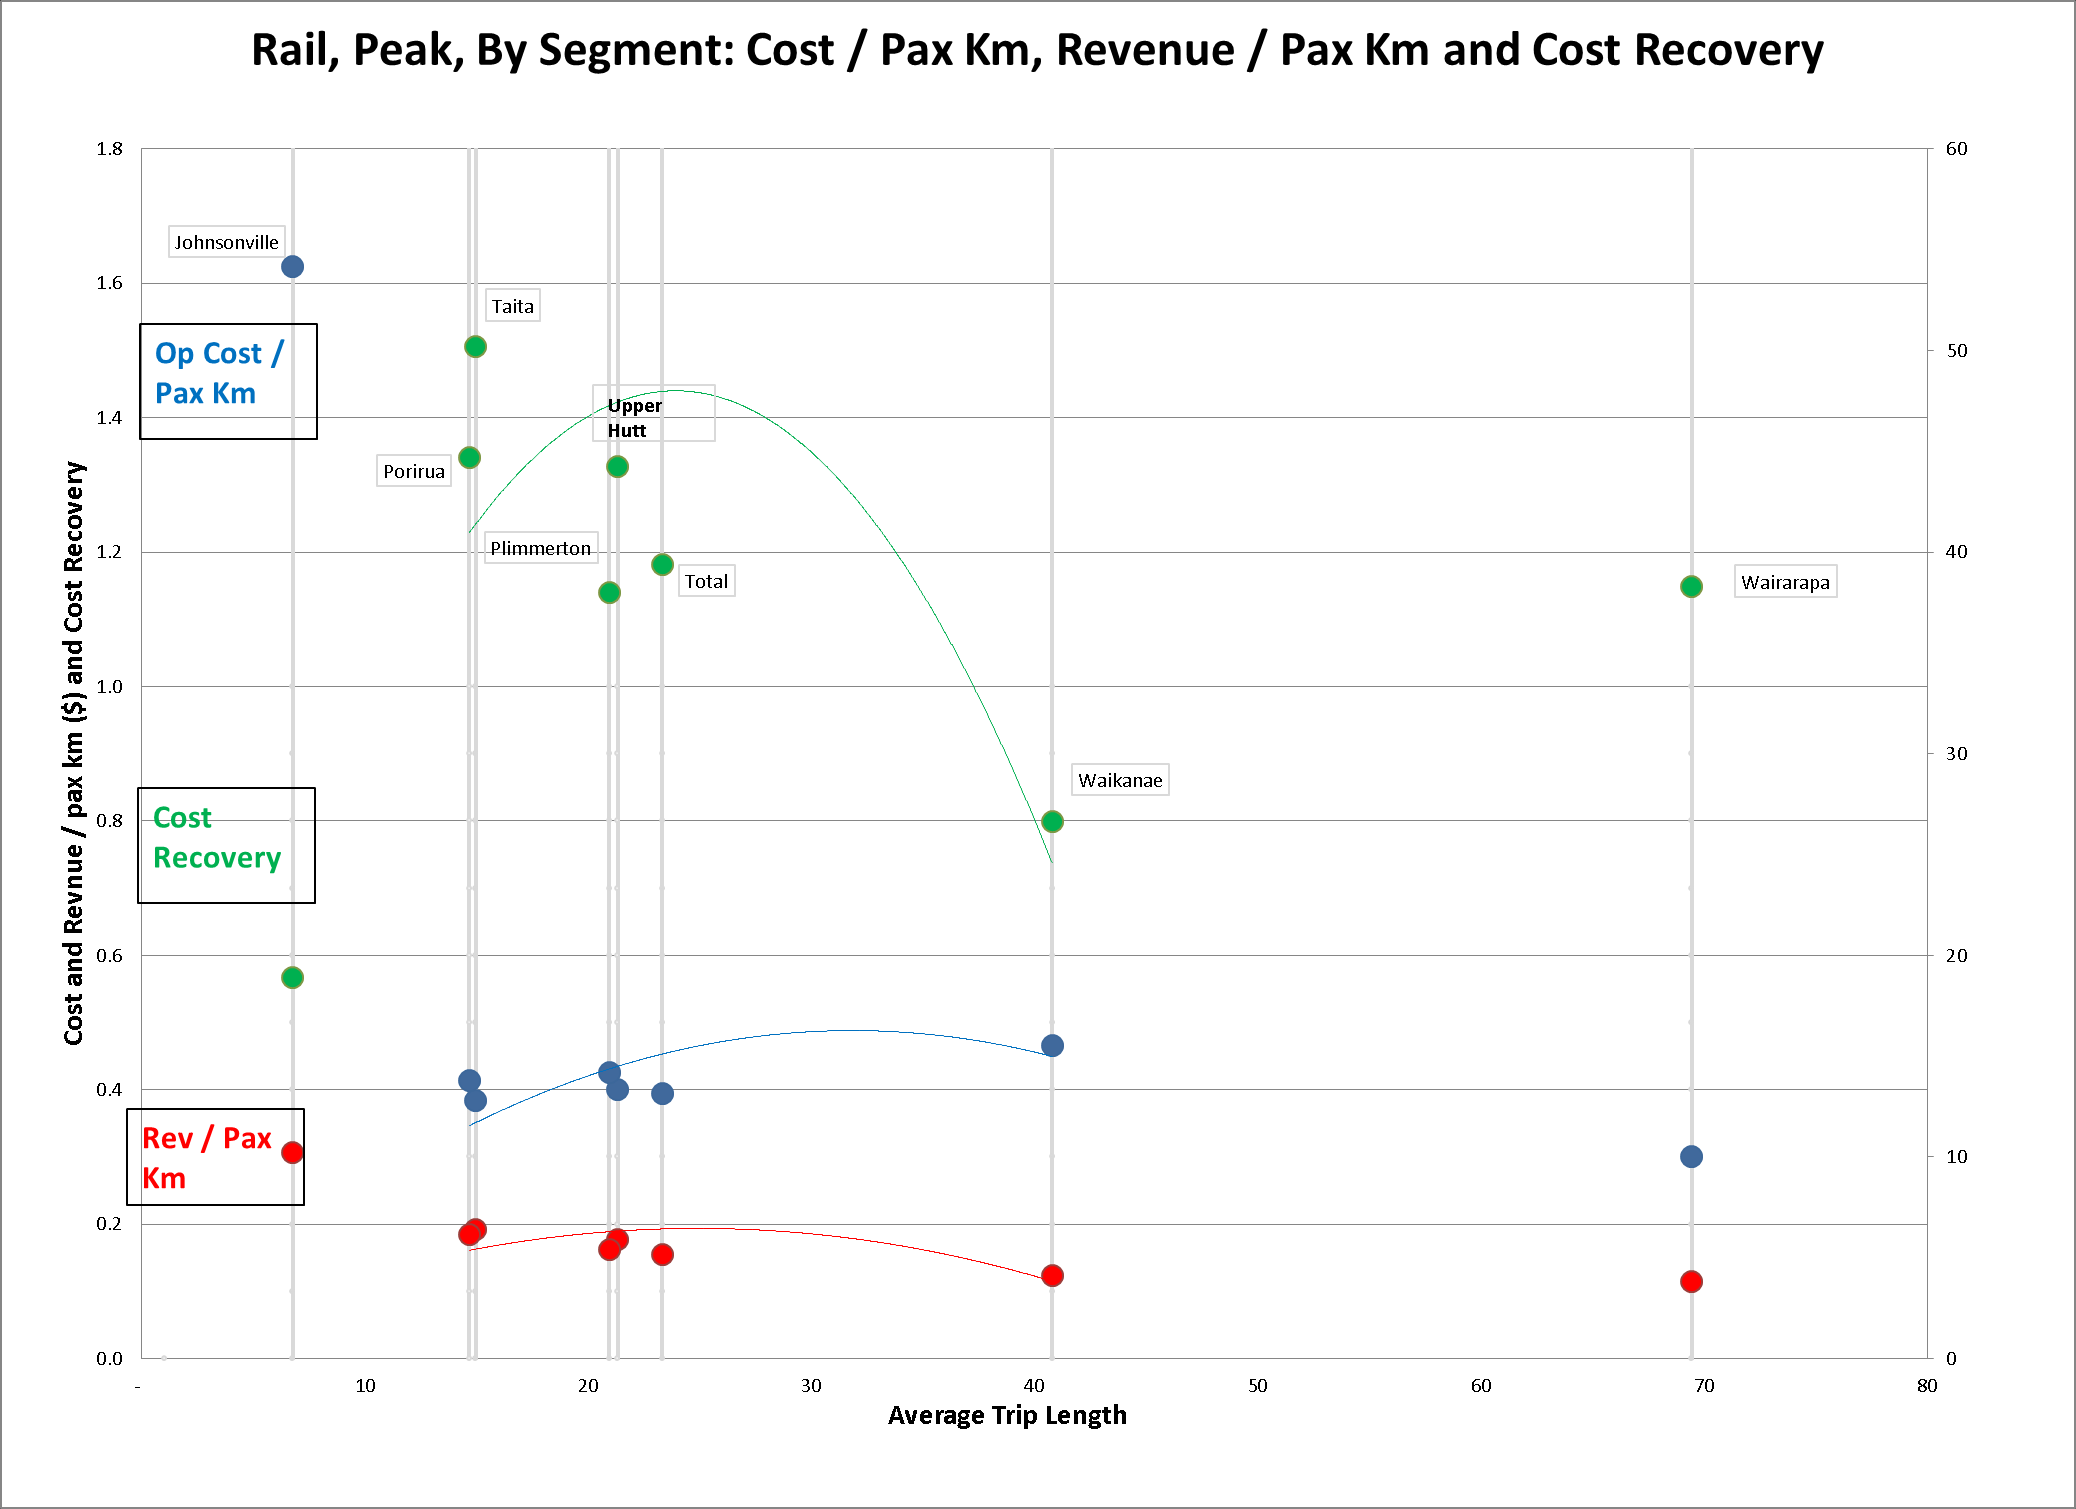
Rail Peak, Segment, Pax Km v Avg TL
Rev / Pax Km
Decreases with Avg TL
Released under LGOIMA, data not current
Op Cost / Pax Km
Decreases with Avg TL
Waikanae Segment =
High cost / pax km
Cost Recovery
Shorter segments =
higher CR
Apart from JVL
Waikanae = Lowest CR

Summary Rail
•
Rail CR = ~35%
•
Service analysis:
–
Rev / pax and Op Cost / Pax increase as Avg TL increase
–
Diverging trends: Difference between Rev / pax and Op Cost / pax increases as Avg TL increases
– Subsidy required increases as Avg TL increases
–
Little variation in CR (apart from JVL)
–
Peak CR Higher than Off-peak CR (not by much)
•
Segment analysis:
–
Shorter segments (Por-WLG, Waterloo-WLG) Higher CR
– Higher Load Factors on shorter segments, therefore costs go down
–
Waikanae / Wairarapa High costs, Fewer boardings, lower load factor relative to shorter segments
– Lower CR

s7(2)(b)(ii) – commercial
position and s7(2)(c)(i) -
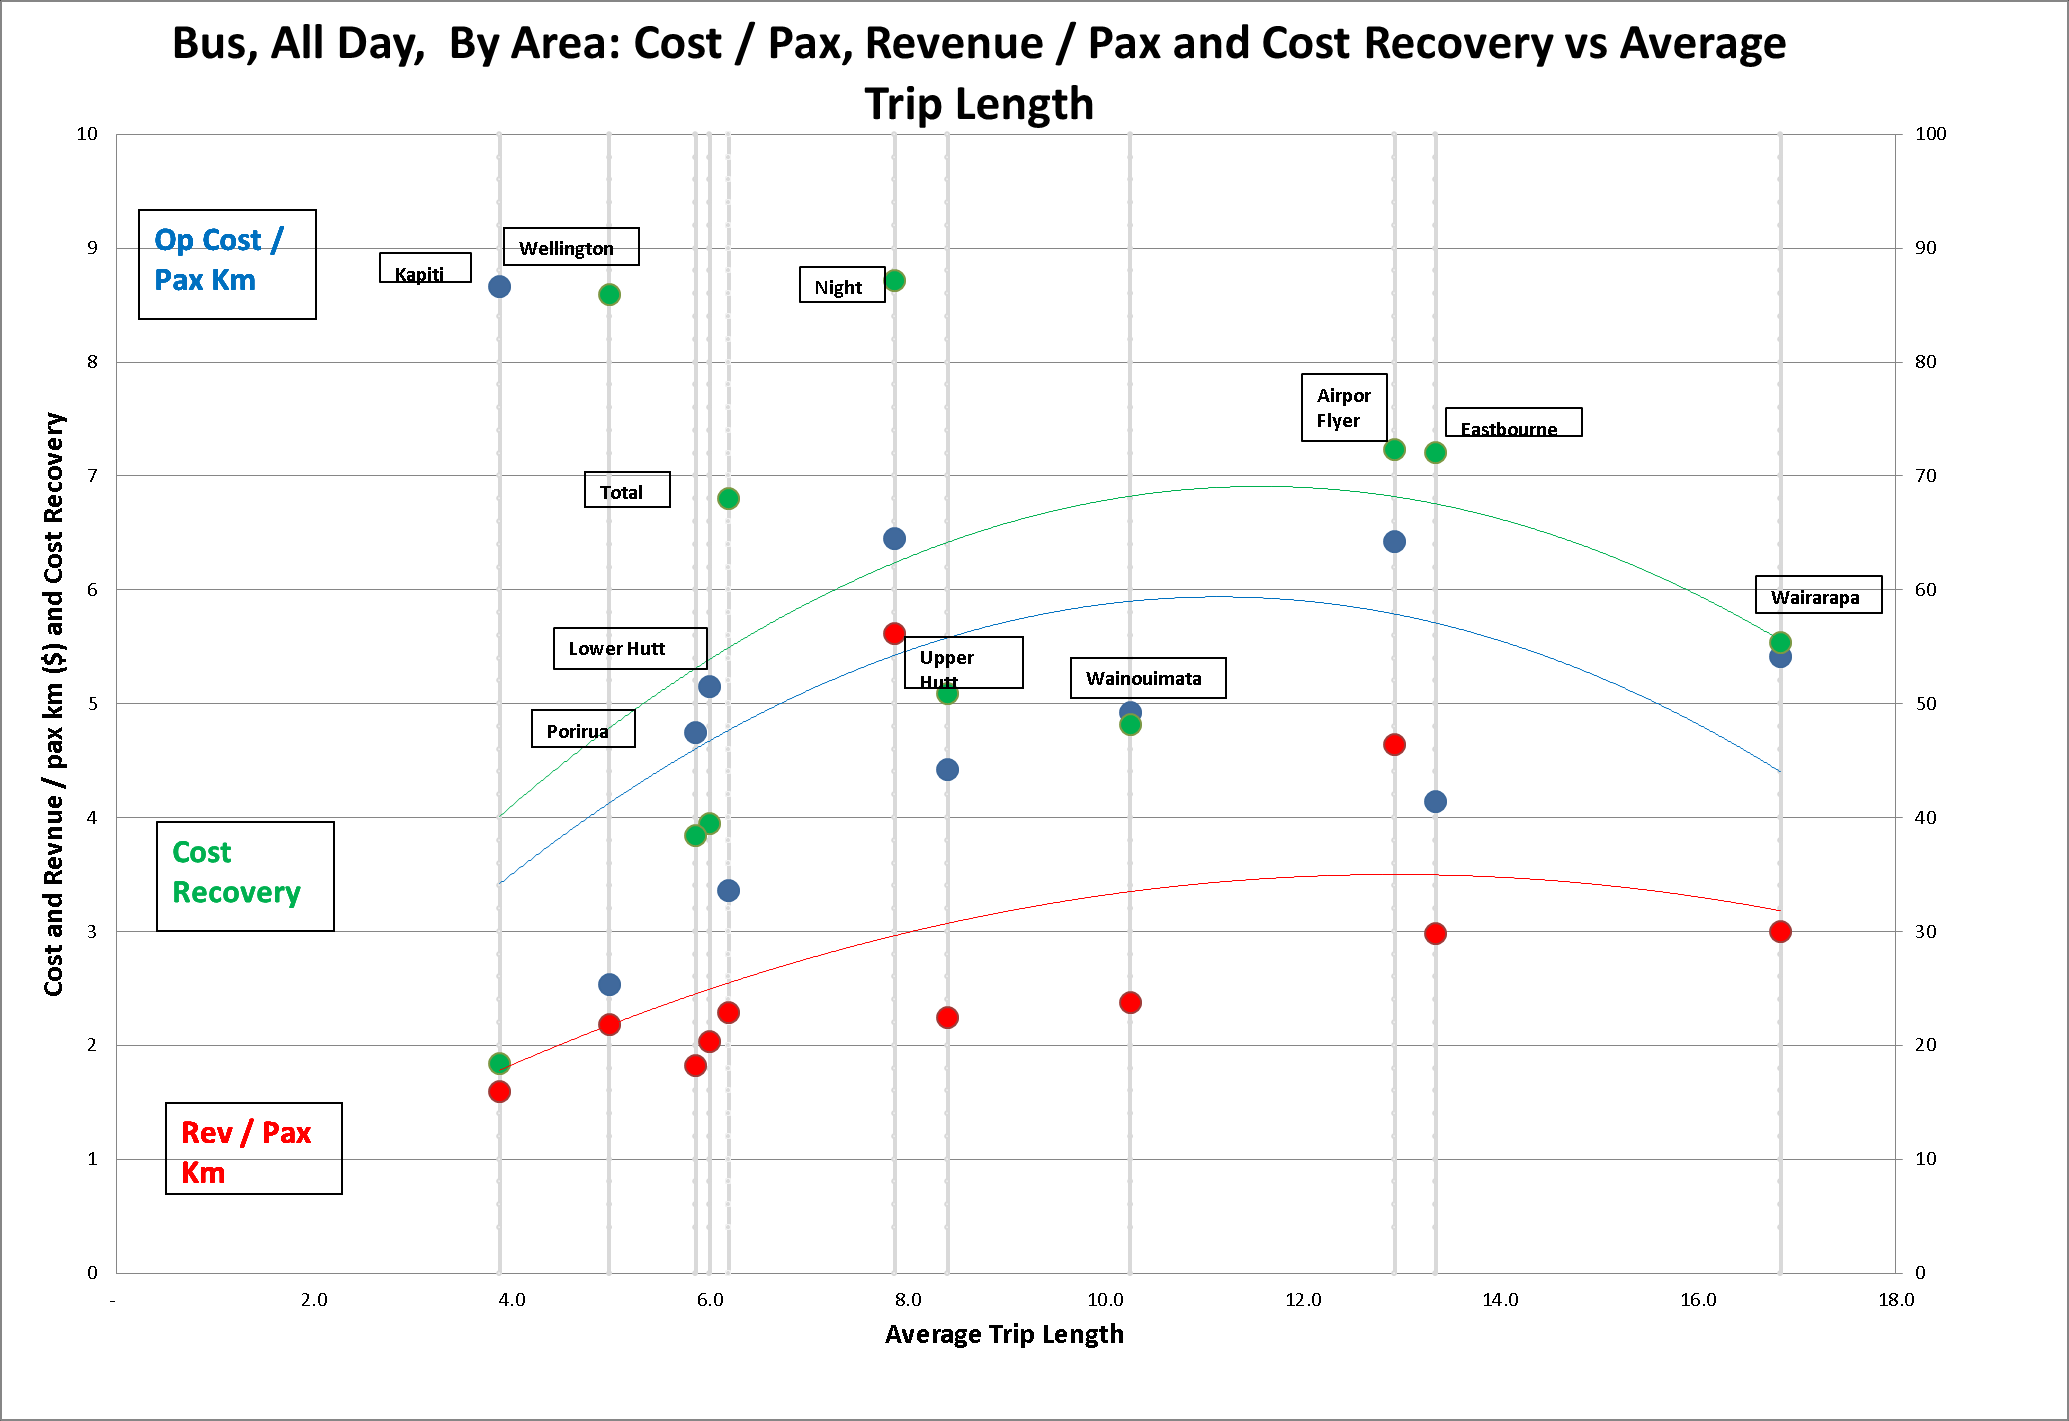
Bus Data – All Day, Pax v Avg TL
confidentiality
Rev / Pax
Night / Flyer = Highest
Released under LGOIMA, data not current
Other areas, rev / pax
proportional to Avg TL
Op Cost / Pax
Kap / Night = High
WLG / LH / Por = Low
Cost Recovery
WLG / Night = Highest
Flyer / EB = premium /
longer distance
Kap / Por = Low

s7(2)(b)(ii) – commercial
position and s7(2)(c)(i) -
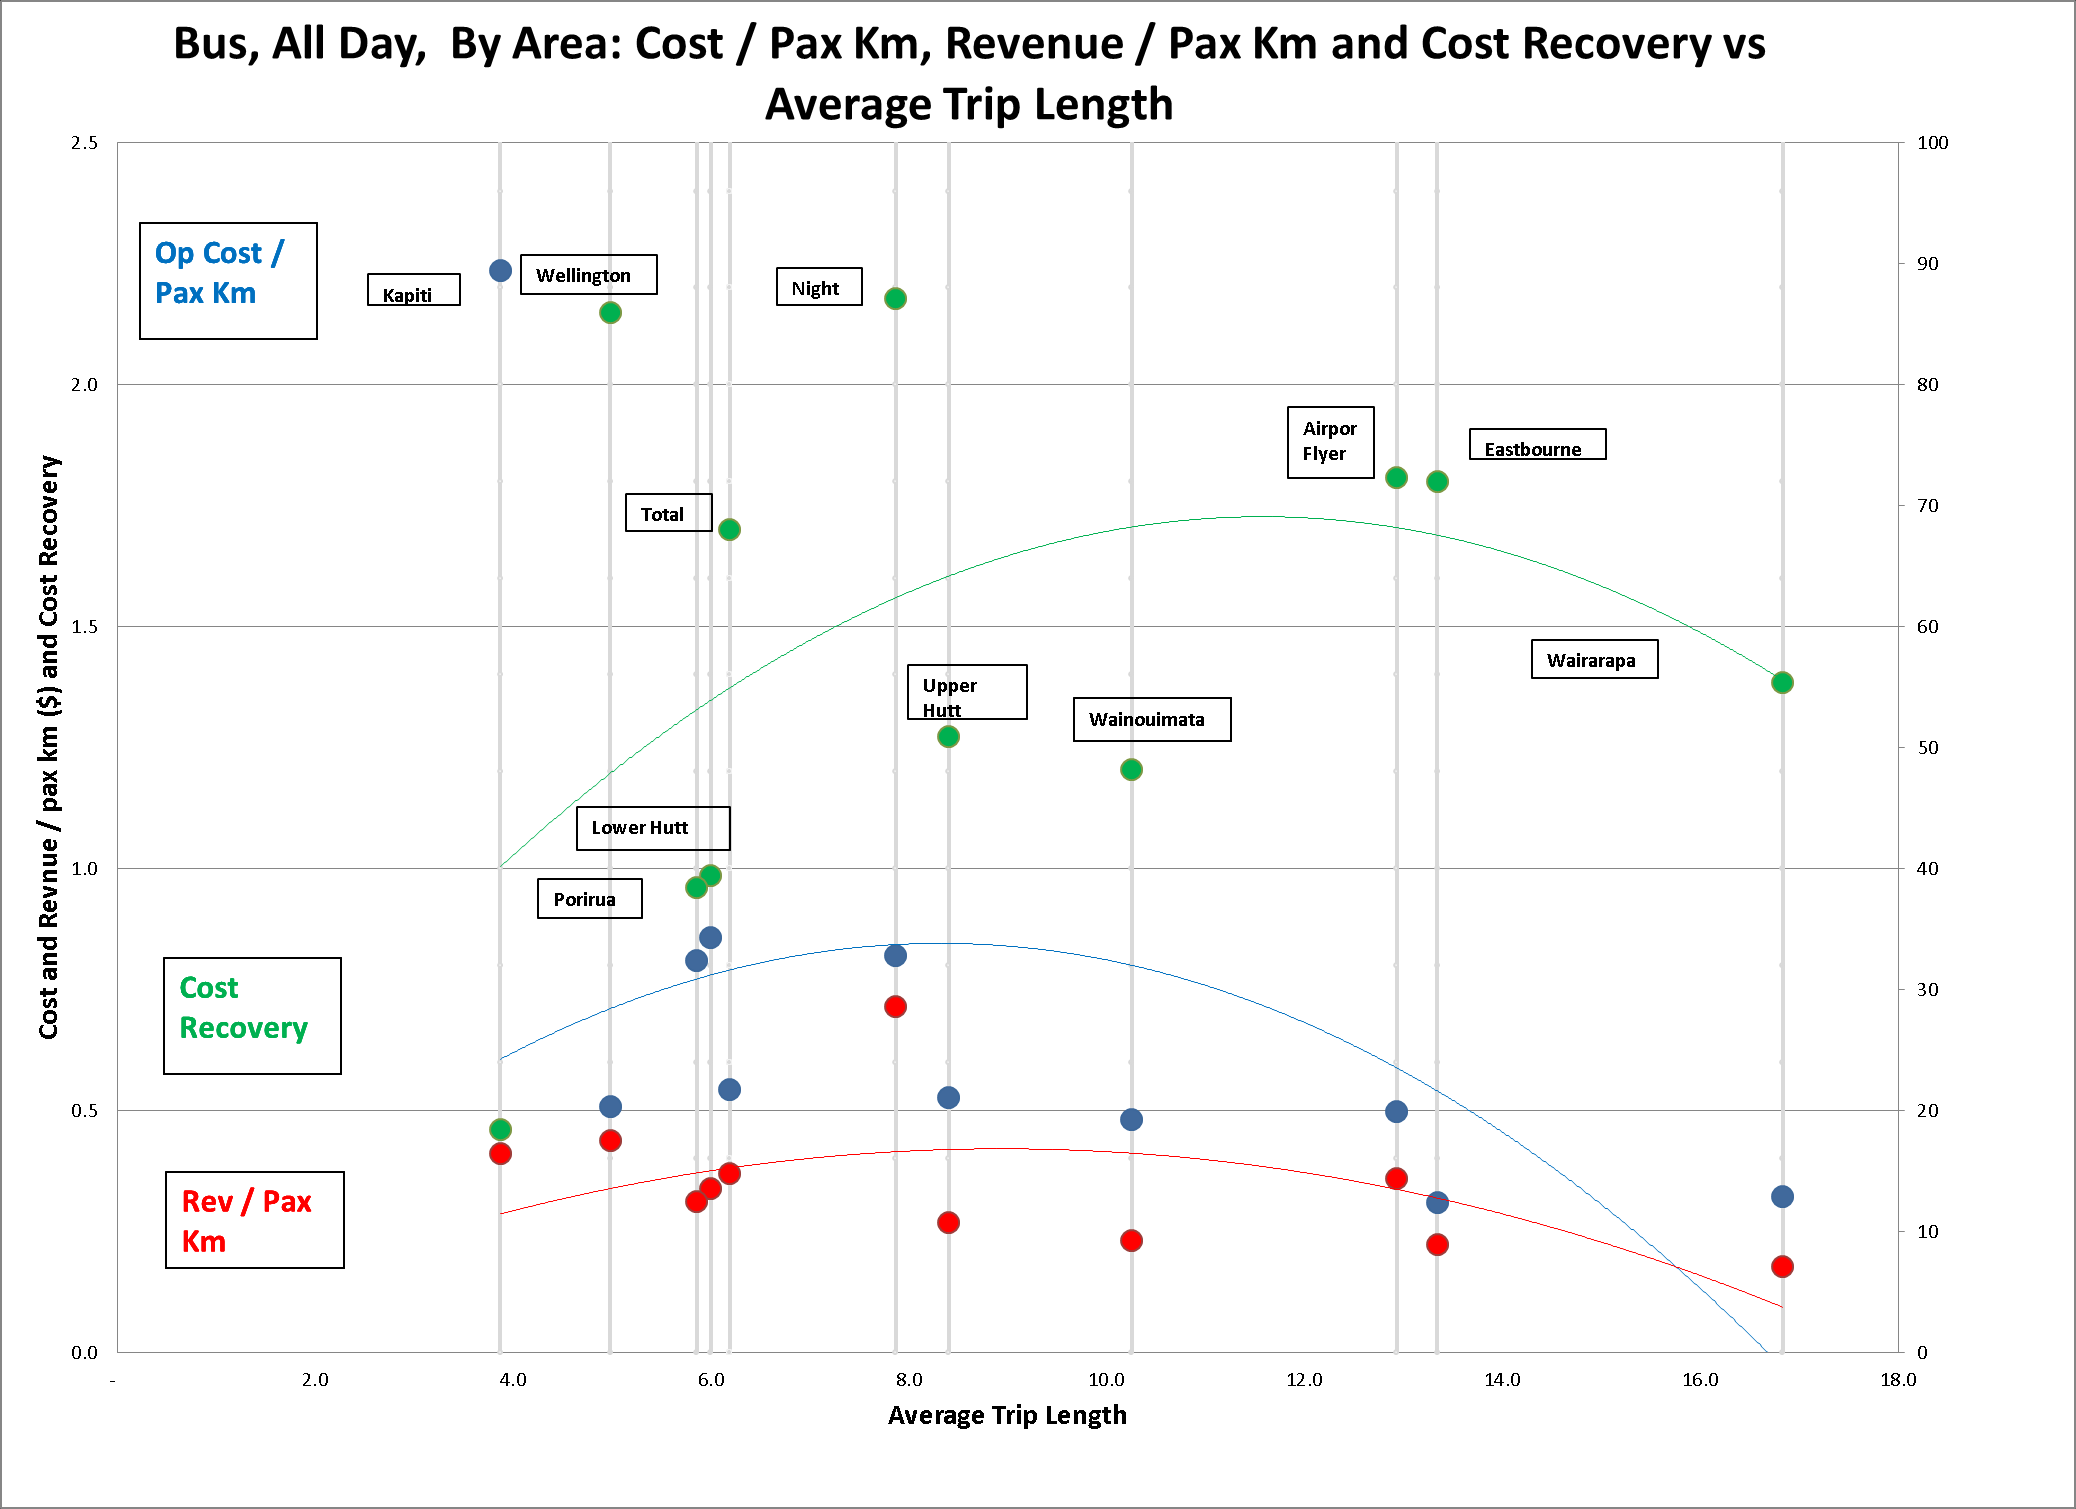
Bus Data – All Day, Pax Km v Avg TLconfidentiality
•
Rev / Pax
Km
Released under LGOIMA, data not current
Decrease as pax km
increases
•
Op Cost /
Pax Km
Decreases as pax km
increases
Rate of decrease
greater than rev / pax
km
•
Cost
Recovery
As per previous slide
WLG & Long Distance
trips = best CR

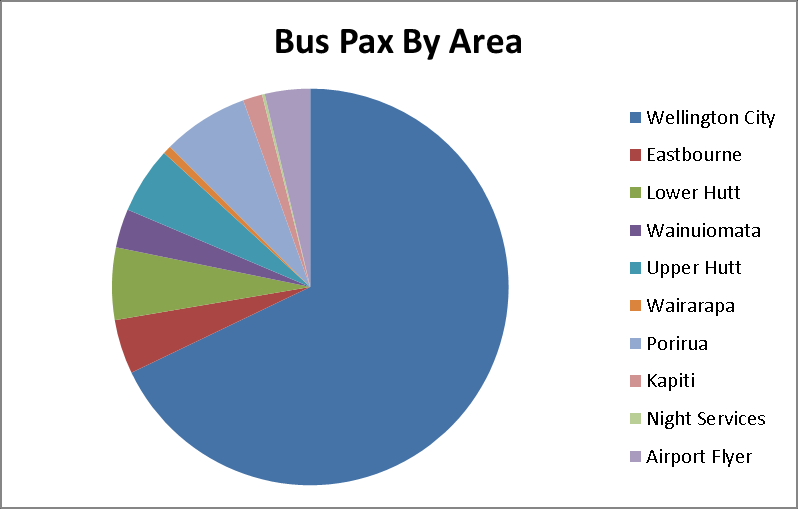
Bus Data – Pax By Area

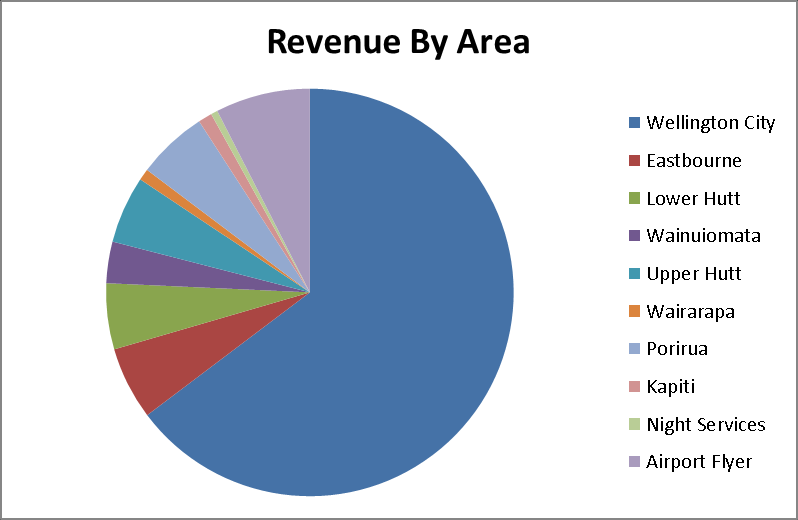
Bus Data – Revenue By Area

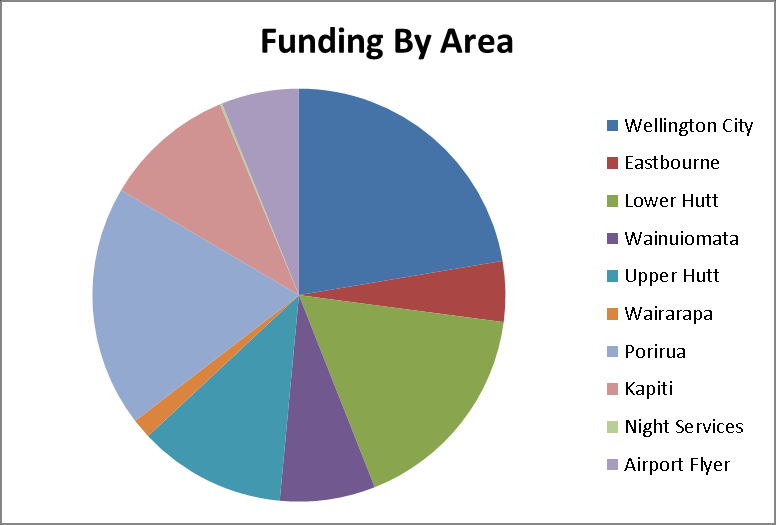
Bus Data – Funding By Area

s7(2)(b)(ii) – commercial
position and s7(2)(c)(i) -
Summary Bus
confidentiality
•
Bus CR = ~68%
–
WLG and longer distance services Highest CR
–
Short distance (Kap, Por, LH) services Lowest CR
•
Longer distance, higher fare services (Eastbourne) = High CR
•
Urban centers – WLG = high CR, Por / Kap = Low CR
•
Night / Airport Flyer = Premium Services, therefore higher costs
•
Wellington
–
70% pax, 65% rev, 25% funding
•
Rest of region
–
30% pax, 35% rev, 75% funding

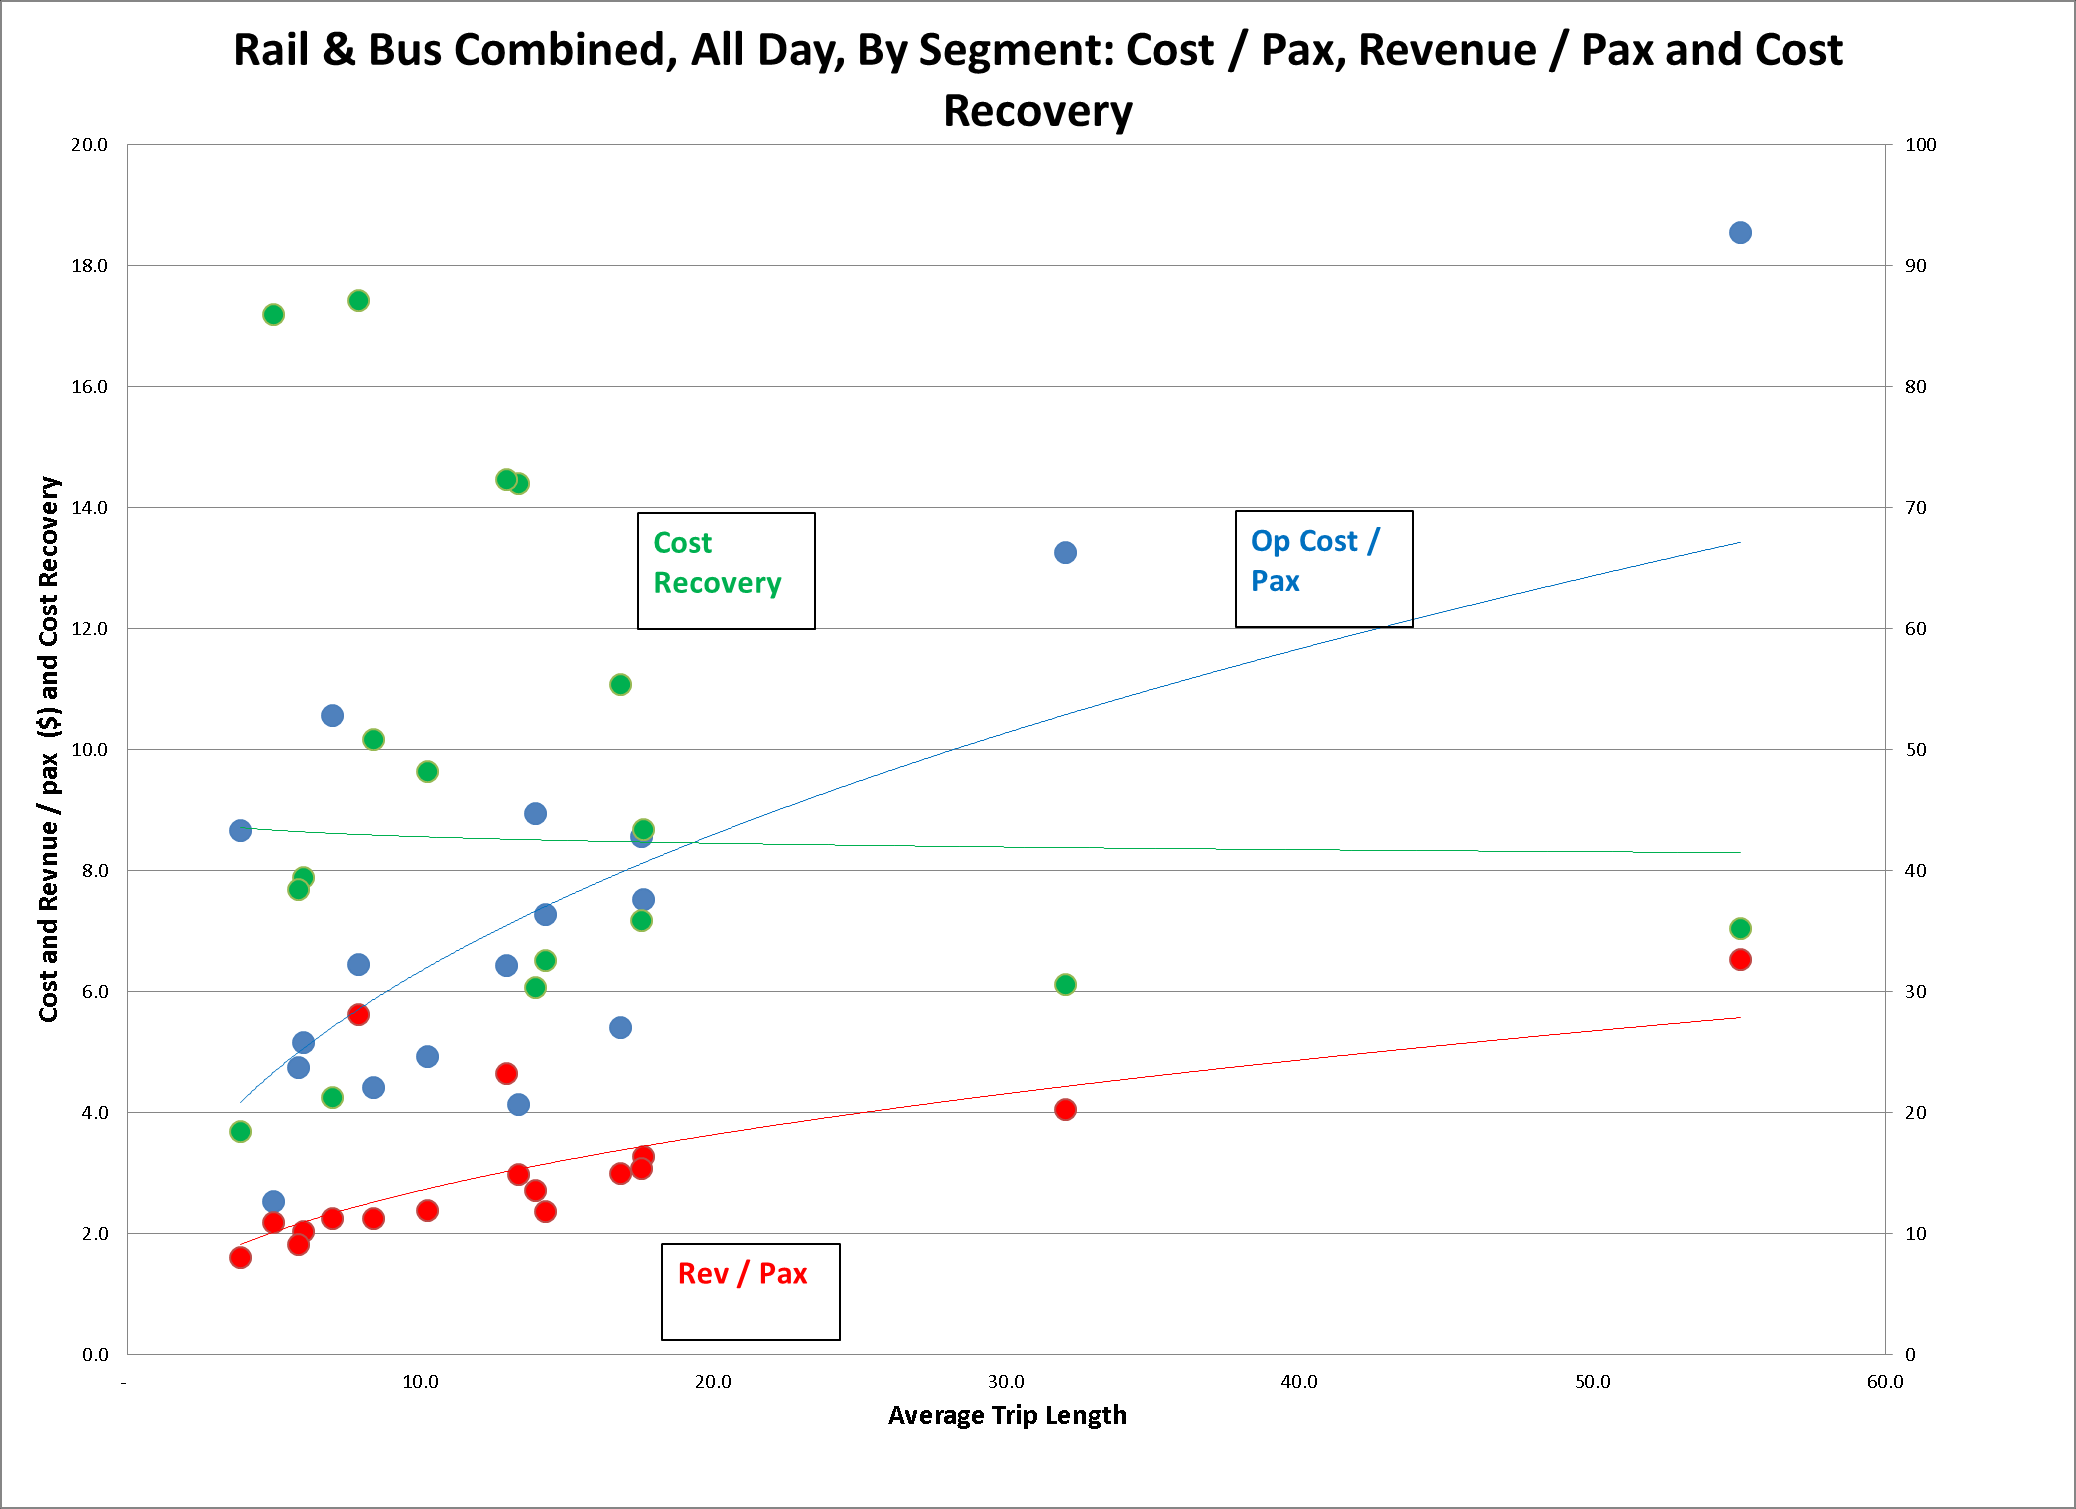
Rail & Bus– All Day, Pax v Avg TL
Rev / Km
Noticeable trend
Released under LGOIMA, data not current
Avg TL inc; Rev / KM inc
Op Cost / Pax Km
Weak trend
Op Cost / Km and Rev /
Km diverge
Avg TL increases, diff
between Op Cost / Km
and Rev / Km increases
Cost Recovery
No real trend
Short TL = Higher CR

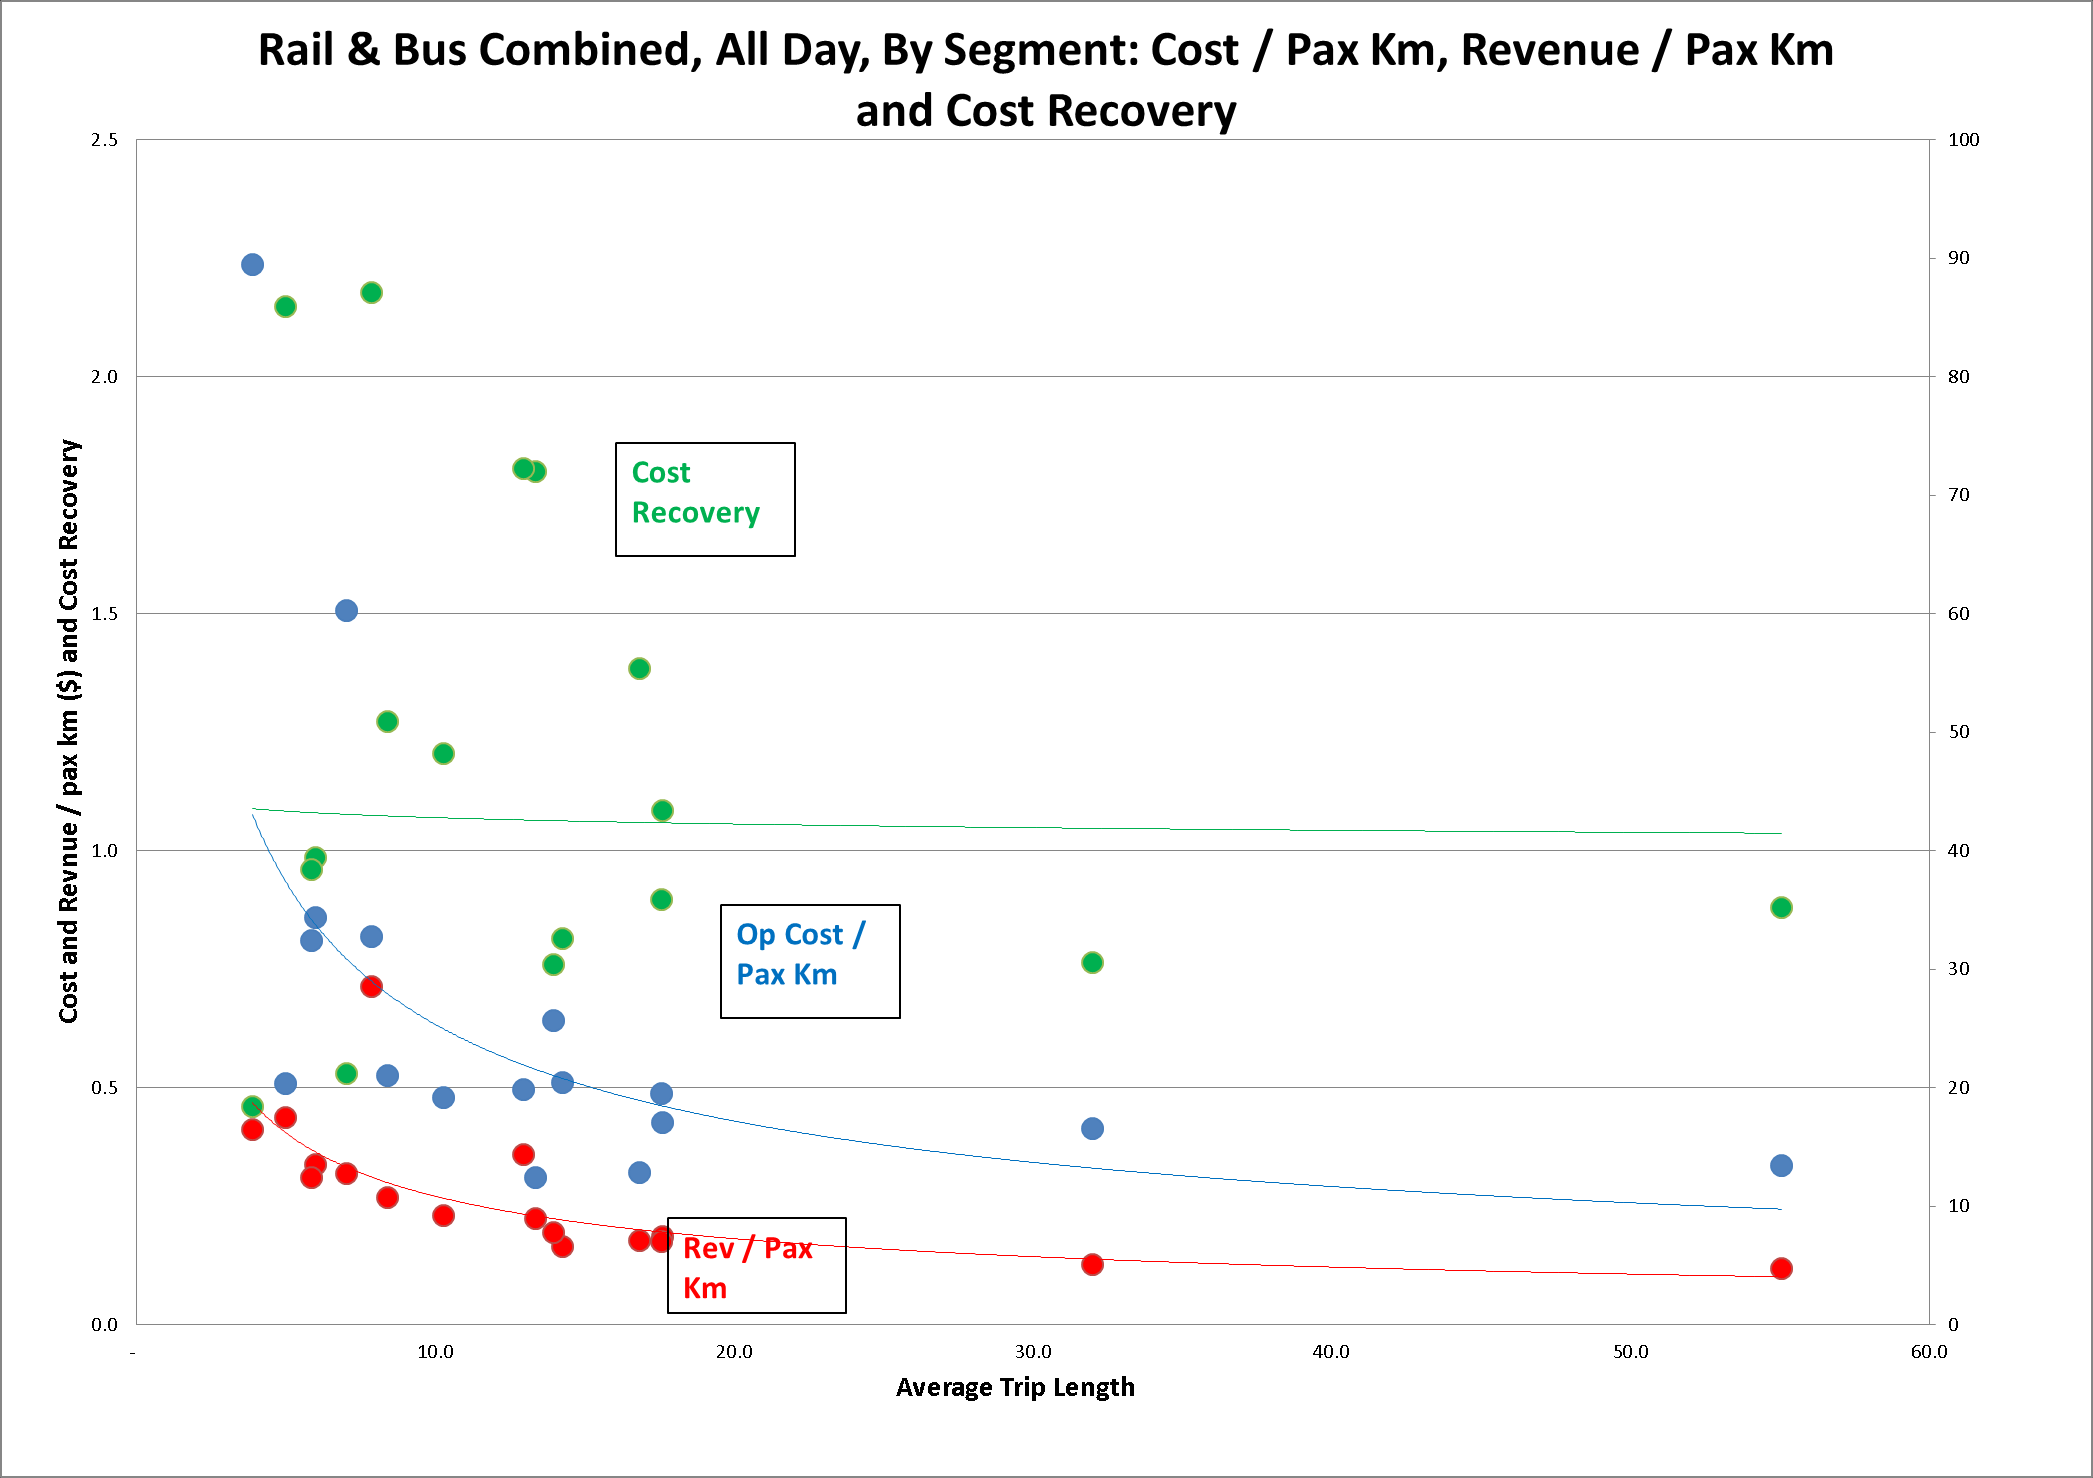
Rail & Bus– All Day, Pax Km v Avg TL
Rev / Pax Km
Noticeable trend
Released under LGOIMA, data not current
Op Cost / Pax Km
Weak trend
Avg TL increases, Rev /
Pax Km and Op Cost / Pax
Km decreases
Cost Recovery
No real trend
Shorter TL = Higher CR

s7(2)(b)(ii) – commercial
position and s7(2)(c)(i) -
Overall Summary
confidentiality
•
Network wide CR = ~60%
•
Rail = lower CR than bus
–
Rail = 35%
–
Bus = 67%
•
JVL line = lowest CR for rail
•
Shorter rail segments (Por, Taita to WLG) = highest CR
•
WLG, Eastbourne and Airport Flyer = highest bus CR
•
Bus – rest of region 35% pax, 70% subsidy

Thank you for listening. Any Questions?