

 Methamphetamine Causes Mitrochondrial
Lymphocytes
Oxidative Damage in Human T
Methamphetamine Causes Mitrochondrial
Lymphocytes
Oxidative Damage in Human T
Leading to Functional Impairment
This information is current as
Raghava Potula, Brian J. Hawkins, Jonathan M. Cenna,
of March 28, 2018.
Shongshan Fan, Holly Dykstra, Servio H. Ramirez, Brenda
Morsey, Michael R. Brodie and Yuri Persidsky
2010; 185:2867-2876; Prepublished online 28
J Immunol
July 2010;
doi: 10.4049/jimmunol.0903691
Downloaded from
http://www.jimmunol.org/content/185/5/2867
Supplementary
http://www.jimmunol.org/content/suppl/2010/07/28/jimmunol.090369
Material
1.DC1
http://www.jimmunol.org/
References
cites 80 articles
This article
, 15 of which you can access for free at:
http://www.jimmunol.org/content/185/5/2867.full#ref-list-1
Submit online.
?
The JI
Why
Rapid Reviews! 30 days*
•
from submission to initial decision
by guest on March 28, 2018
Every submission reviewed by practicing scientists
No Triage!
•
•
4 weeks from acceptance to publication
Fast Publication!
average
*
Subscription
is online at:
The Journal of Immunology
Information about subscribing to
http://jimmunol.org/subscription
Permissions
Submit copyright permission requests at:
http://www.aai.org/About/Publications/JI/copyright.html
Email Alerts
Receive free email-alerts when new articles cite this article. Sign up at:
http://jimmunol.org/alerts
is published twice each month by
The Journal of Immunology
The American Association of Immunologists, Inc.,
1451 Rockville Pike, Suite 650, Rockville, MD 20852
Copyright © 2010 by The American Association of
Immunologists, Inc. All rights reserved.
Print ISSN: 0022-1767 Online ISSN: 1550-6606.
The Journal of Immunology
Methamphetamine Causes Mitrochondrial Oxidative Damage
in Human T Lymphocytes Leading to Functional Impairment
Raghava Potula,* Brian J. Hawkins,† Jonathan M. Cenna,* Shongshan Fan,*
Holly Dykstra,* Servio H. Ramirez,* Brenda Morsey,‡ Michael R. Brodie,‡ and
Yuri Persidsky*
Methamphetamine (METH) abuse is known to be associated with an inordinate rate of infections. Although many studies have
described the association of METH exposure and immunosuppression, so far the underlying mechanism still remains elusive. In
this study, we present evidence that METH exposure resulted in mitochondrial oxidative damage and caused dysfunction of
primary human T cells. METH treatment of T lymphocytes led to a rise in intracellular calcium levels that enhanced the gen-
eration of reactive oxygen species. TCR-CD28 linked calcium mobilization and subsequent uptake by mitochondria in METH-
treated T cells correlated with an increase in mitochondrion-derived superoxide. Exposure to METH-induced mitochondrial
Downloaded from
dysfunction in the form of marked decrease in mitochondrial membrane potential, increased mitochondrial mass, enhanced
protein nitrosylation and diminished protein levels of complexes I, III, and IV of the electron transport chain. These changes
paralleled reduced IL-2 secretion and T cell proliferative responses after TCR-CD28 stimulation indicating impaired T cell
function. Furthermore, antioxidants attenuated METH-induced mitochondrial damage by preserving the protein levels of mi-
tochondrial complexes I, III, and IV. Altogether, our data indicate that METH can cause T cell dysfunction via induction of
oxidative stress and mitochondrial injury as underlying mechanism of immune impairment secondary to METH abuse.
The
http://www.jimmunol.org/
Journal of Immunology, 2010, 185: 2867–2876.
I llicitdrugabusesuchasmethamphetamine(METH)linked bioenergetics (11) andformationof theimmunological synapse
with risky sexual behavior and rapid progression of HIV-1 in-
(12). However, a consequence of mitochondrial calcium uptake is
fection has radically changed the public health landscape at
the production of reactive oxygen species (ROS) (13). Under
multiple levels. Recent studies have enumerated the deleterious
physiological conditions, cellular redox balance is maintained by
effects of METH on various components of the immune system
the equilibrium between formation and elimination of free radicals
by guest on March 28, 2018
either by altering or suppressing the functions of distinct immune
such as ROS and nitrogen species (RNS). Excessive generation of
cell types (1–9). However, little is known about the direct effects
ROS/RNS or inadequate antioxidant defenses can cause damage
of METH on T lymphocytes and how it may lead to compromises
of cellular structures and result in mitochondrial impairment (14).
in regulation of immune homeostasis.
Oxidative stress inhibits complex enzymes in the electron transport
Mitochondria are critical for maintenance of the bioenergetic
chain that can severely disrupt mitochondrial respiration (15). Thus,
status of cells (10). Calcium, a secondary messenger of intracellular
being the predominant site of free radical production, mitochondria
signaling, serves as the key link coupling cellular energy demand
are common targets for the injury caused by oxidative species (10).
and mitochondrial energy production. In lymphocytes, mitochon-
Oxidative stress and mitochondrial damage have been implicated in
drial calcium uptake is associated with an increase in mitochondrial
numerous pathologic conditions, and oxidative stress is an un-
derlying cause of METH-mediated neurotoxicity (16) and dysfunc-
tion of the brain endothelium (17).
*Department of Pathology and Laboratory Medicine and †Department of Biochemistry,
The effects of oxidative stress on suppressed signal transduction,
Temple University School of Medicine, Philadelphia, PA 19140; and ‡Department of
Pharmacology and Experimental Neuroscience, University of Nebraska Medical Center,
transcription factor activities, and decreased cytokine production
Omaha, NE 68164
in response to nonspecific and Ag-specific stimulation in T cells
Received for publication November 16, 2009. Accepted for publication June 24,
has been documented in several model systems (18). The ability
2010.
of ROS to impair T lymphocyte function has been documented in
This work was supported by National Institutes of Health Grants R21 DA0249791
diverse human pathologic conditions, including cancer, rheuma-
(to R.P), DA025566, and R01AA017398 (to Y.P.) as well as developmental grants
toid arthritis, AIDS, and leprosy (19–21). In this study, we eval-
(to Y.P.). B.J.H. was supported by National Institutes of Health Grant K99HL094536.
uated the effects of METH exposure on primary human T cell ROS
Address correspondence and reprint requests to Dr. Raghava Potula, Department of
Pathology and Laboratory Medicine, Temple University School of Medicine, 3500
production and mitochondrial dysfunction. Pathophysiologically
North Broad Street, MERB 1058, Philadelphia, PA 19140. E-mail address:
Raghava.
relevant concentrations of METH increased cytosolic calcium
[email address]
and enhanced ROS generation, which was blocked by a mitochon-
The online version of this article contains supplemental material.
drial antioxidant. On addition of METH, changes in mitochondrial
Abbreviations used in this paper: ALC, acetyl-L-carnitine; a.u., arbitrary unit; DCF,
membrane potential, mitochondrial mass, and loss of complexes I,
dichlorodihydrofluorescein; ECM, extracellular medium; ETC, electron transport chain;
GSH-px, glutathione peroxidase; METH, methamphetamine; mROS, mitochondrion-
II, and III proteins of the electron transport chain (ETC) was ob-
derived reactive oxygen species; RNS, reactive nitrogen species; ROS, reactive oxygen
served in T cells. Furthermore, treatment of T cells with METH
species.
resulted in protein nitrosylation and impaired T cell function, in-
Copyright Ó 2010 by The American Association of Immunologists, Inc. 0022-1767/10/$16.00
cluding a decrease in cytokine secretion and proliferative responses.
www.jimmunol.org/cgi/doi/10.4049/jimmunol.0903691
2868
METHAMPHETAMINE CAUSES T LYMPHOCYTE DYSFUNCTION
Materials and Methods
MitoSOX Red (Invitrogen; 10 mM) in ECM containing 2% BSA at 37˚C for
Cells and treatment
20 min. Cells were then incubated with Fluo-4/AM for an additional 20 min
at room temperature. At the end of incubation, cells were washed, resus-
PBLs were obtained by countercurrent centrifugal elutriation of leuko-
pended in ECM containing 0.25% BSA, and imaged every 5 s at 488 nm and
pheresis packs from HIV-1, 2, and hepatitis B seronegative donors as de-
568 nm for Fluo-4 and MitoSOX Red, respectively. Anti-CD3/CD28 was
scribed previously (22). T cells (.95% anti-CD3+ cells) were isolated
added after 1 min of baseline recording. Tracings are obtained similarly to
from PBL or PBMCs by using a pan-T cell isolation kit according to the
those for Fluo-4 and Rhod-2 (30).
manufacturer’s protocol (Miltenyi Biotec, Auburn, CA) and separated us-
Mitochondrial imaging
ing an auto-MACS separator. For some experiments, pan-T cells were
directly obtained from the Human Immunology Core facility of the Uni-
The changes in mitochondrial membrane potential (Dcm) were visualized
versity of Pennsylvania. Cell concentration was adjusted to 1 3 106/ml
by staining the cells with MitoTracker Red CMXRos (MTR) (Invitrogen).
in X-VIVO 20 medium (BioWhitaker, Walkersville, MD) supplemented
Cells (1 3 106) were incubated with 1 mM MTR to a final concentration of
with 1% heat inactivated normal human serum, 20 mg/ml gentamycin,
50 nM in the dark for 30 min at 37˚C. The suspension cells were then
2 mM glutamine, and IL-2 (50 U/ml). T cells were exposed to various
briefly rinsed with the medium and incubated with all the reagents (METH
concentrations of L-methamphetamine hydrochloride (METH, 50 or 100
and valinomycin). The cells were immobilized to Cell-Tak–coated cover
mM, Sigma-Aldrich, St. Louis, MO) depending on the experiment for
slips before analysis by fluorescence microscopy.
different time intervals. Cell viability determined by LIVE/DEAD Fixable
Live cell images were obtained under the same acquisition parameters
Violet Dead Cell Stain Kit (Molecular Probes, Eugene, OR) showed that
under a 320 objective for both MitoTracker Red and Hoechst 33342 using
METH (1–100 mM) had no toxic effects on T cells after 72 h of exposure
a live cell imaging system from Carl Zeiss Microimaging. The live cell
(Supplemental Fig. 1). Concentrations of METH used in various experi-
imaging system consists of a fully motorized Axio Observer Z1 fluorescent
ments are based on our pilot experiments that demonstrated the best bi-
microscope fitted with an AxioCamHR camera and incubator chamber
ological responses and are similar to those of other published studies (6,
with CO2 and temperature regulation. After the experimental treatment
17, 23–25) and importantly within the range (#2–600 mM) found in blood,
was initiated, time-lapse image sequences from three different regions in
Downloaded from
urine, or tissue samples of METH abusers (26–29).
the well were taken at 30 min intervals for 24 h. The average change in
Reagents and Abs
intensity over time from the combined images (100–300 cells) was calcu-
lated and normalized by setting the initial intensities at t = 0–100%. The
All chemicals (unless otherwise specified) were purchased from Sigma-
results are shown as the average percent intensity 6 SEM. The images
Aldrich (St. Lous, MO). The optimal concentration of antioxidants, acetyl-
were analyzed with AxioVision version 4.7 software (Carl Zeiss Micro-
L-carnitine (ALC, 1 mM) and Resveratrol (RES, 8 mM), were determined
imaging) and with National Institutes of Health ImageJ version 1.42 soft-
by preliminary dose-response experiments. These concentrations did not
ware
(http://rsbweb.nih.gov/ij/).
affect cell viability. Antioxidant treatments were initiated 30 min prior to
http://www.jimmunol.org/
Flow cytometery
METH application. mAbs against mitochondrial protein complexes (com-
plex I [NADH dehydrogenase] subunit NDUFB8, complex II 30 kDa Ip
Membrane potential (Dc) was measured by using APO LOGIX JC-1
subunit, 47 kDa complex III core protein 2, complex IV 26 kDa COX
Assay Kit (Invitrogen). In brief, cells were adjusted to density of 13 106
subunit II, 55 kDa F1F0 ATP synthase [complex V] a subunit, and cyto-
cells/ml and suspended in 0.5 ml of diluted JC-1 reagent according to the
chrome c) were obtained from MitoSciences (Eugene, OR). Antinitrotyro-
manufacturer’s instructions. The cells were incubated for 10 min at 37˚C in
sine mAb, clone 1A6, was purchased form Millipore (Billerica, MA).
a 5% CO2 incubator for 15 min in the dark before immediately analyzing
Calcium measurement
them by flow cytometry. Mitochondrial mass (MM) was assessed by using
the fluorescent dye, MitoTracker Green FM (MTG; Molecular Probes).
T lymphocytes were affixed to MatTek (Ashland, MA) cell culture dishes
Cells were incubated in 0.5 ml PBS containing 100 nM MTG. After in-
coated with Cell-Tak (BD Biosciences, San Jose, CA). T cells were loaded
cubation for 10 min at 25˚C in the dark, samples were immediately trans-
by guest on March 28, 2018
with 10 mM Fluo-4/AM (Invitrogen, Carlsbad, CA) in extracellular me-
ferred to a tube on ice for flow cytometric analysis by LSR II (Becton
dium (ECM) containing 2.0% BSA for 30 min at room temperature. After
Dickinson, San Jose, CA). Analysis was carried out using FACS DiVa
1 min of baseline recording, images were acquired every 5 s using the Carl
software (Becton Dickinson).
Zeiss 510 Meta confocal microscopy system at 488 excitation. EGTA
(0.5 mM) was used to remove extracellular calcium for indicated experi-
T cell proliferation and ELISA
ments. The pseudocolorings of the images were done according to the
Naive T cells with or without METH exposure were stimulated with anti-
look-up table scale. For simultaneous measurements of cytosolic calcium
CD3/CD28. T cells were labeled with 0.5 mM CFSE (BD Pharmingen, San
mobilization and mitochondrial calcium uptake (30), T cells were first
Diego, CA) for 6 min. CFSE intensity was measured by flow cytometry
loaded with 2 mM Rhod-2/AM (Invitrogen) in ECM at 37˚C for 30 min.
and the proliferative index was calculated with ModFit LT version 2.0
Rhod-2 loaded cells were washed and loaded with the cytosolic calcium
(Verity Software House, Topsham, ME). The proliferation index is a ratio
indicator Fluo-4/AM (10 mM) for an additional 30 min at room tempera-
of the sum of the cells in all generations to the computed number of
ture. T cells were costimulated with anti-CD3 (10 mg)/CD28 (4 mg) and
parent cells. Values represent the mean of triplicate determinations in three
images were acquired after 1 min of baseline recording. The detailed
independent experiments performed with two different cell donors. The
confocal methodology has been published previously (31).
IL-2 levels were measured in supernatants after 24 h by ELISA (R&D,
Detection of intracellular ROS
Minneapolis, MN) according to the manufacturer’s instructions.
Intracellular ROS were measured by confocal microscopy using the fluores-
Mitochondrial preparations and Western blot analysis
cent probe 29, 79-dichlorodihydrofluorescein diacetate (H2DCFDA, Molecular
Probes), which is oxidized to highly fluorescent dichlorodihydrofluorescein
Intact mitochondria from T cells were isolated using a Mitochondria Iso-
(DCF) by ROS. Briefly, T lymphocytes (2 3 106/ml) were incubated with
lation Kit (MitoScience) according to the manufacturer’s instructions. Cells
DCF-DA (2 mM) in serum-free X-VIVO 20 medium for 3 h at 37˚C in the
were lysed with CellLytic-M (Sigma-Aldrich) for preparation of whole cell
dark. At the end of incubation, cells were washed and resuspended in 13
lysate. Protein concentration was measured by BCA assay (Pierce, Rock-
HBSS at 37˚C. ROS generation was monitored after the addition of METH
ford, IL). SDS-PAGE and Western blot analysis was performed as pre-
(100 mM) and detected using the Carl Zeiss 510 Meta confocal microscopy
viously described (22).
system (Carl Zeiss MicroImaging, Thornwood, NY) at an excitation wave-
Statistical analysis
length of 488 nm. Images were collected in five microscopic fields and fluo-
rescence quantified for three independent experiments using National
Results are presented as mean 6 SD and p values , 0.05 are considered
Institutes of Health ImageJ version 1.42 software
(http://rsbweb.nih.gov/ij/).
significant. Data were analyzed using Prism (GraphPad, La Jolla, CA) and
T lymphocytes incubated with 1 mM H
statistical significance for multiple comparisons was assessed by one-way
2O2 for 1 h during DCF staining were
used as positive control. BAPTA-AM (25 mM) and MnTBAP (50 mM) were
ANOVA with the Newman-Keuls post test.
loaded 30 min prior to METH challenge.
Concurrent measurement of cytosolic calcium and
Results
mitochondrial-derived ROS production
METH exposure increases cytosolic calcium levels in T cells
To visualize mitochondrial-derived ROS (mROS) production, peripheral
Acute METH administration activates dopamine, norepinephrine,
T cells were loaded with the mitochondrial superoxide sensitive fluorophore,
and serotonin receptors and inhibits neurotransmitter reuptake,
The Journal of Immunology
2869
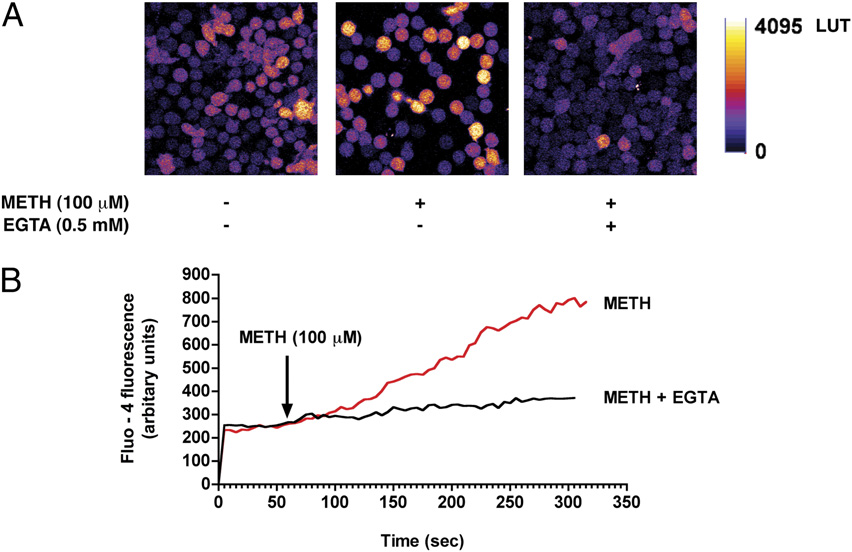
FIGURE 1.
METH exposure increases cytosolic
calcium levels in T cells. A, T cells loaded with the
calcium indicator Fluo-4/AM were stimulated with
METH (100 mM) and fluorescence changes were im-
aged via confocal microscopy. Representative pseu-
docolored images of control and METH-challenged
T cells in the presence and absence of the extracel-
lular calcium chelator EGTA (0.5 mM). Original
magnification 3600. B, Cytosolic calcium levels as
detected by Fluo-4 fluorescence following acute ex-
posure to METH (100 mM). pp , 0.05 compared
with control.
Downloaded from
thereby triggering neurotoxicity and cell death (32). METH ap-
activation of calcium channels or an increase in membrane perme-
pears to increase intracellular calcium levels (33, 34) and stimu-
ability of mitochondria.
late ROS generation in both endothelial cells (17) and neurons
METH-induced calcium increase triggers cellular ROS
(35). To date, such effects of METH have not been investigated
in T cells. To evaluate whether METH induces a rise in calcium
production
levels in naive T cells, METH at 100 mM was added to T cells and
A common target of cytosolic calcium is the mitochondria, re-
http://www.jimmunol.org/
intracellular calcium levels was monitored continuously. We found
sulting in increased cellular bioenergetics and energy production,
that METH (100 mM) caused a gradual rise in cytosolic calcium in
a by-product of which is the generation of ROS by the mitochon-
T lymphocytes as detected by the calcium indicator dye, Fluo-4
drial respiratory chain (13). T cells exposed to METH (100 mM)
(Fig. 1A, 1B). Because calcium rise occurred gradually, we hypoth-
elicited a gradual increase in cellular ROS production as detected
esized that this elevation in cytosolic calcium originated from the
by the H2O2 indicator dye H2DCF-DA (Fig. 2A). To assess the
extracellular milieu. Notably, removal of extracellular calcium us-
contribution of calcium to cellular ROS production, T cells were
ing the cell-impermeable chelating agent EGTA (0.5 mM) dramat-
preincubated with the calcium chelator BAPTA-AM (25 mM). Re-
ically reduced METH-induced cytosolic calcium levels in T cells
moval of intracellular calcium attenuated METH-induced ROS
by guest on March 28, 2018
(Fig. 1A, 1B), implicating the increase in calcium was either due to
generation (Fig. 2B, 2C). Similarly, ROS production after METH
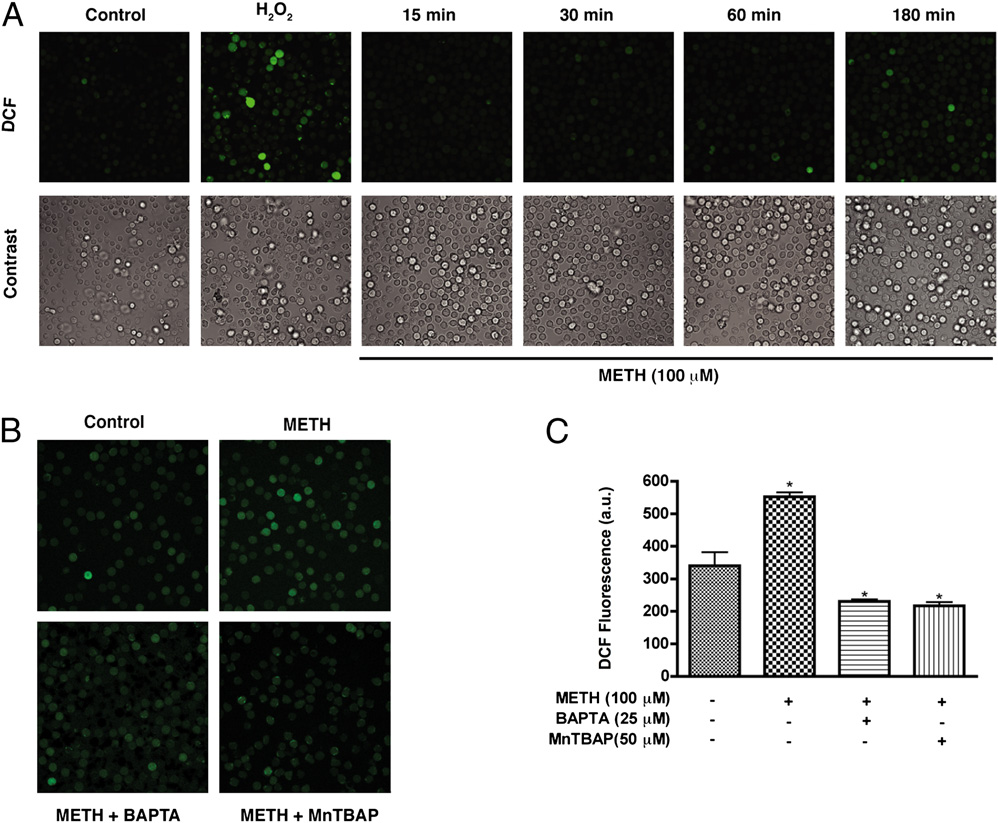
FIGURE 2.
METH-induced cal-
cium increase triggers cellular ROS
production. A, T cells loaded with the
H2O2 indicator dye H2DCF-DA were
exposed to METH (100 mM) for vary-
ing time points. H2O2 (1 mM) was in-
cubated with T cells for 20 min as
a positive control. B, H2DCF-DA–
loaded T cells were incubated with
the intracellular calcium chelator
BAPTA-AM (25 mM) or the ROS
scavenger MnTBAP (50 mM) for 1 h
prior to METH exposure. Original
magnification 3200. C, Quantifica-
tion of DCF fluorescence (a.u.) of five
microscopic fields from three inde-
pendent experiments. a.u., arbitrary
unit.
2870
METHAMPHETAMINE CAUSES T LYMPHOCYTE DYSFUNCTION
exposure was decreased by incubation of T cells with the mito-
to METH (100 mM) were loaded with Fluo-4 and Rhod-2 for
chondrial antioxidant MnTBAP (50 mM) (Fig. 2B, 2C). Taken
simultaneous measurement of cytoplasmic and mitochondrial cal-
together, these data indicate that mitochondria are a major source
cium levels, respectively. Surprisingly, CD3/CD28 costimulation-
of ROS after exposure.
induced cytosolic calcium levels in control and METH-treated
T cells were not significantly different (Fig. 3A). In contrast, com-
Impaired calcium mobilization in T cells exposed to METH
pared with the control cells, METH-exposed cells showed a sus-
triggers mROS
tained elevation of mitochondrial calcium in response to anti-CD3/
Stimulation of T cells through TCRs initiates a coordinated cascade
CD28 stimulation (Fig. 3B). These data suggest that the discor-
of signaling events, which ultimately initiate a synchronized pro-
dance between the levels of cytosolic and mitochondrial calcium
gram of activation, proliferation, and differentiation. Because one
in T cells exposed to METH is attributable to mitochondrial cal-
of the key signaling events triggered by TCR engagement is the
cium handling capacity. Furthermore, because the foremost feature
elevation of cytoplasmic calcium concentration, we considered in-
of mitochondrial functional alterations is the production of ROS
vestigating whether METH exposure affects TCR-CD28 dependent
(36, 37), we considered whether receptor-mediated calcium signals
calcium mobilization. To this end, human peripheral T cells exposed
that are transmitted to the mitochondria might in turn lead to mROS
Downloaded from
http://www.jimmunol.org/
by guest on March 28, 2018
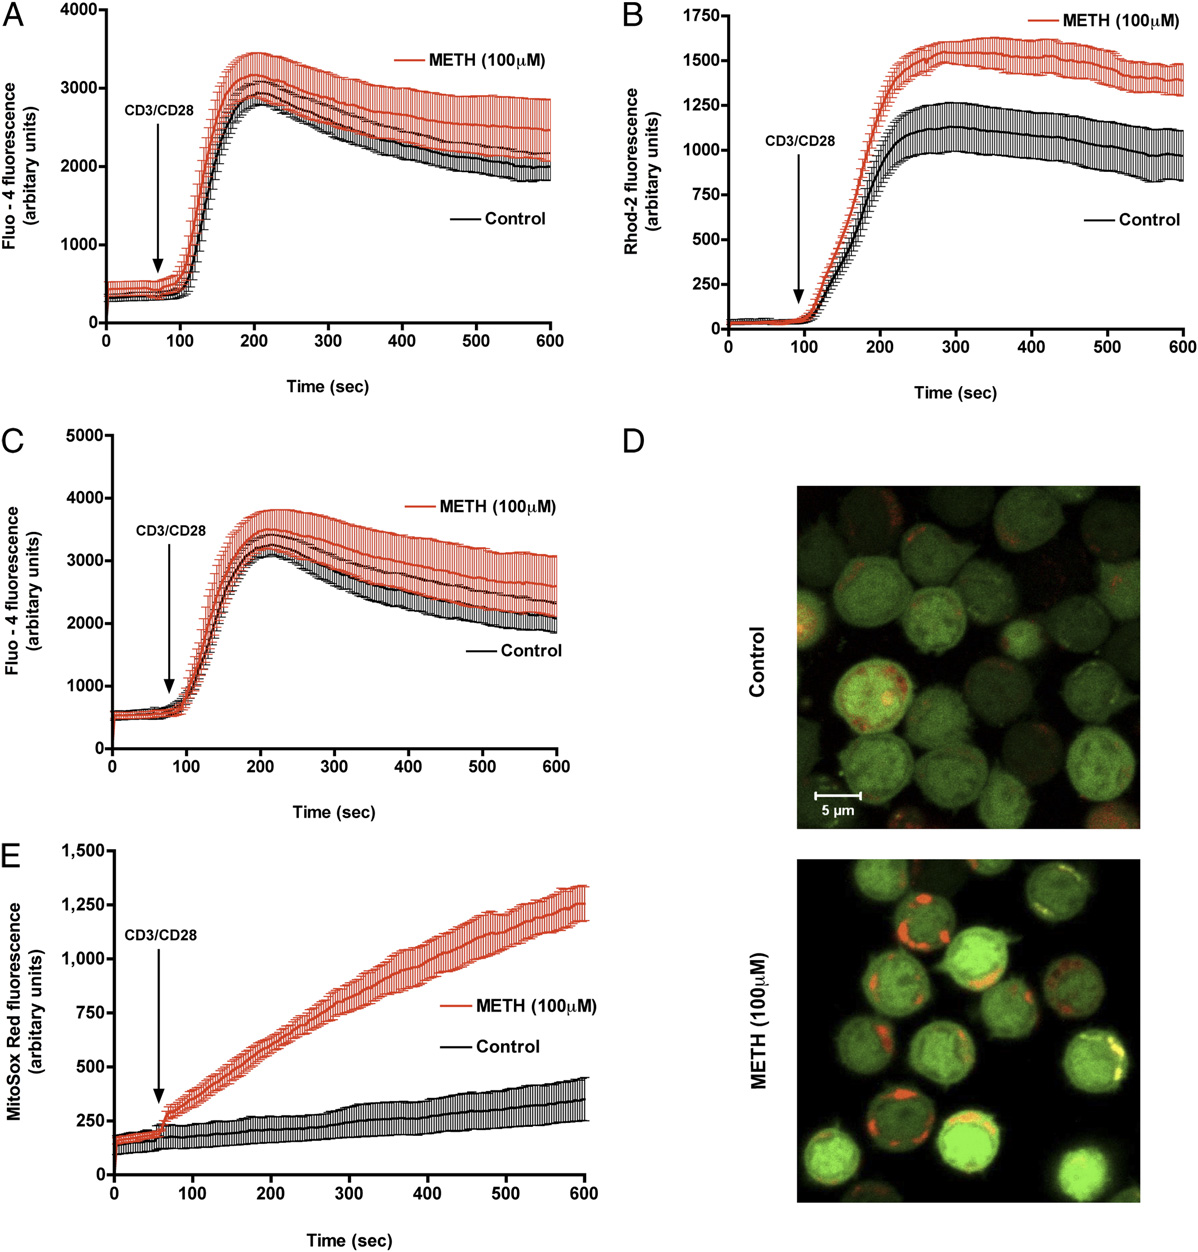
FIGURE 3.
METH exposure augments CD3/CD28-evoked mitochondrial calcium uptake and mROS production. Representative traces of control (black)
and METH-treated T cells (red) displaying (A) cytosolic calcium and (B) mitochondrial calcium levels after CD3/CD28 costimulation. C, Control and
METH-exposed T cells loaded with the cytosolic calcium indicator Fluo-4/AM (green) and the mitochondrial calcium indicator Rhod-2 (red) were
stimulated with anti-CD3/CD28. Time-lapse confocal microscopy revealed sustained mitochondrial calcium levels in cells pretreated with METH. D,
Representative pseudocolored images of T cells either left untreated (top) or exposed for 3 h to METH (bottom) were loaded with the mitochondrion-
derived superoxide indicator, MitoSOX Red, and imaged by confocal microscopy. Original magnification 3600. E, Quantitation of mROS production in
live T cells. METH-treated cells, but not control cells, displayed sustained mROS production.
The Journal of Immunology
2871
generation. Control and METH-treated T cells were loaded with
Effects of METH on T cell mitochondria
the cytoplasmic calcium indicator dye, Fluo-4 and the mROS in-
The Dcm represents a primary indicator of membrane stability in
dicator MitoSOX Red (31, 38) to simultaneously assess the cyto-
mitochondria (39). Elevated mROS and altered mitochondrial cal-
solic calcium and mROS generation in response to CD3/CD28
cium handling have been shown to directly facilitate mitochondrial
costimulation. MitoSOX Red is nonfluorescent until oxidized by
dysfunction (40). Because mROS is an important regulator of Dcm
superoxide, and an increase in the fluorescence of MitoSOX Red
and maintenance of the Dcm is important for oxidative phosphor-
indicates oxidation by mitochondrial superoxide. For instance, in-
ylation activity, a decrease would result in mitochondrial dysfunc-
hibition of normal cytochrome electron transport by antimycin A
tion, we therefore sought to assess whether membrane potential is
(Supplemental Fig. 2) exacerbated mROS production in T cells. A
an early indicator of METH effects on T cells. Cells were loaded
synergistic increase in mROS was noted in METH-treated T cells
with MTR, which labels mitochondria in live cells, and its decrease
response to CD3/CD28 costimulation (Fig. 3D, 3E) compared with
in intensity is indicative of a lowering in membrane potential. As
control, whereas simultaneous cytoplasmic calcium levels mea-
shown in Fig. 4A and 4B, the mitochondrial membrane potential
sured by Fluo-4 remained unaffected (Fig. 3C). These observations
dropped 40% after 6 h exposure in a time-dependent manner (p ,
indicate that the inability of the METH-exposed T cell to maintain
0.05). In addition, quantitative estimation of Dcm was also per-
mitochondrial calcium homeostasis on CD3/CD28 costimulation
formed using a different dye, JC-1. Loss in Dcm was detected as
contributes to mROS production. Taken together, the data suggest
a shift in fluorescence from red to green in cells (Fig. 4C) and was
that METH exposure triggers mROS production that is facilitated
documented as early as 30 min after METH treatment, indicating
by mitochondrial calcium uptake.
diminished JC-1 accumulation in the mitochondrial matrix. More-
Downloaded from
http://www.jimmunol.org/
by guest on March 28, 2018
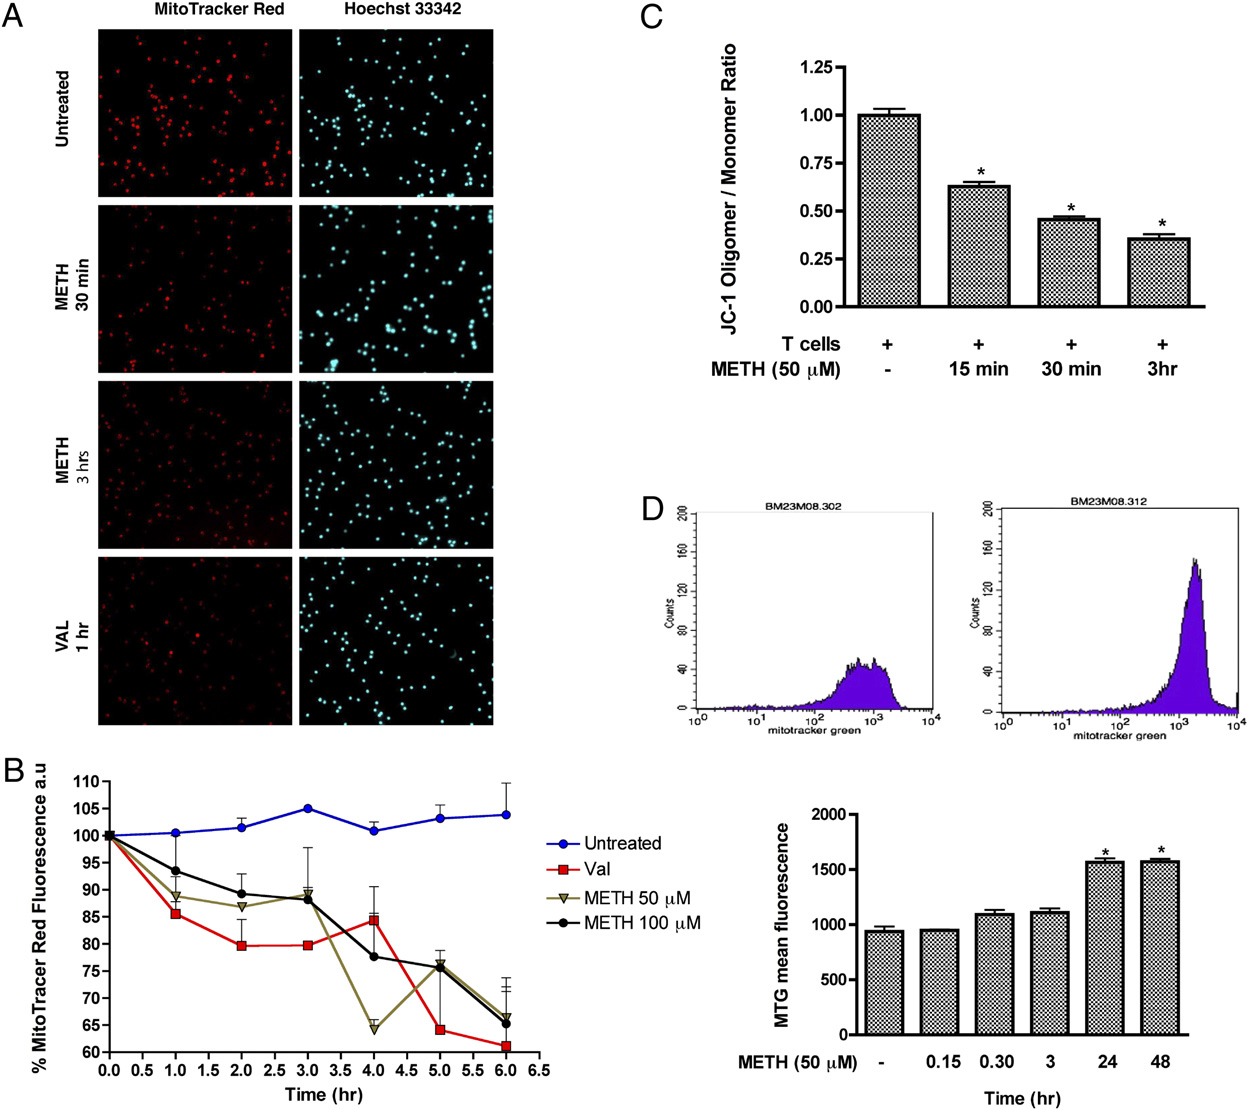
FIGURE 4.
METH induces loss of mitochondrial membrane potential in T cells. A, Visualization of mitochondrial membrane potential by MTR.
Representative photomicrographs of MTR (red), and Hoechst nuclear staining (blue). Original magnification 3200. B, Quantitative analysis of MTR. C,
Graphical representation of red fluorescence (Oligomer; FL2) versus green fluorescence (Monomer; FL1) ratio representing the mitochondrial
membrane potential using JC-1. D, Data represent the mean values 6 SD from experiments performed in triplicate. All images were acquired at the
same exposure time. pDesignates a significant decrease (p , 0.05) compared with T cells treated with METH alone. D, Representative histogram
depicting MTG fluorescence in T cells. Untreated T cells and T cells treated with METH for 24 h are shown. Statistical analysis of three independent
experiments with pp , 0.05 compared with the untreated sample.
2872
METHAMPHETAMINE CAUSES T LYMPHOCYTE DYSFUNCTION
over, after 3 h exposure, the fluorescence intensity was further di-
different antioxidants was able to prevent the reduction of com-
minished (.60%; p , 0.05). Next, to determine whether METH
plexes I, III, and IV proteins after METH exposure.
could cause changes in the amount of mitochondria, we used the
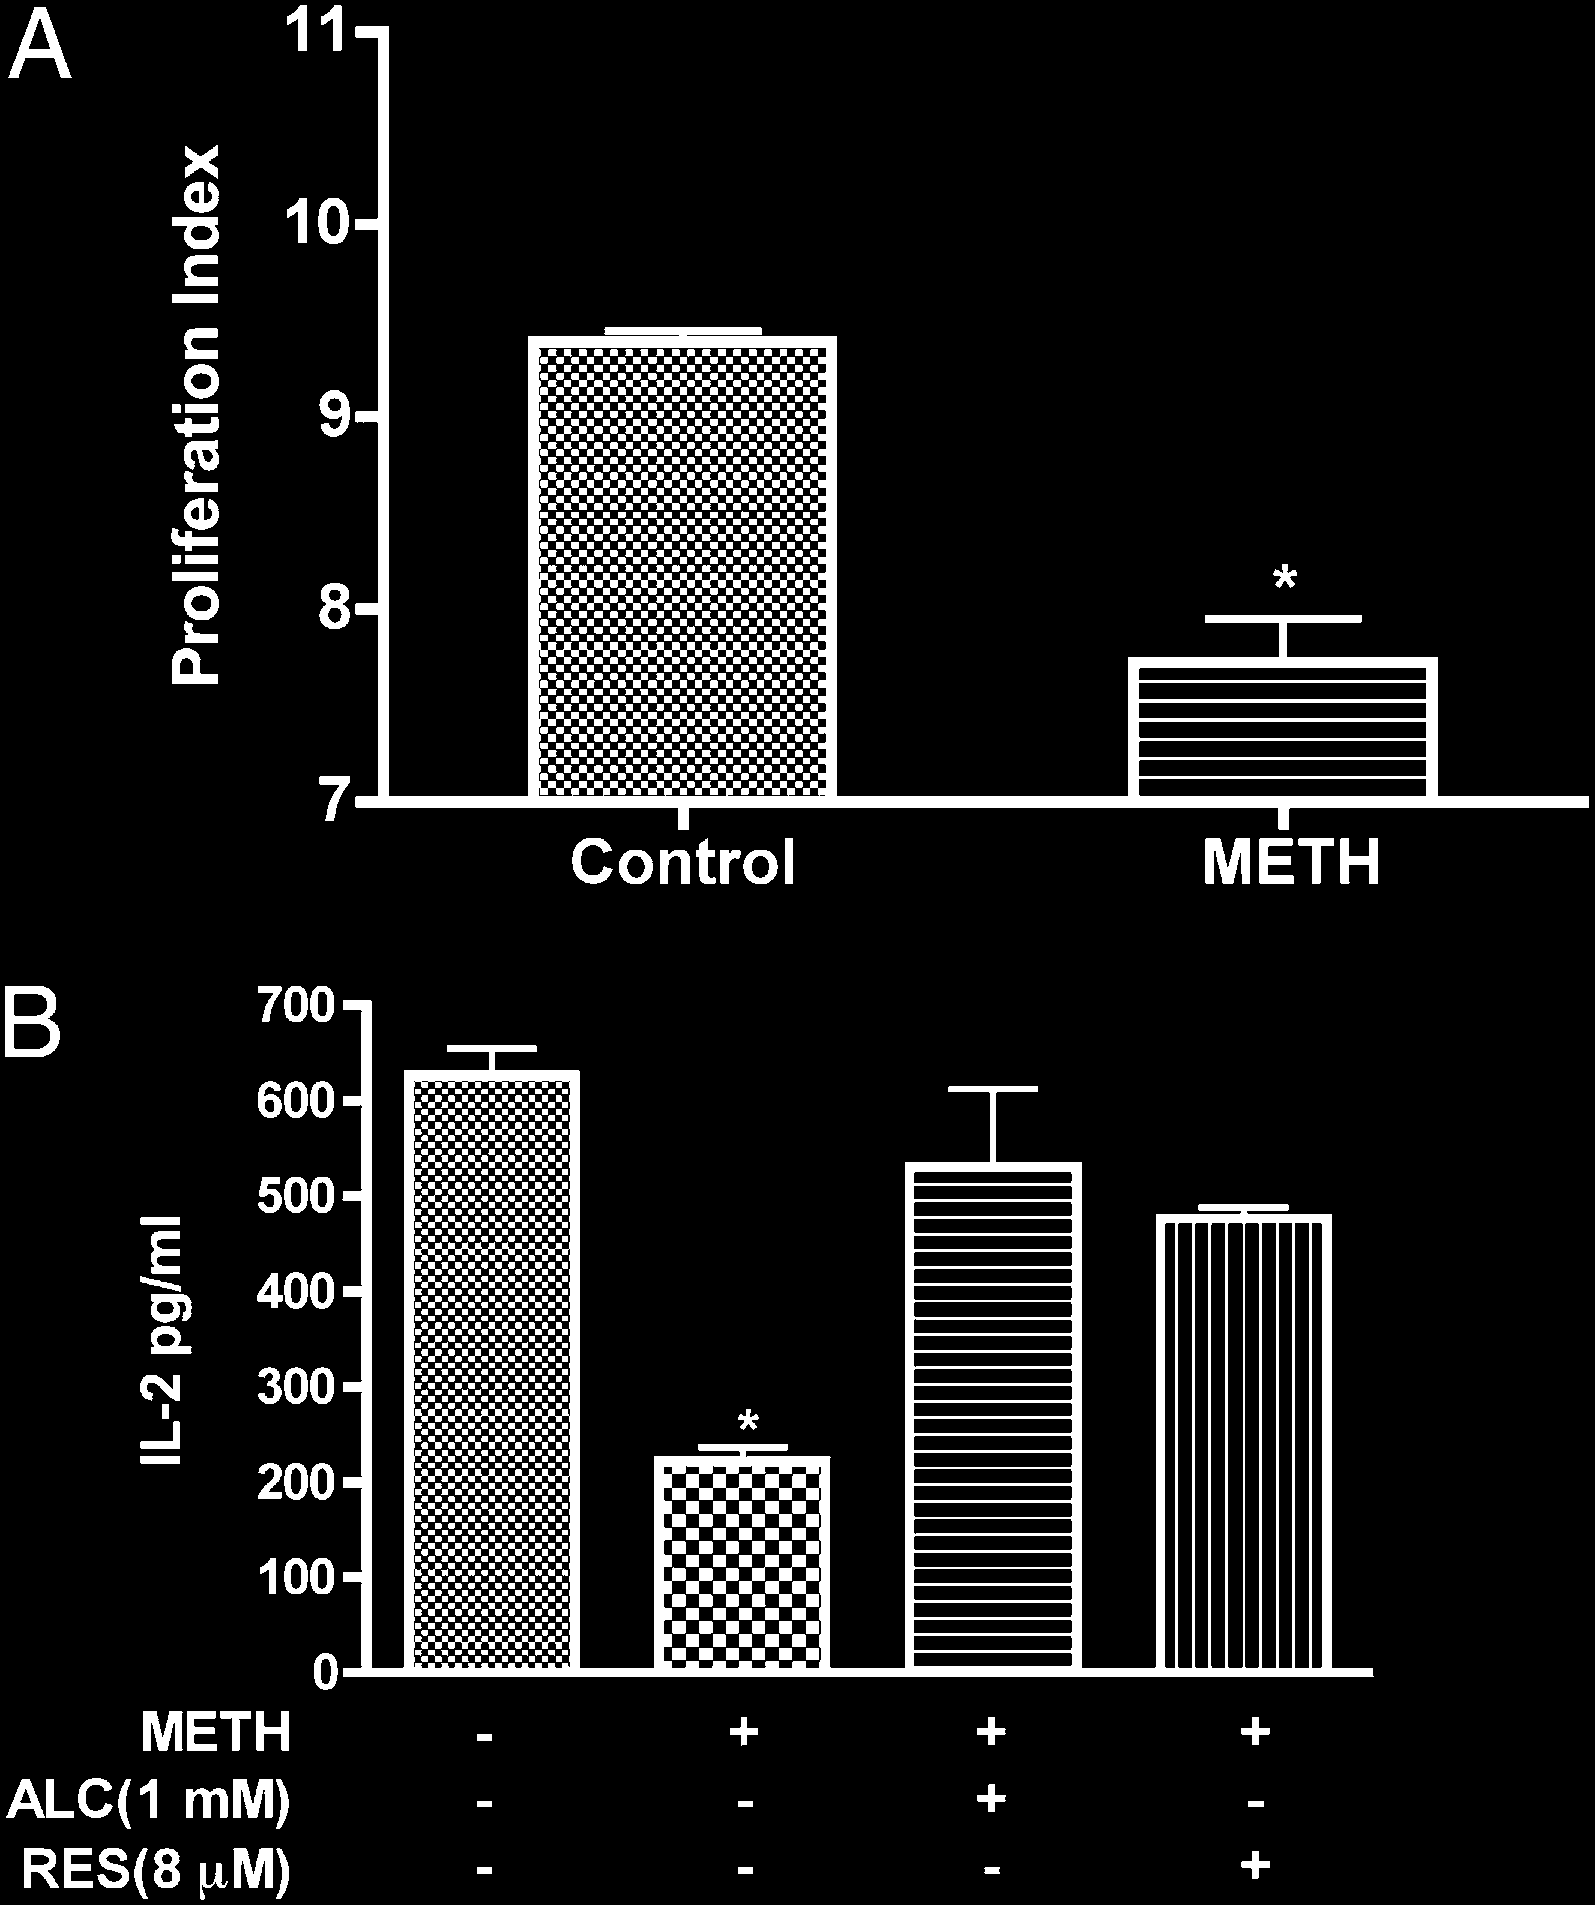
METH causes suppression of T cell proliferative responses and
fluorescent mitochondrial specific dye, MTG, to monitor MM. In
inhibits IL-2 secretion
this assay, the dye binds to the mitochondrial membrane indepen-
dent of membrane potential and staining intensity indicates MM
Oxidative stress impairs several T cell functions, including de-
(41–44). T cells were treated with the indicated concentrations of
creased production of cytokines and reduced capacity of lympho-
METH (50 mM) for 0–48 h and the mean fluorescence intensity was
cytes to respond to relevant stimuli as shown in several diseases (19–
measured. At 24–48 h, the MTG intensity of METH-exposed cells
21, 46). Because METH abuse has been shown to impair immuno-
was 1.7-fold higher as compared with control untreated cells (p ,
logical functions (1, 2, 4, 47), we sought to evaluate how METH-
0.05, Fig. 4D). Based on these results, it is plausible to suggest that
induced ROS could affect T cell functions (IL-2 production and
METH treatment at early time leads to mitochondrial injury and
T cell proliferation). As a prelude to measuring T cell function after
later results in mitochondrial swelling or an increase in the number
METH treatment, we examined the proliferative response of T cells
of mitochondria (evidenced by higher MTG intensity).
costimulated with CD3/CD8 in the presence or absence of METH.
The proliferative index of cells treated with METH was signifi-
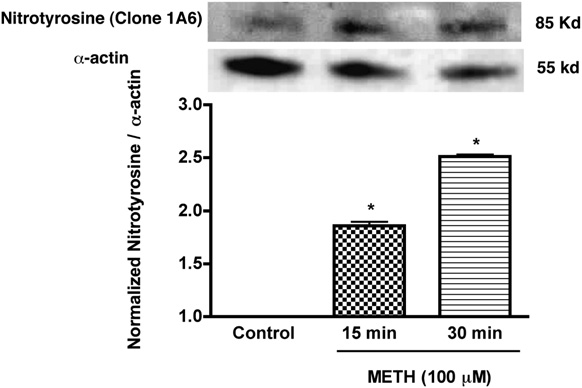
METH exposure increases cellular nitrosylation in T cells
cantly reduced (21%, p , 0.001) as compared with control (Fig.
NO generated during ROS production reacts to form the strong
7A). T cells activated in similar fashion showed enhanced secretion
oxidizing agent peroxynitrite. Peroxynitrite in turn can modify
of IL-2, and METH treatment resulted in 3-fold reduction of IL-2
tyrosine residues in a process known as nitration, which has been
levels (p < 0.01, Fig. 7B). We next evaluated whether the effect of
Downloaded from
implicated in cellular damage in several pathologic conditions. We
METH on IL-2 via generation of reactive species could be reversed
assessed nitrosylation of protein in whole cell lysate by immu-
by antioxidants. Pretreatment of T cells with antioxidants prior to
noblotting of protein extracts obtained from control and T cells
METH treatment restored production of IL-2 (Fig. 7B).
exposed to METH. The nitrotyrosine level in METH-treated T cells
increased significantly within 15–30 min of treatment when com-
Discussion
pared with control cells (p , 0.01, Fig. 5). These results suggest
In recent years, considerable progress has been made in delineating
that METH exposure caused production of strong oxidants, which
the immunosuppressive effects of METH, a substance that is ab-
http://www.jimmunol.org/
can modify protein residues (tyrosine nitration), which can lead to
used by 35 million people worldwide (48). Nevertheless, little is
impaired cellular enzymes, membranes, and organelles.
known about the oxidative and immunotoxic effects of METH on
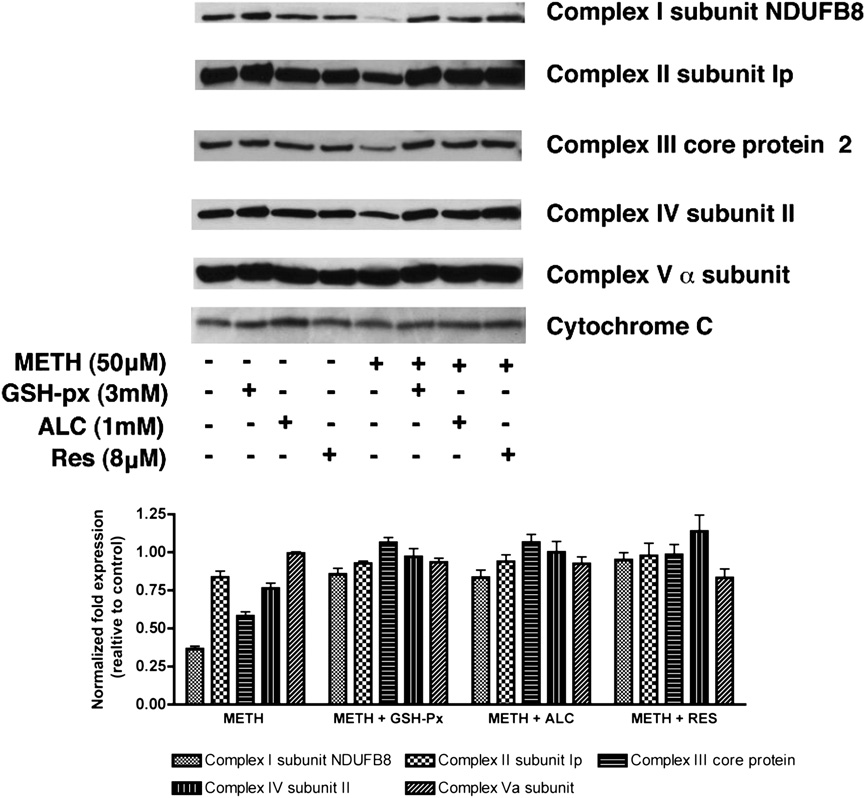
Mitochondrial protein content is altered in METH-treated
T cells as a potential mechanism of METH-mediated immune sup-
T cells
pression. In the current study, we show for the first time that
METH alters intracellular calcium mobilization in T cells, leading
A compromise of cellular redox homeostasis results in oxidative
to subsequent generation of ROS, which correlates with mitochon-
stress. The imbalance may be either due to overproduction of ROS
drial damage and leads to impaired T cell function. The role of
or to a deficiency in antioxidant defense mechanisms. Because
oxidative stress in the etiology of numerous human diseases has
primary sites for mROS production are the enzyme complexes of
by guest on March 28, 2018
been clearly demonstrated (49–52). Experimental and clinical data
the ETC (45), we investigated whether levels of these mitochon-
point toward mitochondrial oxidative damage and dysfunction as
drial proteins were altered after METH treatment. Immunoblot
important contributors to a number of pathologic conditions asso-
analysis of the mitochondrial fraction from T cells treated with
ciated with METH abuse (53, 54). However, the mechanism by
METH revealed a notable decrease in protein levels of complexes
which METH-induced oxidative stress contributes to cellular dys-
I (subunit NDUFB8), III (core protein 2), and IV (subunit II) of
function is poorly understood.
the ETC (Fig. 6). We did not detect appreciable change in the
The mitochondrion serves as the primary source of both in-
protein content of complex II (Ip subunit), complex V (a subunit),
tracellular ROS and ATP production, a process governed by the
or cytochrome c. Importantly, pretreatment of T cells with three
second messenger, calcium. Extracellular stimuli initiate cellular
signaling via an increase in intracellular calcium (55), which is
readily sequestered by mitochondria. On mitochondrial entry, cal-
cium enhances the activity of the tricarboxylic acid cycle dehy-
drogenases (56), rapidly elevating cellular levels of the mitochon-
drial complex I substrate, NADH, to stimulate energy production
(57). This rapid increase in mitochondrial respiration saturates com-
plex I and promotes electron leakage at complex III, which reacts
with molecular oxygen to form ROS (58). Although long considered
a simple byproduct of increased respiration, it is now appreciated
that physiologic mROS generation serves to integrate energy pro-
duction with energy demand by indicating the availability of suffi-
cient metabolic substrates for T cell proliferation (11). As important
secondary messengers, ROS act as mediators of immunity; how-
ever, ROS overproduction can impair T cell responses (59). In
the striatum by mechanisms not completely understood, METH
FIGURE 5.
Enhanced expression of nitrotyrosine in T cells treated with
increases cytosolic calcium levels most likely at the plasma mem-
METH. Western blot analysis of nitrotyrosine levels of METH (100 mM)
brane via the extracellular milieu, initiating production of ROS
treated and untreated T cells. Representative immunoblots of nitrotyrosine
and cell death in brain tissue (60). Because of the known immuno-
and internal standard a-actin are shown in blots and the ratios of nitro-
tyrosine staining to
toxic effect of METH on T cells, we tested the idea that METH-
a-actin are shown in the histogram. Error bars repre-
sent mean 6 SD of three independent experiments. pp , 0.01 (METH
mediated calcium elevations lead to increased generation of ROS
treated versus control).
and reactive RNS, which in turn trigger mitochondrial oxidative
The Journal of Immunology
2873
FIGURE 6.
Changes in expression of specific
mitochondrial protein in T cells in response to
METH. Primary human T cells either pretreated (30
min) with antioxidants as indicated or untreated were
exposed to METH (50 mM). Representative immu-
noblots of three independent experiments and the
relative fold expression of protein subunits normal-
ized to cytochrome c are shown in the histogram. The
corresponding complexes of the specific subunits are
indicated in parentheses. After 24 h, cells were har-
vested, and the mitochondrial fraction of the cell was
isolated according to the protocol provided by the
manufacturer (MitoSciences). Equal amounts of
mitochondrial protein were analyzed by SDS-PAGE
and immunoblotted with Abs to complex I (NADH
dehydrogenase) subunit NDUFB8, complex II 30
kDa Ip subunit, 47 kDa complex III core protein 2,
complex IV 26 kDa COX subunit II, 55 kDa F1F0
Downloaded from
ATP synthase (complex V) a subunit, or cytochrome
c (MitoSciences). Pretreatment with antioxidants
(GSH-px, ALC, and RES) 30 min prior to METH
exposure appreciably prevented alteration of protein
content of mitochondrial respiratory complexes I, III,
and IV. GSH-px, glutathione peroxidase.
http://www.jimmunol.org/
damage and dysfunction. Our data indicated that METH in-
mitochondrial calcium uptake level measured by Rhod-2 was signif-
creased cellular calcium entry that corresponded to an increase in
icantly increased (Fig. 3B). We reasoned that the observed dis-
intracellular ROS levels, and a calcium chelator in the media pre-
cordance between unaltered cytosolic calcium levels and increased
vented these changes. Interestingly, we found that although cytosolic
mitochondrial calcium uptake in T cells exposed to METH is attrib-
calcium levels remained significantly unaltered in METH-treated
utable to mitochondrial calcium handling capacity, resulting in mi-
T cells in response to CD3/CD28 costimulation (Fig. 3A), the
tochondrial calcium overload that leads to mROS generation.
by guest on March 28, 2018
Indeed, the basis for this observed discordance was supported by
simultaneous assessment of cytoplasmic calcium levels (Fig. 3C,
3D) and generation of mitochondrial superoxide (Fig. 3D, 3E).
The Dcm assures major bioenergetic function of the mitochon-
drion; Dcm collapse as a response to extraneous environmental
stimuli contributes to the loss of cellular functions (61, 62). To
investigate the effects of METH exposure on T cells, we measured
Dcm using two-mitochondrial probes, MTR and a fluorescent cat-
ionic dye, JC-1 that effectively detect change in membrane poten-
tial. MTR binds covalently to thiol residues of mitochondrial
proteins, depending on the electrical potential of the organelles.
The lipophilic dye JC-1 in healthy cells with an intact Dcm interacts
with the mitochondrial matrix and once the critical concentration is
exceeded, form aggregates, which stains the mitochondria red. In
conditions where there is a decrease in Dcm, the dye leaks from the
mitochondria, remains in its monomeric form, and appears green.
Furthermore, because the positive charge and lipophilic nature of
the METH cation allows its diffusion into mitochondria where it is
retained by these organelles (63), could further facilitate the time-
dependent loss in Dcm in T cells after METH treatment.
Another indicator of mitochondrial impairment was a significant
time-dependent increase in MM in T cells ater 24–48 h exposure to
METH (Fig. 4D). In comparison with untreated cells, MTG fluo-
FIGURE 7.
METH suppresses T cell proliferation and IL-2 secretion. A,
rescence was increased in T cells treated with METH. These data
Freshly isolated T cells labeled with CFSE were stimulated with anti-CD3/
are consistent with recent findings of augmented MM seen in
CD28 in the absence or presence of METH (50 mM). In contrast to un-
human neurobalstoma cells during METH treatment (64). The
treated cells, on TCR engagement, METH-treated T cells showed de-
increase of MM could be viewed as a compensatory mechanism
creased T cell proliferation (pp , 0.001). B, T cells were stimulated
that may represent enhanced mitochondrial biogenesis in METH-
with anti-CD3/CD28 for 24 h and supernatant fluid was analyzed for
IL-2 production by ELISA. pDesignates significant decrease (p , 0.01)
treated T cells. Alternatively, as mitochondria constitute major
compared with nontreated T cells.
Ca2+ stores (65), increased MM may account for altered Ca2+
2874
METHAMPHETAMINE CAUSES T LYMPHOCYTE DYSFUNCTION
handling in cells exposed to METH. Such changes may be an
complex proteins (especially complex I and III), which promote
important adaptive cellular mechanism aiming to reduce oxidative
inefficient electron flow through the respiratory chain and subse-
stress without a necessary alteration in respiration and energy sup-
quent ROS generation. Based on these findings, we conclude that
ply (66, 67). However, one cannot distinguish by flow cytometry-
acute ROS production in response to METH is due to the rise in
based assay whether high MM corresponds to higher numbers of
cytosolic calcium and saturation of the ETC, which leads to the
mitochondria or larger organelles, both resulting in more intense
oxidative modification of proteins and mitochondrial dysfunction.
staining. Further experiments using electron microscopy are
Chronically, METH-induced ROS production leads to a compensa-
needed to clarify this issue. A number of oxidative and nitrative
tory downregulation of mitochondrial proteins that, while protect-
modifications occur in proteins as a result of oxidative damage (68–
ing T cells from ROS during acute METH exposure, may affect
70). To date, it is to be determined whether this relationship is
long-term cellular redox balance and the ability of T cells to re-
causative or simply correlative. Nevertheless, the studies of these
spond to pathogens. Similarly, the loss of intracellular ATP levels in
protein modifications serve as important molecular biomarkers of
T cells treated with METH (Supplemental Fig. 3) provides addi-
oxidative/nitrosative damage and contribute to the establishment
tional support for the hypothesis that METH-mediated ROS pro-
of a relationship between the insult and protein structural and func-
duction consequently results in mitochondria dysfunction.
tional changes (71, 72). In the current study, the increased produc-
Antioxidants are pivotal in maintaining redox balance by either
tion of nitrotyrosine reflects oxidative stress in T cells mediated by
preventing the formation of free radicals, detoxifying them, or by
METH. Consistent with our data, oxidative damage of proteins,
scavenging the reactive species or their precursors. The broad
lipids, and DNA was reported in response to repeated METH ad-
spectrum of biological functions of the antioxidants suggests the
ministration (43, 73). The rapid generation of ROS/RNS on METH
existence of multiple molecular targets that mediate diverse re-
Downloaded from
exposure probably affects the antioxidant capacity of T cells, ren-
sponses, best understood in the context of their clinical and biochem-
dering them unable to keep up with radical production and initiat-
ical effects on reactive species. ALC, an acetylated derivative of L-
ing the oxidative modification of proteins.
carnitine, exhibits the antioxidant defense through both improved
The ability of lymphocytes to proliferate and differentiate into
b-oxidation and direct oxygen radical scavenging activity. Phenolic
effector cells in response to antigenic stimuli is essential for gen-
antioxidants, such as RES, act by preventing lipid peroxidation of
eration of a robust adaptive immune response (74). Therefore, T cell
membrane polyunsaturated fatty acids thus preventing loss of mem-
proliferation in response to a stimulus is an appropriate indicator
brane integrity. GHS-px, an enzyme functions as a primary endog-
http://www.jimmunol.org/
for cellular immunity. We demonstrate in this study that exposure
enous antioxidant by preventing ROS formation (80). Importantly,
of T cells to METH results in the loss of T cell proliferative activity.
antioxidants with diverse modes of action prevented METH-
Previous studies have indicated that ROS could prevent pro-
induced ROS generation, its inhibitory effects on mitochondrial
liferation of T lymphocytes and production of key cytokines and
complex I, III, and IV expression and the decreased IL-2 production
effector molecules thereby orchestrating immune responses (59,
by METH-exposed T cell. Our data suggest that mitochondrial
75). These changes, coupled with the METH-induced direct immu-
oxidative damage is responsible for METH-mediated toxicity and
nosuppressive effects on dendritic cells and macrophages (48),
that antioxidant application can protect this organelle and the cell
suggest that METH has multifaceted effects on different arms of
from toxic injury.
by guest on March 28, 2018
immunity. The finding that oxidative stress may be a forerunner for
In summary, our data suggest that an important target of METH-
loss in T cell function due to METH abuse could have far-reaching
induced cellular ROS in naive and activated T cells is the mitochon-
implications not just for the induction of immune response, but also
drion, resulting in mitochondrial injury (decreased membrane
for other processes (such as generation of antigenic peptides and
potential and increased MM). The ensuing METH-induced gener-
cell cycle regulation) that are important for immune regulation.
ation of ROS represents a redox-dependent pathway mediating
ROS are both produced within T cells and are released into
T cell immune dysfunction.
the extracellular space at varying concentrations. At physiological
levels, ROS are involved in T cell signaling and maintain homeo-
Disclosures
stasis (76). At higher levels, ROS are toxic and have detrimental
The authors have no financial conflicts of interest.
effects on the cells. The results from our current study demonstrate
that mitochondria are both a source and a target for ROS. Consistent
with our findings, an increase in oxidative stress due to METH or its
References
metabolites has been reported (41, 42, 61, 64, 73). Moreover, pre-
1. Iwasa, H., S. Kikuchi, S. Hasegawa, K. Suzuki, and T. Sato. 1996. Alteration of
G protein subclass mRNAs in methamphetamine-induced behavioral sensitiza-
vious studies have suggested a role for the mitochondrial ETC in
tion. Ann. N. Y. Acad. Sci. 801: 110–115.
mediating toxicity of METH (77). The outer and inner membranes
2. Zule, W. A., and D. P. Desmond. 1999. An ethnographic comparison of HIV risk
and electron transport chain complexes of the mitochondria play
behaviors among heroin and methamphetamine injectors. Am. J. Drug Alcohol
Abuse 25: 1–23.
a pivotal role in regulation of energy production. The major source
3. Phillips, T. R., J. N. Billaud, and S. J. Henriksen. 2000. Methamphetamine and
of mROS production is the ubiquinone sites of the respiratory chain
HIV-1: potential interactions and the use of the FIV/cat model. J. Psychophar-
enzymes of complexes I (NADH-dehydrogenase) and III (45).
macol. (Oxford) 14: 244–250.
4. Yu, Q., D. Zhang, M. Walston, J. Zhang, Y. Liu, and R. R. Watson. 2002. Chronic
METH exposure of human T lymphocytes resulted in reduced ex-
methamphetamine exposure alters immune function in normal and retrovirus-
pression of complex I (NADH dehydrogenase) subunit NDUFB8,
infected mice. Int. Immunopharmacol. 2: 951–962.
complex III (ubiquinol cytochrome c oxidoreductase) subunit core
5. In, S. W., E. W. Son, D. K. Rhee, and S. Pyo. 2005. Methamphetamine ad-
ministration produces immunomodulation in mice. J. Toxicol. Environ. Health A
protein 2, and complex IV (Cox II). Similar findings of decreased
68: 2133–2145.
protein expression of mitochondrial respiratory complexes were
6. Mahajan, S. D., Z. Hu, J. L. Reynolds, R. Aalinkeel, S. A. Schwartz, and
reported in rat brain (78) and human neuroblastoma cells (64) after
M. P. Nair. 2006. Methamphetamine modulates gene expression patterns in
monocyte derived mature dendritic cells: implications for HIV-1 pathogenesis.
METH treatment. ROS production is significantly enhanced if elec-
Mol. Diagn. Ther. 10: 257–269.
tron transport is altered through these complexes due to sub-
7. Saito, M., M. Terada, T. Kawata, H. Ito, N. Shigematsu, P. Kromkhun, M. Yokosuka,
tle changes in the expression of these subunits (79). It is therefore
and T. R. Saito. 2008. Effects of single or repeated administrations of metham-
phetamine on immune response in mice. Exp. Anim. 57: 35–43.
plausible to conceive that the chronic increase in ROS production in
8. Nair, M. P., Z. M. Saiyed, N. Nair, N. H. Gandhi, J. W. Rodriguez, N. Boukli,
response to METH may be due to modifications in mitochondrial
E. Provencio-Vasquez, R. M. Malow, and M. J. Miguez-Burbano. 2009. Metham-
The Journal of Immunology
2875
phetamine enhances HIV-1 infectivity in monocyte derived dendritic cells. J. Neu-
32. Cadet, J. L., I. N. Krasnova, S. Jayanthi, and J. Lyles. 2007. Neurotoxicity of
roimmune Pharmacol. 4: 129–139.
substituted amphetamines: molecular and cellular mechanisms. Neurotox. Res.
9. Martinez, L. R., M. R. Mihu, A. Ga´cser, L. Santambrogio, and J. D. Nosanchuk.
11: 183–202.
2009. Methamphetamine enhances histoplasmosis by immunosuppression of the
33. Uramura, K., T. Yada, S. Muroya, and M. Takigawa. 2000. Ca2+ oscillations in
host. J. Infect. Dis. 200: 131–141.
response to methamphetamine in dopamine neurons of the ventral tegmental area
10. Jekabsons, M. B., and D. G. Nicholls. 2004. In situ respiration and bioenergetic
in rats subchronically treated with this drug. Ann. N. Y. Acad. Sci. 914: 316–322.
status of mitochondria in primary cerebellar granule neuronal cultures exposed
34. Goodwin, J. S., G. A. Larson, J. Swant, N. Sen, J. A. Javitch, N. R. Zahniser,
continuously to glutamate. J. Biol. Chem. 279: 32989–33000.
L. J. De Felice, and H. Khoshbouei. 2009. Amphetamine and methamphetamine
11. Jones, R. G., T. Bui, C. White, M. Madesh, C. M. Krawczyk, T. Lindsten,
differentially affect dopamine transporters in vitro and in vivo. J. Biol. Chem.
B. J. Hawkins, S. Kubek, K. A. Frauwirth, Y. L. Wang, et al. 2007. The pro-
284: 2978–2989.
apoptotic factors Bax and Bak regulate T Cell proliferation through control of
35. Tata, D. A., and B. K. Yamamoto. 2007. Interactions between methamphetamine
endoplasmic reticulum Ca(2+) homeostasis. Immunity 27: 268–280.
and environmental stress: role of oxidative stress, glutamate and mitochondrial
12. Quintana, A., C. Schwindling, A. S. Wenning, U. Becherer, J. Rettig, E. C. Schwarz,
dysfunction. Addiction 102(Suppl 1): 49–60.
and M. Hoth. 2007. T cell activation requires mitochondrial translocation to the
36. Turrens, J. F. 2003. Mitochondrial formation of reactive oxygen species. J.
immunological synapse. Proc. Natl. Acad. Sci. USA 104: 14418–14423.
Physiol. 552: 335–344.
13. Hawkins, B. J., L. A. Solt, I. Chowdhury, A. S. Kazi, M. R. Abid, W. C. Aird,
37. Murphy, M. P. 2009. How mitochondria produce reactive oxygen species. Bio-
M. J. May, J. K. Foskett, and M. Madesh. 2007. G protein-coupled receptor
chem. J. 417: 1–13.
Ca2+-linked
mitochondrial
reactive
oxygen
species
are
essential
for
38. Mukhopadhyay, P., M. Rajesh, K. Yoshihiro, G. Hasko´, and P. Pacher. 2007.
endothelial/leukocyte adherence. Mol. Cell. Biol. 27: 7582–7593.
Simple quantitative detection of mitochondrial superoxide production in
14. D’Aurelio, M., M. Merlo Pich, L. Catani, G. L. Sgarbi, C. Bovina, G. Formiggini,
live cells. Biochem. Biophys. Res. Commun. 358: 203–208.
G. Parenti Castelli, H. Baum, S. Tura, and G. Lenaz. 2001. Decreased Pasteur effect
39. Vayssier-Taussat, M., S. E. Kreps, C. Adrie, J. Dall’Ava, D. Christiani, and
in platelets of aged individuals. Mech. Ageing Dev. 122: 823–833.
B. S. Polla. 2002. Mitochondrial membrane potential: a novel biomarker of
15. Fukami, G., K. Hashimoto, K. Koike, N. Okamura, E. Shimizu, and M. Iyo.
oxidative environmental stress. Environ. Health Perspect. 110: 301–305.
2004. Effect of antioxidant N-acetyl-L-cysteine on behavioral changes and neu-
40. Hajno´czky, G., G. Csorda´s, S. Das, C. Garcia-Perez, M. Saotome, S. Sinha Roy,
rotoxicity in rats after administration of methamphetamine. Brain Res. 1016: 90–
and M. Yi. 2006. Mitochondrial calcium signalling and cell death: approaches
95.
for assessing the role of mitochondrial Ca2+ uptake in apoptosis. Cell Calcium
Downloaded from
16. Stephans, S. E., and B. K. Yamamoto. 1994. Methamphetamine-induced neuro-
40: 553–560.
toxicity: roles for glutamate and dopamine efflux. Synapse 17: 203–209.
41. Lee, H. C., and Y. H. Wei. 2005. Mitochondrial biogenesis and mitochondrial
17. Ramirez, S. H., R. Potula, S. Fan, T. Eidem, A. Papugani, N. Reichenbach,
DNA maintenance of mammalian cells under oxidative stress. Int. J. Biochem.
H. Dykstra, B. B. Weksler, I. A. Romero, P. O. Couraud, and Y. Persidsky. 2009.
Cell Biol. 37: 822–834.
Methamphetamine disrupts blood-brain barrier function by induction of oxida-
42. Lee, H. C., P. H. Yin, C. W. Chi, and Y. H. Wei. 2002. Increase in mitochondrial
tive stress in brain endothelial cells. J. Cereb. Blood Flow Metab. 29: 1933–
mass in human fibroblasts under oxidative stress and during replicative cell se-
1945.
nescence. J. Biomed. Sci. 9: 517–526.
18. Grisham, M. B. 2004. Reactive oxygen species in immune responses. Free
43. Lee, H. C., P. H. Yin, C. Y. Lu, C. W. Chi, and Y. H. Wei. 2000. Increase of
Radic. Biol. Med. 36: 1479–1480.
http://www.jimmunol.org/
mitochondria and mitochondrial DNA in response to oxidative stress in
19. Stefanova´, I., M. W. Saville, C. Peters, F. R. Cleghorn, D. Schwartz,
human cells. Biochem. J. 348: 425–432.
D. J. Venzon, K. J. Weinhold, N. Jack, C. Bartholomew, W. A. Blattner, et al.
44. Petrovas, C., Y. M. Mueller, I. D. Dimitriou, S. R. Altork, A. Banerjee, P. Sklar,
1996. HIV infection—induced posttranslational modification of T cell signaling
K. C. Mounzer, J. D. Altman, and P. D. Katsikis. 2007. Increased mitochondrial
molecules associated with disease progression. J. Clin. Invest. 98: 1290–1297.
mass characterizes the survival defect of HIV-specific CD8(+) T cells. Blood
20. Zea, A. H., M. T. Ochoa, P. Ghosh, D. L. Longo, W. G. Alvord, L. Valderrama,
109: 2505–2513.
R. Falabella, L. K. Harvey, N. Saravia, L. H. Moreno, and A. C. Ochoa. 1998.
45. Moncada, S., and J. D. Erusalimsky. 2002. Does nitric oxide modulate mito-
Changes in expression of signal transduction proteins in T lymphocytes of
chondrial energy generation and apoptosis? Nat. Rev. Mol. Cell Biol. 3: 214–220.
patients with leprosy. Infect. Immun. 66: 499–504.
46. Cayota, A., F. Vuillier, J. Siciliano, and G. Dighiero. 1994. Defective protein
21. Maurice, M. M., A. C. Lankester, A. C. Bezemer, M. F. Geertsma, P. P. Tak,
tyrosine phosphorylation and altered levels of p59fyn and p56lck in CD4 T cells
F. C. Breedveld, R. A. van Lier, and C. L. Verweij. 1997. Defective TCR-
from HIV-1 infected patients. Int. Immunol. 6: 611–621.
mediated signaling in synovial T cells in rheumatoid arthritis. J. Immunol. 159:
47. House, R. V., P. T. Thomas, and H. N. Bhargava. 1994. Comparison of immune
by guest on March 28, 2018
2973–2978.
functional parameters following in vitro exposure to natural and synthetic
22. Potula, R., S. H. Ramirez, B. Knipe, J. Leibhart, K. Schall, D. Heilman,
amphetamines. Immunopharmacol. Immunotoxicol. 16: 1–21.
B. Morsey, A. Mercer, A. Papugani, H. Dou, and Y. Persidsky. 2008. Peroxisome
48. Tallo´czy, Z., J. Martinez, D. Joset, Y. Ray, A. Ga´cser, S. Toussi, N. Mizushima,
proliferator-activated receptor-gamma activation suppresses HIV-1 replication in
J. D. Nosanchuk, J. Nosanchuk, H. Goldstein, et al. 2008. Methamphetamine
an animal model of encephalitis. AIDS 22: 1539–1549.
inhibits antigen processing, presentation, and phagocytosis. PLoS Pathog. 4: e28.
23. Maragos, W. F., K. L. Young, J. T. Turchan, M. Guseva, J. R. Pauly, A. Nath, and
49. Lin, M. T., and M. F. Beal. 2006. Mitochondrial dysfunction and oxidative stress
W. A. Cass. 2002. Human immunodeficiency virus-1 Tat protein and metham-
in neurodegenerative diseases. Nature 443: 787–795.
phetamine interact synergistically to impair striatal dopaminergic function. J.
50. Bonomini, F., S. Tengattini, A. Fabiano, R. Bianchi, and R. Rezzani. 2008.
Neurochem. 83: 955–963.
24. Theodore, S., W. A. Cass, A. Nath, J. Steiner, K. Young, and W. F. Maragos.
Atherosclerosis and oxidative stress. Histol. Histopathol. 23: 381–390.
2006. Inhibition of tumor necrosis factor-alpha signaling prevents human immu-
51. Nishikawa, T., D. Edelstein, X. L. Du, S. Yamagishi, T. Matsumura, Y. Kaneda,
nodeficiency virus-1 protein Tat and methamphetamine interaction. Neurobiol.
M. A. Yorek, D. Beebe, P. J. Oates, H. P. Hammes, et al. 2000. Normalizing
Dis. 23: 663–668.
mitochondrial superoxide production blocks three pathways of hyperglycaemic
25. Reynolds, J. L., S. D. Mahajan, D. E. Sykes, S. A. Schwartz, and M. P. Nair.
damage. Nature 404: 787–790.
2007. Proteomic analyses of methamphetamine (METH)-induced differential
52. Martin, J. A., A. J. Klingelhutz, F. Moussavi-Harami, and J. A. Buckwalter.
protein expression by immature dendritic cells (IDC). Biochim. Biophys. Acta
2004. Effects of oxidative damage and telomerase activity on human articular
1774: 433–442.
cartilage chondrocyte senescence. J. Gerontol. A Biol. Sci. Med. Sci. 59: 324–
26. Melega, W. P., A. K. Cho, D. Harvey, and G. Lac´an. 2007. Methamphetamine
337.
blood concentrations in human abusers: application to pharmacokinetic model-
53. Chin, M. H., W. J. Qian, H. Wang, V. A. Petyuk, J. S. Bloom, D. M. Sforza,
ing. Synapse 61: 216–220.
G. Lac´an, D. Liu, A. H. Khan, R. M. Cantor, et al. 2008. Mitochondrial dys-
27. Kalasinsky, K. S., T. Z. Bosy, G. A. Schmunk, G. Reiber, R. M. Anthony,
function, oxidative stress, and apoptosis revealed by proteomic and tran-
Y. Furukawa, M. Guttman, and S. J. Kish. 2001. Regional distribution of
scriptomic analyses of the striata in two mouse models of Parkinson’s disease. J.
methamphetamine in autopsied brain of chronic human methamphetamine users.
Proteome Res. 7: 666–677.
Forensic Sci. Int. 116: 163–169.
54. Tain, L. S., R. B. Chowdhury, R. N. Tao, H. Plun-Favreau, N. Moisoi, L. M. Martins,
28. Klette, K. L., A. R. Kettle, and M. H. Jamerson. 2006. Prevalence of use study
J. Downward, A. J. Whitworth, and N. Tapon. 2009. Drosophila HtrA2 is dis-
for amphetamine (AMP), methamphetamine (MAMP), 3,4-methylenedioxy-
pensable for apoptosis but acts downstream of PINK1 independently from Parkin.
amphetamine (MDA), 3,4-methylenedioxy-methamphetamine (MDMA), and
Cell Death Differ. 16: 1118–1125.
3,4-methylenedioxy-ethylamphetamine (MDEA) in military entrance processing
55. Feske, S. 2007. Calcium signalling in lymphocyte activation and disease. Nat.
stations (MEPS) specimens. J. Anal. Toxicol. 30: 319–322.
Rev. Immunol. 7: 690–702.
29. Takayasu, T., T. Ohshima, J. Nishigami, T. Kondo, and T. Nagano. 1995.
56. Wan, B., K. F. LaNoue, J. Y. Cheung, and R. C. Scaduto, Jr. 1989. Regulation of
Screening and determination of methamphetamine and amphetamine in the
citric acid cycle by calcium. J. Biol. Chem. 264: 13430–13439.
blood, urine and stomach contents in emergency medical care and autopsy cases.
57. White, C., C. Li, J. Yang, N. B. Petrenko, M. Madesh, C. B. Thompson, and
J. Clin. Forensic Med. 2: 25–33.
J. K. Foskett. 2005. The endoplasmic reticulum gateway to apoptosis by Bcl-X
30. Madesh, M., W. X. Zong, B. J. Hawkins, S. Ramasamy, T. Venkatachalam,
(L) modulation of the InsP3R. Nat. Cell Biol. 7: 1021–1028.
P. Mukhopadhyay, P. J. Doonan, K. M. Irrinki, M. Rajesh, P. Pacher, and
58. Nicholls, D. G. 2002. Mitochondrial function and dysfunction in the cell: its
C. B. Thompson. 2009. Execution of superoxide-induced cell death by the pro-
relevance to aging and aging-related disease. Int. J. Biochem. Cell Biol. 34:
apoptotic Bcl-2-related proteins Bid and Bak. Mol. Cell. Biol. 29: 3099–3112.
1372–1381.
31. Mukhopadhyay, P., M. Rajesh, G. Hasko´, B. J. Hawkins, M. Madesh, and
59. Gelderman, K. A., M. Hultqvist, A. Pizzolla, M. Zhao, K. S. Nandakumar, R. Mattsson,
P. Pacher. 2007. Simultaneous detection of apoptosis and mitochondrial super-
and R. Holmdahl. 2007. Macrophages suppress T cell responses and arthritis de-
oxide production in live cells by flow cytometry and confocal microscopy. Nat.
velopment in mice by producing reactive oxygen species. J. Clin. Invest. 117: 3020–
Protoc. 2: 2295–2301.
3028.
2876
METHAMPHETAMINE CAUSES T LYMPHOCYTE DYSFUNCTION
60. Pubill, D., C. Chipana, A. Camins, M. Palla`s, J. Camarasa, and E. Escubedo.
70. Bagasra, O., F. H. Michaels, Y. M. Zheng, L. E. Bobroski, S. V. Spitsin, Z. F. Fu,
2005. Free radical production induced by methamphetamine in rat striatal syn-
R. Tawadros, and H. Koprowski. 1995. Activation of the inducible form of nitric
aptosomes. Toxicol. Appl. Pharmacol. 204: 57–68.
oxide synthase in the brains of patients with multiple sclerosis. Proc. Natl. Acad.
61. Duchen, M. R. 2000. Mitochondria and calcium: from cell signalling to cell
Sci. USA 92: 12041–12045.
death. J. Physiol. 529: 57–68.
71. Haorah, J., D. Heilman, C. Diekmann, N. Osna, T. M. Donohue, Jr., A. Ghorpade,
62. Perl, A., Y. Qian, K. R. Chohan, C. R. Shirley, W. Amidon, S. Banerjee,
and Y. Persidsky. 2004. Alcohol and HIV decrease proteasome and immunopro-
F. A. Middleton, K. L. Conkrite, M. Barcza, N. Gonchoroff, et al. 2006. Trans-
teasome function in macrophages: implications for impaired immune function
aldolase is essential for maintenance of the mitochondrial transmembrane po-
during disease. Cell. Immunol. 229: 139–148.
tential and fertility of spermatozoa. Proc. Natl. Acad. Sci. USA 103: 14813–
72. Potula, R., J. Haorah, B. Knipe, J. Leibhart, J. Chrastil, D. Heilman, H. Dou,
14818.
R. Reddy, A. Ghorpade, and Y. Persidsky. 2006. Alcohol abuse enhances neu-
63. Davidson, C., A. J. Gow, T. H. Lee, and E. H. Ellinwood. 2001. Methamphet-
roinflammation and impairs immune responses in an animal model of human
amine neurotoxicity: necrotic and apoptotic mechanisms and relevance to human
immunodeficiency virus-1 encephalitis. Am. J. Pathol. 168: 1335–1344.
abuse and treatment. Brain Res. Brain Res. Rev. 36: 1–22.
73. Jeng, W., A. W. Wong, R. Ting-A-Kee, and P. G. Wells. 2005. Methamphetamine-
64. Wu, C. W., Y. H. Ping, J. C. Yen, C. Y. Chang, S. F. Wang, C. L. Yeh, C. W. Chi,
enhanced embryonic oxidative DNA damage and neurodevelopmental deficits.
and H. C. Lee. 2007. Enhanced oxidative stress and aberrant mitochondrial
Free Radic. Biol. Med. 39: 317–326.
biogenesis in human neuroblastoma SH-SY5Y cells during methamphetamine
74. Prlic, M., M. A. Williams, and M. J. Bevan. 2007. Requirements for CD8 T-cell
induced apoptosis. Toxicol. Appl. Pharmacol. 220: 243–251.
priming, memory generation and maintenance. Curr. Opin. Immunol. 19: 315–
65. Pariente, J. A., C. Camello, P. J. Camello, and G. M. Salido. 2001. Release of
319.
calcium from mitochondrial and nonmitochondrial intracellular stores in mouse
75. Sklavos, M. M., H. M. Tse, and J. D. Piganelli. 2008. Redox modulation inhibits
pancreatic acinar cells by hydrogen peroxide. J. Membr. Biol. 179: 27–35.
66. Lambert, A. J., B. Wang, J. Yardley, J. Edwards, and B. J. Merry. 2004. The
CD8 T cell effector function. Free Radic. Biol. Med. 45: 1477–1486.
effect of aging and caloric restriction on mitochondrial protein density and ox-
76. Williams, M. S., and J. Kwon. 2004. T cell receptor stimulation, reactive oxygen
ygen consumption. Exp. Gerontol. 39: 289–295.
species, and cell signaling. Free Radic. Biol. Med. 37: 1144–1151.
67. Lo´pez-Lluch, G., N. Hunt, B. Jones, M. Zhu, H. Jamieson, S. Hilmer,
77. Brown, J. M., M. S. Quinton, and B. K. Yamamoto. 2005. Methamphetamine-
M. V. Cascajo, J. Allard, D. K. Ingram, P. Navas, and R. de Cabo. 2006.
induced inhibition of mitochondrial complex II: roles of glutamate and peroxy-
Calorie
restriction
induces
mitochondrial
biogenesis
and
bioenergetic
nitrite. J. Neurochem. 95: 429–436.
Downloaded from
efficiency. Proc. Natl. Acad. Sci. USA 103: 1768–1773.
78. Burrows, K. B., G. Gudelsky, and B. K. Yamamoto. 2000. Rapid and transient
68. Pratico`, D., C. M. Clark, V. M. Lee, J. Q. Trojanowski, J. Rokach, and
inhibition of mitochondrial function following methamphetamine or 3,4-
G. A. FitzGerald. 2000. Increased 8,12-iso-iPF2alpha-VI in Alzheimer’s disease:
methylenedioxymethamphetamine administration. Eur. J. Pharmacol. 398: 11–
correlation of a noninvasive index of lipid peroxidation with disease severity.
18.
Ann. Neurol. 48: 809–812.
79. Wallace, D. C., and W. Fan. 2009. The pathophysiology of mitochondrial disease
69. Lyras, L., R. H. Perry, E. K. Perry, P. G. Ince, A. Jenner, P. Jenner, and
as modeled in the mouse. Genes Dev. 23: 1714–1736.
B. Halliwell. 1998. Oxidative damage to proteins, lipids, and DNA in cortical
80. Milagros Rocha, M., and V. M. Victor. 2007. Targeting antioxidants to mito-
brain regions from patients with dementia with Lewy bodies. J. Neurochem. 71:
chondria and cardiovascular diseases: the effects of mitoquinone. Med. Sci.
302–312.
Monit. 13: RA132–RA145.
http://www.jimmunol.org/
by guest on March 28, 2018