link to page 1 link to page 2
Technical Note
By:
Date:
7 December 2015
Subject:
SH88 Shared Path - Economic Analysis
Our Ref:
3384403
(SP11)
Introduction
The extension of the SH88 shared use path from St Leonards the rest of the way to Port Chalmers
is expected to provide a safer off-road cycle and walking path compared to the current alternative of
using SH88.
Although this work is split into two stages, it has been evaluated as a single combined package of
works, as the majority of the benefits only accrue once both stages have been completed.
Previous Evaluation
An economic evaluation of the project was undertaken during the Scheme Assessment phase in
February 2014. At that stage the cost of the scheme was considerably lower than the current
estimate, with a total package cost of $7M.
This evaluation produced a BCR for the complete works of 4.2.
Cycle Demand
Existing Cyclist Demand and Growth
Cyclist numbers on the existing Ravensbourne Harbour Cycle Way were surveyed by the NZ
Transport Agency over a two hour period on the afternoon of Wednesday 4th February 2014,
between 5:45 and 7:45pm, and are reported in Dunedin One Way System (SH1) Cycle Survey
Report issued in March 2014. These results, along with those from the previous two years, are
shown in
Table 1.
Table 1: Observed Cyclist Numbers on Ravensburne Harbour Cycle Way [2 hours]
Growth
Year
To Maia
To City
Combined
Commuters
Daily*
Rate (pa)
2014
68
35
103
33
226
62%
2013
25
9
34
16
66
-26%
2012
36
10
46
26
81
* See below and
Table 2 for daily calculation.
With the survey being undertaken towards the end of the evening peak period, it is likely to have
included both commuting cyclists heading home and recreational cyclists enjoying a ride along the
harbour. For the recreational cyclists, it is highly likely that they were on round trips, heading out
along the harbour and back again. Although these cyclists will probably have been counted twice,
they will also have probably travelled twice the distance of the commuters making their one way trip
home.
The number of commuter cyclists has been estimated as the difference in the number of cyclists
heading away from the city and the number heading to the city.
Beca // 7 December 2015 // Page 1
3384403 // NZ1-11766941-7 0.7
link to page 2 link to page 1 link to page 1 link to page 1 link to page 2 link to page 1

Technical Note
Table 2 shows the calculation of the daily number of commuter and recreational cyclists, with
recreational cyclists split between those riding on a weekday and those riding on a weekend (or
public holiday) day. The 2014 totals then form the basis of the daily cyclist numbers shown in
Table
1, which use a weighted average based on 245 weekdays and 120 non-weekdays per year. This is
then reduced by 25% to reflect the effects of colder weather during half of the year i.e. during these
colder months, assumed that only half of the daily cycle trips are still made.
Table 2: Calculated Cyclist Numbers by Period and Type
Recreational
Commuters
Recreation - Weekday
- Weekend
Year
AM
PM
Total
Bal
AM
IP
PM
Total
Day
Total
2014
33
33
66
70
35
140
70
245
280
280
2013
16
16
32
18
9
36
18
63
72
72
2012
26
26
52
20
10
40
20
70
80
80
Expansion Factors
0.5
2
1
4
The observed growth rate between 2012 and 2014 reported in
Table 1 is very high at 62% per
annum. This has most likely been influenced by the relatively recent completion of this section of
the cycle way, which has led to a high rate of growth in the short term, which is unsustainable in the
longer term.
To determine a more realistic growth rate, reference has been made to the Census “Main means of
travel to work” data to determine commuter cycling numbers and growth for the four Area Units
along the north side of the harbour out to Port Chalmers. This data is reported in
Table 3.
Table 3: Census Main Means of Travel to Work (Ravensbourne, St Leonards-Blanket Bay,
Sawyers Bay and Port Chalmers)
2001
2006
2013
Cycle
45
45
72
Walk
96
90
72
Other mode to work
1,632
1,782
1,659
Cycle Demand Indicator
2.5%
2.3%
4.0%
Walk Demand Indicator
5.4%
4.7%
4.0%
Cycle growth – 2006 to 2013 (pa)
9%
Walk growth – 2006 to 2013 (pa)
-3%
The Census figures show a 9% per annum increase in commuter cycling numbers between 2006
and 2013. This growth figure has been used in this economic assessment, as it is more sustainable
over a 40 year evaluation period than the 62% from
Table 1.
Sensitivity test assuming a stagnant rate of growth (0% per annum) and lower rates of 2% and 4%
per annum have also been undertaken.
Forecast New Cyclist Demand
Beca // 7 December 2015 // Page 2
3384403 // NZ1-11766941-7 0.7
link to page 3
link to page 4 link to page 4

Technical Note
Economic Analysis
This economic analysis has been undertaken using the SP11 procedures specified in the NZ
Transport Agency’s Economic Evaluation Manual (EEM). It is acknowledged that these procedures
are generally limited to schemes with an undiscounted capital cost of $5M or less, but they are
considered appropriate in this instance to generate a rough order BCR. This can then inform the
decision as to whether the more detailed economic analysis procedures should be used to refine
the BCR generated here.
Costs
Construction Cost Estimates
Base, Expected and 95th Percentile cost estimates have been prepared separately for the Stage 1
and 2 works, and these are summarised in
Table 4.
Table 4: Stage 1 and 2 Cost Estimates ($)
Base
Expected
95th Percentile
Stage 1
4,845,000
5,440,000
7,150,000
Stage 2
11,640,000
14,685,000
17,395,000
Total
16,485,000
20,125,000
24,545,000
Maintenance Costs
Maintenance costs have not been estimated for this project, but have been approximated as 0.25%
per annum of the capital cost estimates (which is probably a bit high but will give a conservative
outcome in this evaluation).
Present Value of Costs
Table 5 reports the present value of construction and maintenance costs for the scheme over a 40
year evaluation period.
Table 5: Present Value of Costs ($M)
Base
Expected
95th Percentile
Construction Costs
15.494
18.920
23.072
Maintenance Costs
0.598
0.740
0.892
Total
16.093
20.028
23.964
The scheme has been assessed against the Expected costs in all cases except for the sensitivity
test around the construction costs.
Benefits
In accordance with the SP11 procedures, the following benefits were calculated for the scheme:
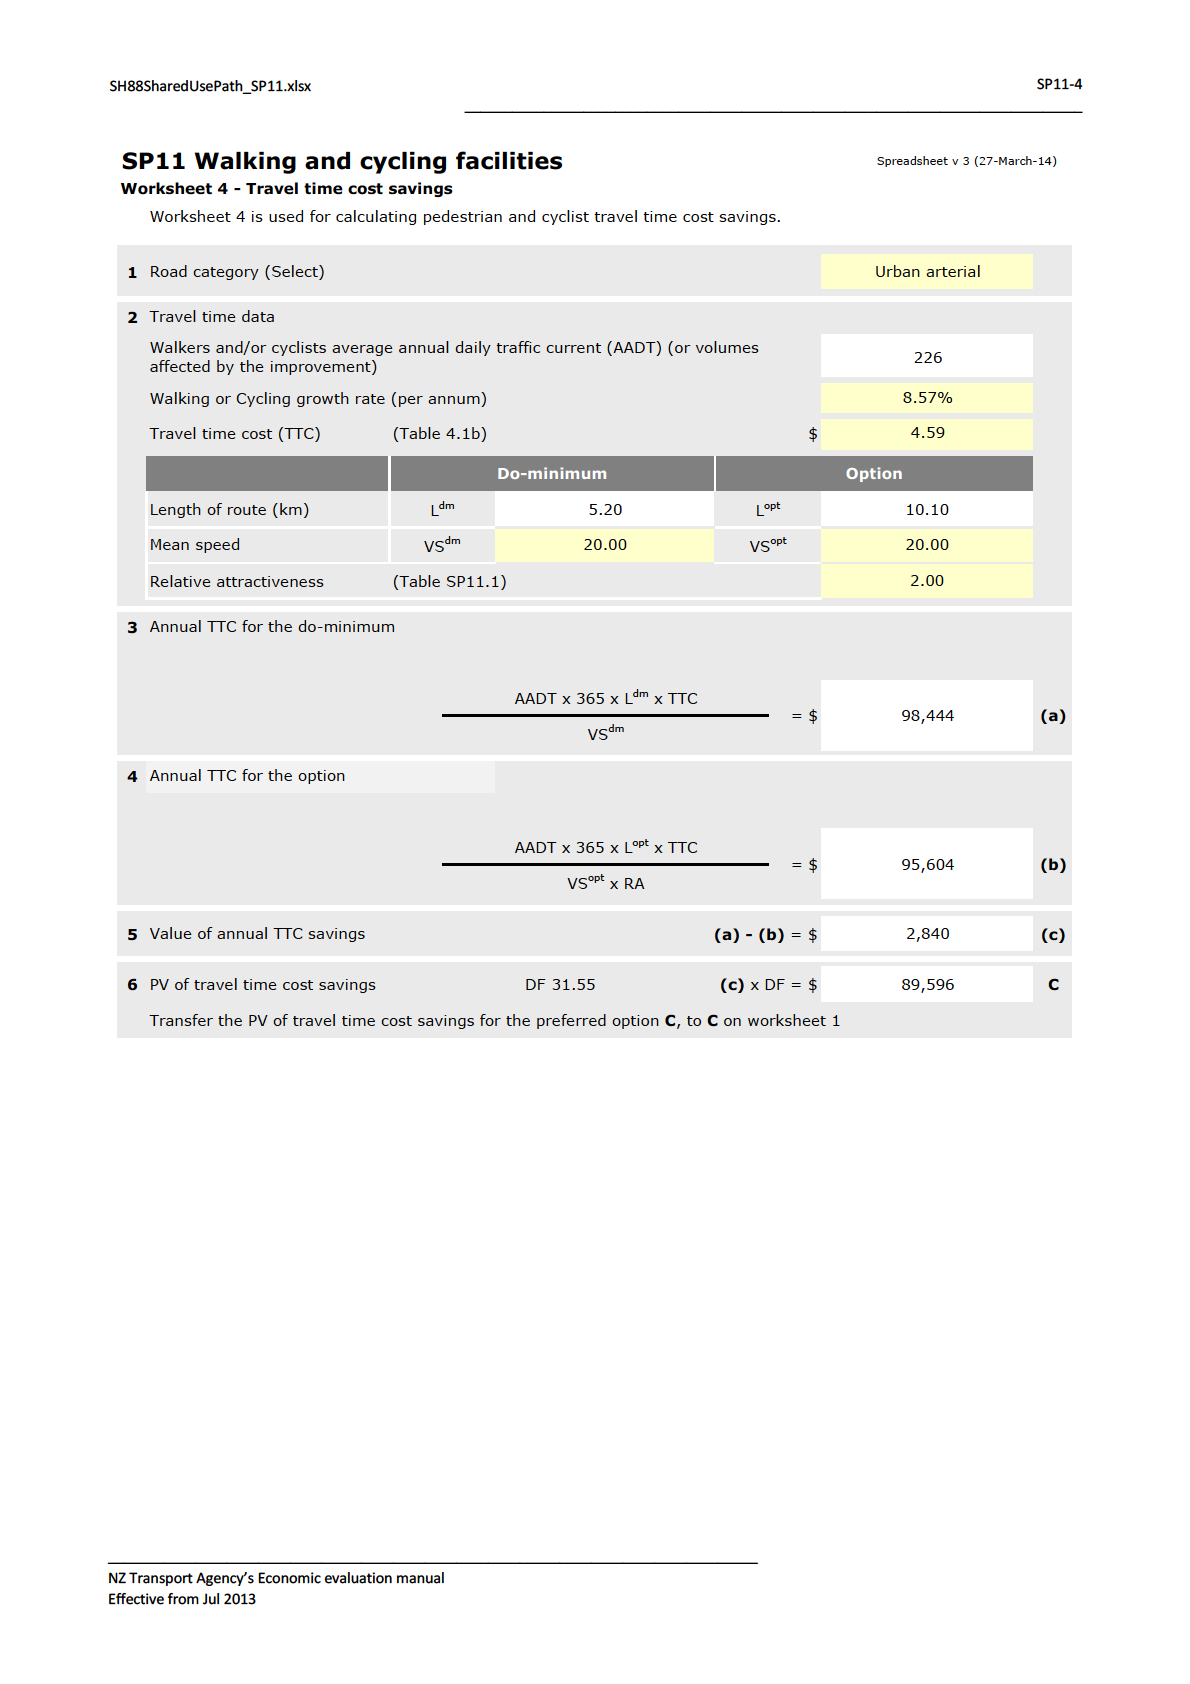
Cyclist travel time cost savings (reported in Worksheet 4 in
Appendix A);
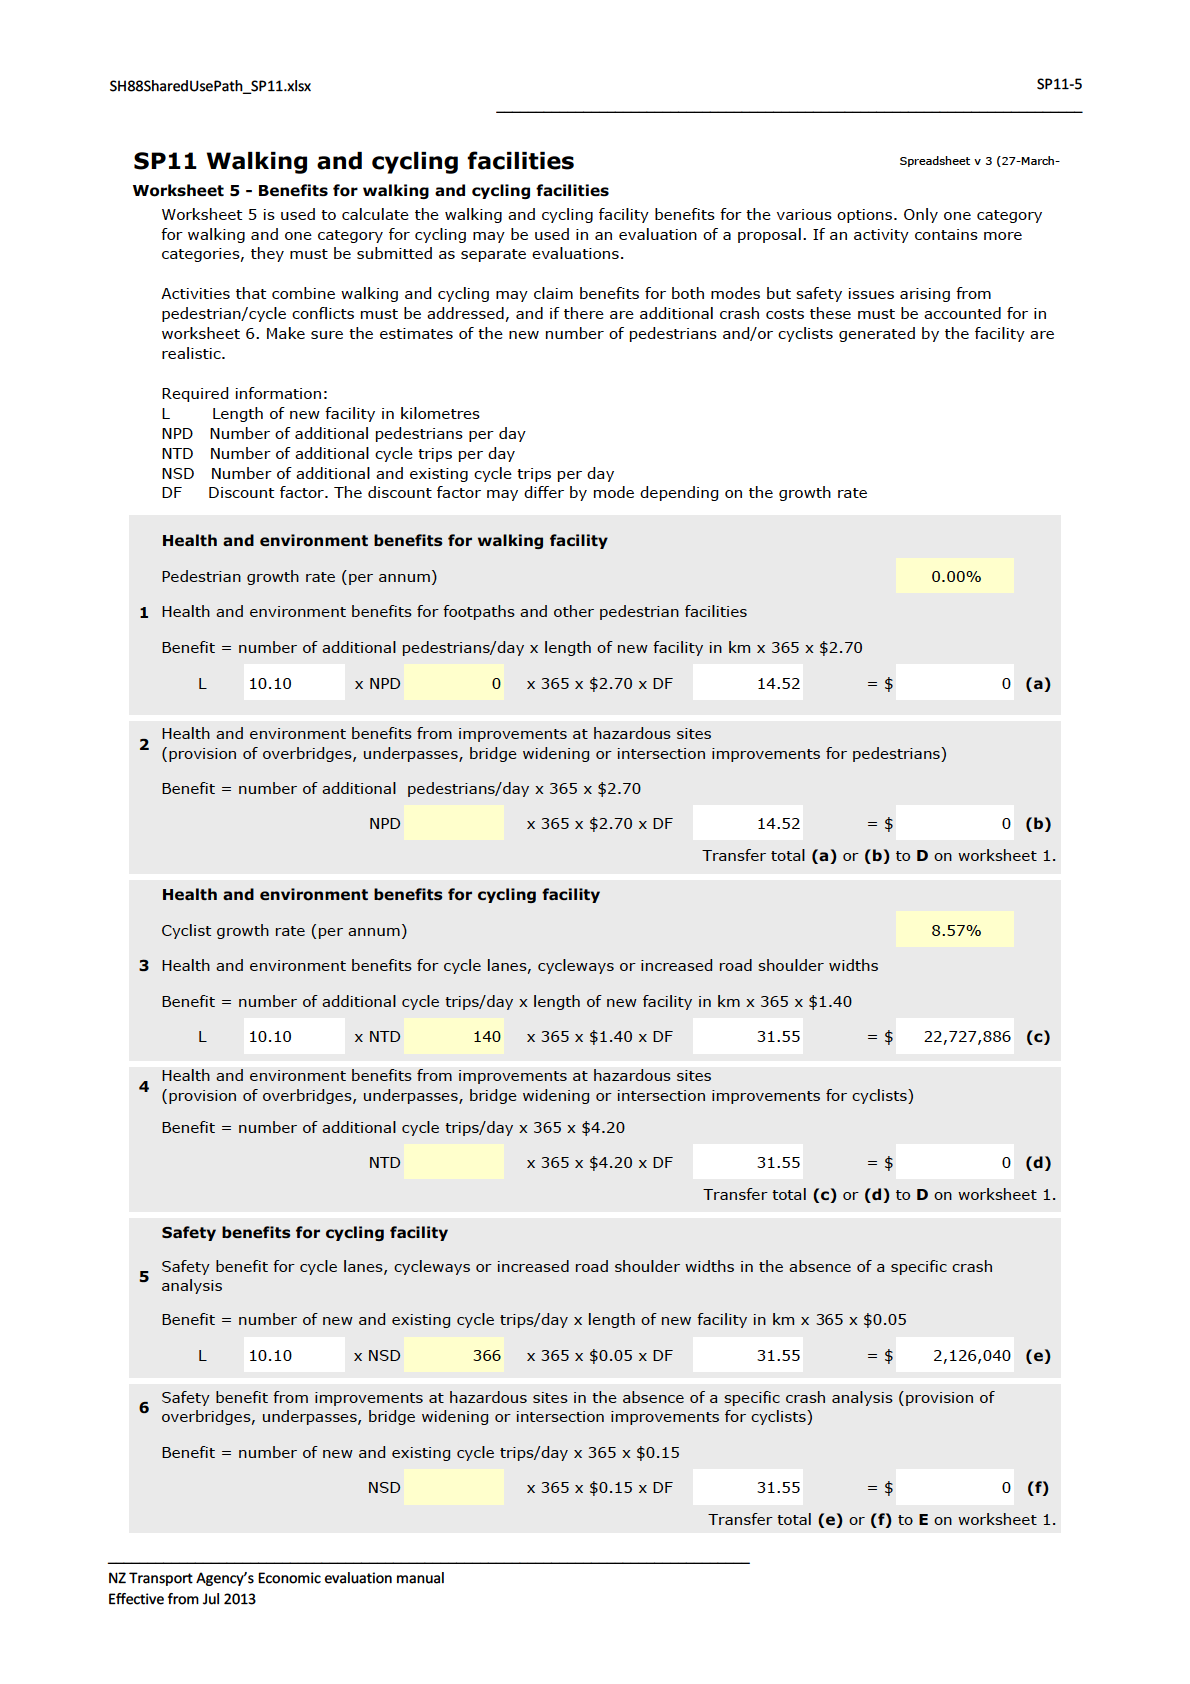
Cyclist health and environmental benefits (reported in Worksheet 5 in
Appendix A);
Beca // 7 December 2015 // Page 4
3384403 // NZ1-11766941-7 0.7
link to page 5 link to page 4 link to page 5

Technical Note
Pedestrian health and environmental benefits (reported in Worksheet 5 in
Appendix A); and
Safety benefits for cycling facility (reported in Worksheet 5 in
Appendix A).
The following key assumptions were made during the calculation of these benefits of the scheme:
Length of existing shared use path – 5.2 km
Length of new shared use path – 4.9 km
Length of finished shared use path – 10.1 km
Number of existing cycle trips/day – 226
Number of additional cycle trips/day – 140
Annual growth rate for cyclists – 8.6%
Number of existing pedestrian trips/day – 52
Number of additional pedestrian trips/day – 0
Annual growth rate for pedestrians – 0%
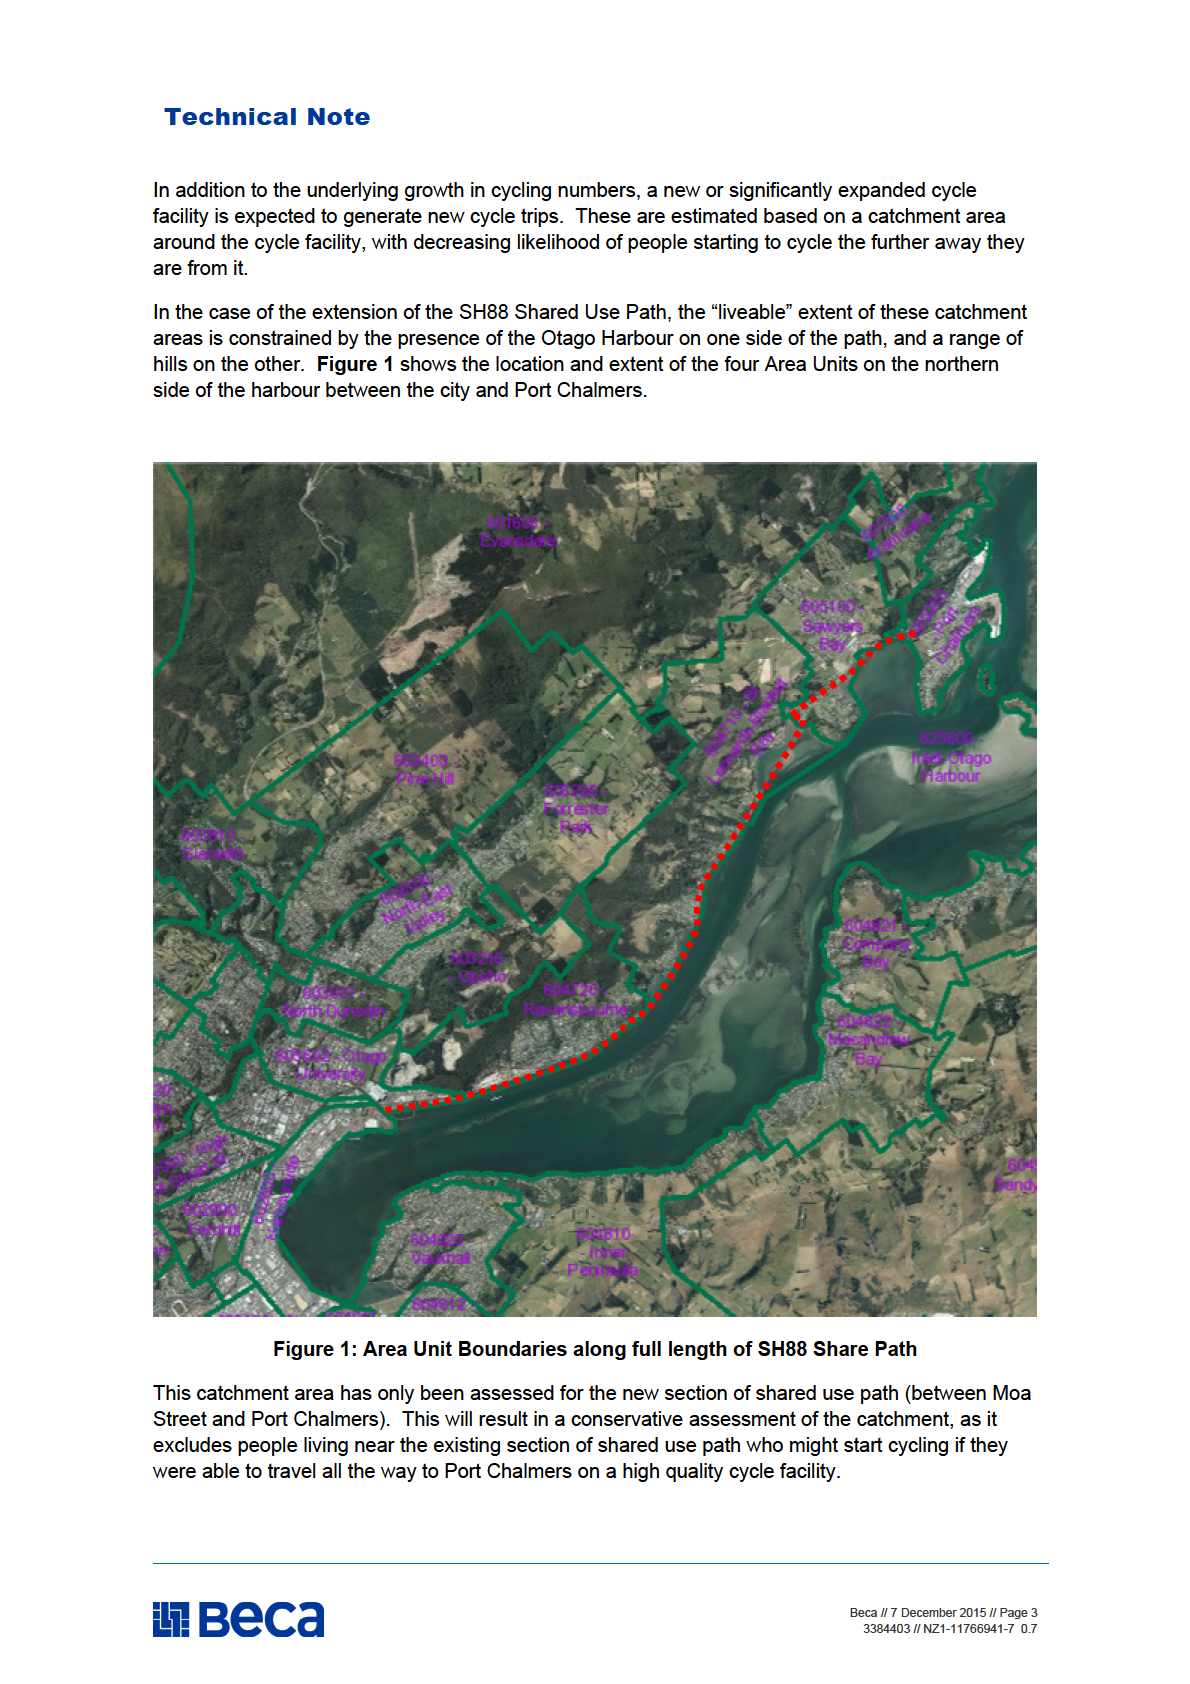
The last two assumptions, relating to pedestrian use of the shared use path, reflects a conservative
view that the extension will primarily be used by cyclists, as the distance of this extension from the
main population base of Dunedin is likely to mean that most pedestrians are unlikely to use this new
section. However, it is probably that some of the people living near the extended section will use it,
although this has not been assessed due to difficulties in estimating the likely numbers.
In addition, it is likely that the shared use path will be used by some of the cruise ship passengers
and crew who disembark in Port Chalmers. This is especially so as this scheme completes the off-
road link all the way into Dunedin. However, an assessment of these benefits has not been made
due to the uncertainties around cruise ship numbers and the number of passengers and/or crew
likely to cycle to/from Dunedin.
The present value of the scheme benefits are reported in
Table 6.
Table 6: Present Value of Scheme Benefits ($M)
Benefit
Benefit Amount
Cyclist travel time cost savings
0.127
Cyclist health and environmental benefits
25.910
Pedestrian health and environmental benefits
0
Safety benefits for cycling facility
2.636
Total
28.673
Scheme BCR
Based on the present value of the Expected costs reported in
Table 5 and the benefits in
Table 6,
the scheme has a BCR of
1.5.
Sensitivity Tests
To test the effect of different assumptions on the outcome of this economic assessment, the
following sensitivity tests have been undertaken:
Base, Expected and 95th Percentile construction costs
Beca // 7 December 2015 // Page 5
3384403 // NZ1-11766941-7 0.7
link to page 6 link to page 6

Technical Note
Different growth rates for cyclists.
Construction Costs
The BCR has been assessed using the Base and 95th Percentile costs, as well as the standard
Expected costs. These results are presented in
Table 7.
Table 7: Present Value of Alternative Costs ($M) and Resultant BCR
Base
Expected
95th Percentile
Total Costs
16.093
19.650
23.964
Total Benefits
28.673
28.673
28.673
BCR
1.8
1.5
1.2
With the assumptions listed earlier, the scheme has a BCR above one for the full range of cost
estimates.
Growth Rates
As discussed earlier, there were two observed growth rates that could have been used for the
annual increase in cyclist numbers. Both of these were higher than the growth rates tabulated in
the EEM, with the surveyed increase between 2012 and 2014 being unrealistically so at 62% per
annum. Even the lower growth rate determined from the Census increase in the number of people
cycling to work between 2006 and 2013 (8.6% per annum) may be unsustainably high over the 40
year evaluation period.
To test the effects on the economic evaluation of lower growth rates, sensitivity tests with cyclist
growth rates of 0%, 2% and 4% per annum have been undertaken, with the outcomes shown in
Table 8.
Table 8: Present Value of Scheme Benefits ($M) and BCR with Different Cyclist Growth Rates
Benefit
8.6%
4%
2%
0%
Cyclist travel time cost savings
0.127
0.906
0.075
0.059
Cyclist health and
25.910
18.451
15.188
11.925
environmental benefits
Pedestrian health and
0
0
0
0
environmental benefits
Safety benefits for cycling
2.636
1.877
1.545
1.213
facility
Total
28.673
20.419
16.808
13.197
BCR
1.5
1.0
0.9
0.7
Under the current assumptions, the scheme requires a cyclist growth rate of approximately 4% per
annum or above to have a BCR of one or more.
Beca // 7 December 2015 // Page 6
3384403 // NZ1-11766941-7 0.7

Technical Note
Summary
These works will extend the existing harbourside off-road shared use path all the way through to
Port Chalmers from Dunedin. With the extension, there is expected to be an increase in the
number of cyclists
Based on an Expected (undiscounted) capital cost of $20.1M, and using the Census 8.6% per
annum growth rate, these works are estimated to have a BCR of
1.5.
Looking at the range of costs, the BCR rises to 1.8 using the Base estimate and falls to 1.2 with the
95 h percentile costs.
Based on the 2013 Census, a cyclist growth rate of 8.6% per annum has been used. The project
retains a BCR above 1.0 for a growth rate above 4% per annum.
Beca // 7 December 2015 // Page 7
3384403 // NZ1-11766941-7 0.7
Appendix A – SP11 Worksheets

SH88SharedUsePath_SP11.xlsx
SP11-3 (1)
____________________________________________________________________________
SP11 Walking and cycling facilities
Spreadsheet v 3 (27-March-14)
Worksheet 3 - Cost of the option(s)
Worksheet 3 is used for calculating the PV cost of the walking or cycling facility.
1 PV of estimated cost of proposed work (as per attached estimate sheet)
$
20,127,477
x
0.94 = $
18,919,828
(a)
2 PV of maintenance in year 1
$
0
(b)
3 PV of annual maintenance costs following the work
(years 2 to 40 inclusive) $
50,300
x
14.52 = $
730,356
(c)
4 PV of periodic maintenance costs
Time zero
1st July in the year
2016
Periodic maintenance will be required in the following years:
Year
Type of maintenance
Amount $
SPPWF
Present Value
Sum of PV of periodic maintenance costs = $
0
(d)
5 PV cost of additional annual maintenance
$
x
14.52 = $
0
(e)
6 PV of total cost of option
PV total costs
(a) +
(b) +
(c) +
(d) +
(e) = $
19,650,184
B
Transfer the PV total cost for the preferred option
B, to
B on worksheet 1
___________________________________________________________________________________
NZ Transport Agency’s Economic evaluation manual
Effective from Jul 2013
SH88SharedUsePath_SP11.xlsx
SP11-3 (2)
____________________________________________________________________________
SP11 Walking and cycling facilities
Spreadsheet v 3 (27-March-14)
Worksheet 3 - Cost of the option(s)
Worksheet 3 is used for calculating the PV cost of the walking or cycling facility.
1 PV of estimated cost of proposed work (as per attached estimate sheet)
$
16,483,485
x
0.94 = $
15,494,476
(a)
2 PV of maintenance in year 1
$
0
(b)
3 PV of annual maintenance costs following the work
(years 2 to 40 inclusive) $
41,200
x
14.52 = $
598,224
(c)
4 PV of periodic maintenance costs
Time zero
1st July in the year
2016
Periodic maintenance will be required in the following years:
Year
Type of maintenance
Amount $
SPPWF
Present Value
Sum of PV of periodic maintenance costs = $
0
(d)
5 PV cost of additional annual maintenance
$
x
14.52 = $
0
(e)
6 PV of total cost of option
PV total costs
(a) +
(b) +
(c) +
(d) +
(e) = $
16,092,700
B
Transfer the PV total cost for the preferred option
B, to
B on worksheet 1
___________________________________________________________________________________
NZ Transport Agency’s Economic evaluation manual
Effective from Jul 2013
SH88SharedUsePath_SP11.xlsx
SP11-3 (3)
____________________________________________________________________________
SP11 Walking and cycling facilities
Spreadsheet v 3 (27-March-14)
Worksheet 3 - Cost of the option(s)
Worksheet 3 is used for calculating the PV cost of the walking or cycling facility.
1 PV of estimated cost of proposed work (as per attached estimate sheet)
$
24,544,653
x
0.94 = $
23,071,974
(a)
2 PV of maintenance in year 1
$
0
(b)
3 PV of annual maintenance costs following the work
(years 2 to 40 inclusive) $
61,400
x
14.52 = $
891,528
(c)
4 PV of periodic maintenance costs
Time zero
1st July in the year
2016
Periodic maintenance will be required in the following years:
Year
Type of maintenance
Amount $
SPPWF
Present Value
Sum of PV of periodic maintenance costs = $
0
(d)
5 PV cost of additional annual maintenance
$
x
14.52 = $
0
(e)
6 PV of total cost of option
PV total costs
(a) +
(b) +
(c) +
(d) +
(e) = $
23,963,502
B
Transfer the PV total cost for the preferred option
B, to
B on worksheet 1
___________________________________________________________________________________
NZ Transport Agency’s Economic evaluation manual
Effective from Jul 2013
SH88SharedUsePath_SP11.xlsx
SP11-7
_______________________________________________________________________________
SP11 Walking and cycling facilities
Spreadsheet v 3 (27-March-14)
Worksheet 7 – Cycle demand
This worksheet is used to calculate cycle demand for a new cycle facility. The new commuters section of the worksheet
calculates the total new daily cyclist commuters. The new other section calculates the total daily new other cyclists.
Finally the overall new cyclists is devised.
New and Existing cyclists
Buffers (km)
<0.4
0.4 to <0.8
0.8 to ≤ 1.6
1
Area (km2)
1.81
2.13
5.04
2
Density per square kilometre
1,153.37
819.88
236.71
3
Population in each buffer
(3) =
(1) x
(2)
2,082.39
1,748.04
1,193.74
4
Total population in all buffers (Sum of
(3))
5,024.16
5
Commute share (single value for all)
3.99%
6
Likelihood of new cyclist multiplier
1.04
0.54
0.21
7
Row
(7) =
(3) x
(6)
2,165.69
943.94
250.68
8
Sum of row
(7)
3,360.31
9
Cyclist rate
(9) = (
(5) x 0.96) + 0.32%
4.15%
10 Total existing daily cyclists
(10) =
(4) x
(9)
208.68
11 Total new daily cyclists
(11) =
(8) x
(9)
139.57
_________________________________________________________________________________
NZ Transport Agency’s Economic evaluation manual
Effective from Jul 2013
SH88SharedUsePath_SP11.xlsx
SP11-8
________________________________________________________________________________
SP11 Walking and cycling facilities
Spreadsheet v 3 (27-March-1 )
Worksheet 8 - BCR and incremental analysis
Time zero
1 July
2016
Base date
1 July
2015
Do-
BCR calculations
Option A
Option B
Option C
Option D
minimum
Benefits
PV Travel time cost savings
127,226
127,226
127,226
PV Health and environment
25,909,790
25,909,790
25,909,790
PV Crash cost savings
2,636,289
2,636,289
2,636,289
PV total benefits
0
28,673,305
28,673,305
28,673,305
0
Costs
PV Capital costs (do-min)
18,919,828
15,494,476
23,071,974
PV Maintenance costs
730,356
598,224
891,528
PV total costs
0
19,650,184
16,092,700
23,963,502
0
BCRN
1.46
1.78
1.20
0.00
Target incremental BCR (from appendix A12.4)
Base option for comparison
Next higher cost option
Incremental analysis
Incremental
Incremental
Incremental
Total costs
Total benefits
Total costs
Total Benefits
costs
benefits
BCR
Option
Option
N
(1)
(2)
(3)
(4)
(5)=(3)-(1) (6)=(4)-(2) (7)=(6)/
(5)
0
0
0.00
0
0
0.00
0
0
0.00
0
0
0.00
____________________________________________________________________________
NZ Transport Agency’s Economic evaluation manual
Effective from Jul 2013