Horotiu Cycle Bridge
Benefit Cost Analysis
16-05-2017
Revision F
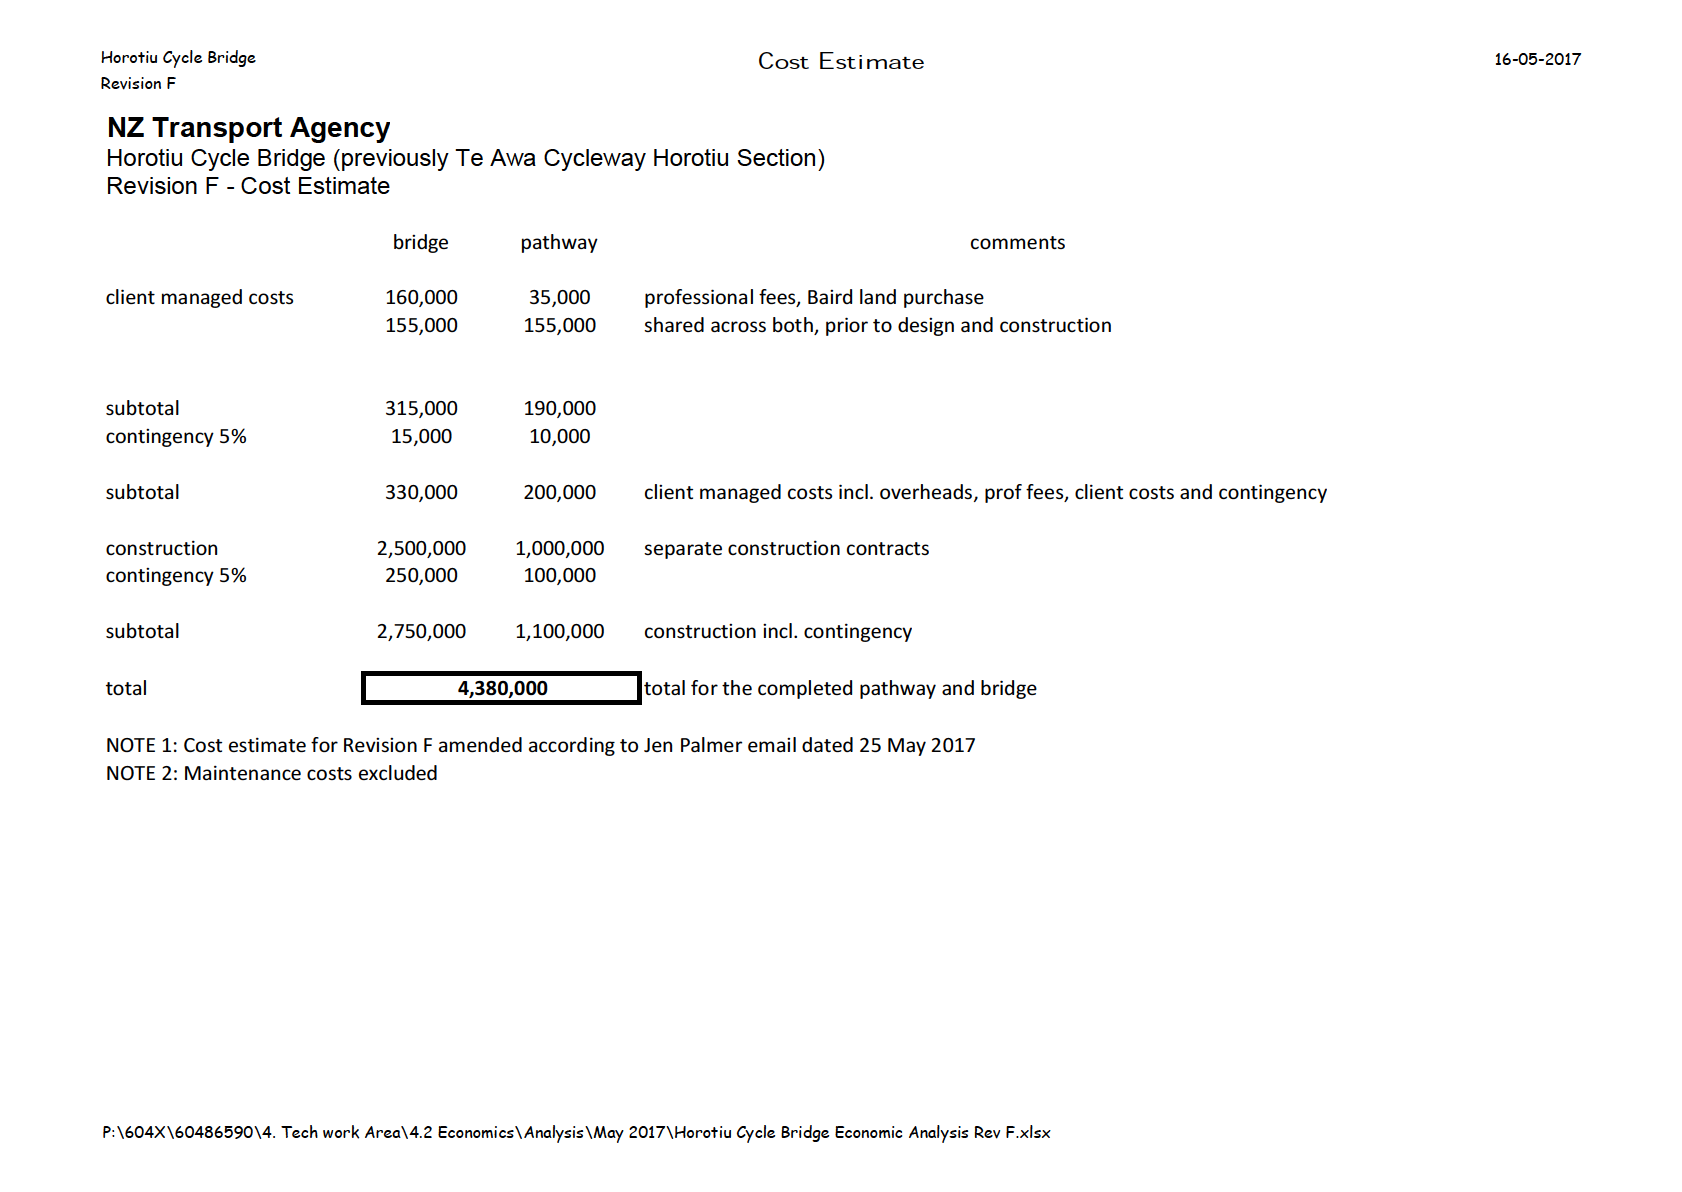
NZ Transport Agency
Horotiu Cycle Bridge (previously Te Awa Cycleway Horotiu Section)
Revision F - Benefit Cost Analysis
amount
benefit source
DF
UF
NPV
assumptions
($)
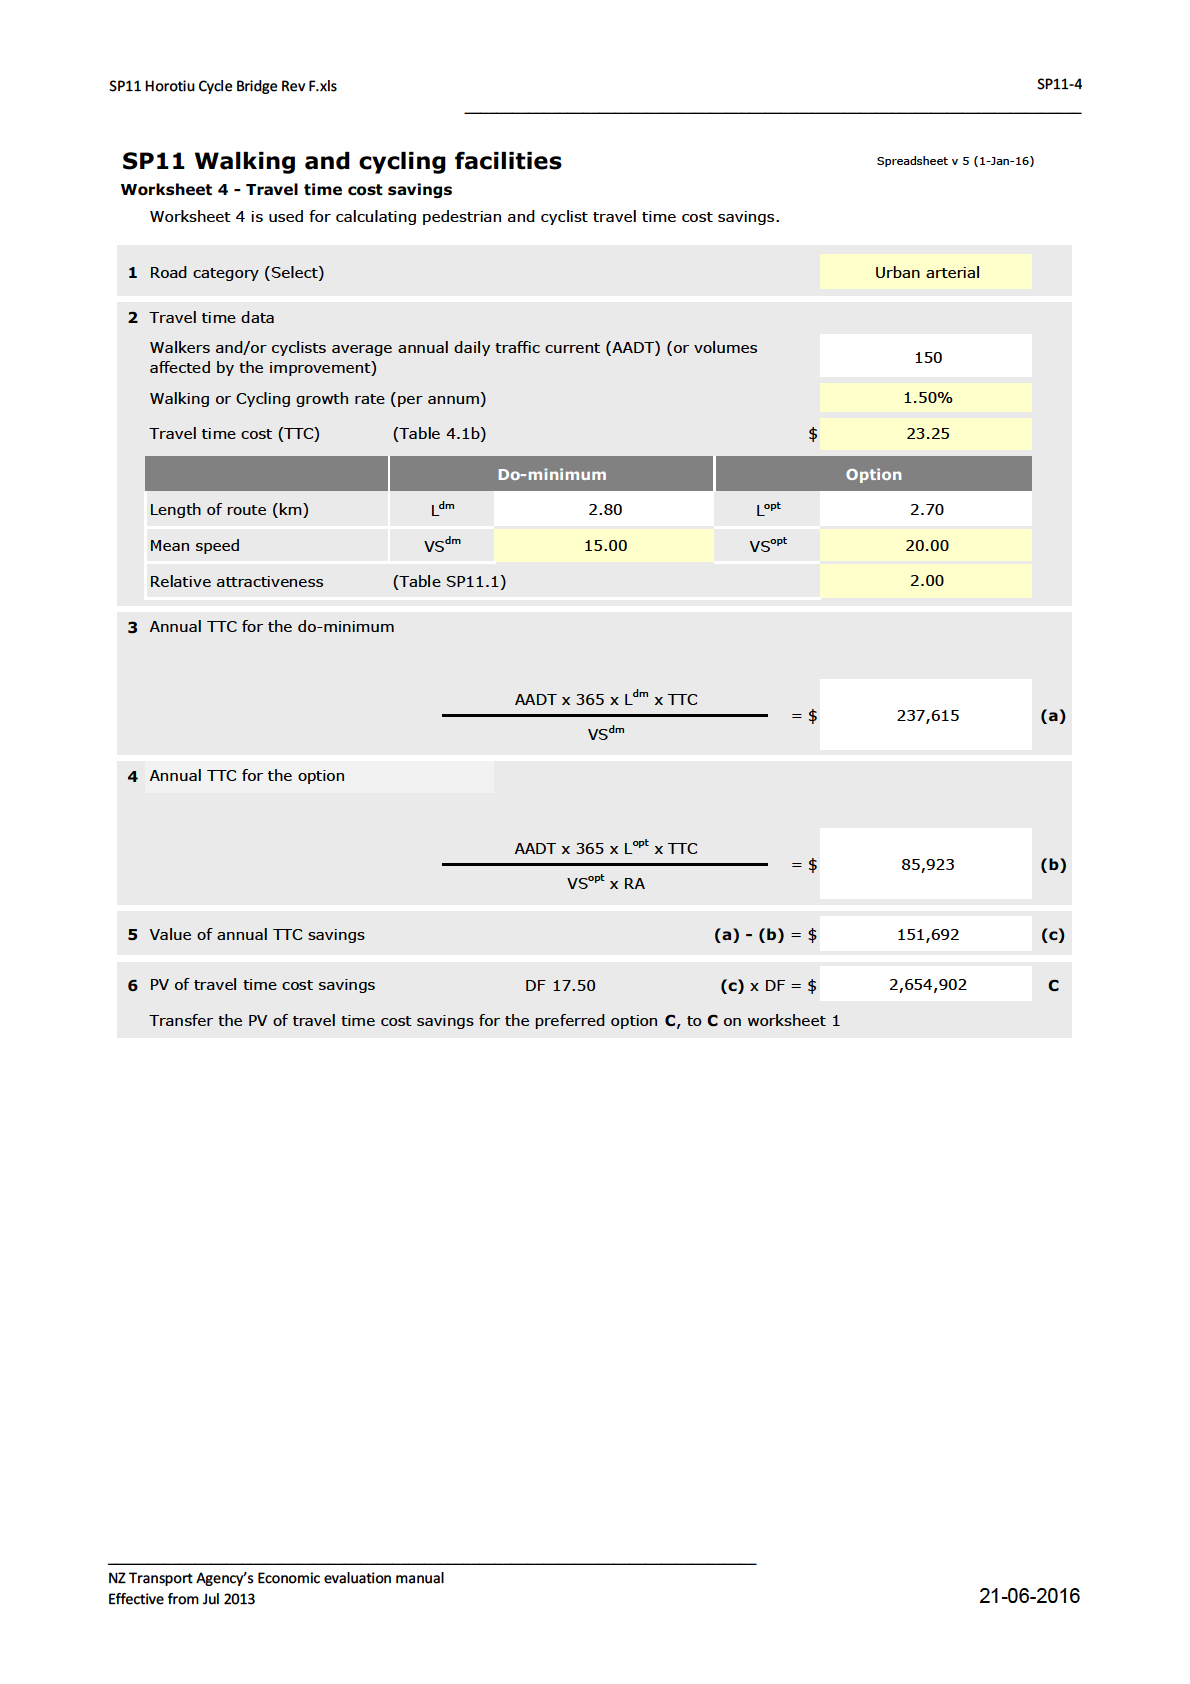
travel time
151,692
17.50
1.45
3,849,185 affected 150 existing cyclists per day riding 5kph faster
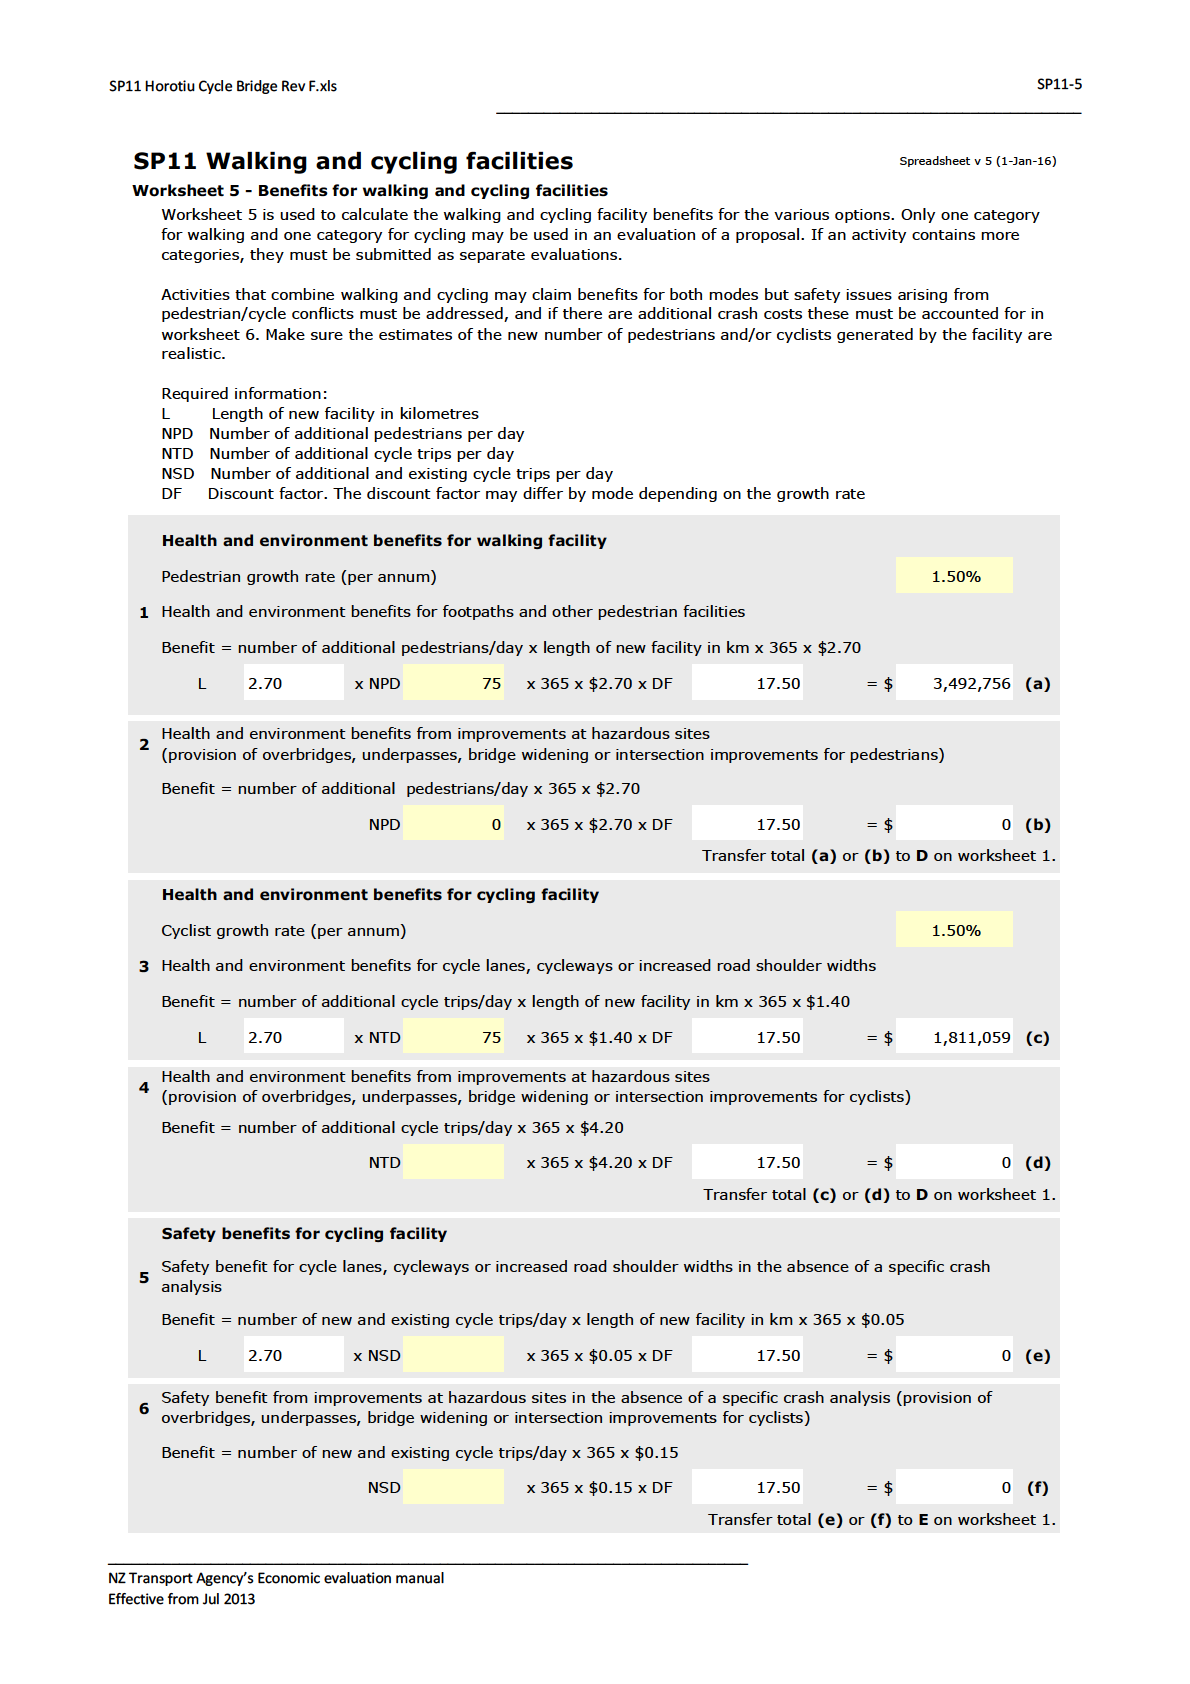
health & environmental peds
199,564
17.50
1.17
4,086,068 75 new peds per day
health & environmental cyclists
103,478
17.50
1.17
2,118,702 75 new cyclists per day
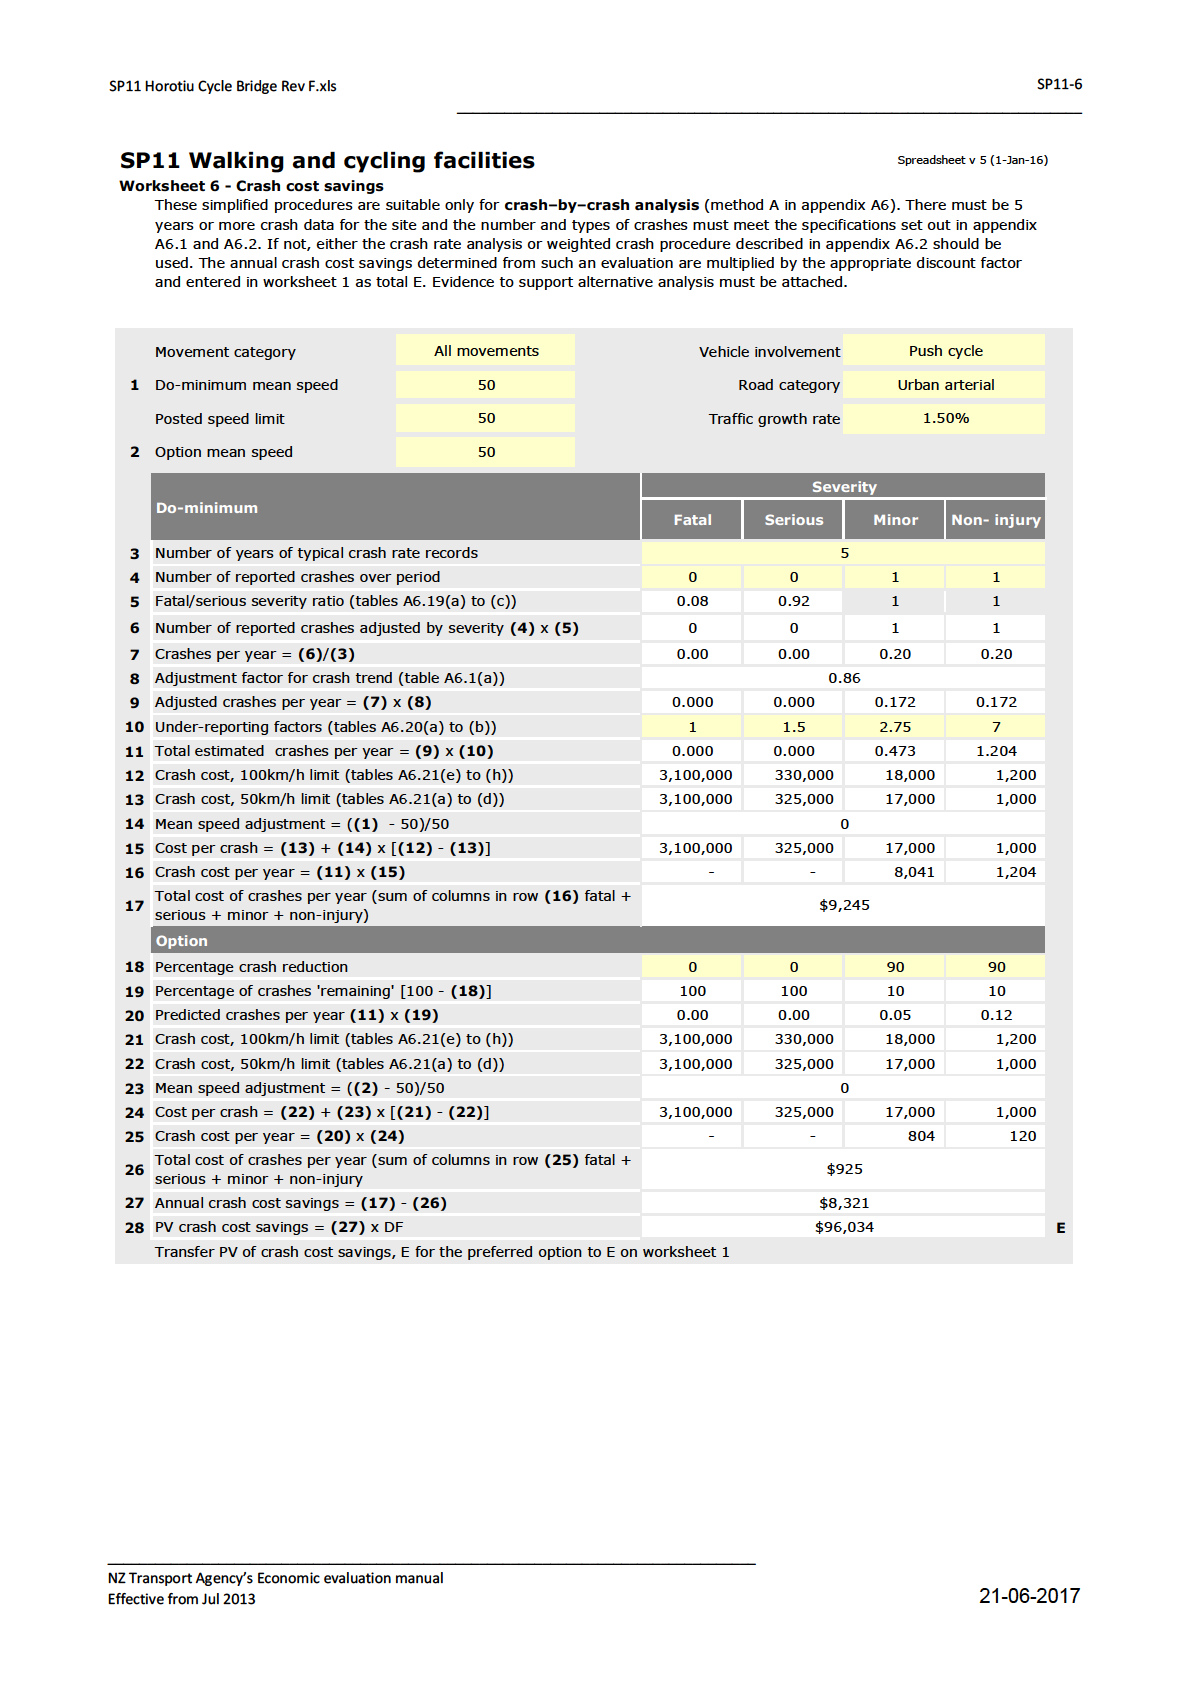
accident reduction
8,321
11.54
1.03
98,920
1 minor injury and one non-injury, both reduced by 90%
tourist spending
1,199,025
17.50
1.00
20,982,938 10% of 93 daily cyclists are tourists spending $146 each
Total benefits
31,135,811
option cost (capital & maintenance)
4,380,000
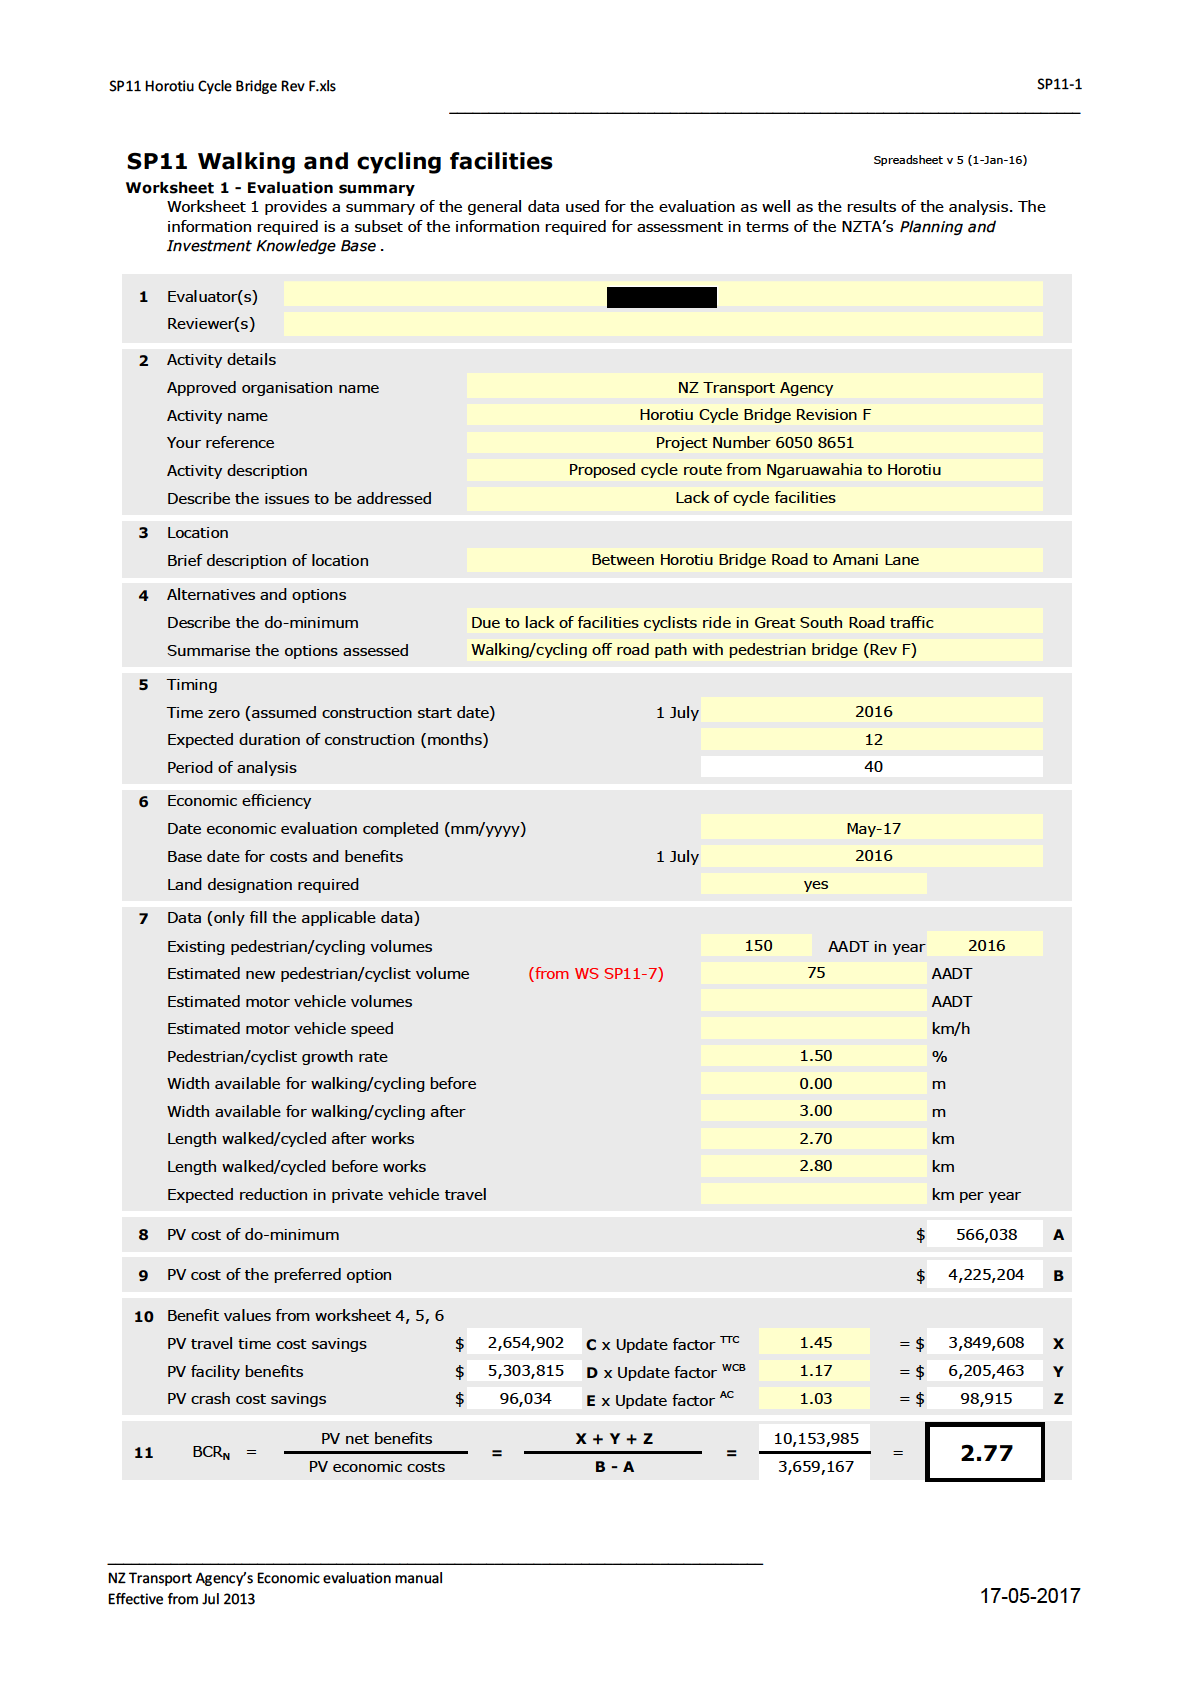
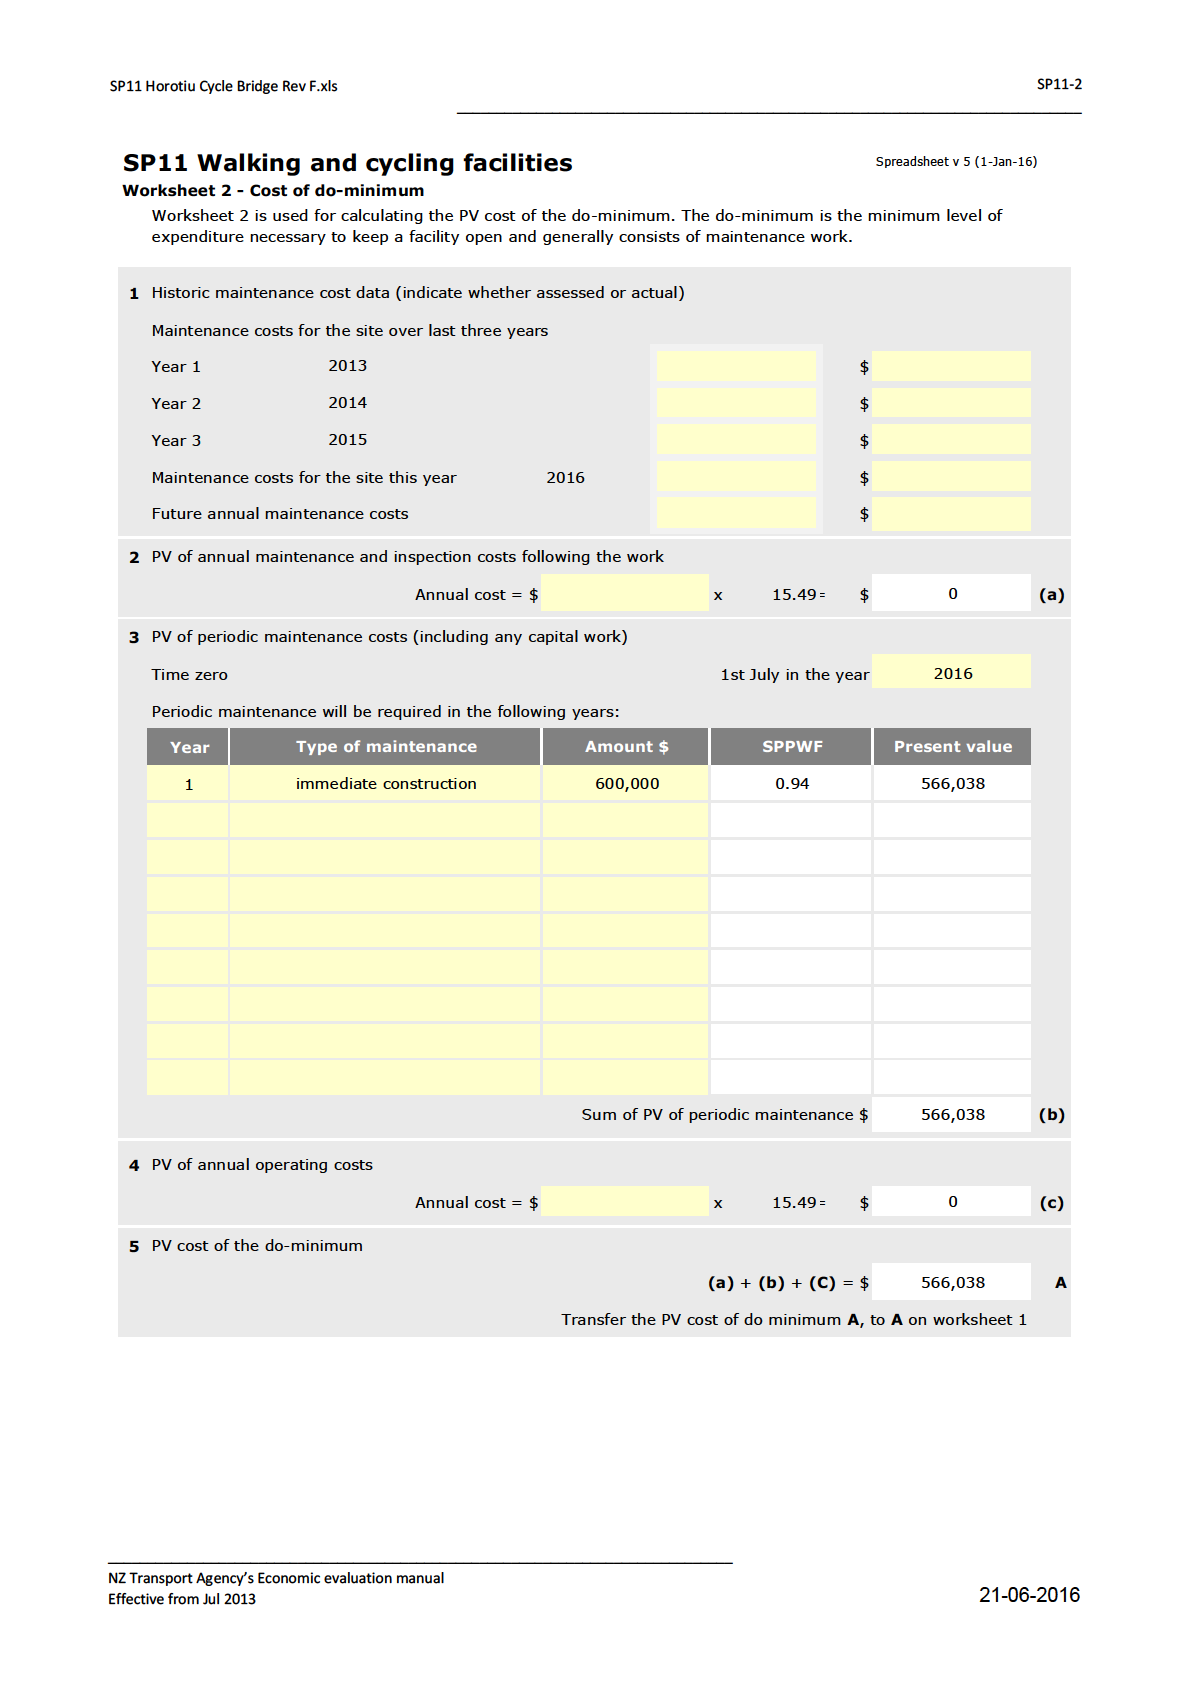
Do Minimum cost
566,038
Total costs
3,813,962
BCR
8.2
NOTE 1: Analysis (except for tourist spending) done in SP11 (figures shown in
bold)
NOTE 2: Tourist spending based on the avarage for other trails, assumed that 10% of the daily cyclists are tourists.
existing cyclists on the route
150
new cyclists
75
existing walkers on the route
150
new walkers
75
new route length (km)
2.7
cycling benefit ($/cycle-km)
1.40
SP11 value
walking benefit ($/ped-km)
2.70
SP11 value
days/year
365
assumed proportion of tourists
10%
average tourist spending ($)
146
annual growth rate
1.5%
P:\604X\60486590\4. Tech work Area\4.2 Economics\Analysis\May 2017\Horotiu Cycle Bridge Economic Analysis Rev F.xlsx
Horotiu Cycle Bridge
Sensitivity
16-05-2017
Revision F
NZ Transport Agency
Horotiu Cycle Bridge (previously Te Awa Cycleway Horotiu Section)
Revision E - Sensitivity Analysis
BCR
8.2
base case
lower bound
upper bound
variable
value
value
BCR
value
BCR
capital cost
3,813,962
-20%
9.8
20%
6.5
new cyclists/pedestrians
75
50
7.6
100
8.7
new cycling speed
20
15
8.0
25
8.3
tourist spending
20,982,938
-20%
7.1
20%
9.3
discount rate
6%
4%
10.8
8%
6.4
P:\604X\60486590\4. Tech work Area\4.2 Economics\Analysis\May 2017\Horotiu Cycle Bridge Economic Analysis Rev F.xlsx
SP11 Horotiu Cycle Bridge Rev F.xls
SP11-3 (1)
________________________________________________________________________________
SP11 Walking and cycling facilities
Spreadsheet v 5 (1-Jan-16)
Worksheet 3 - Cost of the option(s)
Worksheet 3 is used for calculating the PV cost of the walking or cycling facility.
1 PV of estimated cost of proposed work (as per attached estimate sheet)
$
4,380,000
x
0.94 =
$
4,117,200
2 PV of maintenance in year 1
$
5,000
3 PV of annual maintenance costs following the work
(years 2 to 40 inclusive) $
5,000
x
14.52 =
$
72,600
4 PV of periodic maintenance costs
Time zero
1st July in the year
2016
Periodic maintenance will be required in the following years:
Year
Type of maintenance
Amount $
SPPWF
Present Value
8
general
20,000
0.63
12,548
16
general
20,000
0.39
7,873
24
general
20,000
0.25
4,940
32
general
20,000
0.15
3,099
40
general
20,000
0.10
1,944
Sum of PV of periodic maintenance costs = $
30,404
5 PV cost of additional annual maintenance
$
x
14.52 =
$
0
6 PV of total cost of option
PV total costs
(a) +
(b) +
(c) +
(d) +
(e) = $
4,225,204
Transfer the PV total cost for the preferred option
B, to
B on worksheet 1
___________________________________________________________________________________
NZ Transport Agency’s Economic evaluation manual
Effective from Jul 2013
17-05-2017
SP11 Horotiu Cycle Bridge Rev F xls
W1 - Summary_Upload
Worksheet 1 - Evaluation Summary and TIO Upload
Upload V1.0 (1Oct13)
This spreadsheet can be automatically uploaded into Transport Investment Online. To enable automatic upload please do not adjust the columns or rows.
Activity name
Horotiu Cycle Bridge Revision F
Reference
Project Number 6050 8651
Evaluator(s) - name, organisation
Reviewer(s) - name, organisation
0
Date of evaluation
mm/yyyy
05-2017
Time zero / implementation start date
1 July yyyy
2016
Construction duration
Months
12
Base date of costs and benefits
1 July yyyy
2016
Location
Between Horotiu Bridge Road to Amani Lane
Problem definition
Lack of cycle facilities
Do minimum description
Due to lack of facilities cyclists ride in Great South Road traffic
Alternatives considered (or page references to relevant)
Options considered (or page references to relevant)
Walking/cycling off road path with pedestrian bridge (Rev F)
Preferred option description
Proposed cycle route from Ngaruawahia to Horotiu
Statistics
Base rate
Growth rate (%)
New users/transfer
Road traffic - Annual Average Daily Traffic (AADT)
AADT
0
0.00
Pedestrians - Annual Average Daily
Count
150
0.02
75
Cyclists - Annual Average Daily
Count
150
0.02
75
Annual Patronage - Total
Count
0
0.00
0
Annual Patronage - Peak Period
Count
0
0.00
Freight volume
tonnes
0
0.00
0
Heavy Vehicles Volume
AADT
0
0.00
Heavy Vehicles Volume
%
0.00
Road Category
Urban arterial
Before
After
Roughness
IRI/NAASRA
0
0
Posted speed
km/h
50
0
Average traffic speed
km/h
50
50
Length of road / route
km
2.80
2.70
Road width
metres
0.00
0.00
Travel time on route
minutes
0
0
Period start am
Period stop am
Period start pm
Period stop pm
Peak Period
Peak Period Traffic flow
Vehicles/hr
0
Period of crash analysis
yyyy - yyyy
Fatal
Serious
Minor
Non Injury
Recorded crashes in period (row 4 crash analysis)
0.0
0.0
1.0
1.0
Total estimated crashes per year - do minimum (row 11)
0.0
0.0
0.5
1.2
Predicted crashes per year - preferred option (row 20)
0.0
0.0
0.0
0.1
Heavy Vehicle Trips Saved (average per year)
count
0
Vehicle Operating Cost Savings (per annum)
$/vehicle
0
Travel time savings (per day)
minutes
0
Costs
Do minimum
Preferred option
Construction / implementation
$
0
4 380 000
Present Value Construction / implementation
$
0
4,117,200
Present Value Maintenance, renewal and operating costs
$
0
108,004
Present Value Total costs (whole of life)
$
566,038
4,225,204
Present Value Cost savings
$
0
Present Value Funding assistance
$
0
Benefits (Present Value)
Travel time cost savings
$
3 849 608
Vehicle operating cost savings
$
0
Crash cost savings
$
98,915
Seal extension benefits
$
0
Driver frustration reduction benefits
$
0
Risk reduction benefits
$
0
Vehicle emission reduction benefits
$
0
Other external benefits (noise, visual, impact etc)
$
0
Mode change benefits
$
0
Walking and cycling health benefits
$
0
Service or facility user benefits
$
6 205 463
Parking user cost savings
$
0
Dis-benefits during implementation/construction
$
0
Road Traffic reduction benefits
$
0
National strategic benefits
$
0
Agglomeration benefits (WEB)
$
0
Increased Labour Supply (WEB)
$
0
Imperfect Competition (WEB)
$
0
Total Benefits Present Value
$
10153985.17
Non monetised benefits or national strategic factors
Benefit Cost Ratio (BCRn) National
2.77
Benefit Cost Ratio (BCRg) Government
0.00
First Year Rate of Return (FYRR)
0.13
Sensitivity Analysis - BCR range
0.00
0.00