Opus International
Consultants Ltd
Auckland Civil
The Westhaven, 100 Beaumont St
PO Box 5848, Auckland 1141
New Zealand
t: +64 9 355 9500
f: +64 9 355 9585
TO
w: www.opus.co.nz
COPY
FROM
DATE
18th June 2013
FILE
1-c0821.00
SUBJECT
Manukau Rail Crossing Cycle Routes Economics
Update
Opus is currently working on project feasibility assessments of three proposed cycle routes in
the Manukau area. The advice used as the basis for the draft project feasibility report (PFR)
was that a Benefit Cost Ratio (BCR) of 1 or more would be sufficient to secure funding for
further investigation of these projects. However recent advice has been that achieving an
Economic Efficiency of “Medium” (a BCR of 2 or more) is required to secure funding for
these projects. It has also been highlighted that the actual costs of the bridge component of
the three routes is higher than the 2010 estimate assumed in the draft PFR.
This information has necessitated a revised approach to both the costs and benefits claimed
on this project. This memo provides an outline of the approach taken in the draft PFR and
also the new economic analysis that now takes into account the revised assumptions for this
project.
In addition to the Value Engineering and revised Economic Evaluation a scheme Risk
Register has been included in Appendix B.
1.1 Background
In 2010 three rail bridges located on the cycle routes being studied were rebuilt by KiwiRail
to provide sufficient height clearance for the Auckland Electrification Project (AEP). At this
time Opus prepared a funding application for Manukau City Council (MCC) to provide
enhanced cycle facilities on the bridges to encourage an increase in cycling in the area.
The three rail bridges have subsequently been constructed, with the enhanced cycle lanes
provided. In order to capitalise on the enhanced cycle lanes on the rail crossings, the
extension of the cycle route facilities has been assessed at a project feasibility level. The three
routes are as follows:
• Route 1 consists of Station Road and St George Street between Portage Road and
Kolmar Road in the Papatoetoe area.
• Route 2 includes Browns Road between Roscommon Road and Great South Road.
• Route 3 includes Weymouth Road, Selwyn Road, Station Road between Selwyn Road
and Great South Road, and Alfriston Road between Sykes Road and Great South
Road.
1.2 Initial Approach
The first iteration of the reporting was undertaken on the assumption that funding for these
schemes had already been allocated at the time the bridge components were constructed. As
such it was assumed that achieving a BCR of 1 would be sufficient for each route to trigger
funding approval for the next stage of works.
This assumption had significant influence on the approach taken to date. Firstly, the
approach to benefits was kept consistent with the 2010 Funding Report with no further
benefit streams or changes to the key assumptions being sought. Secondly, under the
understanding that funding approval was only reliant on achieving a BCR of 1 or more a
higher level of service (LOS) was sought than may have been the case if stricter value for
money criteria was in place. For example both on road cycle lanes and off road cycle path
facilities were recommended in high trip generating land- uses (e.g. schools).
The outcomes of this initial approach were that all three routes had BCRs of over 1 as shown
in the following table.
Table 1: Route BCR’s from Original Approach
Route
PV of
Benefit
PV of Cost
BCR
Route 1 Preferred Option
$2,009,886
$1,098,375
1.83
Route 2 Preferred Option
$3,550,537
$1,624,223
2.19
Route 3 Preferred Option
$6,850,051
$1,685,102
4.07
1.3 Revised Approach
In late April, the Auckland Transport and Opus project teams were advised that BCR’s of 2 or
more would be required to secure funding and progress to the next stage of investigation. It
was also identified that the cost for the construction of the bridge component of the projects
was significantly higher than the 2010 estimate which had been used to inform the
assumptions in the draft PFR, as a result the BCR’s reported to date were under reporting the
expected total costs of the projects.
The benefits assumed in the draft PFR were limited to the following:
• Health and Environmental Benefits for Cycling Facility, and
• Safety Benefits.
Working with the updated value for money criteria and updated actual costs for the bridge
construction, and considering approaches used on other recent cycling projects our revised
economic analysis has also included benefits for:
• Travel Time Benefits, and
• Health and Environmental Benefits for Walking (Route 1 only).
It has also been necessary in some locations to revisit the desired LOS of the route and
remove or amend discrete elements of the cycling infrastructure. This has mainly been
limited to the removal of off road shared path where an alternative on road cycle lane can be
provided.
Page 2
1.4 Benefits
The revised economic evaluation incorporates a wider range of benefits and practices than
was proposed in the draft PFR. The following benefits have been considered for the
economic evaluation and the relevant update factors have been used to reflect latest changes
in NZTA’s Economic Evaluation Manual. Detailed information for procedures undertaken
within the economic evaluation methodology is included in Appendix A for reference.
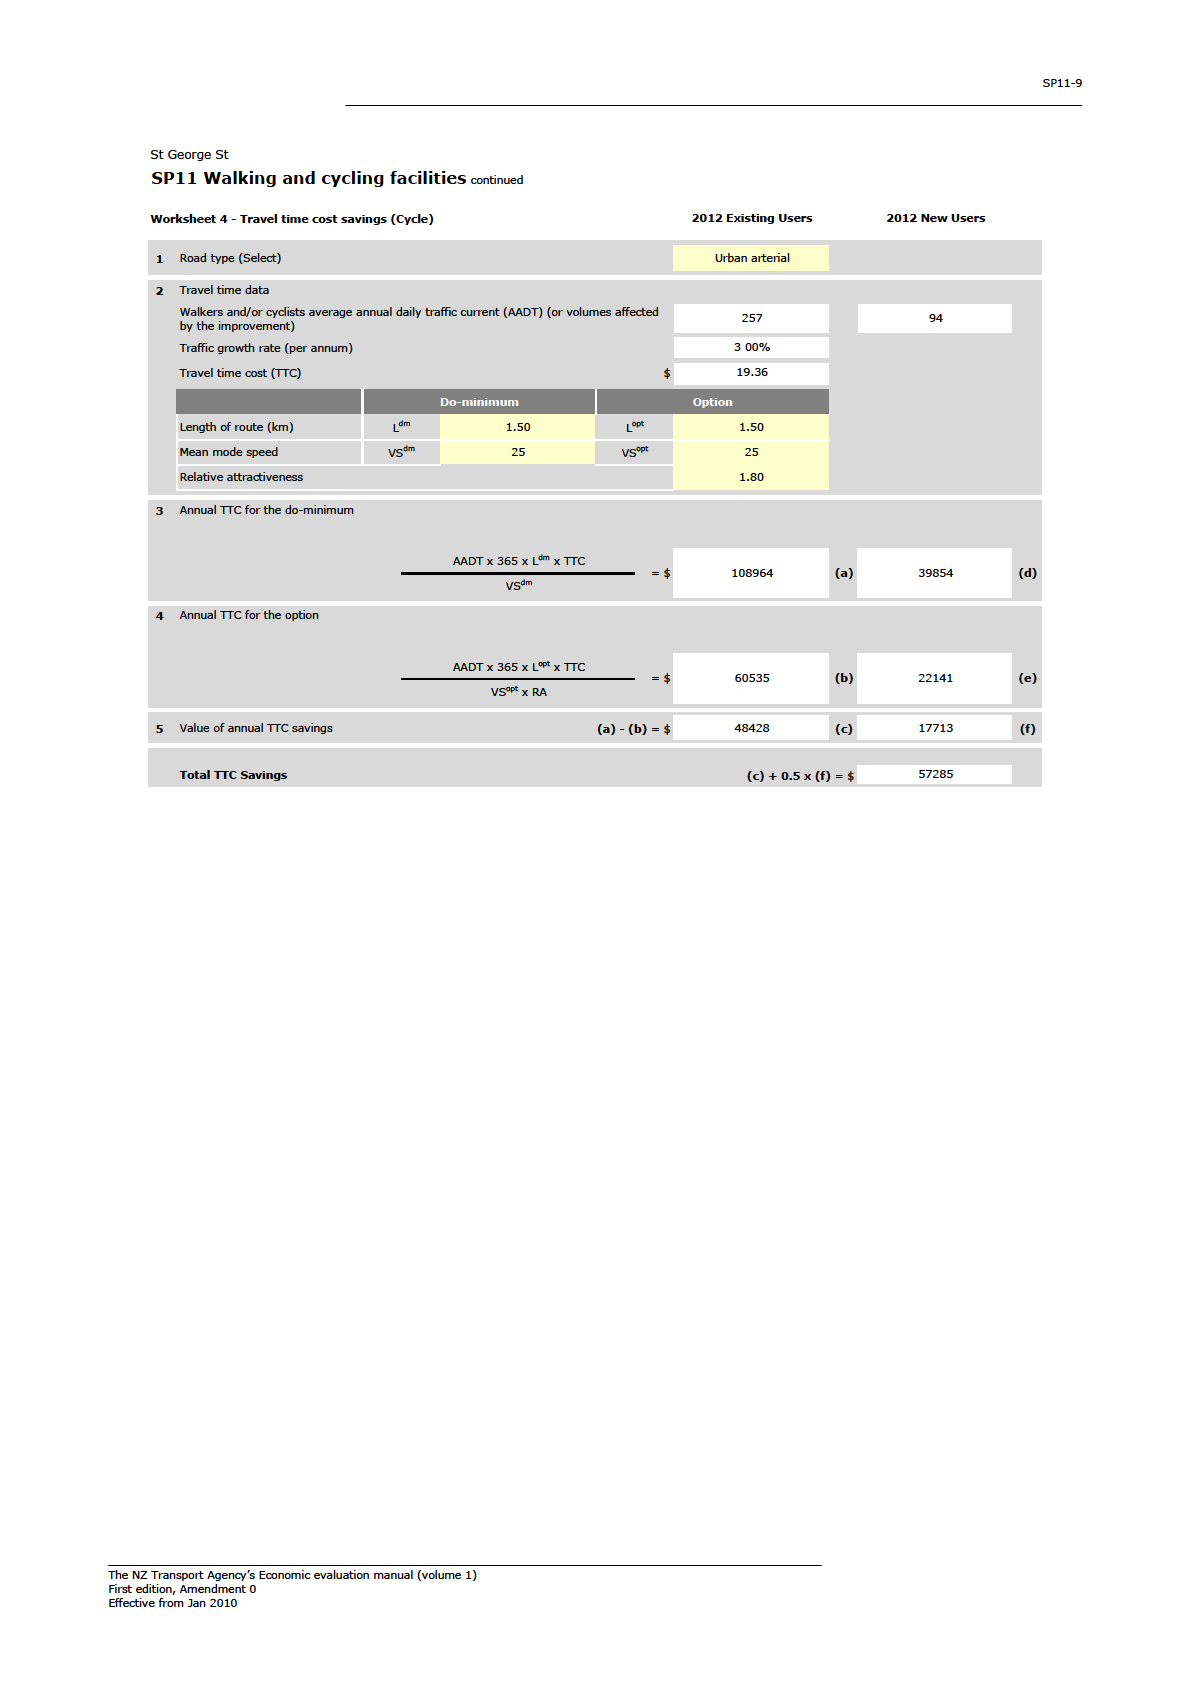
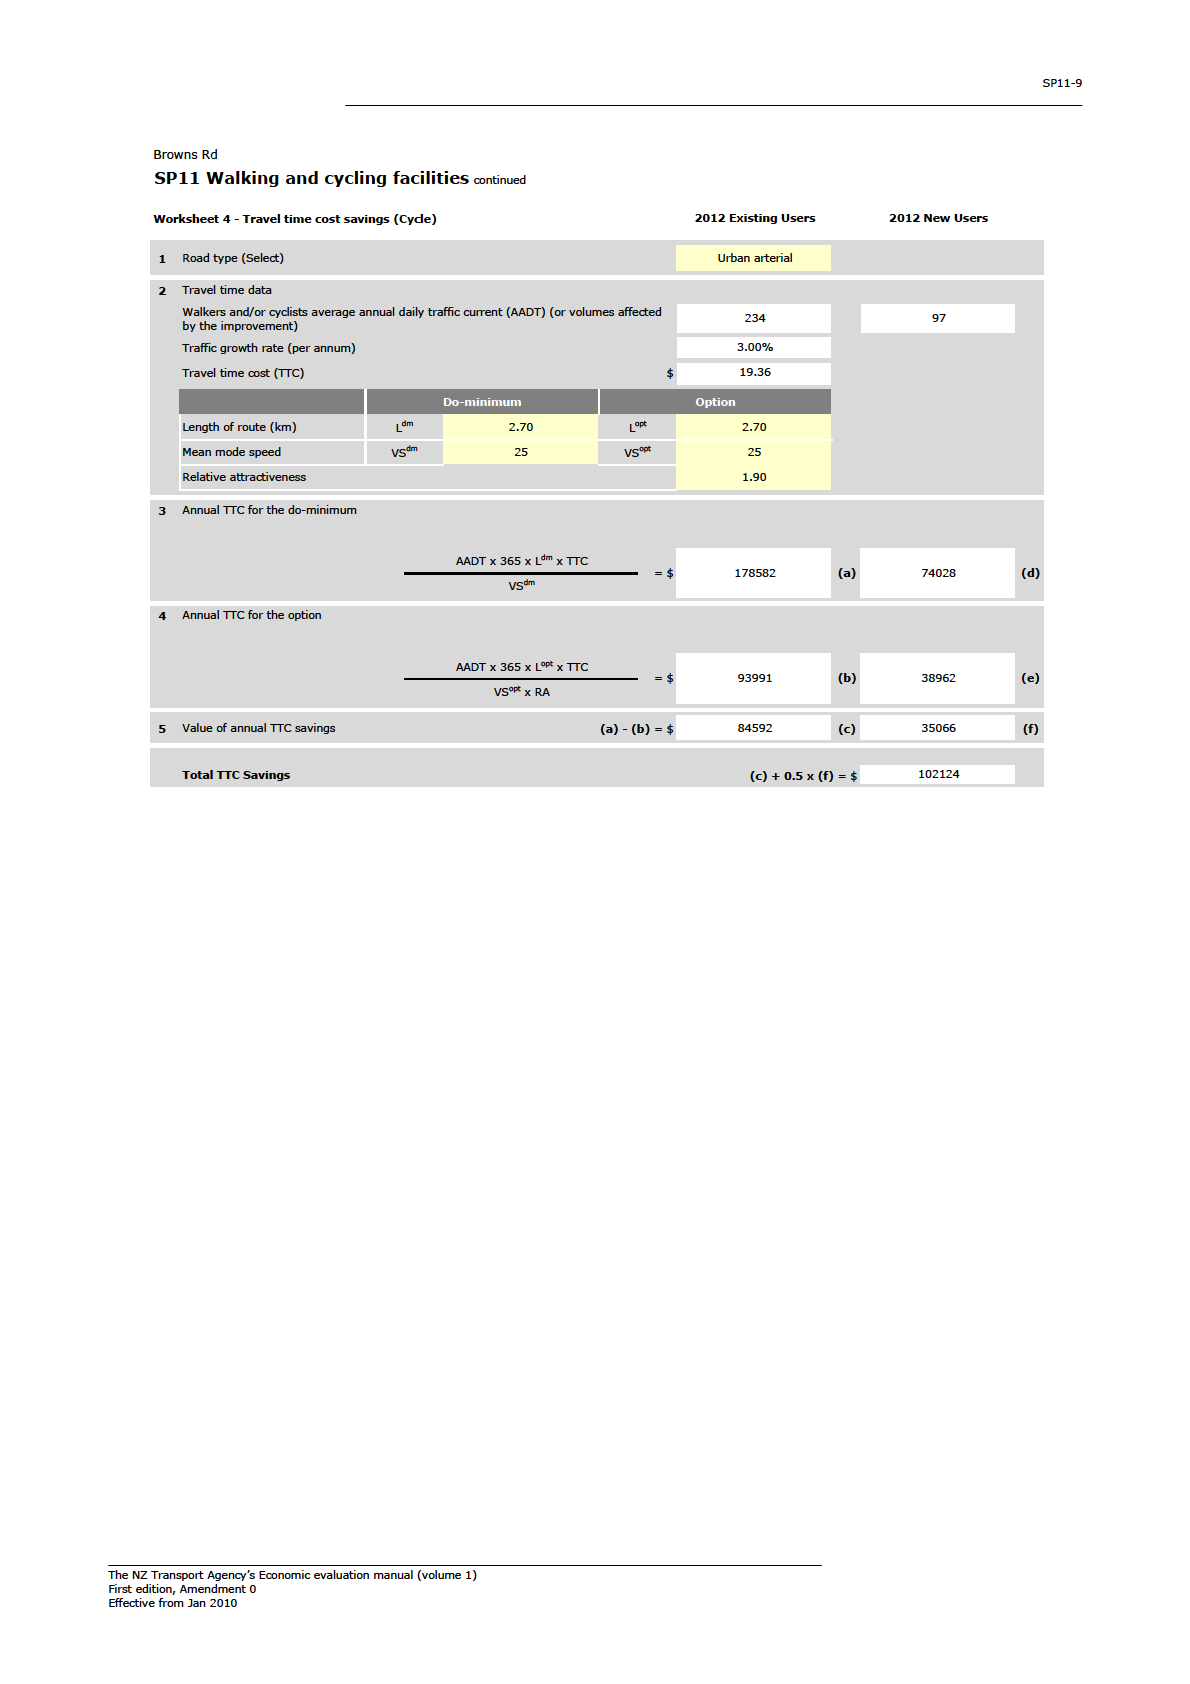
Travel Time Cost Savings
The travel time cost savings have been applied to existing cyclists and predicted new
cyclists resulting from the proposed cycle routes. Travel time benefits were applied to
both the existing cyclists due to improved cycle facilities and the new cyclists in order to
account for varying travel time benefits to new cyclists on the route.
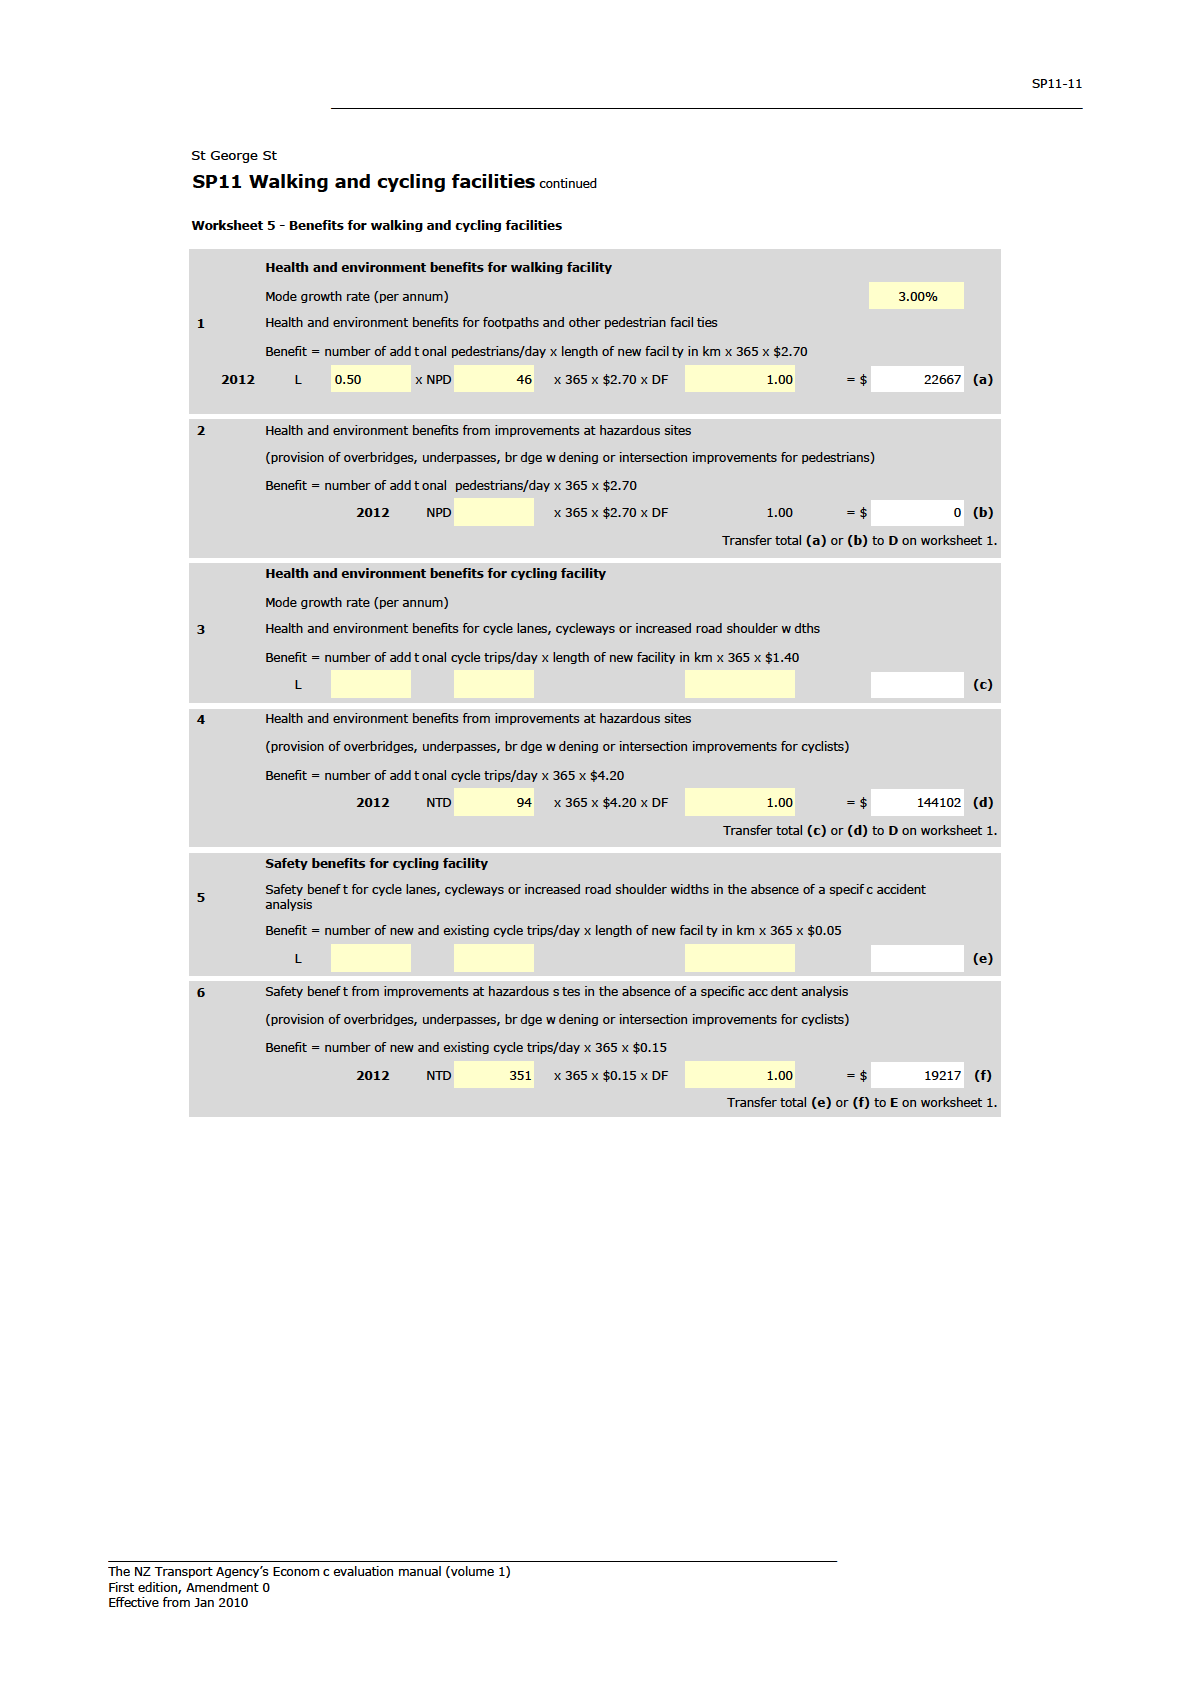
Health and Environmental benefits for Walking facility
The health and environmental benefits have been applied to the new pedestrian trips
generated as a result of the proposed new shared path in front of Papatoetoe West
School for Route 1.
Health and Environmental Benefits for Cycling Facility
The health and environmental benefits associated with each of the proposed routes
have been assessed for the number of additional cycle trips per day along the routes.
Safety Benefit for Cycling Facility
The safety benefits of providing the proposed facilities are assessed for the number of
existing and additional cycle trips generated per day along the routes.
The benefits are calculated in 2012 dollar values and are discounted for the period between
2015 to 2044 (30 years of benefit claiming period after completion of construction). Total
benefits for each of the proposed routes are summarised in Table 1.
Table 2: Summary of Benefits
Source of Benefit
Total Benefit
Route 1
Route 2
Route 3
Travel Time Benefits (Cycling)
$867,603
$1,546,714
$3,581,320
Health and Environmental Benefits (Walking
and Cycling)
$2,525,775
$2,252,136
$4,843,253
Safety Benefits (Cycling)
$291,053
$274,469
$574,643
Total
$3,684,432
$4,073,319
$8,999,216
Page 3
1.5 Cost Estimates
The Cost Estimates have been revised to identify cost saving options along the proposed cycle
routes, under the conditions that the benefits provided by the proposed walking and cycling
improvements are not compromised by the reduction of the level of provision.
The preferred option for Route 2 Browns Road in the draft PFR consists of on road cycle
lanes along the entire length of the route and additional off-road cycle path facilities in the
vicinity of the school to cater for the school based cycle traffic. Revisiting the option
identifies that provision of an additional off-road cycle path would not generate any extra
benefit in terms of travel time, health and environment benefits, or safety benefits. The cost
associated with the off-road cycle path has therefore been deducted from the initial cost
estimation.
Additional maintenance costs, above existing maintenance costs, have been calculated based
on the assumption of full thermoplastic green paint rehabilitation every seven years.
Table 3 summarises the revised cost estimation of new cycle facility improvements for each of
the routes and the NPV of total expenditure to date provided by Auckland Transport. A
summary of expenditures of each cycle route is included in Appendix B.
Table 3: Summary of Costs
Cost Items
Route 1
Route 2
Route 3
Facilities after cost
Retain on road cycle
Retain on road cycle
Retain on road cycle
saving review
lanes and shared
lanes and remove
lanes and cycle path
path around school
cycle path around
around school
school
Revised Cycleway
Cost
$540,000
$1,116,000
$1,380,000
(Maintenance Cost)
($416,250)
($544,813)
($1,545,000)
NPV Revised
Cycleway Cost
$471,957
$975,377
$1,206,112
(NPV Maintenance
($108,737)
($142,322)
($403,602)
Cost)
Total expenditure to
$858,621
$925,082
$727,783
date
NPV cost including
IA Grant
$1,439,315
$2,042,781
$2,337,496
Further consideration should be given towards ways of improving the LOS of cycle facilities
around school areas at the Scheme Assessment phase of this project.
Page 4
1.6 Benefit Cost Ratio
The revised benefit cost ratio has been calculated based on the revised benefits of the cycle
routes, revised cycleway cost, and the NPV of total expenditure to date. The BCRs for the
preferred option of each route are summarised in Table 4 below.
Table 4: Benefit Cost Ratios
Items
Route 1
Route 2
Route 3
NPV Benefits
$3,684,432
$4,073,319
$8,999,216
NPV cost including IA
Grant
$1,439,315
$2,042,781
$2,337,496
Revised BCR
2.6
2.0
3.8
1.7 Sensitivity Analysis
Opus has undertaken sensitivity testing on the economic evaluation to develop a better
appreciation as to the BCR’s sensitivity to changes in cost and variable factors and as to the
likely range of BCR values. Table 5 outlines the results of a sensitivity analysis of the Benefit
Cost Ratio for the three cycleway routes.
Table 5: Sensitivity Analysis of Benefit Cost Ratios
Items
Route 1
Route 2
Route 3
50% Cost Increase
1.9
1.4
2.5
50% Cost Reduction
3.1
2.6
5.2
50% Increase in Cycle
Demand
3.7
3.0
5.8
0% General traffic
growth
1.9
1.4
2.8
Reduced Discounting
Rate from 8% to 6%
3.3
2.5
4.9
The sensitivity analysis items that are seen to increase the BCR show the Economic efficiency
for Route 1 and Route 2 remaining at Medium efficiency. Route 3 is seen to increase in
Economic Efficiency from Medium to High for 3 sensitivity tests.
The sensitivity analysis items that are seen to reduce the BCR will still achieve value for
money, with BCR values greater than 1. However, they would reduce the Economic
Efficiency from Medium to Low for Route 1 and Route 2. Route 3 remains at Medium
efficiency.
Page 5
1.8 Next Steps
Once the results of the value engineering exercise have been reviewed and approved by
Auckland Transport, an amended draft PFR report including revised information on benefit
cost ratio, option assessment and other relevant sections will be issued to Auckland
Transport at a later agreed date.
Page 6
Appendix A:
Economic Evaluation

BCR Calculation
COST-BENEFIT ANALYSIS OF PREFERRED OPTIONS:
WORKSHEET 3
Route 1
Route 2
Route 3
1.
Project Options
COSTS:
2.
Capital Costs
$1,330,578
$1,900,459
$1,933,895
3 Maintenance Costs
$108,737
$142,322
$403,602
4.
Total Costs (2) + (3)
$1,439,315
$2,042,781
$2,337,497
BENEFITS:
5.
TRAVAL T ME BENEFIT
$867,603
$1,546,714
$3,581,320
6.
HEALTH & ENVIRONMENT BENEFIT
$2,525,775
$2,252,136
$4,843,253
7.
SAFETY BENEFITS
$291,053
$274,469
$574,643
8.
Tangible Benefits (5) to (7)
$3 684 432
$4 073 319
$8 999 216
9.
Tangible B/C Ratio (8) / (4)
2.6
2 0
3.8
NZTA's
Economic Evaluation Manual Vol 1
BCR WKSH 3
1

BCR Calculation
Route 1 Station Rd / St George St
Preferred Option
Time Zero
1/07/2012
Year of Estimate
2012
Construction Period
1
Months
Benefit period
1.5 to 31.5
Construction Start
1/01/2014
Construction payment
See Assumptions Sheet
Discounting
Amount
TRAVEL TIME SAVING
HEALTH & ENVIRONMENT BENEFIT
SAFETY BENEFITS
included in
CONSTRUCTION COSTS
Benefit Period
Calendar
Time
Discount
Calculated
Interpolated
Discounted
Amount
Calendar
Time
Discount
Calculated
Interpolated
Discounted
Amount
Calendar
Time
Discount
Calculated
Interpolated
Discounted
Amount
Calendar
Time
Discount
Calculated
Amount
Year
Stream
Factor
Annual
Annual
Annual
Included in
Year
Stream
Factor
Annual
Annual
Annual
Included in
Year
Stream
Factor
Annual
Annual
Annual
Included in
Year
Stream
Factor
Annual
Included in
Year
Amount
Amount
Amount
Benefit Period
Year
Amount
Amount
Amount
Benefit Period
Year (Disc)
Amount
Amount
Amount
Benefit Period
Year
Amount
Benefit Period
Construction
540,000
2006
2006
2006
2007
2007
2007
2008
2008
2008
2009
-4
1.36048896
2009
-4
1.36048896
2009
-4
1.36048896
2010
-3
1.259712
2010
-3
1.259712
2010
-3
1.259712
2011
-2
1.1664
2011
-2
1.1664
2011
-2
1.1664
2012
-1
1.08
$63,013.44
$63,013.44
2012
-1
1.08
$183,445.35
$183,445.35
2012
-1
1.08
$21,138.98
$21,138.98
1/07/2013
0
1
540,000
2013
0
1
$64,903.85
2013
0
1
$188,948.71
2013
0
1
$21,773.14
2014
1
0.925925926
$66,794.25
2014
1
0.925925926
$194,452.07
2014
1
0.925925926
$22,407.31
1/01/2015
1.75
0.873993953
540,000
$471,957
2015
2
0.85733882
$68,684.65
$58,886.02
$29,443.01
2015
2
0.85733882
$199,955.43
$171,429.55
$85,714.78
2015
2
0.85733882
$23,041.48
$19,754.36
$9,877.18
2016
3
0.793832241
$70,575.06
$56,024.76
$56,024.76
2016
3
0.793832241
$205,458.79
$163,099.81
$163,099.81
2016
3
0.793832241
$23,675.65
$18,794.50
$18,794.50 Birdge widening Cost
$858,621
2017
4
0.735029853
$72,465.46
$53,264.28
$53,264.28
2017
4
0.735029853
$210,962.15
$155,063.48
$155,063.48
2017
4
0.735029853
$24,309.82
$17,868.44
$17,868.44
83,250
2018
5
0.680583197
$74,355.86
$50,605.35
$50,605.35
2018
5
0.680583197
$216,465.51
$147,322.79
$147,322.79
2018
5
0.680583197
$24,943.99
$16,976.46
$16,976.46
7
0.583490395
83,250
$48,576
2019
6
0.630169627
$76,246.27
$48,048.08
$48,048.08
2019
6
0.630169627
$221,968.87
$139,878.04
$139,878.04
2019
6
0.630169627
$25,578.16
$16,118.58
$16,118.58
14
0.340461041
83,250
$28,343
2020
7
0.583490395
$78,136.67
$45,592.00
$45,592.00
2020
7
0.583490395
$227,472.23
$132,727.86
$132,727.86
2020
7
0.583490395
$26,212.33
$15,294.64
$15,294.64
21
0.198655748
83,250
$16,538
2021
8
0.540268885
$80,027.07
$43,236.14
$43,236.14
2021
8
0.540268885
$232,975.59
$125,869.46
$125,869.46
2021
8
0.540268885
$26,846.50
$14,504.33
$14,504.33
28
0.115913721
83,250
$9,650
2022
9
0.500248967
$81,917.48
$40,979.13
$40,979.13
2022
9
0.500248967
$238,478.96
$119,298.85
$119,298.85
2022
9
0.500248967
$27,480.67
$13,747.18
$13,747.18
35
0.067634543
83,250
$5,631
2023
10
0.463193488
$83,807.88
$38,819.26
$38,819.26
2023
10
0.463193488
$243,982.32
$113,011.02
$113,011.02
2023
10
0.463193488
$28,114.84
$13,022.61
$13,022.61
2024
11
0.428882859
$85,698.28
$36,754.53
$36,754.53
2024
11
0.428882859
$249,485.68
$107,000.13
$107,000.13
2024
11
0.428882859
$28,749.01
$12,329.96
$12,329.96
2025
12
0.397113759
$87,588.69
$34,782.67
$34,782.67
2025
12
0.397113759
$254,989.04
$101,259.65
$101,259.65
2025
12
0.397113759
$29,383.18
$11,668.46
$11,668.46
2026
13
0.367697925
$89,479.09
$32,901.28
$32,901.28
2026
13
0.367697925
$260,492.40
$95,782.51
$95,782.51
2026
13
0.367697925
$30,017.34
$11,037.32
$11,037.32
2027
14
0.340461041
$91,369.49
$31,107.75
$31,107.75
2027
14
0.340461041
$265,995.76
$90,561.19
$90,561.19
2027
14
0.340461041
$30,651.51
$10,435.65
$10,435.65
2028
15
0.315241705
$93,259.90
$29,399.41
$29,399.41
2028
15
0.315241705
$271,499.12
$85,587.84
$85,587.84
2028
15
0.315241705
$31,285.68
$9,862.55
$9,862.55
2029
16
0.291890468
$95,150.30
$27,773.47
$27,773.47
2029
16
0.291890468
$277,002.48
$80,854.38
$80,854.38
2029
16
0.291890468
$31,919.85
$9,317.10
$9,317.10
2030
17
0.270268951
$97,040.70
$26,227.09
$26,227.09
2030
17
0.270268951
$282,505.84
$76,352.56
$76,352.56
2030
17
0.270268951
$32,554.02
$8,798.34
$8,798.34
2031
18
0.250249029
$98,931.11
$24,757.41
$24,757.41
2031
18
0.250249029
$288,009.20
$72,074.02
$72,074.02
2031
18
0.250249029
$33,188.19
$8,305.31
$8,305.31
2032
19
0.231712064
$100,821.51
$23,361.56
$23,361.56
2032
19
0.231712064
$293,512.56
$68,010.40
$68,010.40
2032
19
0.231712064
$33,822.36
$7,837.05
$7,837.05
2033
20
0.214548207
$102,711.91
$22,036.66
$22,036.66
2033
20
0.214548207
$299,015.92
$64,153.33
$64,153.33
2033
20
0.214548207
$34,456.53
$7,392.59
$7,392.59
2034
21
0.198655748
$104,602.32
$20,779.85
$20,779.85
2034
21
0.198655748
$304,519.28
$60,494.51
$60,494.51
2034
21
0.198655748
$35,090.70
$6,970.97
$6,970.97
2035
22
0.183940507
$106,492.72
$19,588.33
$19,588.33
2035
22
0.183940507
$310,022.64
$57,025.72
$57,025.72
2035
22
0.183940507
$35,724.87
$6,571.25
$6,571.25
2036
23
0.170315284
$108,383.12
$18,459.30
$18,459.30
2036
23
0.170315284
$315,526.00
$53,738.90
$53,738.90
2036
23
0.170315284
$36,359.04
$6,192.50
$6,192.50
2037
24
0.157699337
$110,273.53
$17,390.06
$17,390.06
2037
24
0.157699337
$321,029.36
$50,626.12
$50,626.12
2037
24
0.157699337
$36,993.21
$5,833.80
$5,833.80
2038
25
0.146017905
$112,163.93
$16,377.94
$16,377.94
2038
25
0.146017905
$326,532.72
$47,679.62
$47,679.62
2038
25
0.146017905
$37,627.38
$5,494.27
$5,494.27
2039
26
0.135201764
$114,054.33
$15,420.35
$15,420.35
2039
26
0.135201764
$332,036.08
$44,891.86
$44,891.86
2039
26
0.135201764
$38,261.54
$5,173.03
$5,173.03
2040
27
0.125186818
$115,944.74
$14,514.75
$14,514.75
2040
27
0.125186818
$337,539.44
$42,255.49
$42,255.49
2040
27
0.125186818
$38,895.71
$4,869.23
$4,869.23
2041
28
0.115913721
$117,835.14
$13,658.71
$13,658.71
2041
28
0.115913721
$343,042.80
$39,763.37
$39,763.37
2041
28
0.115913721
$39,529.88
$4,582.06
$4,582.06
2042
29
0.107327519
$119,725.54
$12,849.85
$12,849.85
2042
29
0.107327519
$348,546.17
$37,408.60
$37,408.60
2042
29
0.107327519
$40,164.05
$4,310.71
$4,310.71
2043
30
0.099377333
$121,615.95
$12,085.87
$12,085.87
2043
30
0.099377333
$354,049.53
$35,184.50
$35,184.50
2043
30
0.099377333
$40,798.22
$4,054.42
$4,054.42
2044
31
0.092016049
$123,506.35
$11,364.57
$11,364.57
2044
31
0.092016049
$359,552.89
$33,084.64
$33,084.64
2044
31
0.092016049
$41,432.39
$3,812.44
$3,812.44
2045
32
0.085200045
$125,396.75
$10,683.81
2045
32
0.085200045
$365,056.25
$31,102.81
2045
32
0.085200045
$42,066.56
$3,584.07
2046
33
0.078888931
2046
33
0.078888931
2046
33
0.078888931
$867,603
$2,525,775
$291,053
$1,439,315.18
Route 1 Pref
2

BCR Calculation
Route 2 Browns Rd
Preferred Option
Time Zero
1/07/2012
Year of Estimate
2012
Construction Period
1
Months
Benefit period
1.5 to 31.5
Construction Start
1/01/2014
Construction payment
See Assumptions Sheet
Discounting
Amount
TRAVEL TIME SAVING
HEALTH & ENVIRONMENT BENEFIT
SAFETY BENEFITS
included in
CONSTRUCTION COSTS
Benefit Period
Calendar
Time
Discount
Calculated
Interpolated
Discounted
Amount
Calendar
Time
Discount
Calculated
Interpolated
Discounted
Amount
Calendar
Time
Discount
Calculated
Interpolated
Discounted
Amount
Calendar
Time
Discount
Calculated
Amount
Year
Stream
Factor
Annual
Annual
Annual
Included in
Year
Stream
Factor
Annual
Annual
Annual
Included in
Year
Stream
Factor
Annual
Annual
Annual
Included in
Year
Stream
Factor
Annual
Included in
Year
Amount
Amount
Amount
Benefit Period
Year
Amount
Amount
Amount
Benefit Period
Year (Disc)
Amount
Amount
Amount
Benefit Period
Year
Amount
Benefit Period
Construction
1,116,000
2006
2006
2006
2007
2007
2007
2008
2008
2008
2009
-4
1.36048896
2009
-4
1.36048896
2009
-4
1.36048896
2010
-3
1.259712
2010
-3
1.259712
2010
-3
1.259712
2011
-2
1.1664
2011
-2
1.1664
2011
-2
1.1664
2012
-1
1.08
$112,336.79
$112,336.79
2012
-1
1.08
$163,571.10
$163,571.10
2012
-1
1.08
$19,934.48
$19,934.48
1/07/2013
0
1
1,116,000
2013
0
1
$115,706.90
2013
0
1
$168,478.23
2013
0
1
$20,532.51
2014
1
0.925925926
$119,077.00
2014
1
0.925925926
$173,385.37
2014
1
0.925925926
$21,130.54
1/01/2015
1.75
0.873993953
1,116,000
$975,377
2015
2
0.85733882
$122,447.10
$104,978.66
$52,489.33
2015
2
0.85733882
$178,292.50
$152,857.08
$76,428.54
2015
2
0.85733882
$21,728.58
$18,628.75
$9,314.38
2016
3
0.793832241
$125,817.21
$99,877.76
$99,877.76
2016
3
0.793832241
$183,199.63
$145,429.77
$145,429.77
2016
3
0.793832241
$22,326.61
$17,723.58
$17,723.58 Birdge widening Cost
$925,082
2017
4
0.735029853
$129,187.31
$94,956.53
$94,956.53
2017
4
0.735029853
$188,106.77
$138,264.09
$138,264.09
2017
4
0.735029853
$22,924.65
$16,850.30
$16,850.30
108,963
2018
5
0.680583197
$132,557.41
$90,216.35
$90,216.35
2018
5
0.680583197
$193,013.90
$131,362.02
$131,362.02
2018
5
0.680583197
$23,522.68
$16,009.14
$16,009.14
7
0.583490395
108,963
$63,579
2019
6
0.630169627
$135,927.52
$85,657.39
$85,657.39
2019
6
0.630169627
$197,921.03
$124,723.82
$124,723.82
2019
6
0.630169627
$24,120.71
$15,200.14
$15,200.14
14
0.340461041
108,963
$37,097
2020
7
0.583490395
$139,297.62
$81,278.82
$81,278.82
2020
7
0.583490395
$202,828.16
$118,348.29
$118,348.29
2020
7
0.583490395
$24,718.75
$14,423.15
$14,423.15
21
0.198655748
108,963
$21,646
2021
8
0.540268885
$142,667.73
$77,078.93
$77,078.93
2021
8
0.540268885
$207,735.30
$112,232.92
$112,232.92
2021
8
0.540268885
$25,316.78
$13,677.87
$13,677.87
28
0.115913721
108,963
$12,630
2022
9
0.500248967
$146,037.83
$73,055.27
$73,055.27
2022
9
0.500248967
$212,642.43
$106,374.16
$106,374.16
2022
9
0.500248967
$25,914.82
$12,963.86
$12,963.86
35
0.067634543
108,963
$7,370
2023
10
0.463193488
$149,407.93
$69,204.78
$69,204.78
2023
10
0.463193488
$217,549.56
$100,767.54
$100,767.54
2023
10
0.463193488
$26,512.85
$12,280.58
$12,280.58
2024
11
0.428882859
$152,778.04
$65,523.88
$65,523.88
2024
11
0.428882859
$222,456.70
$95,407.86
$95,407.86
2024
11
0.428882859
$27,110.89
$11,627.39
$11,627.39
2025
12
0.397113759
$156,148.14
$62,008.58
$62,008.58
2025
12
0.397113759
$227,363.83
$90,289.30
$90,289.30
2025
12
0.397113759
$27,708.92
$11,003.59
$11,003.59
2026
13
0.367697925
$159,518.25
$58,654.53
$58,654.53
2026
13
0.367697925
$232,270.96
$85,405.55
$85,405.55
2026
13
0.367697925
$28,306.95
$10,408.41
$10,408.41
2027
14
0.340461041
$162,888.35
$55,457.14
$55,457.14
2027
14
0.340461041
$237,178.10
$80,749.90
$80,749.90
2027
14
0.340461041
$28,904.99
$9,841.02
$9,841.02
2028
15
0.315241705
$166,258.45
$52,411.60
$52,411.60
2028
15
0.315241705
$242,085.23
$76,315.36
$76,315.36
2028
15
0.315241705
$29,503.02
$9,300.58
$9,300.58
2029
16
0.291890468
$169,628.56
$49,512.96
$49,512.96
2029
16
0.291890468
$246,992.36
$72,094.72
$72,094.72
2029
16
0.291890468
$30,101.06
$8,786.21
$8,786.21
2030
17
0.270268951
$172,998.66
$46,756.17
$46,756.17
2030
17
0.270268951
$251,899.49
$68,080.61
$68,080.61
2030
17
0.270268951
$30,699.09
$8,297.01
$8,297.01
2031
18
0.250249029
$176,368.76
$44,136.11
$44,136.11
2031
18
0.250249029
$256,806.63
$64,265.61
$64,265.61
2031
18
0.250249029
$31,297.13
$7,832.08
$7,832.08
2032
19
0.231712064
$179,738.87
$41,647.66
$41,647.66
2032
19
0.231712064
$261,713.76
$60,642.24
$60,642.24
2032
19
0.231712064
$31,895.16
$7,390.49
$7,390.49
2033
20
0.214548207
$183,108.97
$39,285.70
$39,285.70
2033
20
0.214548207
$266,620.89
$57,203.03
$57,203.03
2033
20
0.214548207
$32,493.19
$6,971.36
$6,971.36
2034
21
0.198655748
$186,479.08
$37,045.14
$37,045.14
2034
21
0.198655748
$271,528.03
$53,940.60
$53,940.60
2034
21
0.198655748
$33,091.23
$6,573.76
$6,573.76
2035
22
0.183940507
$189,849.18
$34,920.95
$34,920.95
2035
22
0.183940507
$276,435.16
$50,847.62
$50,847.62
2035
22
0.183940507
$33,689.26
$6,196.82
$6,196.82
2036
23
0.170315284
$193,219.28
$32,908.20
$32,908.20
2036
23
0.170315284
$281,342.29
$47,916.89
$47,916.89
2036
23
0.170315284
$34,287.30
$5,839.65
$5,839.65
2037
24
0.157699337
$196,589.39
$31,002.02
$31,002.02
2037
24
0.157699337
$286,249.43
$45,141.34
$45,141.34
2037
24
0.157699337
$34,885.33
$5,501.39
$5,501.39
2038
25
0.146017905
$199,959.49
$29,197.67
$29,197.67
2038
25
0.146017905
$291,156.56
$42,514.07
$42,514.07
2038
25
0.146017905
$35,483.37
$5,181.21
$5,181.21
2039
26
0.135201764
$203,329.59
$27,490.52
$27,490.52
2039
26
0.135201764
$296,063.69
$40,028.33
$40,028.33
2039
26
0.135201764
$36,081.40
$4,878.27
$4,878.27
2040
27
0.125186818
$206,699.70
$25,876.08
$25,876.08
2040
27
0.125186818
$300,970.82
$37,677.58
$37,677.58
2040
27
0.125186818
$36,679.43
$4,591.78
$4,591.78
2041
28
0.115913721
$210,069.80
$24,349.97
$24,349.97
2041
28
0.115913721
$305,877.96
$35,455.45
$35,455.45
2041
28
0.115913721
$37,277.47
$4,320.97
$4,320.97
2042
29
0.107327519
$213,439.91
$22,907.98
$22,907.98
2042
29
0.107327519
$310,785.09
$33,355.79
$33,355.79
2042
29
0.107327519
$37,875.50
$4,065.08
$4,065.08
2043
30
0.099377333
$216,810.01
$21,546.00
$21,546.00
2043
30
0.099377333
$315,692.22
$31,372.65
$31,372.65
2043
30
0.099377333
$38,473.54
$3,823.40
$3,823.40
2044
31
0.092016049
$220,180.11
$20,260.10
$20,260.10
2044
31
0.092016049
$320,599.36
$29,500.29
$29,500.29
2044
31
0.092016049
$39,071.57
$3,595.21
$3,595.21
2045
32
0.085200045
$223,550.22
$19,046.49
2045
32
0.085200045
$325,506.49
$27,733.17
2045
32
0.085200045
$39,669.61
$3,379.85
2046
33
0.078888931
2046
33
0.078888931
2046
33
0.078888931
$1,546,714
$2,252,136
$274,469
$2,042,781.21
Route 2 Pref
3

BCR Calculation
Route 3 Weymouth Rd / Alfriston Rd
Preferred Option
Time Zero
1/07/2012
Year of Estimate
2012
Construction Period
1
Months
Benefit period
1.5 to 31.5
Construction Start
1/01/2014
Construction payment
See Assumptions Sheet
Discounting
Amount
TRAVEL TIME SAVING
HEALTH & ENVIRONMENT BENEFIT
SAFETY BENEFITS
included in
CONSTRUCTION COSTS
Benefit Period
Calendar
Time
Discount
Calculated
Interpolated
Discounted
Amount
Calendar
Time
Discount
Calculated
Interpolated
Discounted
Amount
Calendar
Time
Discount
Calculated
Interpolated
Discounted
Amount
Calendar
Time
Discount
Calculated
Amount
Year
Stream
Factor
Annual
Annual
Annual
Included in
Year
Stream
Factor
Annual
Annual
Annual
Included in
Year
Stream
Factor
Annual
Annual
Annual
Included in
Year
Stream
Factor
Annual
Included in
Year
Amount
Amount
Amount
Benefit Period
Year
Amount
Amount
Amount
Benefit Period
Year (Disc)
Amount
Amount
Amount
Benefit Period
Year
Amount
Benefit Period
Construction
1,380,000
2006
2006
2006
2007
2007
2007
2008
2008
2008
2009
-4
1.36048896
2009
-4
1.36048896
2009
-4
1.36048896
2010
-3
1.259712
2010
-3
1.259712
2010
-3
1.259712
2011
-2
1.1664
2011
-2
1.1664
2011
-2
1.1664
2012
-1
1.08
$260,108.83
$260,108.83
2012
-1
1.08
$351,762.18
$351,762.18
2012
-1
1.08
$41,735.93
$41,735.93
1/07/2013
0
1
1,380,000
2013
0
1
$267,912.09
2013
0
1
$362,315.05
2013
0
1
$42,988.00
2014
1
0.925925926
$275,715.36
2014
1
0.925925926
$372,867.91
2014
1
0.925925926
$44,240.08
1/01/2015
1.75
0.873993953
1,380,000
$1,206,112
2015
2
0.85733882
$283,518.62
$243,071.52
$121,535.76
2015
2
0.85733882
$383,420.78
$328,721.52
$164,360.76
2015
2
0.85733882
$45,492.16
$39,002.19
$19,501.10
2016
3
0.793832241
$291,321.89
$231,260.71
$231,260.71
2016
3
0.793832241
$393,973.64
$312,748.98
$312,748.98
2016
3
0.793832241
$46,744.24
$37,107.08
$37,107.08 Bridge Widening Cost
$727,783
2017
4
0.735029853
$299,125.15
$219,865.92
$219,865.92
2017
4
0.735029853
$404,526.51
$297,339.06
$297,339.06
2017
4
0.735029853
$47,996.31
$35,278.72
$35,278.72
309,000
2018
5
0.680583197
$306,928.42
$208,890.32
$208,890.32
2018
5
0.680583197
$415,079.37
$282,496.05
$282,496.05
2018
5
0.680583197
$49,248.39
$33,517.63
$33,517.63
7
0.583490395
309,000
$180,299
2019
6
0.630169627
$314,731.68
$198,334.35
$198,334.35
2019
6
0.630169627
$425,632.24
$268,220.51
$268,220.51
2019
6
0.630169627
$50,500.47
$31,823.86
$31,823.86
14
0.340461041
309,000
$105,202
2020
7
0.583490395
$322,534.95
$188,196.04
$188,196.04
2020
7
0.583490395
$436,185.10
$254,509.82
$254,509.82
2020
7
0.583490395
$51,752.55
$30,197.11
$30,197.11
21
0.198655748
309,000
$61,385
2021
8
0.540268885
$330,338.21
$178,471.46
$178,471.46
2021
8
0.540268885
$446,737.97
$241,358.62
$241,358.62
2021
8
0.540268885
$53,004.62
$28,636.75
$28,636.75
28
0.115913721
309,000
$35,817
2022
9
0.500248967
$338,141.48
$169,154.92
$169,154.92
2022
9
0.500248967
$457,290.83
$228,759.27
$228,759.27
2022
9
0.500248967
$54,256.70
$27,141.86
$27,141.86
35
0.067634543
309,000
$20,899
2023
10
0.463193488
$345,944.74
$160,239.35
$160,239.35
2023
10
0.463193488
$467,843.70
$216,702.16
$216,702.16
2023
10
0.463193488
$55,508.78
$25,711.31
$25,711.31
2024
11
0.428882859
$353,748.01
$151,716.46
$151,716.46
2024
11
0.428882859
$478,396.56
$205,176.09
$205,176.09
2024
11
0.428882859
$56,760.86
$24,343.76
$24,343.76
2025
12
0.397113759
$361,551.27
$143,576.98
$143,576.98
2025
12
0.397113759
$488,949.43
$194,168.55
$194,168.55
2025
12
0.397113759
$58,012.94
$23,037.73
$23,037.73
2026
13
0.367697925
$369,354.54
$135,810.90
$135,810.90
2026
13
0.367697925
$499,502.30
$183,665.96
$183,665.96
2026
13
0.367697925
$59,265.01
$21,791.62
$21,791.62
2027
14
0.340461041
$377,157.80
$128,407.54
$128,407.54
2027
14
0.340461041
$510,055.16
$173,653.91
$173,653.91
2027
14
0.340461041
$60,517.09
$20,603.71
$20,603.71
2028
15
0.315241705
$384,961.07
$121,355.78
$121,355.78
2028
15
0.315241705
$520,608.03
$164,117.36
$164,117.36
2028
15
0.315241705
$61,769.17
$19,472.22
$19,472.22
2029
16
0.291890468
$392,764.33
$114,644.16
$114,644.16
2029
16
0.291890468
$531,160.89
$155,040.80
$155,040.80
2029
16
0.291890468
$63,021.25
$18,395.30
$18,395.30
2030
17
0.270268951
$400,567.60
$108,260.98
$108,260.98
2030
17
0.270268951
$541,713.76
$146,408.41
$146,408.41
2030
17
0.270268951
$64,273.32
$17,371.08
$17,371.08
2031
18
0.250249029
$408,370.86
$102,194.41
$102,194.41
2031
18
0.250249029
$552,266.62
$138,204.19
$138,204.19
2031
18
0.250249029
$65,525.40
$16,397.67
$16,397.67
2032
19
0.231712064
$416,174.13
$96,432.57
$96,432.57
2032
19
0.231712064
$562,819.49
$130,412.07
$130,412.07
2032
19
0.231712064
$66,777.48
$15,473.15
$15,473.15
2033
20
0.214548207
$423,977.39
$90,963.59
$90,963.59
2033
20
0.214548207
$573,372.35
$123,016.01
$123,016.01
2033
20
0.214548207
$68,029.56
$14,595.62
$14,595.62
2034
21
0.198655748
$431,780.66
$85,775.71
$85,775.71
2034
21
0.198655748
$583,925.22
$116,000.10
$116,000.10
2034
21
0.198655748
$69,281.64
$13,763.20
$13,763.20
2035
22
0.183940507
$439,583.92
$80,857.29
$80,857.29
2035
22
0.183940507
$594,478.08
$109,348.60
$109,348.60
2035
22
0.183940507
$70,533.71
$12,974.01
$12,974.01
2036
23
0.170315284
$447,387.18
$76,196.88
$76,196.88
2036
23
0.170315284
$605,030.95
$103,046.02
$103,046.02
2036
23
0.170315284
$71,785.79
$12,226.22
$12,226.22
2037
24
0.157699337
$455,190.45
$71,783.23
$71,783.23
2037
24
0.157699337
$615,583.82
$97,077.16
$97,077.16
2037
24
0.157699337
$73,037.87
$11,518.02
$11,518.02
2038
25
0.146017905
$462,993.71
$67,605.37
$67,605.37
2038
25
0.146017905
$626,136.68
$91,427.17
$91,427.17
2038
25
0.146017905
$74,289.95
$10,847.66
$10,847.66
2039
26
0.135201764
$470,796.98
$63,652.58
$63,652.58
2039
26
0.135201764
$636,689.55
$86,081.55
$86,081.55
2039
26
0.135201764
$75,542.02
$10,213.41
$10,213.41
2040
27
0.125186818
$478,600.24
$59,914.44
$59,914.44
2040
27
0.125186818
$647,242.41
$81,026.22
$81,026.22
2040
27
0.125186818
$76,794.10
$9,613.61
$9,613.61
2041
28
0.115913721
$486,403.51
$56,380.84
$56,380.84
2041
28
0.115913721
$657,795.28
$76,247.50
$76,247.50
2041
28
0.115913721
$78,046.18
$9,046.62
$9,046.62
2042
29
0.107327519
$494,206.77
$53,041.99
$53,041.99
2042
29
0.107327519
$668,348.14
$71,732.15
$71,732.15
2042
29
0.107327519
$79,298.26
$8,510.89
$8,510.89
2043
30
0.099377333
$502,010.04
$49,888.42
$49,888.42
2043
30
0.099377333
$678,901.01
$67,467.37
$67,467.37
2043
30
0.099377333
$80,550.34
$8,004.88
$8,004.88
2044
31
0.092016049
$509,813.30
$46,911.01
$46,911.01
2044
31
0.092016049
$689,453.87
$63,440.82
$63,440.82
2044
31
0.092016049
$81,802.41
$7,527.13
$7,527.13
2045
32
0.085200045
$517,616.57
$44,100.95
2045
32
0.085200045
$700,006.74
$59,640.61
2045
32
0.085200045
$83,054.49
$7,076.25
2046
33
0.078888931
2046
33
0.078888931
2046
33
0.078888931
$3,581,320
$4,843,253
$574,643
$2,337,496.69
Route 3 Pref
4
Cycle Demand SP-11
______________________________________________________________________________________________
St George Street
SP11 Walking and cycling facilities continued
Worksheet 7 – Cycle demand
2012
New and existing cyclists
Buffers (km)
<0.4
0.4 to <0.8
0.8 to ≤ 1.6
1
Area (km2)
1.06
1.78
5.81
2
Density per square kilometre
2872
3389
3367
3
Population in each buffer
(3) =
(1) x
(2)
3044
6032
19562
4
Total population in all buffers (Sum of
(3))
28639
5
Commute share (single value for all)
0.60%
6
Likelihood of new cyclist multiplier
1.04
0.54
0.21
7
Row
(7) =
(3) x
(6)
3166
3258
4108
8
Sum of row
(7)
10532
9
Cyclist rate
(9) = (
(5) x 0.96) + 0.32%
0.90%
Annual Traffic Growth (Base Year to Forecast)
10 Total existing daily cyclists
(10) =
(4) x
(9)
257
11 Total new daily cyclists
(11) =
(8) x
(9)
94
Likelihood Scale Factor
100%
Existing Cylists
257
Factored new daily cyclists
94
New and existing pedestrians
Existing Pedestrians
New Daily Pedestrians
______________________________________________________________________________________________
The NZ Transport Agency’s Economic evaluation manual (volume 1)
First edition, Amendment 0
Effective from Jan 2010
Cycle Demand SP-11
______________________________________________________________________________________________
Browns Rd
SP11 Walking and cycling facilities continued
Worksheet 7 – Cycle demand
2012
New and existing cyclists
Buffers (km)
<0.4
0.4 to <0.8
0.8 to ≤ 1.6
1
Area (km2)
1.79
2.49
6.9
2
Density per square kilometre
2241
2480
2301
3
Population in each buffer
(3) =
(1) x
(2)
4011
6175
15877
4
Total population in all buffers (Sum of
(3))
26063
5
Commute share (single value for all)
0.60%
6
Likelihood of new cyclist multiplier
1.04
0.54
0.21
7
Row
(7) =
(3) x
(6)
4172
3335
3334
8
Sum of row
(7)
10841
9
Cyclist rate
(9) = (
(5) x 0.96) + 0.32%
0.90%
Annual Traffic Growth (Base Year to Forecast)
10 Total existing daily cyclists
(10) =
(4) x
(9)
234
11 Total new daily cyclists
(11) =
(8) x
(9)
97
Likelihood Scale Factor
100%
Existing Cylists
234
Factored new daily cyclists
97
New and existing pedestrians
Existing Pedestrians
New Daily Pedestrians
______________________________________________________________________________________________
The NZ Transport Agency’s Economic evaluation manual (volume 1)
First edition, Amendment 0
Effective from Jan 2010
Cycle Demand SP-11
______________________________________________________________________________________________
Weymouth Rd
SP11 Walking and cycling facilities continued
Worksheet 7 – Cycle demand
2012
New and existing cyclists
Buffers (km)
<0.4
0.4 to <0.8
0.8 to ≤ 1.6
1
Area (km2)
2.46
3.17
7.69
2
Density per square kilometre
2749
2806
2990
3
Population in each buffer
(3) =
(1) x
(2)
6763
8895
22993
4
Total population in all buffers (Sum of
(3))
38651
5
Commute share (single value for all)
0.60%
6
Likelihood of new cyclist multiplier
1.04
0.54
0.21
7
Row
(7) =
(3) x
(6)
7033
4803
4829
8
Sum of row
(7)
16665
9
Cyclist rate
(9) = (
(5) x 0.96) + 0.32%
0.90%
Annual Traffic Growth (Base Year to Forecast)
10 Total existing daily cyclists
(10) =
(4) x
(9)
346
11 Total new daily cyclists
(11) =
(8) x
(9)
149
Likelihood Scale Factor
100%
Existing Cylists
346
Factored new daily cyclists
149
New and existing pedestrians
Existing Pedestrians
New Daily Pedestrians
______________________________________________________________________________________________
The NZ Transport Agency’s Economic evaluation manual (volume 1)
First edition, Amendment 0
Effective from Jan 2010
St George St
Pedestrian Counts
School Name
Papatoetoe West
number of student
760
% of Pedestrian (arrival)
30.0%
% of Pedestrian (departure)
30.0%
Total daily Pedestrian Trips
456
proportion of Pedestrian using the propose route
50%
Total daily Pedestrian Trips using the propose route
228
sum
228
Assumed that Student Pedestrian is about 50% of all pedestrian
Therefore, all pedestrian =
456
Assumed that 10% of all pedestrian are new
Therefore, new pedestrian =
46


 Evaluation Assumptions
Assumptions
Evaluation Assumptions
Assumptions
Description
Value
Discount Rate
8%
Minimum Commuter Costs
$3.40
GST
15%
Growth Rate
3.0%
Travel Time Costs - EEM Vol.2 SP11 Worksheet 4 Table 1
Travel Time
Road Type
Cost
$/hr( 2008)
Urban Arterial
19.36
Urban Other
19.31
Rural Strategic
27.67
Rural Other
27.04
Benefit Factors for Cycle Facilities - EEM Vol.2 SP11 Worksheet 4 Table 2
Relative
Type of Cycle Facility
Attractive.
On-street with parking, no marked cycle
1.0
lane
On-street with parking, marked cycle
1.8
lane
On-street without parking, marked cycle
1.9
lane
Off-street cycle path
2.0
New Facility Benefits - EEM Vol.2 Table 8.2 & 8.3
New Ped
New Cycle
Benefit
Facility
Facility
$/ped km
$/cyc km
Health
2.6
1.3
Safety
0
0.05
Road Traffic Reduction
0.1
0.1
Benefit Update Factors - EEM Vol.1 A12.2
Benefit
Update Factor
Travel Time
1.37
VOC
1.06
Accident Cost Savings
1.2
Comfort Benefits
1.39
Driver Frustration
1.37
Passenger Transport User Benefits
1.1
Walking and Cycling
1.1
Travel Behaviour Change Benefits
1.1
G:\TLAs\Auckland Transport\Projects\1-C0821.00-Cycle_Routes-JPF\Traffic\Data\Revised Economics again in June 2013\[130617 Manukau Cycle Lane Revised Economics.xlsx]
Appendix B:
Risk Register