Metropolitan rail: external benefits and
optimal funding
February 2015
ACT
THE
R Irvine, A Schiff, T Denne and J Small
Covec Ltd
UNDER
INFORMATION
1982
RELEASED
OFFICIAL
NZ Transport Agency research report 552
Contracted research organisation – Covec Ltd
THE ACT
UNDER
ISBN 978-0-478-41949-8 (electronic)
ISSN 1173-3764 (electronic)
NZ Transport Agency
Private Bag 6995, Wellington 6141, New Zealand
Telephone 64 4 894 5400; facsimile 64 4 894 6100
[email address]
INFORMATION
1982
www.nzta.govt.nz
Irvine, R, A Schiff, T Denne and J Small (2015) Metropolitan rail: external benefits and optimal funding.
NZ
Transport Agency research report 552. 100pp.
RELEASED
Covec Ltd was contracted by the NZ Transport Agency in 2012 to carry out this research.
This publication is copyright © NZ Transport Agency 2015. Material in it may be reproduced for personal
or in-house use without formal permission or charge, provided suitable acknowledgement is made to this
OFFICIAL
publication and the NZ Transport Agency as the source. Requests and enquiries about the reproduction of
material in this publication for any other purpose should be made to the Manager National Programmes,
Investment Team, NZ Transport Agency, at [email address].
Keywords: externalities, marginal cost pricing, optimal public funding, rail
An important note for the reader
The NZ Transport Agency is a Crown entity established under the Land Transport Management Act 2003.
The objective of the Agency is to undertake its functions in a way that contributes to an efficient, effective
and safe land transport system in the public interest. Each year, the NZ Transport Agency funds innovative
and relevant research that contributes to this objective.
The views expressed in research reports are the outcomes of the independent research, and should not be
regarded as being the opinion or responsibility of the NZ Transport Agency. The material contained in the
reports should not be construed in any way as policy adopted by the NZ Transport Agency or indeed any
ACT
agency of the NZ Government. The reports may, however, be used by NZ Government agencies as a
THE
reference in the development of policy.
While research reports are believed to be correct at the time of their preparation, the NZ Transport Agency
and agents involved in their preparation and publication do not accept any liability for use of the research.
People using the research, whether directly or indirectly, should apply and rely on their own skill and
judgement. They should not rely on the contents of the research reports in isolation from other sources of
advice and information. If necessary, they should seek appropriate legal or other expert advice.
UNDER
INFORMATION
1982
RELEASED
OFFICIAL
Acknowledgements
We are grateful to the many people who have assisted with this project, including the steering group (Peter
Kippenberger, Ian Duncan, Christine Perrins and Angus Gabara), peer reviewers (Malcolm Dean and Adolph
Stroombergen), other NZ Transport Agency experts and staff (Shane Avers, Nick Hunter, Karen Johnson)
and other contributors (Jojo Valero, Ken McLeod, Kerry Saywell, Geoffrey Cornelis, Nicola Duckett and
James Hughes).
THE ACT
Abbreviations and acronyms
ACC
Accident Compensation Corporation
EMU
electrical multiple unit
ETS
Emissions Trading Scheme
GHG
greenhouse gases
UNDER
LRMC
long-run marginal cost
NLTF
National Land Transport Fund
NPV
net present value
PM
particular matter smaller than 10 microns in diameter
10
RUC
road user cost
SKM
Sinclair Knight Merz
INFORMATION
1982
SO
sulphur dioxide
2
SRMC
short-run marginal cost
Transport Agency New Zealand Transport Agency
VHR
vehicle hours
RELEASED
VKT
vehicle kilometres travelled
OFFICIAL
link to page 7 link to page 10 link to page 11 link to page 11 link to page 13 link to page 15 link to page 16 link to page 16 link to page 17 link to page 17 link to page 18 link to page 23 link to page 24 link to page 27 link to page 27 link to page 29 link to page 33 link to page 39 link to page 41 link to page 41 link to page 42 link to page 45 link to page 46 link to page 61 link to page 64 link to page 65 link to page 67 link to page 68 link to page 69 link to page 70 link to page 72 link to page 72 link to page 72 link to page 74 link to page 75 link to page 76 link to page 81 link to page 85 link to page 91 link to page 91 link to page 91 link to page 91
Contents
Executive summary ................................................................................................................................................................. 7
Abstract ....................................................................................................................................................................................... 10
1
Introduction ................................................................................................................................................................ 11
1.1 Scope of analysis .......................................................................................................... 11
1.2 Analytical framework ................................................................................................... 13
1.3 Limitations .................................................................................................................... 15
2
Metropolitan rail in New Zealand .................................................................................................................. 16
ACT
2.1 Industry structure ......................................................................................................... 16
THE
2.2 Auckland ....................................................................................................................... 17
2.3 Wellington ..................................................................................................................... 17
2.4 History of rail in New Zealand ..................................................................................... 18
2.5 Summary ....................................................................................................................... 23
3
Rail funding: international experience ....................................................................................................... 24
4
Rail funding: economic principles ................................................................................................................ 27
4.1 Why should metropolitan rail receive public funding? ............................................... 27
4.2 How much funding should metropolitan rail receive? ................................................ 29
4.3 How should public funding for rail be raised? ............................................................ 33
UNDER
4.4 Application of principles .............................................................................................. 39
5
Marginal cost estimation .................................................................................................................................... 41
5.1 Short-run versus long-run measures ........................................................................... 41
5.2 Estimates ...................................................................................................................... 42
6
Externality modelling and estimation ........................................................................................................ 45
6.1 Congestion benefits ..................................................................................................... 46
6.2 Emissions externalities ................................................................................................ 61
INFORMATION
6.3 Agglomeration and competition benefits ................................................................... 64
1982
6.4 Crash and safety benefits ............................................................................................ 65
6.5 Option value benefits ................................................................................................... 67
6.6 Wider social benefits .................................................................................................... 68
6.7 Resilience ...................................................................................................................... 69
6.8 Disturbance externalities ............................................................................................. 70
RELEASED
7
Findings ........................................................................................................................................................................ 72
7.1 Scope of findings.......................................................................................................... 72
7.2 Background ................................................................................................................... 72
7.3 Theoretical concepts and practical limitations ........................................................... 74
7.4 Marginal costs of metropolitan rail ............................................................................. 75
7.5 External benefits of rail ................................................................................................ 76
OFFICIAL
7.6 What is the optimal subsidy for metropolitan rail? .................................................... 81
7.7 How should funding be raised? ................................................................................... 85
8
Recommendations .................................................................................................................................................. 91
8.1 Optimal fare subsidy: Auckland .................................................................................. 91
8.2 Optimal fare subsidy: Wellington ................................................................................ 91
8.3 Source of public funds ................................................................................................. 91
5
link to page 92 link to page 92 link to page 92 link to page 93 link to page 96 link to page 97
8.4 National Farebox Recovery Policy ................................................................................ 92
8.5 Funding assistance rates .............................................................................................. 92
8.6 Economic evaluation manual ....................................................................................... 92
9
References ................................................................................................................................................................... 93
Appendix A: Rationale for government buy-back of rail assets .............................................................. 96
Appendix B: Financial analysis ..................................................................................................................................... 97
THE ACT
UNDER
INFORMATION
1982
RELEASED
OFFICIAL
6
Executive summary
This report describes the economic principles that should be applied when evaluating the optimal level of
public funding for metropolitan rail services. In combination with cost information and transport
modelling provided by the Transport Agency and the relevant councils we have applied these principles to
rail services in Auckland and Wellington. Our analysis generates estimates of the optimal subsidies for rail
in these cities, based on the current configuration of the wider transport network, including other
transport modes (eg buses), ticketing systems used at the time of the research and the continued absence
of efficient road pricing.
ACT
We discuss possible sources of public funding and apply standard tax policy principles to assess the
THE
suitability of several potential revenue instruments. We also outline the policy implications arising from
this analysis.
At a broad level, there is also a policy question regarding the net impact on society of metropolitan rail as a
whole, including all existing network infrastructure and whether public investment is warranted at all.
Answering this would require a full cost-benefit analysis of the different configurations of rail infrastructure
against all reasonable alternatives; however, this was outside the scope of this study.
In any case, the local and central government agencies responsible for rail have committed to funding rail
infrastructure and services for the foreseeable future. Therefore, this report assumes that some form of
UNDER
public funding will continue and takes as given the current and planned future configuration of rail
infrastructure in these Auckland and Wellington.
Economic concepts
Two economic concepts – the marginal costs of services and externalities from usage – are important in
determining the optimal level of public funding for commuter rail.
Ensuring prices for rail services are economically efficient means that, as a starting point, fares should be
based on the marginal (incremental) cost of additional usage. This ensures that trips are only undertaken
INFORMATION
1982
if the value generated by that trip is greater than the marginal cost incurred in facilitating it. However, a
typical consequence of setting fares based on marginal costs is that farebox revenue does not cover the
relatively high fixed costs associated with rail. Some other funding source, for example from central and
local government agencies, is therefore required to meet the shortfall.
An alternative pricing method would be to set fares at the average cost of service. In this case no
RELEASED
additional funding would be required to cover fixed costs. However, fares set at this level could
inefficiently deter usage of rail by some passengers who are willing to pay all of the costs they impose on
the rail system. Since trains will continue to run anyway, all passengers who are willing to pay their
marginal costs should be served, provided capacity exists.
The second important concept is that positive externalities arising from rail usage may justify additional
subsidisation to reduce fares below marginal cost. The primary positive externality from metropolitan rail
OFFICIAL
is reduced traffic congestion, particularly at peak times. Where such positive spillovers exist, fares should
be reduced below marginal costs to encourage greater patronage.
Data limitations and practical constraints
Data limitations and practical constraints can hinder the application of these concepts and affect the estimation
and implementation of efficient fares for rail services. In this regard, there are several factors to consider.
7
Metropolitan rail: external benefits and optimal funding
First, estimates of the marginal costs of rail services are sensitive to the treatment of the large capital
investments currently being undertaken and those planned for the future. Assumptions regarding future
patronage levels also have a material impact on these estimates.
Second, we have assumed that any revenue shortfall arising from marginal-cost pricing is funded from
public subsidies. Other funding options we have disregarded are two-part tariffs and setting fares above
efficient levels (eg average cost pricing). Practical constraints prevent instituting the lump sum
‘connection’ charges on rail users that would be necessary in a two-part tariff. Additionally, although the
demand elasticities for rail services at different times, locations and by different passenger groups are
unknown, we have proceeded on the basis that other revenue instruments, eg property rates, the National
Land Transport Fund (NLTF), would have smaller efficiency costs than higher rail fares. However, should
THE ACT
policymakers not wish to use marginal cost pricing, we have separated out this cost shortfall component.
Third, subsidies reflecting the positive spillovers from rail usage should ideally vary for each individual rail
journey as these externalities are time- and location-specific. However, analysing these effects is highly
complex and there is substantial difficulty implementing this in practice. Therefore we have adopted a
simplified approach and have estimated total annual externalities, with optimal public funding determined
on an aggregate basis.
Fourth, as with funding marginal cost pricing shortfalls, the choice of funding sources for subsidies to
reflect positive externalities of rail should ideally be informed by detailed knowledge of the relative
economic efficiency costs of all possible revenue instruments. However, as this information is not readily
UNDER
available, we have based our conclusions on a more general assessment of a selection of more commonly
used revenue mechanisms.
Additionally, while moves to integrated ticketing could lead to more efficient public transport outcomes
overall, they could also constrain the scope to set efficient prices for individual rail services in isolation.
Similarly, single fares must often be applied to large groups of users despite the fact that the costs and/or
externalities of certain services within these groups may differ considerably. It is also possible that the fares
estimated in this analysis could materially alter future patronage levels from those currently projected. To
more accurately determine the impact of these factors it would be necessary to undertake more complex
INFORMATION
1982
analysis using demand elasticity estimates. However, such analysis was outside the scope of this study. As a
result of these considerations, this analysis provides broad guidance rather than precise, definitive
recommended funding levels and detailed fares.
Summary of findings
Because of the uncertainties outlined above, we have undertaken sensitivity analysis and present our
RELEASED
estimates as broad ranges. Our resulting estimate of the current optimal level of public funding for rail in
Auckland is somewhere between $102 million to $132 million. The corresponding range for Wellington is
$47 million to $85 million.
Our estimate of the long-run marginal cost of services in Auckland is around $4 to $5 per trip. Based on
current patronage, setting fares at this level would result in annual farebox revenue of around $40 million
to $50 million, given total annual costs are around $145 million. This would leave a shortfall of between
OFFICIAL
$95 million to $105 million in unrecovered costs. Additionally, we estimate that the positive externalities
arising from existing rail use in Auckland would justify further subsidisation below marginal cost in the
order of an additional $7 million to $27 million per annum. Given current patronage, this suggests that
total rail subsidies in Auckland should be somewhere in the vicinity of 70% to 91% of total costs. Given
current population levels and the existing configuration and usage patterns of rail and other transport
infrastructure, the midpoint of this range implies an average fare of around $2.60 per trip.
8
Executive summary
In Wellington, setting fares on the basis of marginal costs, estimated at around $4.10 to $5.30 per trip,
would result in a shortfall of around $26 million to $39 million given the total annual cost of operating rail
services is estimated at around $85 million. Additionally, rail usage in Wellington generates annual
external benefits estimated in the order of $21 million to $74 million. This suggests the optimal subsidy
for Wellington is between 55% and 100% of total costs. Given current patronage, the midpoint of this
range would imply an average fare of around $1.70 per trip.
The two main principles that should guide the choice of funding sources for these subsidies are: economic
efficiency and equity (ie fairness). Pursuing economic efficiency implies subsidy funding should be raised
in a manner that imposes the lowest cost on the wider community. The more costly (less efficient) the
funding mechanisms, the less subsidisation is justified. Although we consider that economic efficiency
THE ACT
should be the primary concern when raising public funds, some revenue mechanisms give rise to equity
concerns and may not be politically acceptable. This means that policy makers may wish to trade-off
efficiency and equity concerns to some extent.
Of the funding sources considered, we believe that the most appropriate revenue instruments are property
rates levied by councils, vehicle registration fees, petrol excise and road user charges. We note that
congestion charges (ie road prices) are likely to be a superior method for addressing traffic congestion
externalities and should be considered as an alternative to rail subsidies rather than a funding source.
Impact of population growth and future infrastructure investments
These estimates of optimal fare subsidies are based on a number of factors, including current population, the
UNDER
existing configuration of rail and other transport networks, and current levels of patronage and traffic
congestion. Consequently, if these variables change over time optimal fare subsidies are also likely to change.
This is particularly true in Auckland where patronage is forecast to increase substantially because of
improvements to rail services, restructuring of the bus network, and because of continuing population
growth. Another major factor in Auckland is the proposed City Rail Link (CRL). If the CRL proceeds as
proposed, it would increase both costs and patronage (and associated positive externalities).
Population increases and associated traffic congestion, along with increased patronage from the CRL,
INFORMATION
1982
would likely increase the positive congestion reduction externalities from rail usage. In isolation, this
effect would suggest that average fares should be further reduced below marginal cost by increasing the
level of optimal subsidy. Counter to this, the projected increase in patronage and associated farebox
revenue would, on its own, imply a greater recovery of fixed costs and reduce the optimal subsidy. In the
absence of more detailed modelling, the overall net impact of these effects on the future levels of optimal
subsidisation in Auckland is uncertain.
RELEASED
In contrast, the optimal subsidy for Wellington is likely to be relatively stable over time as its public
transport network is relatively mature and its forecast regional population growth rate is more modest.
Policy implications
The analysis finds that the existing levels of public funding of rail services in Auckland and Wellington are
currently close to the estimated levels for optimal subsidisation. However, optimal subsidy levels may
OFFICIAL
change significantly in the future, particularly in Auckland. In Wellington, where the optimal subsidy is
likely to be relatively stable over time, a higher level of subsidy may be justified because of the relatively
large congestion reduction externalities from rail services.
Current funding sources (property rates and the NLTF) appear to be broadly appropriate, as do the
ongoing changes to funding assistance rates. However, the findings of this study are not necessarily
consistent with the National Farebox Recovery Policy.
9
Metropolitan rail: external benefits and optimal funding
Abstract
This study estimates the optimal level of fare subsidies for metropolitan rail services in Auckland and
Wellington. In so doing it estimates the impact of economically efficient marginal cost-based pricing as
well as the magnitude of the external benefits of metropolitan rail journeys to non-passengers.
The study finds that the primary external benefit from rail usage is reduced traffic congestion, which is
substantial in Wellington. The current levels of subsidisation appear to be close to optimal levels, although
optimal levels may change significantly over time. This is particularly so for Auckland, where significant
changes are expected to the patterns of transport use, population and the wider transport network.
THE ACT
Using the principles of economic efficiency and equity, the study assesses a range of potential funding
sources, including passengers, local ratepayers, users of other transport modes and other mechanisms. It
also outlines the policy implications of its findings for the NZ Transport Agency’s farebox recovery policy,
the funding assistance rate, the review of the
Economic evaluation manual, and the setting of rail fares. A
summary of the recent history of public funding of metropolitan rail is also included.
UNDER
INFORMATION
1982
RELEASED
OFFICIAL
10
1
Introduction
1
Introduction
This study considers the optimal funding of metropolitan rail in New Zealand, including estimating the
level of fare subsidies that are justified by usage externalities. Rail usage externalities are the positive or
negative external impacts that arise from rail usage and are incurred by unrelated third parties (ie by
those other than passengers or rail operators). We were asked to address the following key questions:
• What are the external benefits of metropolitan rail journeys to both rail passengers and non-rail
passengers (eg motorists, the wider community and potentially land developers)?
• What are the appropriate funding contributions from stakeholders (passengers, local ratepayers, users
THE ACT
of other transport modes – through the National Land Transport Fund (NLTF) and other charging
mechanisms – the Crown, and potentially land owners and developers) and from these stakeholders
across time, for the capital and operating requirements of metropolitan rail networks and services?
• What policy principles underpin the choice of funding splits and are there implications for the Crown
entity that is the monopoly track provider?
• What implications does this research have for the NZ Transport Agency’s (Transport Agency’s) farebox
recovery policy, the re-examination of the funding assistance rate, the review of the Transport
Agency’s
Economic evaluation manual (EEM) and the setting of rail fares in Wellington and Auckland?
This chapter outlines the scope of this analysis and discusses the overarching analytical framework for
UNDER
assessing the optimal level of funding for rail.
Chapter 2 briefly outlines the history of metropolitan rail in Auckland and Wellington, in particular the
changes in industry structure and ownership over the previous 20 years. It also outlines the sources of
funding used to cover the costs of this service and the stated rationales for the funding provided by the
various central and local government agencies.
In chapter 3 the allocation of public funding across customers, local government and central government
in New Zealand is compared with selected comparator cities. The various funding mechanisms used
INFORMATION
1982
internationally are briefly outlined.
Chapter 4 outlines the economic concepts and principles that are relevant to the analysis of cost recovery
and cost allocation for metropolitan rail. This chapter outlines the guiding principles that should inform
the choice of revenue instruments used to fund rail subsidies.
Chapter 5 outlines the approach to estimating marginal costs and provides our estimates for Auckland
RELEASED
and Wellington.
Chapter 6 contains the economic modelling and estimation of rail externalities.
Chapter 7 discusses our main findings.
Chapter 8 outlines the policy implications of our analysis and gives recommendations for future study and
analysis.
OFFICIAL
1.1 Scope of analysis
The efficient level of overall public funding for metropolitan rail infrastructure and services depends on
the associated total social costs and total social benefits. Externalities are an important component of
benefits, and are a crucial input into decisions regarding efficient public funding and farebox recovery for
11
Metropolitan rail: external benefits and optimal funding
rail. Metropolitan rail externalities have not been studied in detail in New Zealand and this report helps to
fill that gap.
However, estimating the
total benefits and costs of metropolitan rail and determining the efficient
configuration of rail infrastructure, and hence the level of all public funding, is more complex. This would
involve extensive transport network modelling that is highly context-specific, as well as extensive land use
and property value analysis. That level of analysis is beyond the scope of this report.
The contribution of this report is to estimate economically efficient fares, including externalities arising from
the use of rail services, taking the level of investment in rail infrastructure and other transport modes as
given. Implicitly, the analysis assumes that the capital investment programme has already been analysed
properly; our focus is on pricing and financing decisions that lead to efficient use of the resulting assets.
THE ACT
The cost structure of rail services is also relevant to setting fares. Ensuring the economically efficient
usage of rail requires that fares be set with regard to marginal cost. However, marginal cost pricing
typically results in insufficient farebox revenue to cover the large fixed costs associated with rail. This
means that public funding may be necessary to fund unrecovered fixed costs and generate efficient usage
of the rail assets.
In contrast to fare-related funding decisions, overarching public funding choices regarding the total
investment in rail infrastructure over the long run should be based on full cost-benefit analysis. Such
analysis should consider particular rail projects, or the entire network, relative to suitable alternatives.
This dichotomy is outlined in table 1.1.
UNDER
Table 1.1
Key factors for assessing rail funding decisions
Short run (pricing decisions)
Long run (investment decisions)
What factors should
• Marginal cost of services
• Net total social benefit as
inform decisions on
• Externalities from usage
determined by cost-benefit
public funding?
analysis
What factors should
• The administrative, compliance and economic efficiency costs of
inform how funds should
different funding sources
INFORMATION
1982
be raised?
• Who gains and who loses from rail
This report seeks to answer the following two key questions:
1 How much public subsidisation of fares is warranted in the short run by marginal cost-based pricing of
services along with rail usage externalities?
RELEASED
2 How should the public funds for rail subsidies be raised? Specifically, who should pay and what
revenue instrument/s should be used?
In answering these questions it is also important to distinguish between the different time horizons over
which these questions may apply. Our analysis focuses on the current situation and asks: what is the size
of the externalities given existing transport usage patterns, service frequencies and the current road and
rail network configurations? However, given the expected demographic changes in Auckland, we have also
OFFICIAL
explored the potential impact on externalities of Auckland’s forecast population growth.
In addition, we summarise the general principles for determining who should pay for the public funding of
rail; these principles arise from considerations of economic efficiency and equity. They apply whether
subsidies are required for short-term efficient fare setting or for funding long-term investments, such as
new infrastructure.
12
link to page 7
1
Introduction
Economic efficiency is important because the less efficient the methods used to raise funds (ie greater the
costs of gathering revenue), the less subsidisation is justified. This suggests that any subsidies should be
funded using the most efficient instrument possible. Equity is important because if a particular funding
mechanism is considered to be fair by the wider community, including those required to pay, compliance
is likely to be higher and the funding mechanism will be more politically sustainable.
1.2 Analytical framework
In this report we take as a starting point the assumption that existing and planned metropolitan rail
infrastructure will remain in place in Auckland and Wellington and that these rail services will continue. We
ACT
also take as given: the structure of the road network (both the current structure and confirmed future
THE
investments); the absence of efficient road pricing (congestion charging); and the current structure and
pricing of other modes, such as buses and ferries. It is possible that changes to other modes could have
an impact on the optimal subsidisation of rail. Such changes could include alterations to levels of public
investment, subsidies and pricing, or modifications to network structures and services.
1 However, it is
beyond the scope of this study to consider all such future possibilities.
Although we discuss some of the wider benefits of metropolitan rail, we have not undertaken a complete
cost-benefit analysis of rail as this is outside of our scope. Instead, from our starting point of current rail
infrastructure we focus on the policy rationale for on-going public subsidisation of fares. The two main
elements of this analysis are:
UNDER
1 Marginal cost-based pricing of fares and the cost structure of rail services
2 The presence of externalities arising from rail.
1.2.
1 Marginal cost-based pricing
In general, ensuring the optimal (economically efficient) level of consumption of a good or service requires
the price to be set equal to the marginal cost of production. For rail, this implies that fares should be set
equal to the marginal cost of services to ensure that the amount paid in fares by additional users covers
INFORMATION
1982
the incremental cost of providing those services. However, the cost structure of rail involves relatively high
fixed costs and low variable costs. This means that fares set at marginal cost will generate insufficient fare
revenue to cover total costs. This shortfall will therefore require some level of public funding, assuming
that total social benefits of rail exceed total costs.
In other sectors with similar cost structures, ‘two-part tariffs’ are often used to establish efficient prices
for usage as well as recover fixed costs. Examples include water and electricity, where marginal costs are
RELEASED
typically recovered via per unit prices for usage, with fixed costs being recovered using lump-sum
connection and monthly or annual fees. We assume that such an approach cannot be replicated with rail
because it is not practical to apply either some form of ‘connection’ charge or monthly fixed fee for rail
use. As a result, our analysis assumes that public funding would be used the cover the resulting shortfall
brought about by marginal cost pricing.
OFFICIAL
A further complication regarding the setting of fares is the expected move to integrated public transport
ticketing. As public transport services become more integrated, accurately separating out fare revenue
from different modes will become more difficult, as will estimating appropriate cost-based figures upon
1 For instance, Auckland Transport is currently in the process of reviewing the wider public transport system with a view
to creating an integrated rapid transit network which would eliminate existing duplication between modes.
13
Metropolitan rail: external benefits and optimal funding
which to establish fares. Eventually it may be necessary to model the costs, benefits and externalities of
the public transport system as a whole, rather than focusing on component parts.
1.2.
2 Externalities
The presence of positive externalities associated with the consumption of a good or service can lead to
market failure resulting in inefficiently low or high consumption. Positive externalities may be corrected by
subsidising the product in question, provided the costs of subsidisation (eg the cost of raising funds and
administering payments) do not exceed the external benefits of increased consumption. Rail subsidies can
be used to reduce fares and thus increase patronage to an efficient level to take account of positive
externalities.
THE ACT
Ideally, subsidies should be applied to individual rail journeys that reflect the size of the relevant
externalities that each trip generates. The resulting fares would then accurately signal all of the social
opportunity costs and benefits and ensure these impacts are correctly ‘internalised’ by rail users on a per-
trip basis.
However, because the positive externalities generated by rail vary according to the time of day and
specific location, correctly internalising these would also require subsidies to be both time- and location-
specific, which would be impractical. Instead, we have adopted a simplified approach in which we estimate
total annual externalities and derive the implications for fares on an averaged basis.
1.2.
3 Externalities and rail usage UNDER
A number of the externalities associated with rail are strongly correlated with usage. These include
reduced road congestion, emissions, crashes and agglomeration benefits.
In contrast, other external impacts of rail are not as strongly correlated with patronage. Externalities such as
option value benefits, social connectivity benefits and negative noise disturbance effects are more closely
related with the frequency, location and timing of rail services, rather than the degree to which these
services are utilised. Transport network resilience benefits have even less correlation with patronage and
instead depend more on the state of network infrastructure and its overall capacity and readiness for use.
INFORMATION
1982
Consequently, it is less clear whether this latter group of externalities should be internalised by way of
fare subsidies. It is arguably more efficient for these impacts to be reflected in lump sum contributions
towards the fixed costs of rail. This lump sum approach would be valid if the frequency of rail services is
relatively fixed in the short run and these externalities do not vary with patronage.
However, over time, changes in patronage probably do influence service frequency and therefore impact
RELEASED
on the magnitude of these externalities. This supports the view that these impacts should be incorporated
into fare subsidies. Operationally, this means aligning fares with long-run marginal costs, so that most
costs incurred in increasing service and network capacity are treated as variable with respect to patronage.
1.2.
4 Direct user benefits
Rail users derive direct use benefits (consumer surplus) from their use of rail services. These surpluses are
OFFICIAL
the net difference between the total value users obtain from rail journeys less the amount they pay in
fares. Over time, some of these direct use benefits are likely to be capitalised into the value of properties
close to the rail network. This is because property prices are bid up by those who value the use of rail.
This impact is relevant in determining the overall total social benefit of rail and should be a component of a
full social cost-benefit analysis of any potential rail investment. However, because this impact accrues
14
link to page 13
1
Introduction
(initially) directly to the users of rail, it does not constitute an externality. Consequently, this impact does not
justify the direct subsidisation of fares, though it may justify greater total investment in rail infrastructure.
In the absence of readily available data regarding both property values and property characteristics we
have not attempted to estimate direct user benefits.
1.3 Limitations
Although the overarching analytical framework for this study is relatively straightforward, there are a
number of constraints that prevent the analysis from providing highly precise detailed estimates. For
instance, there is an absence of extensive data and information in relation to aspects such as demand
THE ACT
elasticities for rail services, which are likely to vary at different times, locations and by different groups of
users. This makes it difficult to assess the impacts on patronage of changes to subsidies and fares to a
high level of precision, ie on a time- or route-specific basis.
There is also a degree of uncertainty regarding future rail system costs. This means that the estimates of
marginal costs in this report should be considered as approximate estimates rather than precise
calculations. Furthermore, there is an absence of detailed information regarding the relative economic
efficiency costs of the multitude of different methods of raising revenue.
Additionally, this analysis has been based on the wider transport networks in Auckland and Wellington,
either as they are currently structured or as they will be structured given confirmed future investments.
UNDER
Because there remains some uncertainty regarding the City Rail Link in Auckland, which has been
announced but for which funding has yet to be confirmed, we have added this as a separate scenario.
Other likely future changes to these networks and public transport services are also currently unknown.
This is particularly the case in Auckland, where the wider public transport network is currently being
reviewed by Auckland Transport.
2 Because it is not possible to predict with certainty all future changes to
these other transport modes, both in terms of services and prices, this analysis is based on the current
state of the wider transport network unless otherwise stated.
Consequently, this analysis should be viewed as providing broad guidance rather than precise, definitive
INFORMATION
1982
policy prescriptions.
RELEASED
OFFICIAL
2 See: www.aucklandtransport.govt.nz/improving-transport/new-network/Pages/default.aspx.
15
Metropolitan rail: external benefits and optimal funding
2
Metropolitan rail in New Zealand
This chapter outlines the industry structure of metropolitan rail services in Auckland and Wellington and
current funding arrangements. It also briefly outlines the history of the rail sector more generally, with a
particular focus on stated rationales provided for the major funding decisions by the various public sector
organisations over the previous 15 to 20 years.
2.1 Industry structure
There are two main physical components of urban passenger services:
THE ACT
1 The network infrastructure (track and stations)
2 Carriages (rolling stock).
These two separate assets may be owned by different organisations or may be owned by a single vertically
integrated organisation. Similarly, the services provided using these assets: rail network access and
timetabled passenger services respectively, may in turn be operated either by the asset owners themselves
or may be provided under contract by independent parties.
In addition to these two main services, there are a number of ancillary services that also may or may not
be vertically integrated. These include train control/signalling, ticketing and sales, security (either on
UNDER
board or at stations), repairs and maintenance, cleaning etc.
2.1.
1 Cost structure
A large proportion of the costs of metropolitan rail are fixed. Given relatively high fixed costs and low
variable costs, rail services display economies of scale. Fixed costs arise from capital expenditures
including:
• track building, track maintenance (ie renewals) and track upgrades (eg electrification)
INFORMATION
1982
• establishing and/or upgrading train stations
• the purchase of rolling stock
• design and implementation of ticketing systems.
Variable costs (operating expenditure) include:
RELEASED
• staffing costs, eg train drivers and conductors
• fuel or electricity.
2.1.
2 Cost recovery
The funding to cover urban commuter rail costs is typically sourced from several parties, including rail
users (farebox revenue), local government (rates) and central government (taxation).
OFFICIAL
Within New Zealand, funding from central government agencies is further segregated into that sourced
from:
• general tax revenue, typically used to fund one-off contributions towards specific capital items (eg
new rolling stock or track network upgrades)
16
link to page 15
2
Metropolitan rail in New Zealand
• transport specific taxes (petrol excise, road user charges and registration fees), which contribute to
the NLTF as administered by the Transport Agency.
2.2 Auckland
The Auckland rail network consists of approximately 100 route km of track with 38 stations across three
lines. Although patronage has dipped slightly since the Rugby World Cup in 2011, the overall passenger
volumes in Auckland have grown fivefold in little over a decade. Total journeys in the year to November
2013 numbered 10.5 million. The substantial growth has been forecast to continue, with around 19
million journeys expected in 2020.
THE ACT
Although the Auckland rail network is owned and operated by KiwiRail, passenger services are operated
under contract to Auckland Transport by Transdev Auckland Limited, a subsidiary of the multi-national
Transdev Australasia group.
The diesel carriages and diesel multiple units currently used to provide passenger services are owned by
Auckland Transport, while the locomotives which haul the carriage trains are owned by KiwiRail and leased
to Auckland Transport. The electrical multiple units (EMUs) that are to replace the current rolling stock
from 2014 will be owned by Auckland Transport.
Table 2.1
Operating costs and farebox recovery for Auckland, 2011/12
Item
UNDER
Total operating costs
$104.7m
Annual journeys
10.9m
Average journey length, km
15.2
Average revenue per journey
$2.58
Average subsidy per journey
$7.03
The total operating cost of urban rail services in Auckland in the 2011/12 financial year was estimated at
INFORMATION
1982
around $105 million.
3 Farebox recovery was 26.8%. In 2012, 60% of this shortfall was sourced from the
Transport Agency with the remainder coming from Auckland Council, although this proportion is being
gradually reduced to 50% from 2013.
2.3 Wellington
RELEASED
The Wellington rail network consists of approximately 175 route kilometres covering 49 stations across
five lines. There are over 11 million passenger journeys per year.
The rail network in Wellington, as across New Zealand, is owned by the government-owned New Zealand
Railways Corporation, now trading as KiwiRail Group. KiwiRail Network, a division of KiwiRail, maintains
and upgrades the network and is responsible for control of the network (ie train control and signalling).
The costs of providing these network services are recovered through track access charges.
OFFICIAL
KiwiRail also operates the passenger services via its subsidiary Tranz Metro. These services are provided
under contract to Greater Wellington Regional Council. This contract is set to expire in 2016. In 2011 the
3 As with Wellington, this estimate may include some element of fixed capital costs. Consequently, direct comparisons
between farebox recovery of operating costs may not be strictly accurate.
17
link to page 17
Metropolitan rail: external benefits and optimal funding
assets of Tranz Metro, which included the rolling stock (largely EMUs) and station buildings, were
transferred from KiwiRail to the Greater Wellington subsidiary, Greater Wellington Rail Limited. There is
also a small number of diesel electric locomotives used to haul passenger carriages on the Wairarapa line
although these are owned by KiwiRail, not Greater Wellington.
The total operating costs of passenger rail services in the 2011/12 financial year were estimated at around
$77 million.
4 Farebox recovery was 51.5%. Currently 60% of this shortfall is sourced from the Transport
Agency with the remainder coming from Greater Wellington, although this proportion is gradually being
reduced to 50% from 2013. Total expenditure on improvements to Wellington’s rail system has increased
steadily from $24 million in 2007 to $129.7 million in 2012.
Table 2.2
Operating costs and farebox recovery for Wellington, 2011/12
THE ACT
Item
Total operating costs
$76.6m
Annual journeys
11.3m
Average journey length, km
23.8
Average revenue per journey
$3.51
Average subsidy per journey
$3.31
2.4
UNDER
History of rail in New Zealand
The first rail lines were built in New Zealand by various provincial governments from 1863. These were
purchased by the central government in the 1870s and run by the Ministry of Works until 1880. The few
privately established lines were bought by the government, with the Wellington and Manawatu Railway
Company being the only successful private firm until it was nationalised in 1908.
From 1880 railways were operated chiefly by the New Zealand Railways Department (also known as New
Zealand Government Railways) for just over 100 years. In 1982 the Railways Department was corporatised
INFORMATION
1982
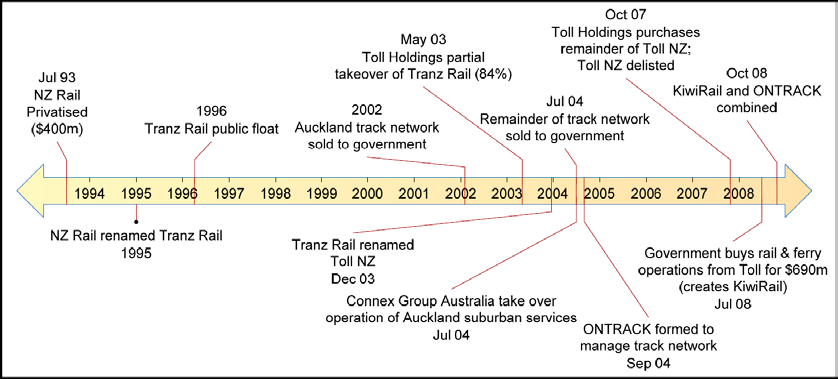
and became the New Zealand Railways Corporation. In 1990 New Zealand Rail Limited, a state owned
enterprise, was established to run core rail operations. It was then sold to a private consortium for $400
million in 1993. This sale and the subsequent changes in ownership are outlined in figure 2.1 and the
following sections.
After privatisation New Zealand Rail Limited changed its name to Tranz Rail in 1995. The rationale for
privatisation was that the rail sector would be more productive in private ownership (ISCR 1999). One
RELEASED
subsequent analysis has suggested that the productivity of rail increased after privatisation and that the
government (and taxpayers) gained the most from privatisation because of the elimination of the
subsidisation of losses that occurred under public ownership (ISCR 1999). This analysis also found that
revenue exceeded operating costs for the period 1994 to 1997 but was insufficient to cover capital costs.
OFFICIAL
4 This estimate may include some proportion of fixed capital costs. There does not appear to be a standard, industry-
wide definition of precisely which cost components constitute operating costs.
18
2
Metropolitan rail in New Zealand
Figure 2.1
Timeline 2003–2008
THE ACT
Source: ISCR (2009)
2.4.
1 Re-nationalisation
Since 2002, the government has gradually bought back various components of the rail system from
private owners. The Auckland metropolitan rail network was bought back from Tranz Rail in 2002 for
UNDER
$81m. Around this time Tranz Rail had also decided not to re-tender for the operation of Auckland’s
commuter rail system. Ownership of these track assets was transferred to state-owned enterprise
New Zealand Railways Corporation, which was re-named ONTRACK. Auckland Regional Council took over
responsibility for the operation of the commuter trains. These operations have been contracted out to
Connex (since re-named Veolia and subsequently Transdev) since 2004 having previously been undertaken
by Tranz Rail.
Tranz Rail was then re-named Toll NZ after Toll Holdings took over majority ownership in the company,
obtaining an 84% stake in 2003.
INFORMATION
1982
The Crown purchased the remainder of the track network in 2004, including the Wellington urban
network. In 2008 it undertook an almost complete buy back of the rail (and ferry) operations of Toll NZ for
$690m. These were then combined with ONTRACK and rebranded as KiwiRail. The government then
invested $200m over five years to restore and upgrade the network (MoT 2005).
An outline of the rationale for the re-nationalisation of rail is provided in appendix A.
RELEASED
2.4.
2 Public funding of urban rail
Central and local governments have long contributed funding for various aspects of Auckland and
Wellington’s urban rail services. The operating costs of urban passenger rail in both Wellington and
Auckland that are not covered by farebox revenue have typically been funded jointly by:
• regional councils, from rates and other council revenue
OFFICIAL
• the Transport Agency, with funds from the NLTF.
The split between funding from these two groups in recent years has been set at 60% from the Transport
Agency and 40% from councils, although this ratio is gradually being reduced down to an even 50:50 split.
Auckland Transport’s annual track access charge to KiwiRail for use of the network is also partly
subsidised by the Transport Agency. Prior to 2012 the track access charge for Auckland Transport was
19
Metropolitan rail: external benefits and optimal funding
around $4.7 million. Under a new agreement it is now around $12 million to $14 million per year and is
set to rise further once maintenance and renewal of the traction system is incorporated in the near future.
Similarly, track access charges in Wellington are paid to KiwiRail under a track access agreement. These
charges total around $16 million per year and cover network maintenance, train control, incident services
and renewals.
As well as funding to cover operating costs, both regional councils and the Transport Agency have
contributed towards capital expenditure, including rolling stock for urban rail passenger transport and
fixed urban rail passenger network infrastructure (track and station upgrades). Additionally, the Crown
has made a number of sizeable contributions towards capital improvements since it began buying back
the rail system in the early 2000s.
THE ACT
In particular, the Crown has funded specific national rail infrastructure projects through appropriations to
ONTRACK (now KiwiRail Network). This has been justified on public policy grounds with Ministers, advised
by the Ministry of Transport, determining the level and direction of funding. Loans were also provided to
develop commercial projects and property and to promote the use of rail.
The government has also provided capital funding for the Developing Auckland’s Rail Transport project.
The 2006 budget included $600 million of funding for specified rail infrastructure improvements. These
projects, including increased double tracking to improve capacity and the upgrade of several stations,
have largely been completed.
Funding of $500 million for the purchase of EMUs and construction of the EMU depot as part of the
UNDER
Auckland electrification project has in the first instance been provided by way of a government loan along
with a grant of $90 million. Auckland Council and the Transport Agency will jointly repay this loan, with
the Transport Agency initially contributing 60% of the costs of repayment with this contribution reducing
to 50% on an annual 1% glide path starting from the 2012/13 financial year.
In Wellington, the bulk of the $640 million spent on the purchase of EMUs and the upgrade of the metro
rail network was provided either via the Transport Agency or directly from the Crown. This includes $88
million in government funding to renew signalling and traction assets announced in 2011 (MoT 2013b;
2013c). In relation to capital expenditure on rolling stock, around 10% of the cost has been funded by
INFORMATION
1982
Greater Wellington.
2.4.
3 Rationales provided for public funding
In relation to both on-going financial support to cover operating costs as well as contributions to one-off
capital expenditures, subsidies provided by local and central government to urban passenger rail are
RELEASED
typically justified on the basis that increased rail usage will reduce congestion on roads. That is,
commuter rail generates positive externalities to (many, but not all) road users that are not reflected in
what private rail commuters are willing to pay.
Other potential spillover benefits from rail that have been used to justify public funding include improved
public health outcomes from reduced vehicle crashes and improved environmental outcomes from
reduced emissions.
OFFICIAL
Social objectives are also used as a rationale for public funding. In particular, greater public transportation
options may be considered desirable for those with limited access to private transport.
In the
National rail strategy to 2015 (MoT 2005), the government outlined a number of wider objectives of
the New Zealand transport system, these being:
• assisting economic development
20
2
Metropolitan rail in New Zealand
• assisting safety and personal security
• improving access and mobility
• protecting and promoting public health
• ensuring environmental sustainability.
The National Rail Strategy referenced the 2005 Booze Allen report
Surface transport costs and charges:
In 2002 the Ministry of Transport commissioned an Investigation into surface transport costs
and charges (STCC). This study examined the relationship between the costs (including
economic, social, and environmental costs) of the use of road and rail transport and the ACT
payments users make for using each mode. The findings of the study were that:
THE
•
the charges paid by road and rail users do not cover the costs of those networks, and that some
costs are not paid by anyone at all
•
rail users pay a higher proportion of their costs than road users
•
users of urban local roads pay a lower proportion of costs than users of rural roads
•
in many cases the costs of remedying a problem (eg congestion) are much lower than the cost
of the problem itself.
In the strategy, the government stated that encouraging more use of urban rail was a priority. Specifically:
UNDER
Greater use of passenger transport, including urban rail services (at present Auckland and
Wellington only) can enhance access and mobility and help to reduce road congestion on busy
corridors. A particular aim is to attract peak-hour car drivers onto rail. Removing a
proportion of cars from congested traffic can have a disproportionately beneficial effect on
congestion because of the non-linear nature of traffic flow.
Consequently, the government outlined that it would provide funding assistance, both directly and
through Land Transport NZ (now the Transport Agency), to develop urban passenger rail services in
Wellington and Auckland, by providing:
INFORMATION
1982
• 60% of the cost of operating subsidies to passenger transport services
• funding assistance for improvements to, and replacement of, rolling stock
• funding support for infrastructure upgrades to increase the capacity and reliability of their urban
passenger networks
RELEASED
• funding assistance for activities that focus on transferring car commuters to rail or bus services, such
as integrated ticketing and ‘park and ride’ facilities.
The government’s recent funding of upgrades to Auckland’s rail network has been justified on the
existence of a range of benefits (MoT 2013a):
The benefits include:
OFFICIAL
•
securing a sustainable funding and ownership partnership agreement for 10-minute frequent,
fast and reliable all-electric purpose-designed train services for Auckland from 2013
•
costs shared fairly between government and Auckland Council/Auckland Transport
•
longer term cost savings from lower maintenance and operating costs for an all-electric fleet
21
Metropolitan rail: external benefits and optimal funding
•
clearly defined roles and responsibilities for the delivery and operation of the region’s rail
services
•
more flexibility for the region in deciding how it runs services because of electric fleet operating
across the network
•
more people using rail because of improved services
•
benefits to road users from reduced congestion on the road network
•
KiwiRail being able to focus on its core freight business and network system operation
•
fully realise the benefits of government and regional investment in signalling, track, station and
ACT
other system improvements
THE
•
environmental benefits from an all-electric fleet including less noise and air pollution”
In the Wellington Regional Rail Plan, developed by Greater Wellington in collaboration with KiwiRail, the
Transport Agency and the Ministry of Transport, economic benefits of further expenditure on rail were
calculated in accordance with the EEM. As well as private benefits for rail users, including reduced travel
times, improved reliability and less crowding, a number of external benefits for non-users were estimated.
These included reductions in:
• congestion
• local air quality
UNDER
• greenhouse gases
• crashes
• noise
• road damage.
Given the likely impact on car use, the bottom two impacts were considered to be insignificant, with
congestion reduction having by far the largest estimated impact, accounting for approximately 90% of the
INFORMATION
1982
total.
The Wellington Regional Rail Plan also identified agglomeration benefits that could arise from increased
urban rail usage. Agglomeration benefits arise from intensification in urban centres which allows firms to
locate in a cluster. The resulting high density of working populations can allow greater economies of
scale, network effects and knowledge transfer and reduce transaction costs. These impacts can lead to
RELEASED
wider economic benefits.
2.4.
4 Allocation of public funding across central and local government
Although it contributed over $2 billion to metropolitan rail in both regions over the past decade, the
government has more recently stated (MoT 2013b):
Longer term, a fairer share of the costs of the metro rail networks should be borne by the
OFFICIAL
passengers who use the services, the regional councils who are responsible for providing
public transport services to their ratepayers and the NZTA who subsidises public transport
activities in New Zealand on behalf of the Crown.
The government’s expectation is that this will lead to councils’ contributions and fare prices increasing
over time, although these increases should be gradual in nature.
22
link to page 18
2
Metropolitan rail in New Zealand
Regarding the allocation of funding across different sources, the Treasury (2009) has previously stated
that:
•
If the benefits from a rail project accrue to road users, or road owners (which are mostly
internalised to road users by the road user charges systems), then the NLTF should be used to
provide the funding assistance (contributed by road users).
•
If the benefits are mainly to society in general (eg reductions in environmental impacts such as
CO and noise, or road accident costs not covered by ACC levies), then the funding assistance
2
should be from a general appropriation (contributed by taxpayers).5
2.5 Summary
THE ACT
Over the previous 20 years there have been substantial changes in the rail sector, including both in
ownership of different aspects of the sector and in relation to the amount spent on maintaining and
upgrading the rail network and providing services.
A number of the major funding decisions by central and local government agencies appear to have been
made on an ad-hoc basis. The current funding arrangements in both Auckland and Wellington involve an
array of different parties responsible for funding different types of expenditure (ie operating versus capital
costs). These arrangements appear to be the net result of a set of incrementally determined changes over
a long period of time. It is not clear whether the net result is consistent with a principle-driven analysis.
UNDER
INFORMATION
1982
RELEASED
OFFICIAL
5 In principle, a calibrated ‘general equilibrium’ economic model could be used to estimate the distribution of benefits
across these two types.
23
Metropolitan rail: external benefits and optimal funding
3
Rail funding: international experience
In reviewing the approaches used in various comparator jurisdictions for funding metropolitan rail
systems, we have focused on cities that are broadly similar in size to Auckland where there is an existing
rail system (including light rail), and for which we were able to obtain sufficient information about funding
(table 3.1). Wellington is also included despite having a significantly smaller population than the
comparator cities. Wellington’s geography and population layout mean that it is relatively unique in having
a rail network that serves such a small population. Consequently it is difficult to find cities with a similar
population to Wellington that have metropolitan rail systems.
ACT
Table 3.1
Comparator cities
THE
City
Estimated population Metro rail track km
Total trips 2011 (m)
Trips per capita per
2012 (m)
annum
Sydney
4.6
815
300
65
Vancouver
2.4
378
120
50
Brisbane
2.0
380
50
25
Perth
1.7
173
63
37
Barcelona
1.6
125
435
272
Phoenix
1.6
32
10
6
UNDER
Auckland
1.5
100
10
7
San Diego
1.3
93
33
25
Adelaide
1.2
126
64
53
Wellington
0.4
175
11
28
Differences in ownership structure across these jurisdictions make it difficult to compare metropolitan rail
funding on a consistent basis. In many cases, the same authority or corporation operates rail and bus
INFORMATION
public transport services, and publically available funding information is not separated by mode. In other
1982
cases, rail services are provided by one entity while infrastructure is provided by another. Finally, in some
cases debt is used to finance infrastructure investment and operating losses, for one or more transport
modes, and it is not always apparent how the debt funding is being applied.
For these reasons, the following case studies should be taken as a rough guide only to the types of rail
funding arrangements used in other cities. To facilitate comparisons, we have calculated two indicators:
RELEASED
1 The distribution of public transport revenues across fares and user charges, local and central
government subsidies, and other sources (eg advertising)
2 The ratio of liabilities to total assets for the rail infrastructure provider.
Indicator 1 gives a broad overview of funding sources, particularly the split between fare revenues and
subsidies. Indicator 2 will generally reflect the extent to which debt is used to finance infrastructure and
OFFICIAL
working capital, ie it will reflect financing arrangements. We used public annual reports for the most
recently available financial year. Some potential benchmark cities (such as Melbourne) could not be
included due to a lack of published detail about funding.
The results of this analysis are shown in table 3.2. A variety of approaches to rail funding are used
internationally. In most cases, around 20% to 30% of revenue comes from fares, with the remainder largely
24
3
Rail funding: international experience
derived from local and central government subsidies. There is no clear pattern for the split of funding
between local and central government.
Table 3.2
Cost allocation in selected comparator cities
City
Operator
Fares
Central
State or
Taxes Other
Services
Ratio of
Rail type
and user govern-
local
liabilities
charges
ment
govern-
to total
subsidies
ment
assets
subsidies
Perth
Transperth
17%
76%
7%
Bus, rail,
26%
Commuter
ferry
rail
THE ACT
Adelaide
Adelaide Metro
29%
71%
Bus, rail
2%
Commuter
rail
Brisbane
TransLink
25%
75%
1%
Bus, rail,
28%
Commuter
ferry
rail
Barcelona
TMB
46%
50%
4%
Rail
66%
Rapid transit
Phoenix
Valley Metro
33%
1%
63%
3%
Rail
6%
Light rail
San Diego
MTS
32%
18%
35%
15%
Bus, rail,
16%
Light rail
ferry
Vancouver TransLink
34%
6%
52%
8%
Bus, rail
98%
Elevated rapid
UNDER
transit
Sydney
RailCorp
27%
62%
12%
Rail
9%
Commuter
rail
The ‘other’ category includes revenue from advertising on trains and in stations. In some cases,
advertising appears to be a small but not trivial source of revenue, although we do not have the
breakdown of this category into advertising and other sources.
Vancouver differs from the others in that a specific parking tax is levied in the city, with the revenue used
INFORMATION
specifically to fund metro rail services.
1982
Other types of funding instrument which are occasionally utilised are land value capture mechanisms. This
reflects the fact that the benefits of metropolitan rail services accrue partly to the owners of properties
located close to railway stations. In particular, if rail services generate benefits to nearby users which are
over and above what users pay in the form of fares, there is a ‘net benefit’ to these users referred to as a
consumer surplus. Through the workings of residential property markets, some or all of this potential
RELEASED
consumer surplus to users is capitalised into the value of the properties close to train stations in the form
of property price increases.
Similarly, businesses located next to stations may benefit from improved rail services, particularly if there
is an increased volume of customers. Increased profitability for these businesses would be likely to, in
turn, result in increased commercial property rentals for landlords, and correspondingly into higher
property prices, as these locations become more valuable.
OFFICIAL
In response to these effects, some municipal authorities in other jurisdictions have attempted to tax this gain
through a mechanism referred to as land value capture. An example of land value capture includes funding
the London CrossRail. This is a 120km railway that will pass under central London and link regions to the
east and west of the city. It is currently under construction and planned for completion in 2018.
25
Metropolitan rail: external benefits and optimal funding
The CrossRail project has an overall cost of around £16 billion (NZ$30 billion). To assist with the funding
for this project a business rate supplement was levied on non-domestic properties within the greater
London area with a value greater than £55,000 (NZ$104,000). This additional rate was imposed from April
2010 and will be used to finance around a quarter of the total cost (£4 billion). The size of the additional
business rate supplement depends on the location of the relevant borough. Boroughs that have stations
face an additional 2% rate, those without stations but adjacent to those that do will face 1.5%, while those
further away from stations will face a 1% rate.
Another example of land value capture includes the development of Arlington Heights, a Chicago suburb
which was rebuilt around a commuter rail station. This development was partially funded by property
taxes collected from the resulting urban growth.
THE ACT
A more unique instance of land value capture is the case of Hong Kong. The Hong Kong Government was
able to raise a significant amount of funding for its metro system by capturing the economic rents from
nationalised land. In Hong Kong all land is state property. The government is able to lease this land to
private parties through its land contracting system. This has allowed the state to capture much of the
value created by the metro system, including via rental income from retail areas in train stations,
advertising in trains and stations, and the development of residential property and through its ownership
of shopping centres and offices located near the rail network.
Within New Zealand, land value capture has not been used as a funding instrument for rail infrastructure
or services, but similar mechanisms are used to recover other infrastructure or service costs. For instance,
UNDER
development contributions levied by councils are used to recover additional costs caused by new
residential developments. Similarly, in response to on-going coastal erosion in Haumoana, the Hawke’s
Bay District Council proposed to apply targeted rates to properties that would benefit from the erection of
an erosion protection structure. The proposed targeted rates were intended to recover the costs of
constructing groynes to prevent erosion, with those properties that would obtain the largest (most
immediate) benefits facing higher rates.
INFORMATION
1982
RELEASED
OFFICIAL
26
link to page 39 link to page 23 link to page 27
4
Rail funding: economic principles
4
Rail funding: economic principles
The application of economic concepts and principles to metropolitan rail, as well as the consideration of
potential equity issues, can assist in answering several important questions:
1 Why should metropolitan rail receive public funding?
2 How much funding should it receive?
3 How should these funds be raised?
In this chapter we address these fundamental questions. We begin in section 4.1 by considering the
THE ACT
market failure justification for intervention. We then discuss the estimation of efficient costs in section 4.2
and consider how these might be recovered and from whom in section 4.3. This analysis is drawn together
in section
4.4 where we derive general principles that should guide the funding of metropolitan rail in New
Zealand.
4.1 Why should metropolitan rail receive public funding?
Metropolitan rail services are subject to two types of market failure, one relating to externalities and the
other to natural monopolies and market power. Either of these market failures may justify some form of
policy intervention including public subsidisation.
UNDER
One form of market failure arises from a set of spill-over, or ‘externality’ effects that arise from both rail
usage specifically and from rail services more generally. For instance, users of rail services confer benefits
on road users by reducing road traffic volumes and congestion, and therefore reducing the costs of
congestion. Use of rail instead of roads may also reduce pollution and road crashes, conferring
environmental and public health benefits on the general population. Likewise, agglomeration benefits
from rail use may generate benefits to businesses from increased productivity.
External benefits may also arise from the provision of rail services more generally. For instance,
INFORMATION
individuals may place a positive value on the option of having access to rail services even if they do not
1982
use these services. Some individuals may also value the existence of rail services on the basis of aesthetics
or other personal preferences.
6 Other external benefits that may flow from rail include increased transport
network resilience and social connectivity benefits to the extent that disadvantaged members of society
are able to have access to more lower-cost transport options.
The magnitude of spill-over effects may be considerable. Although not directly relevant to the estimates of
RELEASED
rail benefits, previous studies have suggested that the region-wide cost of all traffic congestion in
Auckland may be as high as $1.25 billion per year, or $800 per person (Wallis and Lupton 2013).
7
Although the external benefits of rail are unlikely to be in this order of magnitude, rail may nevertheless
assist with alleviating some proportion of these costs.
OFFICIAL
6 Some individuals may value trains and rail services even if they do not use them, such as ‘train spotters’ or others who
may have strong preferences for the existence of rail, potentially because of environmental or social beliefs and
because of distaste for private vehicle use.
7 This estimate is based on a zero-congestion, free-flowing comparator scenario. If assessed against a scenario of the
network at full capacity, the cost of congestion is estimated at $250 million. Previous studies by Ernst and Young
(1997) and Booze Allen Hamilton (2004) estimated costs in current dollars of $830 million and $1 billion respectively.
27
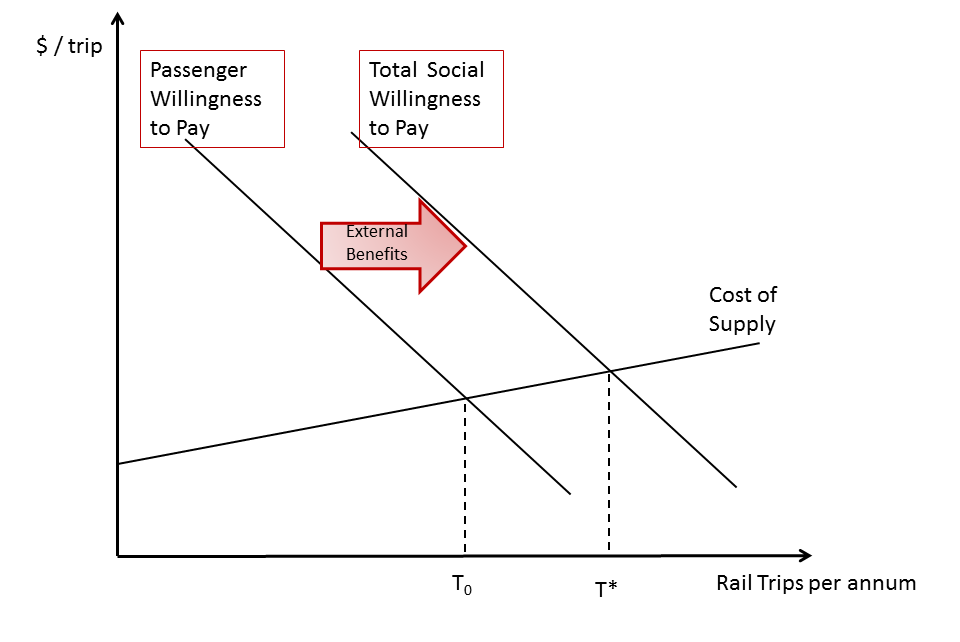
Metropolitan rail: external benefits and optimal funding
In analysing these market failures and determining policy responses to them, it is important to distinguish
between genuine externalities, which occur when impacts are not priced in a market, and so-called
‘pecuniary’ externalities which are less important from an economic efficiency standpoint. For example, if
road usage were priced in a reasonably efficient market (eg using congestion pricing), rail usage would affect
the prices in that market but the effect would be a pecuniary one (ie congestion charges may go up or down
depending on rail usage).
Similarly, building new rail infrastructure and/or providing new services may increase the values of nearby
properties. However, with the exception of any option value benefits, this increase is a consequence of the
property market working to distribute the benefits of rail between property owners and others. The
increase in property values reflects the benefits of rail that are attained by land owners.
THE ACT
The natural monopoly features of metropolitan rail networks are the source of the other form of market
failure, ie it is inefficient (from a cost perspective) to duplicate the network of tracks and stations.
However, a monopoly owner of tracks and stations may charge excessive prices for these services. In
contrast, the ability for rail services to be awarded via competitive tender processes means that these
services do not necessarily generate the same market power issues.
These market failures mean that metropolitan rail services are generally not provided on a fully
commercial basis, either in New Zealand (as discussed in chapter 2) or in other countries (as discussed in
chapter 3).
Thus there is an economic efficiency rationale for some form of government involvement to address the
UNDER
spill-over benefits that rail delivers to non-passengers (eg motorists). In particular, since the social
benefits of rail usage exceed the private benefits to rail passengers, usage of rail services at market prices
will be below the level that maximises total welfare. Intervention may also be necessary to guard against
monopoly pricing for tracks and stations and/or the degradation of service quality.
Figure 4.1
Optimal usage of metropolitan rail
INFORMATION
1982
RELEASED
OFFICIAL
A fundamental principle of welfare economics is that, where possible without excessive (transaction)
costs, externalities should be priced. For example, Gramlich (1990) concludes that the presence of
external benefits from public infrastructure (such as metropolitan rail) justifies the use of a system of co-
28
link to page 27 link to page 29
4
Rail funding: economic principles
payments from beneficiaries. The objective is to align private prices with marginal social benefits by
internalising externalities, so that infrastructure users face the correct price for use of that infrastructure.
The practical issues associated with raising revenue from groups that gain indirect benefits may be a
constraint on fully achieving this alignment. Efficiency considerations require that such funds should be
raised in the least distortionary way. It may turn out that the best achievable pattern of funding depends in
part on how readily, and at what economic cost, funds can be secured from certain groups, regardless of
whether they are beneficiaries of rail. This issue, along with associated equity considerations, is explored
further in section 4.3.
The fact that metropolitan rail networks are natural monopolies raises further issues regarding funding. It
is well known, for example, that the standard efficiency rule of setting prices at marginal cost would
THE ACT
underfund the rail service when there are economies of scale. Similarly, an unconstrained monopolist of
metropolitan rail may set inefficiently high fares which would result in less rail usage than was socially
optimal.
Furthermore, the quality and coverage of metropolitan rail services are likely to be lower than the level
that maximises total welfare if rail is the responsibility of commercial investors alone. This is because
passenger fares are the main source of funding that would be available to commercial investors; they
would have no simple way of securing contributions from other groups of beneficiaries that do not use
rail. Private rail providers may also find it difficult to charge for any option and non-use values of rail
networks. If these values are significant they could be a justification for public funding mechanisms.
UNDER
If all funding came from passengers only, then there would be T trips per annum. However the existence of
0
external benefits means that the total demand across all of society lies to the right of the demand curve of
passengers alone. The socially optimal quantity of rail trips is T*.
8
Apart from specific market failure rationales for funding rail, policymakers may also consider policy
rationales for subsidising forms of public transport. For instance, subsidised public transport can provide
individuals in lower socio-economic demographic groups or those with disabilities with more affordable
transport options and may assist with promoting improved social inclusion and other positive social and
health outcomes.
9
INFORMATION
1982
However, even if policymakers consider that more affordable transport options should be provided for
certain groups in the community, this does not necessarily mean that subsidised rail services are the most
appropriate means of achieving this policy objective. For instance, it may be difficult to target subsidies to
only those considered to be the desired recipients. Such practical difficulties may mean that a more
efficient approach is to provide specific individuals or households with direct financial assistance which
RELEASED
could be used for transport purposes if required.
4.2 How much funding should metropolitan rail receive?
Any public funding for rail should be based on a finding that the total social benefits exceed the total
social costs for a metropolitan rail network, or specific rail services or projects. That is, the net welfare
OFFICIAL
impact from rail services should be positive, where net welfare is the sum of direct use (consumer
surpluses) benefits, producer surpluses (profits) and positive externalities less negative externalities and
the costs associated with raising public funds.
8 It must be emphasised that the diagram is heuristic only. The task of estimating the position and slopes of the curves
remains, as does the analysis of how to collect co-payments from external beneficiaries.
9 For further discussion of these issues see Currie (2011).
29
link to page 29 link to page 30
Metropolitan rail: external benefits and optimal funding
If the net welfare impact of rail is positive, it is not necessary that the public funding provided to rail
should equal the total benefits of rail. Rather, once a full cost-benefit analysis indicates that rail generates
a net overall benefit, the amount of funding provided should be limited to the amount necessary to cover
the efficient costs of providing rail services less farebox revenue.
Because of the cost structure of rail, particularly the rail network, determining efficient costs of rail
services is not straightforward. The rail network in New Zealand is almost certainly a natural monopoly.
This means that a single firm structure (rather than competing rail networks) is the least costly way to
provide rail network services. Rail network services compete against road network services and against
other modes of transport (sea and air freight), but rail network services themselves are unlikely to ever be
competitively supplied. This means that the network provider potentially has market power that could be
THE ACT
used to increase prices above cost.
To either test this hypothesis or establish pricing that mitigates any market power, it is necessary to
understand more precisely what is included in the ‘cost’ of the network provider. To do so, we draw on the
principles of regulatory cost estimation.
4.2.
1 Revenue requirement methodology
The network service provider needs sufficient revenue each year to cover its efficient costs. In practice, the
‘efficient’ qualifier is addressed in two ways – by building incentive mechanisms into a revenue allowance,
and by independent reviews of capital and operating expenditure plans. We do not need to discuss such
UNDER
mechanisms here, but these are practical issues that can be addressed in the implementation of a cost
estimation methodology
.10
The required revenue in a year can be summarised as:
R = V r + D + O
(Equation 4.1)
t
t
t
t
Where R is the required revenue for year ‘t’, V is the value of the capital employed, r is a risk-adjusted rate
t
t
of return on capital, D is the depreciation allowance and O represents all operating expenses including
t
t
taxation. Regulators often try to ensure that the firm has incentives to minimise costs where possible; in
INFORMATION
1982
practice this can affect the allowance for operating costs (O ), the asset value (V ) and the treatment of new
t
t
capital expenditure.
Capital investment in year ‘t’ does not appear in equation 4.1 because it is not expensed in the year of
investment. Instead, it will be recovered over time (ie in future years) through the return on capital term (V t
r) and the depreciation term (D ).
t
RELEASED
The main difficulties in estimating this revenue requirement are in the first term of equation 4.1, where
both the asset value (V ) and the rate of return on capital (r) are often contentious.
11 The asset value term
t
can be usefully split into two components: a base value and new investment.
Provided there are mechanisms in place to promote only efficient capital investment (as distinct from
excessive investment known as ‘gold plating’), it is reasonable to automatically roll new capital investment
OFFICIAL
10 An example of such an incentive mechanism is the efficiency benefit sharing scheme used in regulating energy
networks in Australia. See www.aemc.gov.au/electricity/rule-changes/completed/efficiency-benefit-sharing-scheme-and-
demand-management-expenditure-by-transmission-businesses.html.
11 Depreciation is somewhat less contentious because investors have ambiguous interests regarding the timing of
capital recoveries. While they require an expectation of full cost recovery over the life of the assets, most regulatory
regimes are structured in such a way that the return on capital (r) is only earned on capital that has not yet been
recovered through depreciation.
30
link to page 30 link to page 31
4
Rail funding: economic principles
into the asset base. Doing so ensures that desirable investments are made in a timely manner because the
investor is confident that there will be a reasonable payback through the revenue requirement. Therefore,
at least from the perspective of efficient investment, it is not strictly necessary to separate out operating
costs from capital expenditure from a cost recovery perspective.
12 Both costs are combined into one
revenue annual requirement.
It is important to note, however, that processes for approving capital investment need to balance two
potential errors:
• excessive investment, which can arise either because of a profit motive or simply because operational
staff prefer to work with assets that err towards being over- rather than under-built
THE ACT
• insufficient investment, which can arise if there is a risk that invested capital will subsequently be
written out of the asset base, which induces investors to be more hesitant and to defer investment,
possibly for a long time.
13
In the case of the New Zealand rail network, the base value (or original value) of the network could be
thought of as the price paid when the Crown acquired the network in two steps in 2001 and 2004.
However it is also possible, and appears more in line with actual practice, for the base value to be set to
zero if the owner is comfortable with this approach. This could be rationalised as implying that when the
Crown acquired the network it treated it as a current period expense, or as a capital investment for which
the returns would accrue directly to various parties that derive value from rail rather than to the Crown.
UNDER
In summary, estimating the revenues required by the monopoly network provider requires:
• establishing the initial value of capital employed by the network provider (the initial asset base)
• establishing a mechanism for approving capital investments to ensure only efficient investments are
undertaken and the value of these is rolled in to the asset base
• estimating an appropriate risk-adjusted cost of capital
• deciding on an appropriate depreciation methodology and setting out rules for its implementation
• establishing efficient operating expenses.
INFORMATION
1982
4.2.
2 Current practice in New Zealand
It appears that much of the recent capital expenditure on the rail network in New Zealand is financed on a
pay-as-you-go model, which is very different from the normal regulatory structure discussed above.
For instance, KiwiRail divides its costs into what could be summarised as two components:
RELEASED
• operational costs, including maintenance and overheads
• renewal costs.
OFFICIAL
12 There may nevertheless be merit in dividing costs into fixed and variable components for the purpose of raising
revenue. For example, if it is possible to use two-part tariffs then it will often be efficient to recover fixed costs through
a fixed fee and variable costs through a usage fee.
13 In some regulatory regimes, the valuation concept includes regular ‘optimisation’ of the asset base. This was a
feature of regulatory asset valuation in New Zealand, but the recent work by the Commerce Commission on ‘input
methodologies’ proposes abandoning optimisation and this is also a trend in Australian regulation.
31
Metropolitan rail: external benefits and optimal funding
The latter category seems to include capital expenditure that is expensed in the year it is incurred. Since
all capital seems to be treated this way, the capital accounting regime outlined above is not applicable. In
particular, there is no base value, no need to apply a rate of return and no depreciation component.
Two implications follow from this. First, the Crown is apparently not seeking any return on the capital
invested to acquire the network. Second, given this position of an effectively zero asset base, it would be
possible to expand capital investment in metropolitan rail by adopting a version of the normal regulatory
capital accounting method outlined above, without increasing the annual revenue requirement for KiwiRail.
Rather than using a pay-as-you-go basis for new capital investment, KiwiRail could borrow. This would
allow the current level of revenues to be leveraged by permitting returns to capital investment to be
spread over time rather than funded entirely by contemporaneous revenue. Obviously, there would be a
THE ACT
cost of debt financing, but by deferring capital repayment, this approach would allow an expansion in the
investment programme should that be desired.
4.2.
3 Marginal cost-based pricing and public funding
The revenue used to cover the costs of metropolitan rail is typically obtained from two main sources: fares
and public subsidies. In general, economic efficiency requires that those generating costs by using a
specific service should fund those costs directly. This implies that those using a particular service should
cover the marginal costs of its provision. However, if there are positive externalities and/or economies of
scale, such as arise with metropolitan rail, there may be a strong case for some proportion to be funded
by subsidies.
UNDER
To better ensure an efficient level of usage of rail services by passengers, the amount of fare subsidy
should be related to the positive externalities that are generated. If subsidies are too low, there may be
insufficient usage relative to the potential positive externalities. Conversely, it is also possible to provide
too much funding for rail, particularly given that this funding could be used for other welfare-enhancing
purposes.
Economies of scale may also mean that marginal cost pricing may not recover all fixed costs. This
suggests that either fares may need to be priced above marginal costs to ensure that total costs are
INFORMATION
1982
covered, or that additional public subsidies are provided. If fixed costs are to be recovered from
passengers, the efficient way of doing this is to charge a higher mark-up over marginal cost for customers
who are relatively insensitive to price changes.
In other sectors with similar cost structures, ‘two-part tariffs’ are often used to establish efficient prices
for usage as well as recover fixed costs. Examples include water and electricity, the marginal costs of
which may be recovered via per unit prices for usage, with fixed costs being recovered using lump-sum
RELEASED
annual connection fees.
Within rail, this may mean that fares are higher for some users who may have relatively inelastic demand
(eg peak-time commuters) than for others (eg passengers travelling for non-work purposes). However,
determining the optimal fare structure is not straightforward. The sensitivity of passenger demand to
fares varies across a number of variables, including passenger characteristics, time of day, location, etc.
Ideally fares should be structured in such a way that people’s transport decisions are distorted as little as
OFFICIAL
possible, ie prices should reflect the marginal cost of providing services with allowance for any positive
and negative externalities.
We assume that such an approach cannot be replicated with rail because of practical issues regarding fare-
setting, specifically because of an inability to apply one-off annual ‘connection’ charges. As a result, our
analysis assumes that public funding would be used to cover the resulting shortfall brought about by
marginal cost pricing.
32
link to page 31
4
Rail funding: economic principles
4.3 How should public funding for rail be raised?
Once a policy justification for the subsidisation of rail services has been established and the magnitude of
the necessary public contribution has been estimated, the next issue to address is how these funds should
be raised. There are two broad principles that can inform decisions concerning how funds should be
raised. These are:
1 Economic efficiency – in which funds are raised in a manner which imposes the smallest negative
impact (least cost) on the economy and wider society
2 Equity – in which funds are raised in manner which is considered to be fair given the parties that
ACT
benefit.
THE
4.3.
1 Economic efficiency considerations
Regarding the proportion of costs funded by public subsidies, it is important for policymakers to consider
that the collection of revenue by central and local governments imposes costs on the economy and the
wider society. The economic costs of raising the revenue needed to fund rail subsidies consist of:
14
1 Administrative costs – these are the costs incurred by the central or local government agencies
responsible for collecting revenue
2 Compliance costs – these are the costs (both financial expenditure and time costs) faced by those
UNDER
required to pay, which are incurred in the process of complying with revenue requirements. These
include the costs of complying with government requirements, gathering information, making
payments etc, but do not include the amount of tax or levy itself (which is not a net cost to society but
a transfer from taxpayers to governments)
3 Deadweight costs of taxation – these are the economic efficiency costs (marginal excess burden) that
arise from the distortionary effect of taxes and charges. Levying a tax on an activity or product creates
a disincentive to undertake that activity or to produce/purchase a product. If this results in lower
levels of the activity or fewer sales of the product, it can in turn reduce the economic welfare of
INFORMATION
1982
affected individuals.
Whether gathering revenue to subsidise rail generates significant additional administrative and compliance
costs depends on the precise funding mechanisms used. If rail funding is sourced from existing tax
instruments, eg petrol excise, road user charges and general taxation as collected by central government, or
property rates collected by councils, then there is less likely to be any additional administrative and
compliance costs generated. This is because rail funding would constitute only a small proportion of the
RELEASED
revenue collected from these sources and so these costs would be incurred regardless of whether rail is
publicly funded.
The only additional cost that arises from funding rail through these mechanisms occurs in relation to the
increased rate of tax that is levied on these particular activities or assets. Because higher rates of tax,
excise and rates are required to fund rail subsidies, the deadweight cost of these instruments will result in
OFFICIAL
a loss of overall economic welfare in society. For instance, an increase in petrol excise increases the
disincentive to drive, causing some drivers to alter their behaviour, either by driving less or perhaps
purchasing smaller vehicles than they would otherwise. Similarly, an increase in income tax would result in
reduced work effort and output. To the extent that these distortionary effects cause individuals to alter
14 For a full discussion of these concepts and aspects see The Treasury (2001a; 2001b) and Tax Working Group (2009).
33
link to page 33 link to page 34 link to page 34
Metropolitan rail: external benefits and optimal funding
their behaviour away from what they would otherwise do, this has the resulting effect of lowering overall
economic welfare.
These deadweight costs and resulting welfare losses of taxation may be somewhat minimised, however, if
the activity being taxed is relatively inelastic to tax.
15 This means that the imposition of a tax, or change
in the tax rate, does little to change the quantity of the activity being undertaken or good being
purchased. In this regard, revenue from property rates levied by councils that are currently used to
contribute towards rail subsidies is of particular interest. This is because property ownership is generally
considered to be relatively inelastic to typical rates of taxation. Similarly, fuel excise duties are also
generally considered to be less distortionary given the relatively inelastic demand for fuel, at least in the
short run
.16 However, perhaps the least distortionary of the funding sources currently used by the
THE ACT
Transport Agency are vehicle registration fees, as the demand for vehicle ownership is likely to be less
elastic than vehicle usage.
4.3.
2 Corrective taxes
One exception to this general result whereby increased rates of taxation generate increased deadweight
costs and welfare losses is if the tax instrument in question is a ‘corrective’ tax
.17 Corrective taxes and
charges can used be to factor negative externalities into the prices faced by purchasers. For instance, a
carbon charge can incorporate the external cost of greenhouse gas emissions into prices incurred by
consumers or drivers. In this regard, corrective taxes can increase overall economic efficiency by providing
people or firms with an incentive to adjust their behaviour in a manner that leads to better overall
UNDER
outcomes for the wider society.
Another example of a corrective tax or charge that is relevant to metropolitan rail is congestion pricing
(charging). Although this may be considered as a potential method for raising funds, congestion charging
may actually eliminate much of the rationale for subsidising rail.
This is because an appropriate congestion charge would cause car drivers to internalise the negative
externalities that arise from road congestion during peak times. Consequently, congestion charging that
ensures motorists face the true ‘social’ cost of their commuting decisions would result in more
INFORMATION
1982
appropriate (optimal) commuting decisions. This is because motorists would be forced to pay for the costs
that their travel decisions impose on others. If their private benefits do not exceed the total social cost,
their response may be to alter their commuting patterns (eg time of day), or the mode of transport they
use, or they may continue unchanged.
Regardless of the specific behavioural changes, incorporating these costs eliminates the need for the
subsidisation of rail to reduce congestion because the negative externality would be internalised by
RELEASED
drivers via the prices faced for using roads. Instead, using funds raised from such an instrument for rail
may lead to the ‘excessive’ provision and use of rail and be economically and socially inefficient. However,
for the purposes of this report, we have assumed that the use of congestion pricing in Auckland and
Wellington is not a practical alternative to the funding of commuter rail.
The Treasury has previously stated that if metropolitan rail generates benefits to road users in the form of
reduced congestion then funding from road users via the NLTF would be appropriate (Treasury 2009).
OFFICIAL
Although this approach would internalise these external benefits of rail to some extent, a crucial aspect of
15 Note that although this approach is generally considered to be welfare maximising, this result may not apply in all
cases. See Creedy (2009).
16 Kennedy and Wallis (2007) estimated a short run price elasticity of demand for petrol in New Zealand at -0.15.
17 Also referred to as a Pigouvian tax.
34
link to page 34
4
Rail funding: economic principles
congestion reduction externalities is that they are highly location- and time-specific. Consequently,
sourcing rail subsidies from general fuel excise and road user charges would impose additional costs on
the motorists outside of congested routes or peak times. As a result, this may distort drivers’ road use
decisions leading to a loss in overall economic efficiency.
4.3.
3 Equity considerations
As well as minimising the cost of raising funds, policy makers may also consider equity to be important.
Applying the principle of equity implies that funds should be raised from those who benefit most from rail
services.
18
However, equity issues can raise additional complexity and may be more subjective. Ensuring ‘fair’
THE ACT
outcomes may be particularly important where costs are to be shared between two or more distinct
political entities, for instance between local and central governments, between distinct groups, eg road
users and local residents, or if network infrastructure is used by different services, ie passenger and
freight services.
Cost allocation (funding) problems have been the subject of considerable academic research in the field of
cooperative game theory. The motivating examples are situations where cooperation (involving some cost)
between several individuals or groups has the potential to yield mutual net benefits, and the task is to find
a set of prices (cost allocations) that make it rational for all parties to cooperate. If compulsion is not
feasible, this amounts to finding a set of ‘subsidy-free’ prices (or contributions) which are defined as
UNDER
amounts at which no agent is made worse off by cooperating.
This literature is a useful starting point for metropolitan rail cost allocation, but as will be seen below, it is
possible and useful to extend the analysis beyond these foundation concepts. The reason is that
designing subsidy-free prices only gives quite broad ranges for cost allocation. Incorporating demand side
factors can narrow these ranges while reflecting externalities and direct sources of value.
Before describing the concept of subsidy-free prices, it is useful to explain the context used to derive
these results and therefore the (rather strict) meaning of the term ‘subsidy’. Assume that a single facility
provides services that benefit several users or groups and the task is to recover the costs from those
INFORMATION
1982
users. Provided every user is at least as well off as they would be without the facility, then no user
subsidises any other.
By way of example, suppose it was found that the average motorist in Auckland attained time savings
valued at $10/week as a result of metropolitan rail passengers not driving on the road. Asking (or
requiring) that motorist to pay $10/week towards the cost of metropolitan rail does not involve any
RELEASED
subsidy because the motorist is no worse off, compared to a world with no metropolitan rail and no
$10/week charge.
This strict definition of a subsidy is not particularly well understood. To mitigate any confusion, in what
follows we will use the strict definition of a subsidy but refer to contributions that might be sought from
non-passenger groups as ‘co-payments’. Voluntary cooperation requires ensuring that the co-payments
from each group are not so large as to involve an element of subsidy.
OFFICIAL
18 Another equity concept commonly applied in taxation issues is ‘ability to pay’, which means that those who are most
able to pay should contribute more than those less able to pay. This approach is used to justify progressive tax
structures despite the fact that such structures may impose greater efficiency costs.
35
link to page 35
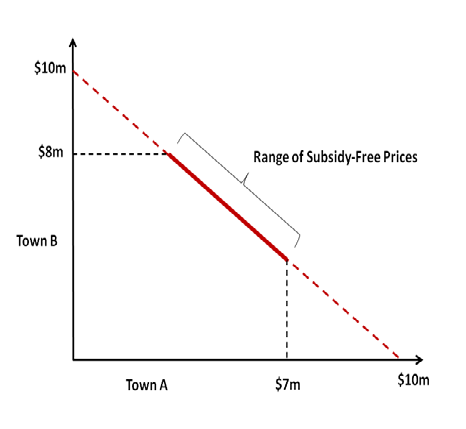
Metropolitan rail: external benefits and optimal funding
4.3.4 Subsidy-free pricing
Consider a simple example in which two nearby towns are considering the construction of water systems.
Assume there are economies of scale so it would be cheaper to build one large system, big enough for
both towns, than for each town to build its own separate smaller water system.
The cost of building separate water systems (known as the ‘stand-alone cost’) is $7m for Town A and $8m
for Town B, whereas the total cost of a system to serve both towns is $10m. Clearly, neither town would
be willing to pay more than its stand-alone cost so A cannot be charged more than $7m and B cannot be
charged more than $8m. The range of subsidy prices is therefore the set of ways that $10m can be
allocated between the towns, subject to this constraint. Both towns will participate if charged prices within
ACT
this range and assuming the price is less than the gross benefits they receive from the water system. The
THE
situation is depicted in figure 4.2.
Figure 4.2
Subsidy-free prices – two agent example
UNDER
INFORMATION
1982
When costs are fully and only just recovered, there is another cost concept that is equivalent to the upper-
bound of the subsidy free price range defined by stand-alone cost, but can be more useful in practice. We
can define the ‘incremental cost’ for each town as the extra amount needed to accommodate that town’s
water needs, over and above the costs already needed to serve the other town.
If we start with the $7m project needed to serve Town A, then the incremental cost of adding Town B will
RELEASED
be $3m. Similarly the incremental cost of including Town A in the water system plans of Town B is $2m.
Each town must pay at least its incremental cost for the prices to be subsidy free. Otherwise, the other
town would be charged more than its stand-alone cost, and it would prefer to opt out of the joint project.
Careful examination of figure 4.2 will show that this version of the subsidy-free pricing rule yields exactly
the same set of subsidy-free prices as the stand-alone cost rule.
These bounds on subsidy-free prices have been known for several decades (Faulhaber 1975, pp966–977).
OFFICIAL
They are based on the Pareto efficiency concept,
19 because they seek to ensure that no party is worse off
as a result of cooperating with others. The bounds can be generalised to multiple parties and have the
effect of establishing very clear boundaries for allocating costs that are common to more than one activity.
19 An outcome is Pareto efficient if no party can be made better off without making others worse off.
36
link to page 36 link to page 37 link to page 37
4
Rail funding: economic principles
However, in situations where common costs are a large fraction of total cost (ie where direct attribution
rules for costs leave a large unexplained residual), there is a large gap between the minimum price
(incremental cost) and the maximum price (stand-alone cost) and so the range of permissible prices is also
very large. This opens up the potential for intense disputes about cost allocation, as there are a large
number of ‘fair’ prices, yet changing the cost allocation within this range will make some parties better off
and some worse off. Resolving these disputes can be costly and time-consuming.
4.3.
5 Refining the cost allocation
In the case of metropolitan rail, the above analysis can be expanded to reflect several important facts:
• The relevant groups include parties that do not directly use rail services. THE ACT
• An element of coercion is available (ie taxes).
• It is likely to be desirable to narrow the range of acceptable cost allocations to reflect other factors in
addition to incremental costs, such as benefits.
4.3.5.1
Indirect beneficiaries
There are several groups that are likely to benefit from metropolitan rail that may not directly use rail
services. The following four main groups have been identified.
• road users, to the extent that congestion is lessened and/or safety is improved by some persons
switching from road to rail transport
UNDER
• owners of residential property located close to rail services, to the extent that the positive or negative
value of such services are capitalised into property values
20
• owners of businesses or commercial property located close to rail stations, to the extent that
additional foot traffic generates additional business
• the general public, to the extent that there are CO reduction benefits and/or public health and safety
2
benefits.
INFORMATION
1982
In addition, there may be some agglomeration benefits
21 that accrue to the last three of these groups.
22
As well as the direct and indirect benefits of passenger rail services, certain investments in the passenger
rail network (eg track upgrades) may also generate benefits for those using freight services.
Drawing on the analysis above, if every beneficiary group makes a co-payment that is no greater than the
value of the indirect benefit it receives, then the group is no worse off from cooperating in the
RELEASED
metropolitan rail enterprise. Similarly, if any group suffers a detriment as a consequence of metropolitan
rail activities, it should receive (in some form) a co-payment of at least a similar value.
OFFICIAL
20 There may be a positive value associated with being located close to a station, but a negative value associated with
being close to a track.
21 Agglomeration benefits can arise from economies of scale and network effects that arise when firms locate in close
physical proximity.
22 For further discussion of some of the potential wider impacts of infrastructure investment, including transport
infrastructure, see Grimes (2008).
37
link to page 37
Metropolitan rail: external benefits and optimal funding
4.3.5.2
Coercion
It was noted above that there may be several sets of subsidy-free prices. When multilateral agreement is
required before investment can proceed, this can induce opportunistic behaviour as interest groups with-
hold agreement in an effort to contribute less.
In the case of metropolitan rail, however, there are some coercive mechanisms available that could be
used to extract funding contributions from some of the indirect beneficiaries. For example, there may be
an equity rationale for converting some fraction of the revenues collected from road users (via fuel excise
duties and road user charges) into co-payments for metropolitan rail. Similarly, local authorities have
existing systems for taxing property owners and methodologies that allow targeted rates in certain
situations. Additionally, the central government’s legislative powers enable it to require central
THE ACT
governments to fund certain activities.
Notwithstanding these coercive mechanisms, the subsidy-free concept, which is closely linked with the
‘willingness to pay’ of a stakeholder group, remains relevant to setting co-payments. One reason is simply
that there is a strong equity argument for linking co-payments to the size of the associated externality.
Additionally there are two efficiency rationales:
• Individuals have some ability to avoid such imposts by changing their conduct (eg road usage) or
location (eg buying or selling property), and such decisions should be informed by efficient price
signals.
UNDER
• If some beneficiary group is excused, the remaining groups will face higher burdens that could exceed
their willingness to pay (assuming contributing is voluntary), in which case socially valued investments
may not occur.
4.3.5.3
Narrowing the range
In some situations it is possible to devise specific cost allocations rather than broad ranges. For multi-
party problems like the funding of metropolitan rail, in particular the allocation of funding of proposed
new rail projects between central and local government agencies, the only real prospect by which this
might be achieved is through the Shapley value concept (Roth 1988). This concept can be implemented by
INFORMATION
1982
averaging the incremental costs of each stakeholder group, across all possible orderings of groups. While
this may be feasible at a conceptual level, it would require information that is beyond the scope of this
project.
Nevertheless, it is still possible to use the cost allocation principles in combination with other principles of
welfare economics to develop useful guidance for metropolitan rail funding.
RELEASED
4.3.
6 Equity impacts and defining beneficiary groups
Although those who benefit from metropolitan rail can be classified in broad terms, there are practical
difficulties with identifying precisely those individuals who benefit, and therefore, who should contribute
according to the principle of equity.
For instance, although in general motorists benefit from less road congestion, the existence of
OFFICIAL
metropolitan rail does not benefit all motorists, but rather those motorists who travel at certain times of
peak usage to certain central city locations in Auckland and Wellington and use specific motorways and
arterial roads.
23 Consequently, using some portion of revenue collected from vehicle registration revenue,
23 S
ee http://newscenter.berkeley.edu/2012/12/20/cellphone-gps-data-suggest-new-strategy-for-alleviating-traffic-tie-
ups/
38
4
Rail funding: economic principles
petrol excise and/or road user charges could be considered by some to be unfair given that many
motorists obtain no congestion reduction benefit from metropolitan rail. Similar limitations to applying an
equity approach arise if funding is obtained from local government property rates which result in
contributions from a large number of households that do not obtain direct benefits from rail.
Some rail benefits may also accrue to taxpayers and the general public, such as health benefits from
reduced particulates in high traffic areas and potentially fewer crashes and reduced associated emergency
costs. If so, a degree of funding from central government tax revenue may be appropriate from a fairness
perspective.
Similarly, the use of land value capture instruments may appear less controversial to the extent that these
instruments directly tax gains obtained by those property owners who benefit from rail. However, this
THE ACT
approach is also not without practical difficulties and equity concerns. For instance, if targeted rates are
applied to all properties within a certain distance (eg a one kilometre radius) of rail stations, this may not
account for differences in access arising from street layouts or the presence or absence of accessways.
Another important consideration is the timing of any impacts on property values of changes to rail
services. The value of nearby properties is likely to be affected when rail services are improved, or
potentially beforehand when proposed service improvements are first announced. Therefore, any property
appreciation will accrue to those who own affected properties at the time this value appreciation occurs. It
will subsequently be realised by owners when these properties are sold.
Consequently, for a land value capture mechanism to effectively capture some portion of the increased
UNDER
land value from those who benefit, it would need to be applied to those individuals or parties that owned
the property at the time the appreciation in value occurred. If such a mechanism is applied retrospectively,
ie only after property values have increased, it may be incurred by some current owners who did not own
the assets at the time it increased in value. Consequently, it would be unfair on these owners as they
would effectively be charged twice: once in higher purchase prices and a second time by a targeted
revenue measure.
Additionally, the corollary of taxing those who benefit from an appreciation in property values from rail
services is that those who suffer depreciation in land values because of a change in rail development or
INFORMATION
1982
change in rail services should be compensated. For example, if services are increased by running services
earlier in the morning and later in the evening, properties close to railway lines may face greater
disturbance, reducing their value. Similarly, while some businesses may benefit from rail because of
increased custom, other businesses with less favourable locations may suffer from this trade diversion
impact.
RELEASED
4.4 Application of principles
Public intervention in the pricing and funding of metropolitan rail services may be justified because of
externalities from rail use and the existence of rail networks, and the natural monopoly characteristics of
rail networks. From the above discussion of economic principles, we can derive the following conclusions
about the funding of metropolitan rail.
OFFICIAL
1 It is desirable for the funds payable to track and train operators to be limited to an estimate of the
efficient costs of service (less farebox revenue) rather than to fully reimburse all expenditures.
39
link to page 38
Metropolitan rail: external benefits and optimal funding
2 Passengers should pay at least the marginal (incremental) cost of their usage less the value of any
spillover benefits to other groups, otherwise the wider community would be better off with fewer rail
passengers.
24
3 Groups of non-users who benefit from the existence and usage of metropolitan rail should pay
amounts no greater than the value of their benefits, provided this can be achieved without incurring
unacceptable levels of transaction costs. In the absence of such payments, there may be an
inefficiently low level of investment in metropolitan rail.
4 According to the principle of equity, any group of non-users that suffers harm from the existence
and/or usage of metropolitan rail should receive compensation, provided this can be achieved without
incurring unacceptable levels of transaction costs.
THE ACT
5 The efficiency impacts of raising revenues from beneficiaries need to be considered when designing a
funding scheme. If these impacts have an effect on the final allocations, they will tend to increase the
share allocated to relatively efficient forms of revenue raising, such as property taxes.
The overall approach can be summarised using the following two equations. First, the estimation of total
efficient cost combines allowances for operating costs and for capital costs.
Operating
Capital
Total
UNDER
cost
cost
efficient
al owance
al owance
cost
This total cost is then recovered by charging the beneficiaries of spillovers from rail usage an amount
equivalent to the value of benefits received, and raising the balance of the costs from passengers via
fares.
INFORMATION
1982
Funds
Fare
from
Total
revenues
other
efficient
groups
cost
RELEASED
OFFICIAL
24 The issues surrounding determining marginal costs are outlined in chapter 1.
40
link to page 40
5
Marginal cost estimation
5
Marginal cost estimation
The provision of metropolitan rail services typically involves incurring substantial fixed costs. These fixed
costs relate predominantly to infrastructure such as tracks, stations and carriages although significant
proportions of other costs may also be fixed, eg corporate overhead. In comparison, variable costs such as
driver wages and fuel or electricity are a much smaller component of total costs. This means that rail
services typically display large economies of scale – the average cost per passenger journey decreases as
total passenger journeys increase.
Applying an efficient pricing methodology of setting fares equal to the marginal (variable) cost of rail
ACT
services therefore results in losses as fares are not sufficient to cover fixed costs. Assuming that the
THE
overall net benefit of rail services is positive, this means that revenue needs to be obtained from another
source.
25
Figure 5.1
Losses from setting P = marginal cost with scale economies
$
UNDER
C1
Average cost
P1
Marginal cost
INFORMATION
1982
Demand Quantity
Q1
This is illustrated in the diagram above. If there are economies of scale, marginal cost is less than average
RELEASED
cost. At the efficient output level Q , setting price (P ) equal to marginal cost (C ) will imply an average loss
1
1
1
of (C – P ) per trip. The total loss is represented by the dark shaded area.
1
1
5.1 Short-run versus long-run measures
To determine the magnitude of the fare subsidies required by economies of scale and marginal cost
OFFICIAL
pricing, we have estimated the marginal cost of rail services in Auckland and Wellington. This can be done
in (at least) two ways:
25 For further discussion see Smart (2008) and Smart and Hefter (2012).
41
link to page 41
Metropolitan rail: external benefits and optimal funding
• Short-run marginal cost (SRMC) is the extra cost of carrying one more passenger. On a train service
that is not operating at full capacity, SRMC is likely to be very low, typically close to zero. A less
extreme version of this approach would be to set the price at average variable cost.
• Long-run marginal cost (LRMC) takes a longer time horizon, and compares all anticipated extra costs
(including capital inputs) against the additional passenger trip enabled by incurring these costs. The
LRMC will depend heavily on the current and future states of the rail system.
Because of the ‘lumpy’ nature of rail costs, estimates of marginal costs can be highly sensitive to the time
period and ranges of patronage over which they are calculated. Given a specific service timetable, the
SRMC of carrying one extra passenger is likely to be close to zero unless a particular service or network is
operating at capacity.
THE ACT
If at capacity, additional carriages and/or other investment in expanding network capacity may be
necessary to facilitate additional patronage. In these cases, the incremental costs of servicing additional
passengers are likely to be substantial. There is consequently a large gap between SRMC and LRMC and we
need a principled basis on which to select a cost concept. In doing so, we have had regard to the rather
different stages of network and urban development in Wellington and Auckland.
Wellington has a mature rail network with modest patronage growth. It receives investment primarily for
the purpose of replacing worn-out assets. An LRMC concept would attribute these replacement costs only
to the small number of extra passengers which would overstate the costs that small group imposes on the
network. Thus, in Wellington, we adopt the average variable cost concept as the measure of efficient fare.
UNDER
In practice, this means that the sequence of replacement costs over time is not charged to passengers.
The situation is different in Auckland for several reasons. Significant extra capacity is being added to the
rail network and more is anticipated, ie the City Rail Link (CRL). Population growth is strong and expected
to remain so and some segments of the network are already at capacity at peak times. Also, current rail
patronage levels are modest compared with future expectations. Thus, rail services in Auckland are likely
to be affecting the long-term decisions regarding where to live and work for a not insignificant number of
Auckland residents. The result of these decisions in turn implies a certain pattern of physical investment
in housing and workspaces.
INFORMATION
1982
These facts lead us to the view that in Auckland the LRMC should be incorporated into fares. In practice,
this means that over time fares should be based on the recovery of all operating costs as well as all of the
additional capital costs of expanding network capacity,
26 less any public subsidies that incorporate the
positive externalities of rail.
RELEASED
5.2 Estimates
We have used actual data and patronage forecasts to generate approximate estimates of the relevant
marginal costs. It shows two very different LRMC outlooks for Auckland and Wellington.
5.2.
1 Auckland
OFFICIAL
The situation regarding future costs and patronage is quite different in Auckland. There, strong passenger
growth is expected to follow the current electrification upgrade as well as after the planned CRL. Given
there is some uncertainty regarding aspects of the CRL, eg timing, cost, patronage, we have modelled two
scenarios: the first with electrification only and the second with electrification and the CRL.
26 For example, expanding network capacity in Auckland would include building the City Rail Link.
42
link to page 42
5
Marginal cost estimation
5.2.1.1
Electrification only
We have calculated a net present value (NPV) for the cost of electrification (much of which will be incurred
in the next few years) and the other extra capital and operating costs that are expected. For passenger
growth, we adopt a Transport Agency forecast of 19.2 million trips in 2020. This is some 8.7 million trips
more than at present. We assume that from 2020 through to 2050 passenger growth will be in line with
population growth in Auckland, using Statistics New Zealand’s medium growth rate of 1.5% per annum.
Discounting future trips using the same rate as for the costs NPV results in a range of LRMC estimates of
$4 to $5 per trip. The lower end of this range uses a discount rate of 6% per annum, while the higher is
based on an 8% per annum discount rate.
5.2.1.2
Electrification and city rail link
THE ACT
The CRL would convert Britomart Station from a terminating station into a through station which will allow
rail services to run in both directions through the city centre. This would more than double capacity from
around 20 to 48 trains per hour into the station (SKM 2012). In our cost modelling we have made the
following assumptions:
• It would be completed in 2023. This is midway between the Auckland Council’s and the government’s
preferred completion dates of 2021 and 2026 respectively.
• The cost of $2.5 billion is spread evenly over six years.
27
• Patronage rises linearly from the pre-existing forecast for 2012 to a level of 49.7 million in 2041 and
UNDER
thereafter at 1.5% per annum in line with expected population growth.
• Operating costs with the CRL are 50% higher each year compared to the costs without the CRL.
• The estimation horizon runs to 2070 and we use discount rates ranging from 6% to 8%.
Under these assumptions the LRMC of rail trips ranges from $5.57 using 6% as the discount rate, to $7.65
if we use 8% as the discount rate.
Using these marginal cost estimates, we can now estimate the value of rail usage externalities to
determine the marginal social costs and optimal fare subsidy. This is carried out in the next chapter.
INFORMATION
1982
5.2.
2 Wellington
Figure 5.2 shows that passenger trips are forecast to increase modestly in Wellington over the next six
years. The annual growth rate is 1.5%. During this period some significant capital expenditures are
envisaged, with investment of over $150 million planned to occur between 2014 and 2016. However,
RELEASED
these investments are largely replacement expenditures. They are not a reaction to materially increased
usage, nor will they materially increase usage.
OFFICIAL
27 This figure exceeds the stated $2.234 used by SKM in the CCFAS because of an additional 10% contingency to
account for potential cost inflation. For further details regarding the CRL see:
www.aucklandtransport.govt.nz/improving-transport/city-rail-link/Pages/default.aspx.
43
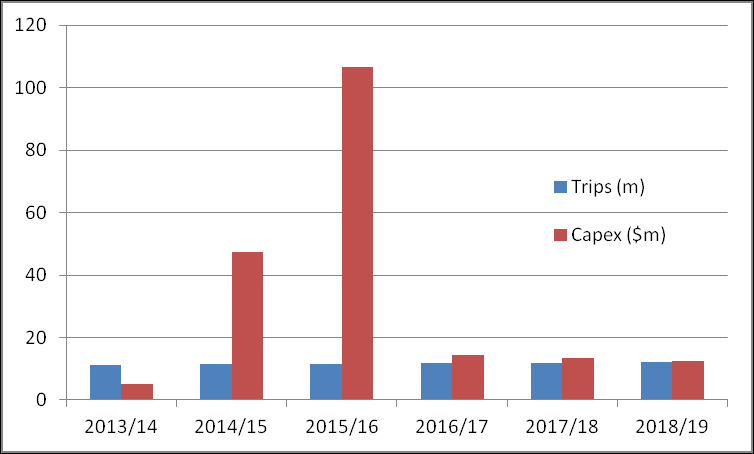
Metropolitan rail: external benefits and optimal funding
Figure 5.2
Forecast capital expenditure and patronage, Wellington
THE ACT
In Wellington therefore, it would be unreasonable to attribute all of the capital spending to just the extra
passengers. That would be justified if the spending was largely to accommodate extra passengers, but it
is not.
UNDER
Instead, for Wellington, we have compared the extra operating costs over the forecast period with the
extra passengers. This is an average variable cost measure which provides a reasonable estimate of
marginal cost for the purpose at hand. The range we estimate is from $4.10 to $5.30. The higher end of
this range is the average extra operating cost per extra passenger over the whole forecast period (ie out to
the 2018/19 year); the lower end is the same average over the last three years of the forecast period. We
consider that fares within this range will be reflective of average variable costs over the longer term.
INFORMATION
1982
RELEASED
OFFICIAL
44
6
Externality modelling and estimation
6
Externality modelling and estimation
In this chapter we discuss the theory and quantitative results for estimating the external benefits of
metropolitan rail given the existing road and rail networks. This provides a basis for estimating the
efficient operating (short-run) subsidy in addition to that required from marginal cost pricing.
The additional subsidy warranted by external benefits is illustrated below as the red shaded area below
the marginal cost curve. This reflects the difference between setting the price equal to the private
marginal cost faced by rail operator (P ) and setting the price equal to the marginal social cost as reflected
1
by the red dotted line (P ), where the marginal social cost incorporates the external benefits generated by
2
ACT
rail usage. Once these external benefits are accounted for, and the price reduced to P , the volume of trips
THE
2
undertaken increases from Q to Q .
1
2
Figure 6.1
External benefits and marginal social cost of rail
$
UNDER
C
1
Average cost
C2
P1
Marginal cost
P2
Marginal social
cost
INFORMATION
1982
Demand
Quantity
Q
Q
1
2
For a given level of patronage of the rail network, people who do not use rail experience benefits. These
RELEASED
generally consist of reductions in congestion costs or other costs. Aside from the private benefits obtained
by users when they travel by rail, the main additional benefits that rail may generate are:
• savings of travel time and costs by road users due to reduced congestion, including schedule
rearrangement costs
• environmental and health benefits from reduced airborne emissions
OFFICIAL
• safety benefits from less traffic and potentially fewer crashes
• agglomeration benefits which may arise from productivity improvements, a portion of which are
captured by the owners of firms rather than their employees who may use rail
• option value benefits obtained by households who have access to rail services regardless of whether
these services are used
45
link to page 43
Metropolitan rail: external benefits and optimal funding
• social inclusion benefits that arise if the wider community values low-cost travel for disadvantaged or
disabled members of the society, and for which rail may provide a lower cost alternative than
alternative transport options (eg disabled taxis)
• transport network resilience benefits arising from the existence of an additional transport mode.
As well as these positive effects, metropolitan rail also generates negative externalities. Chief amongst these
is noise disturbance, which may be incurred by households located close to rail networks. Other negative
externalities from rail may include increased traffic delays and safety incidents arising from level crossings.
There are two possible approaches to incorporating these external impacts of rail. One is to recognise that
rail patronage, and hence road usage and emissions, depend partly on rail fares and the relative price
ACT
between rail and road transport.
28 Assuming some demand functions for road and rail transport that
THE
depend on these prices, the rail fare that maximises total welfare and generates the optimal amount of rail
and road usage can be calculated. The optimal subsidy can then be determined by comparing this optimal
fare to the costs of the rail network. This would correct for congestion and environmental externalities,
and to this estimate could be added estimates of the other benefits listed above.
The other approach is to estimate the
total external benefits generated by a given level of rail patronage
and set the subsidy equal to this level. Rail fares can then be set to recover the remaining costs of the rail
network.
Both approaches have been developed and implemented by Smart (2008) and Smart and Hefter (2012) for
UNDER
metropolitan rail in Sydney. The latter approach (based on total effects rather than rail fare optimisation)
is simpler to implement and requires less data, and is the method adopted by the New South Wales
regulator for setting rail fares and subsidies in Sydney (IPART 2012). Accordingly, we have adopted the
total externalities approach of Smart and Hefter (2012) in our analysis.
We first discuss a model of congestion benefits of rail and estimate the value of these benefits for
Wellington and Auckland. We then consider environmental and other externalities that are not modelled by
Smart and Hefter (2012) and estimate the additional value of these.
6.1
INFORMATION
Congestion benefits
1982
Road congestion is made worse because road users do not take account of the impact on other users of
their decision to use a road. A road user will base their decision to travel on their private benefits and
costs, including their own travel time, but will not consider that their decision to travel will increase the
travel times of other road users. The marginal social cost of using a road thus exceeds the marginal
RELEASED
private cost, and decision making based on private benefits and costs leads to excessive road usage and
excessive congestion. A welfare improvement is possible if road usage is reduced by some mechanism.
Traditional methods of quantifying the benefits of reducing congestion involve multiplying travel time
savings using appropriate values of time saved. However, there is a growing debate regarding whether this
is the best method to evaluate these benefits (NZIER 2013). Some recent evidence suggests that such
congestion benefits may not be not fully realised because reduced travel times lead to changes to the
OFFICIAL
patterns of land use, eg increased suburban residential development. As a result, it may be that over the
longer term, the actual benefits of congestion reductions arise from land use changes rather than travel
28 The ‘price’ of road transport refers to the generalised cost faced by road users, including vehicle operating costs and
time costs.
46
link to page 46
6
Externality modelling and estimation
time savings. Ultimately these benefits may manifest in different forms such as higher wages, increased
productivity and economic output, higher property values and so on.
Despite this, in the absence of a widely established alternative valuation method, we have used the
traditional travel time saving approach to estimate this externality.
6.1.
1 Principles
The welfare effects of road congestion are illustrated in figure 6.2. Road journeys generate some benefits,
and the blue line represents the benefit of an additional trip. The private cost of an additional trip is
represented by the orange line, and includes fuel and vehicle operating expenses, and the value of travel
time of the person making the additional journey. The red line adds the external congestion costs to the
THE ACT
private costs, and includes the value of additional travel time experienced by all other road users as a
result of someone making an additional trip by road.
Based on private benefits and costs, the total volume of road trips will be Q0. At this level, the additional
benefit of an additional trip equals the additional private cost. However, the additional benefit is less than
the additional social cost once congestion costs are accounted for. Total welfare can be increased by
reducing the number of trips to Q1, foregoing the benefits associated with these trips but generating cost
savings (including congestion costs) that exceed the foregone benefits.
One way to achieve this would be to increase the ‘price’ faced by road users from P0 to P1, for example by
introducing road usage pricing or by other indirect means that increase the generalised cost of travel by
UNDER
car.
29 If this is done correctly then private and social costs will be aligned, and the amount of road usage
will reduce to the level that maximises total welfare.
Figure 6.2
Illustration of road congestion externalities
INFORMATION
1982
RELEASED
OFFICIAL
29 Possibilities include fuel taxes and parking levies.
47
link to page 47
Metropolitan rail: external benefits and optimal funding
However, for various reasons, congestion pricing is difficult and is not used in New Zealand.
30 A second-
best policy is therefore subsidies that encourage road users to substitute to other modes of transport that
reduce road congestion, such as rail.
6.1.
2 Theoretical model of congestion
We use the following model to estimate the total external road congestion benefits of a given level of rail
patronage, following the methodology of Smart and Hefter (2012).
Our objective is to estimate the total value of travel time saved by road users due to reduced congestion
for a given level of rail patronage. Let 𝑌(𝑄) be the average time required to travel one kilometre by road,
where 𝑄 is the number of road passenger-km travelled. Due to congestion, 𝑌 is increasing in 𝑄, ie average
THE ACT
travel time increases as the total amount of road usage increases. If 𝜔 is the average value of travel time
per hour, then the total cost of travel time as a function of 𝑄 is:
𝑇(𝑄) = 𝜔𝑌(𝑄)𝑄
(Equation 6.1)
To model externalities, we are interested in how
𝑇(𝑄) changes as 𝑄 changes:
𝑇′(𝑄) = 𝜔[𝑌(𝑄) + 𝑌′(𝑄)𝑄]
(Equation 6.2)
The change in total travel time resulting from an additional road passenger-km is thus composed of two
effects:
UNDER
1 The value of the additional travel time experienced by the additional traveller: 𝜔𝑌(𝑄)
2 The value of the additional travel time experienced by other road users as a result of the increase in
congestion: 𝜔𝑌′(𝑄)𝑄.
Effect (1) is not an externality – this reflects the private costs taken into account by the additional traveller.
Effect (2) represents the externality on other road users.
These two effects are illustrated in figure 6.3. The blue line represents the function 𝑌(𝑄), ie the
relationship between average travel time and total road usage. Suppose that road passenger-km increases
INFORMATION
1982
from level QA to QB. The yellow area represents additional travel time costs incurred by the additional
travellers. This is effect (1) above, and is not an externality. The green rectangle represents the increase in
travel time experienced by the road users who were already travelling at QA. This is effect (2) above and
represents the congestion externality.
For simplicity in the quantitative analysis, following Smart and Hefter (2012), we assume that 𝑌(𝑄) is a
RELEASED
linear function:
𝑌(𝑄) = 𝐴𝑄 + 𝐵
(Equation 6.3)
where 𝐴 and 𝐵 are parameters to be estimated, reflecting the relationship between average travel time and
total road passenger-km.
With this linear function, the marginal external congestion cost of road travel is:
OFFICIAL
𝜉(𝑄) = 𝜔𝑌′(𝑄)𝑄 = 𝜔𝐴𝑄
(Equation 6.4)
30 Although congestion charges have not been implemented, there are some instances of ‘road pricing’, including the
Northern Gateway toll road in Auckland and ‘Route K’ in Tauranga. The Tauranga Eastern Link road now under
construction will also be a toll road. However, although these tolls are used to recover the costs of construction, these
charges do not incorporate any congestion externality costs.
48
6
Externality modelling and estimation
The function 𝜉(𝑄) represents the additional travel time cost experienced by other road users due to one
additional passenger-km of road travel. If road usage reduces due to rail patronage, then 𝜉(𝑄) reflects the
resulting external cost savings of road users. To calculate the
total external benefit of a given level of rail
patronage we need to ‘add up’ these external cost savings over the relevant range of road usage.
The relevant range of road usage is bounded by the level of road usage at the current level of rail
patronage and the level of road usage that would be generated if rail patronage were zero.
Figure 6.3
Relationship between road passenger km and travel time
THE ACT
UNDER
In particular, let 𝑄1 be total road passenger-km given current rail patronage during a particular time period
(eg the peak period) and let 𝑄2 be total road passenger-km assuming the rail network did not exist, where
INFORMATION
clearly it is the case that 𝑄
1982
2 > 𝑄1. Then the total road congestion benefits of the current level of rail
patronage are given by:
𝑄2
𝑄2
𝜔𝐴
𝛯 = � 𝜉(𝑄)𝑑𝑄 = � 𝜔𝐴𝑄𝑑𝑄 =
2
2
(Equation 6.5)
𝑄1
𝑄
2 [𝑄2 − 𝑄1]
1
6.1.
3 Interpretation
RELEASED
The above model of congestion can be interpreted in the following way. First imagine that the volume of
traffic on roads and travel times is at its current level, given current rail patronage. Now imagine adding
extra passenger-km to the road network, up to the level that total road traffic would be if the rail network
did not exist. For each extra passenger-km added, calculate the additional travel time experienced by all
existing road users that is caused by the extra passenger-km. Place a dollar value on each of these
OFFICIAL
additions to travel time, and add up over the range of passenger-km added to the road network. The total
dollar value is the total congestion road cost saved by the current level of rail patronage.
Various studies have estimated total congestion costs for Auckland and other cities. The most recent
report for Auckland is Wallis and Lupton (2013). This study and others like it differ from ours as they seek
to estimate the
total congestion cost, rather than congestion costs saved by rail.
49
link to page 48 link to page 50
Metropolitan rail: external benefits and optimal funding
Estimating total congestion costs requires defining a standard against which the status quo is measured.
As discussed by Wallis and Lupton (2013), this can be done in different ways and the resulting estimates
of congestion costs can vary significantly. Wallis and Lupton estimate a cost for Auckland of $1250 million
per annum if free-flow is used as the baseline, versus $250 million per annum if ‘capacity’ is used as the
baseline, where capacity is defined as the level of road usage at which flow is maximised.
In contrast, as described above, our analysis measures congestion using an economic definition of congestion
externalities: the additional travel time experienced by existing road users as a result of an additional road
user’s decision to travel. For the purposes of our analysis this is a superior measure to costs calculated against
free-flow or capacity baselines, as both of these are arbitrary standards that do not necessarily represent
optimal levels of use of the road network, once all benefits and costs are accounted for.
THE ACT
6.1.
4 Schedule rearrangement costs
A significant component of the Wallis and Lupton (2013) congestion cost estimates for Auckland is what
they refer to as ‘schedule delay’ costs, which we refer to as ‘schedule rearrangement’ costs to avoid
confusion. These are costs incurred by road users who change their behaviour to travel at a less-preferred
time to avoid peak congestion. In other words, some drivers would have preferred to travel at peak
periods, but because of congestion they travel instead at another time. As a result they experience some
disbenefit from rearranging their travel plans.
31
Wallis and Lupton (2013) estimate an upper bound for these costs for Auckland as being between 65% and
UNDER
70% of the standard travel time congestion cost. Their methodology assumes that travellers adjust their
schedules in such a way that those travelling in the hours either side of the peak period are indifferent as
to whether they travel during that time or travel in the peak. Since the travel time around the peak is less
than within the peak, the difference in travel time is assumed to reflect the disbenefit that people receive
from travelling outside their preferred time.
Wallis and Lupton correctly note this is an estimate of the maximum schedule rearrangement cost, as
some people would have travelled immediately before or after the peak period for reasons other than
trying to avoid peak delays. For this reason we present schedule rearrangement costs separately and it
INFORMATION
1982
should be noted that actual costs will be somewhere between zero and this maximum.
Schedule rearrangement costs are not estimated by Smart and Hefter (2012). We present estimates of
congestion costs with and without an increment for schedule rearrangement costs, using the average
uplift (67.5%) estimated by Wallis and Lupton (2013) for Auckland
.32 The presence of schedule
rearrangement costs has the effect of significantly increasing the congestion cost estimate. This depends
on the plausible but untested assumption that a significant proportion of road users change the timing of
RELEASED
their travel to avoid periods of congestion. We also note that Wallis and Lupton (2013) describe their
schedule rearrangement cost estimates as an upper bound, and do not offer an alternative lower bound.
We follow the same approach and use a range starting at zero and ranging up to the upper bound.
6.1.
5 Quantification
To estimate the total road congestion benefits from rail patronage using the methodology described
OFFICIAL
above, the following four parameters need to be estimated:
31 Drivers may also ‘time-shift’ their journeys within peak times to reduce congestion delays.
32 In the absence of other data on the appropriate uplift, we also apply this same parameter to Wellington. We caution
however, that this is based on Auckland data only and may not be a reliable estimate of the schedule delay costs for
Wellington.
50
link to page 50 link to page 51
6
Externality modelling and estimation
𝜔: the average value of travel time per road passenger hour
𝐴: change in average road travel time per km due to an additional road passenger-km
𝑄1: total road passenger-km given current rail patronage
𝑄2: total road passenger-km if the rail network did not exist.
We assume that average value of travel time does not vary by location. The EEM gives various estimates for
valuing travel time.
33 We assume a value for 𝜔 of $20.22 per hour, reflecting the average value of travel
time used by the Transport Agency for urban arterial and other urban roads.
34
The other parameters 𝐴, 𝑄1 and 𝑄2 are location-specific and depend on the level of rail patronage and the
ACT
road and rail transport networks in each location. We therefore use different values for these parameters
THE
for Wellington and Auckland.
6.1.5.1
Congestion relationship parameter
The parameter
A will also vary at different times of the day, and in particular is likely to be greater during
peak periods than inter-peak periods, reflecting the more severe impact of additional vehicles on average
travel time during times when roads are close to capacity or are already experiencing congestion.
This is illustrated by figure 6.4, which shows the speed and flow relationship that is typically observed for
any given section of road. Starting from a situation of free flow (at the top left of the graph), which has a
low rate of flow but high vehicle speed, additional vehicles cause average speed to drop, but to a relatively
UNDER
small extent so that flow is still able to increase. At some point (the nominal ‘capacity’ of the road), the
impact of additional vehicles is such that speed and flow both diminish.
Figure 6.4
Typical relationship between vehicle speed and flow for a given road section
Speed
(km/hr)
Free flow
INFORMATION
1982“Capacity”
RELEASED
Flow (vehicles/hour)
OFFICIAL
33 See table A4.3 in the EEM.
34 This approach implies that the value of travel time is constant. However, we note that the relationship between travel
time and the value of time may be non-linear. For example, it may be that the value of 1,000 motorists saving 10
minutes each is larger than if 10,000 motorists saved one minute each, even though the total time saved is the same.
51
link to page 51
Metropolitan rail: external benefits and optimal funding
The upper portion of the speed-flow curve includes congestion effects, in the sense that additional
vehicles cause delay for existing vehicles on the road. The lower portion of the curve is referred to as
‘hyper’ congestion, as additional vehicles cause very high amounts of delay. During peak periods, many
roads will be close to capacity or on the hyper congestion portion of the speed-flow curve. This means that
additional vehicles on the road will have relatively severe delay effects on existing vehicles on the road,
and the value of the parameter
A in our model will be relatively high. Conversely, in inter-peak periods,
most roads will be on the upper portion of the speed-flow curve and the value of
A will be lower.
For both Auckland and Wellington we have used results from regional transport network models to
estimate the values of
A in peak periods and at other times. These models include a realistic
representation of the road and public transport networks, and incorporate calibrated speed-flow
THE ACT
relationships of the type illustrated in figure 6.4, for many different road segments. The models can be
used to predict average speeds at different times of the day, for given road travel volumes and public
transport patronage.
6.1.5.2
Road passenger-km parameters
Data on total road passenger-km given current rail patronage (
Q ) is readily available in existing transport
1
statistics. The total road passenger-km that would result if the rail network did not exist (
Q ) must be
2
estimated using assumptions about traveller behaviour in the absence of rail and the average distance of
rail journeys.
Our objective is to estimate the congestion reduction benefits of the rail network given the current level of
UNDER
patronage and given the existing road and other public transport networks. For the purpose of estimating
the optimal rail subsidy, we have assumed that the road and bus networks do not change from their
current form.
35 The degree of substitution to other modes then depends on travellers’ preferences and the
ability (capacity) of other transport networks to accommodate the additional demand.
We discuss our particular assumptions about substitution from rail to other transport modes in the
absence of rail for Wellington and Auckland below.
6.1.5.3
Congestion model results for Wellington
INFORMATION
1982
Data was provided to us by the Greater Wellington Regional Council based on analysis from its Strategic
Transport Model. This is an integrated model of transport in the Wellington region that incorporates road
and public transport modes.
The data provided was from a simulation exercise conducted in 2009 that estimated the effect of assigning
all rail transport demand to roads. The impact on vehicle kilometres travelled (VKT), vehicle travel time or
RELEASED
vehicle hours (VHR) and speed was calculated for different scenarios in the AM peak period, inter-peak
period, and estimated overall annual effect.
The road network modelling results provided to us for the baseline scenario and the no-rail scenario in
Wellington are shown in table 6.1. The no-rail scenario assumes that all rail users switch to private cars in
the absence of rail. In reality it is likely that some of these people would use other forms of public
transport instead, and the impact on congestion may be less than assumed by allocating all rail demand to
OFFICIAL
private cars. These results therefore represent an upper bound on the likely congestion effect. We also
estimate results for alternative scenarios below.
35 Although we are aware that aspects of Auckland’s public transport network are to be reconfigured, incorporating
these prospective changes (which were not finalised at the time of writing) would require a substantial expansion of this
analysis to consider the optimal allocation of resources between road, bus, rail and all other transport modes. This is
beyond the scope of our report, thus we take the road and other public transport networks as given.
52
link to page 52
6
Externality modelling and estimation
Table 6.1
Congestion modelling results for Wellington (average per day)
Time period
Scenario
Total car VKT
Ave speed
(km/h)
AM peak
Baseline
1,430,244
49
No rail
1,669,583
31
Inter-peak
Baseline
992,921
54
No rail
1,013,537
54
The Wellington transport model includes two time periods, with the AM peak assumed to be also
ACT
representative of the PM peak, and inter-peak representing all other time periods. Absent rail, peak VKT is
THE
estimated to increase by about 239,000km per day (17% relative to baseline) and inter-peak VKT is
estimated to increase by about 21,000km per day (2% relative to baseline).
The increase in peak VKT was estimated by the Wellington transport model to cause a significant
reduction in average travel speed of 17.5km/hour (36% relative to baseline), although this is under the
assumption that all rail users switch to cars in the absence of rail. In the inter-peak period, there is no
significant effect on average travel speed due to roads being relatively uncongested.
These results were supported by the congestion observed on State Highway 2 during the seven-day
closure of the Hutt Line between Petone and Wellington in June 2013 because of storm damage. Large
UNDER
delays to traffic at peak periods resulted in travel times of up to one hour 20 minutes between Melling and
Wellington. However, travel times during inter-peak periods appeared to be substantially less affected.
36
Preliminary analysis undertaken by the Transport Agency also supports our estimates. This analysis
predicted that if rail patronage were transferred to the state highway network, journey times during the
AM peak would increase by up to one hour 42 minutes (GWRC 2013, section 5.2). This is based on an
estimated additional 4972 vehicles (equivalent to 6811 rail passengers) travelling through Ngauranga
during the morning peak of 7:00am until 9:00am in the absence of rail services. The Transport Agency
estimated that it would take until around 11:00am for the queue to completely dissipate. This is shown in
INFORMATION
figure 6.5.
1982
RELEASED
OFFICIAL
36 See: www.stuff.co.nz/dominion-post/news/hutt-valley/8833240/Hutt-traffic-grinds-to-a-standstill
53
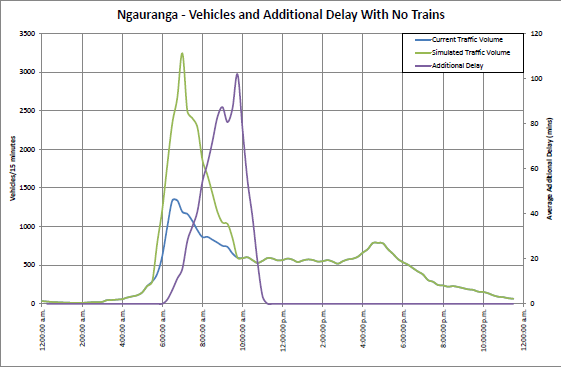
Metropolitan rail: external benefits and optimal funding
Figure 6.5
Ngauranga Gorge, traffic congestion modelling
THE ACT
Source: NZ Transport Agency
UNDER
We understand that the average car occupancy in Wellington is 1.4 passengers per vehicle and we used
this factor to convert car VKT into passenger-km, to facilitate congestion modelling on the basis of
passenger-km. Some additional scenario results from the transport model were also provided, enabling us
to estimate the relationship between road passenger-km and average hours per kilometre (the parameter
A in the model described above).
Figure 6.6 shows the estimated relationship between total road passenger-km and average hours per km
in the AM peak period, and figure 6.7 shows the same for the inter-peak period. As expected in both cases
there is a positive relationship, and the slope is steeper in the peak period, reflecting greater traffic levels
INFORMATION
1982
and the relative steepness of the speed-flow relationship at peaks. However, we caution that these results
are based on a limited number of scenarios and there is correspondingly high uncertainty associated with
the estimated value of the parameter
A in each case. Our results based on these scenarios should be
considered as indicative but not definitive of the congestion benefits of rail for Wellington.
RELEASED
OFFICIAL
54
6
Externality modelling and estimation
Figure 6.6
Estimated relationship between AM peak daily road passenger-km and average hours per km in
Wellington
0.035
y = 9E-09x + 0.009
0.030
0.025
m 0.020
per k
THE ACT
0.015
Hours
0.010
0.005
0.000
0
500,000
1,000,000
1,500,000
2,000,000
2,500,000
Passenger km
Source: Calculated from data provided by Greater Wellington Regional Council
UNDER
Figure 6.7
Estimated relationship between inter-peak daily road passenger-km and average hours per km in
Wellington
0.0190
y = 2E-09x + 0.0154
0.0185
0.0180
INFORMATION
1982
m 0.0175
per k
0.0170
Hours
0.0165
RELEASED
0.0160
0.0155
0
200,000
400,000
600,000
800,000 1,000,000 1,200,000 1,400,000 1,600,000
Passenger km
OFFICIAL
As mentioned above, the Wellington ‘no rail’ scenario assumes that all passengers travel by car in the
absence of rail. The most recent (2012) data from the Ministry of Transport’s New Zealand Household Travel
Survey indicates that all modes of public transport accounted for approximately 17% of travel to work
55
link to page 53
Metropolitan rail: external benefits and optimal funding
kilometres and around 6% of all travel in the Wellington region.
37 This suggests a high propensity to use cars
over public transport, but these results reflect the travel patterns of all travellers. Regular rail users may have
different preferences for using cars versus other public transport modes, if rail were not available.
We were also provided with some data indicating the behaviour of rail passengers in response to
announced rail network closures in Wellington, where replacement buses were provided. The number of
such occurrences was small, thus the results must be interpreted cautiously. This data indicated that
approximately 80% of rail passengers used replacement buses, while the remainder used some other
unknown transport mode or did not travel. This suggests that the propensity of rail users to substitute to
other public transport modes in the absence of rail may be relatively high, although these results reflect
temporary shutdowns only, where replacement bus services were provided that closely mimicked the
THE ACT
existing rail service and passengers were not required to use buses on a permanent basis.
From this information, it is difficult to be precise about how Wellington rail users would travel in the
absence of rail. The propensity of the average Wellington resident to use private cars is high, but rail users
may behave differently. As a result we consider two alternatives to the scenario of all rail users switching
to cars. In our first alternative scenario we double the household travel survey percentages using private
cars and assume that in the absence of rail, around one third of rail users travel by other public transport
modes (ie bus) and two thirds use cars in peak periods, and that similarly 12% use public transport and
88% use car in inter-peak periods. To generate results for this alternative scenario we scale back the
increases in VKT between the baseline and no-rail scenarios in table 6.1 by 34% in peak and 12% in inter-
peak periods. Our second alternative scenario assumes that in the absence of rail, two thirds of current
UNDER
rail users would use buses and one third cars during peak periods.
Table 6.2 shows the estimated congestion benefits of rail across these three scenarios. Given the current
level of patronage, the Wellington metropolitan rail network is estimated to generate congestion benefits
of somewhere between $21 million and $67 million per annum. To this can be added estimated schedule
rearrangement benefits (as noted above, based on analysis from Auckland), potentially up to a maximum
of $45 million per annum, depending on the scenario. The vast majority of the benefits (over 90%) are in
the peak time period, with inter-peak benefits being quite small.
INFORMATION
1982
Table 6.2
Congestion modelling results for Wellington
Scenario
Congestion
Maximum
Maximum
benefit
rearrangement
total
($m/yr)
benefit
($m/yr)
($m/yr)
All rail patronage switches to cars
67
<45
$112
RELEASED
Alternative: Most rail patronage switches to cars
44
<30
$73
Alternative: Most rail patronage switches to
21
<14
$35
buses
6.1.5.4
Congestion model results for Auckland
OFFICIAL
Transport data was provided to us by Auckland Council based on the Auckland Transport Model. As for
Wellington, this is an integrated model of road and public transport, and can be used to estimate VKT and
average speed during three time periods: AM peak, PM peak, and inter-peak. The model is calibrated using
37 See:
www.transport.govt.nz/research/Documents/Main%20urban%20area%20travel_2%20year%20moving%20av
erage_2003_2011.xls.
56
6
Externality modelling and estimation
2006 data, so the data provided to us was forecasts for 2011 transport volumes. We were also provided
with forecasts out to 2041 under medium and high population growth scenarios. We used the medium
growth forecasts in some of our analysis.
The road network modelling results provided to us for the 2011 baseline and estimated VKT if the
Auckland rail network did not exist are shown in table 6.3. These results suggest that the effect of the rail
network on average road speeds across Auckland, and thus on congestion, is relatively small.
However it should be noted that the results provided to us are based on current patronage levels and
assume that in the absence of rail, the majority of rail passengers travel by bus instead, with no
corresponding increase in bus VKT and no impact of additional buses on congestion.
ACT
Table 6.3
Congestion modelling results for Auckland (average per day)
THE
Time period
Scenario
Total car VKT
Average speed
(km/h)
AM peak
2011 baseline
5,105,847
45.1
2011 no rail
5,137,046
44.9
Inter-peak
2011 baseline
4,302,856
49.0
2011 no rail
4,316,911
48.9
PM peak
2011 baseline
5,297,446
46.0
2011 no rail
5,317,593
45.9
UNDER
To overcome these limitations we have developed alternative scenarios for Auckland. The first is based on
the 2011 results but assumes that all rail passenger-km become car passenger-km in the absence of rail.
This is the same assumption as one of the Wellington scenarios and represents an upper bound on the
congestion benefits of rail.
The development of these scenarios is shown in table 6.4. In each case we start with the 2011 baseline
and add the rail passenger-km to calculate car passenger-km without rail. This is the same approach used
for Wellington. The values for car passenger-km with and without rail can be input into the congestion
INFORMATION
1982
model as the values of
Q and
Q .
1
2
The second baseline scenario we have used is based on the forecasts provided to us is for 2031, and again
in that year we assume that all rail passenger-km become car passenger-km in the absence of rail.
Table 6.4
Alternative road congestion scenarios for Auckland (average per day)
RELEASED
Time period
Car passenger-
Rail passenger-
Car passenger-
km with rail
km
km without rail
2011
AM peak
6,127,016
127,084
6,254,099
Inter-peak
5,163,427
39,704
5,203,130
PM peak
6,356,935
132,880
6,489,815
OFFICIAL
2031
AM peak
7,864,504
383,062
8,247,566
Inter-peak
7,355,075
102,775
7,457,850
PM peak
8,333,931
302,187
8,636,118
Source:
Calculated from data provided by Auckland Council.
57
Metropolitan rail: external benefits and optimal funding
To carry out the congestion analysis, we need an estimate of the relationship between total passenger-km
and average travel time (the parameter
A in the theoretical congestion model). Figure 6.8 shows these
relationships for the scenarios provided to us. We have converted VKT to passenger-km assuming 1.2
passengers per car. The three relationships are approximately linear in nature, yielding values for
A of
1.55E-09, 1.15E-09 and 1.92E-09 in the AM peak, inter-peak and PM peak time periods respectively.
Figure 6.8
Estimated relationships between daily road passenger-km and average travel time in Auckland
0.029
0.028
0.027
THE ACT
0.026
0.025
m
per k 0.024
Hours 0.023
0.022
0.021
AM Peak
UNDER Interpeak
0.020
PM Peak
0.019
5.0
5.5
6.0
6.5
7.0
7.5
8.0
8.5
9.0
9.5
Passenger km
Millions
Source: Calculated from scenarios provided by Auckland Council.
Table 6.5 shows the congestion modelling results for Auckland, under the three scenarios described
INFORMATION
1982
above. We use the same annualisation factors as for Wellington, to convert daily results to annual (245 for
the AM and PM peaks and 2038 for inter-peak). The congestion benefits of rail for 2011 vary between $7
million and $24 million, plus schedule rearrangement benefits of between $5 million and $16 million. The
congestion benefits increase to a maximum of $84 million in 2031, plus schedule rearrangement benefits
of $57 million.
RELEASED
Table 6.5
Congestion modelling results for Auckland
Scenario
Congestion
Maximum
Total ($m per
benefit ($m
schedule
annum)
per annum)
rearrangement
benefit ($m per
annum)
OFFICIAL
2011
All rail patronage switches to cars
24
16
$40
Most rail patronage switches to cars
16
11
$26
Most rail patronage switches to buses
7
5
$12
2031
All rail patronage switches to cars
84
57
$141
58
6
Externality modelling and estimation
6.1.5.5
Comparing results for Auckland and Wellington
There are significant differences in the magnitude of the congestion benefits for rail in Auckland and
Wellington. These differences reflect differences in the level of rail patronage relative to road usage, and
different implications of increases in road traffic volumes for congestion and travel times in each city.
Table 6.6 illustrates the difference in the relative importance of rail – in Auckland around 2% of peak
passenger-km uses rail, compared with 17% in Wellington. In relative terms, the pressure that rail
passenger demand would put on the road network in Wellington if rail were unavailable is significantly
greater than in Auckland. We note, however, that these are region-wide averages and some congestion in
some places in Auckland may be more significant, particularly for roads close to the rail network.
ACT
Table 6.6
Comparison of rail and road passenger demands in Auckland and Wellington
THE
Auckland
Wellington
AM peak
Road passenger-km
6,127,016
1,976,659
Rail passenger-km
127,084
330,777
Rail %
2%
17%
Inter-peak
Road passenger-km
5,163,427
1,372,260
UNDER
Rail passenger-km
39,704
28,492
Rail %
1%
2%
PM peak
Road passenger-km
6,356,935
na
Rail passenger-km
132,880
na
Rail %
2%
na
Source: Calculated from data provided by Auckland Council and Greater Wellington Regional Council.
INFORMATION
1982
The second reason for the difference is the relative steepness of the relationship between road passenger-
km and average travel time (the value of the parameter
A in the congestion model). Based on the
information provided to us, this relationship in peak times appears to be significantly steeper in
Wellington than Auckland, although total transport volumes are lower in Wellington (figure 6.9).
This suggests that Wellington’s road network is closer to its overall capacity than in Auckland, and
RELEASED
congestion effects if rail did not exist would be more severe. These results depend on the transport
modelling assumptions embedded in the two models and the results provided to us. To some extent these
results are supported by the aftermath of the June 2013 storm events in Wellington.
It is also interesting to note the relative similarity of peak and inter-peak congestion relationships for
Auckland, while in Wellington there is a significant difference between peak and inter-peak. This likely
OFFICIAL
reflects relatively high traffic volumes on Auckland’s road network in inter-peak periods, something noted
by Wallis and Lupton (2013).
59
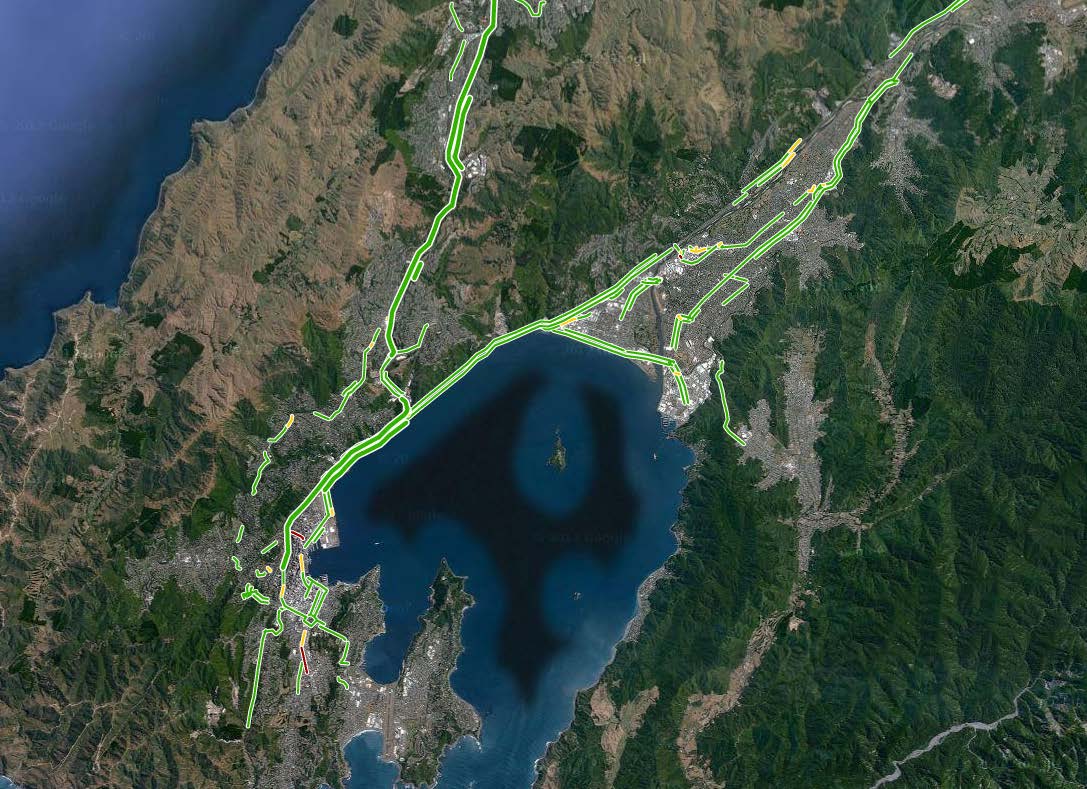
Metropolitan rail: external benefits and optimal funding
Figure 6.9
Comparison of the relationships between road passenger-km and average travel time between
Auckland and Wellington
0.035
0.030
0.025
m 0.020
ACT
per k
THE
0.015
Hours
AKL AM Peak
0.010
AKL Interpeak
AKL PM Peak
0.005
WLG AM Peak
WLG Interpeak
0.000
0
1
2
3
4
5
6
7
8
9
10
Average Daily Passenger km
UNDER Millions
These differences between Auckland and Wellington may be at least partially explained by differences in
the geographical layout of these cities and the resulting road and rail networks. Specifically, there is a
substantial bottleneck in Wellington’s road network just north of the CBD where State Highway 1 and State
Highway 2 connect (figure 6.10).
Figure 6.10 Wellington with selected elements of road network displayed
INFORMATION
1982
RELEASED
OFFICIAL
Source: Google Maps
60
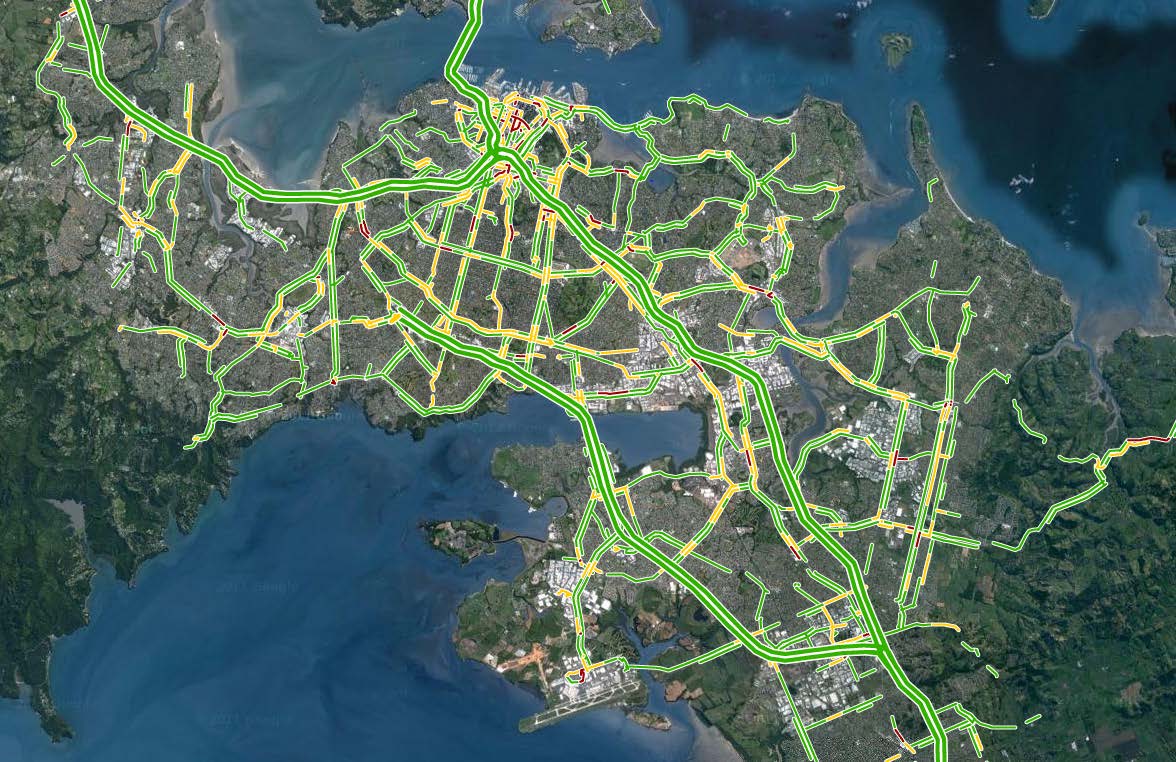
6
Externality modelling and estimation
Because the main railway lines run roughly parallel with these roads they provide an effective substitute
for individuals travelling south into the city centre in the AM peak and north out of the centre in the PM
peak.
In contrast, the bottlenecks in Auckland’s road network, at least on those routes for which rail provides a
viable alternative (figure 6.11) are much less pronounced. For instance, commuting into the isthmus from
the west, the main roadways include State Highway 16, Great North Road, New North Road and Blockhouse
Bay Road amongst others. For those travelling from the south there is State Highway 1, State Highway 20,
Great South Road and the Ellerslie-Panmure Highway amongst other routes.
Furthermore, a substantial proportion of rail commuters in Auckland make relatively short journeys from
within the isthmus. If rail were not available there is wide range of road routes that these commuters
THE ACT
would use to enter the city centre. Additionally, within Auckland’s isthmus other modes of transport, such
as buses, cycling or walking may also provide an effective substitute to rail for many of these individuals.
This would tend to limit the congestion that would otherwise occur in the absence of rail services. This
differs from Wellington where the absence of rail would result in a large number of commuters having to
travel through a single pinch-point in the road network.
Figure 6.11 Auckland with selected elements of the road network displayed
UNDER
INFORMATION
1982
RELEASED
Source: Google Maps
6.2 Emissions externalities
OFFICIAL
Air emissions arise when fuel is burned by vehicles, or is burned to generate electricity for electric
vehicles. These emissions include ‘greenhouse gases’ (GHGs) such as carbon dioxide (CO ) that lead to
2
61
link to page 56
Metropolitan rail: external benefits and optimal funding
climate change, and airborne particulates that cause detriments to human health.
38 Air pollution disperses
to such an extent that these effects can be considered to be felt by the entire population, not just
transport users.
To the extent that rail transport is more fuel efficient than road transport, usage of rail will reduce
emissions and the consequent reduction in externalities is a benefit of rail. As with congestion, if harmful
emissions are not appropriately priced, these externalities can justify a subsidy for rail.
A further potential environmental externality of rail may arise if fewer private journeys in cars result in less
chemical ‘run-off’ from roads. Such run-off may have a negative impact on surrounding soil or waterways.
Although a potential benefit from rail, we consider that the incremental run-off avoided is likely to be
insufficient to have any significant additional impact on the roadside environments in Auckland and
THE ACT
Wellington.
6.2.
1 Principles
The economic principles of emissions externalities are essentially the same as congestion externalities, as
illustrated in figure 6.2. The existence of emissions externalities means that the marginal social cost of
road transport exceeds the marginal private cost, and road usage decisions based on private benefits and
costs lead to excessive travel by road. Welfare can be increased by reducing road usage, either by putting
a price on emissions, or by using subsidies to encourage road users to use other forms of transport.
6.2.1.1
Greenhouse gas emissions
UNDER
CO is very long lived and mixes thoroughly throughout the earth’s atmosphere. This means emissions of
2
CO from New Zealand have a global impact. Some estimates have been made of the global climate change
2
costs of an additional tonne of CO emitted, but the proportion of this cost borne by New Zealand is
2
extremely small. The marginal external damage costs experienced by New Zealand as a result of
New Zealand CO emissions are, for all intents and purposes, zero. This is the reason why climate change
2
is being tackled globally, as individual countries have no incentive to act unilaterally.
The cost to New Zealand of emissions of CO and other greenhouse gases from New Zealand are better
2
INFORMATION
measured as the costs of New Zealand coming into compliance with its obligations to limit emissions.
1982
Although New Zealand has chosen not to be bound by emission limitation commitments in the second
commitment period of the Kyoto Protocol, it has effectively taken on commitments by continuing to
include certain emission sources and sinks in the Emissions Trading Scheme (ETS). It may face additional
costs as a result of the international community’s response to its lack of quantified commitments, but
these costs do not translate into marginal costs per unit of emissions.
RELEASED
Under the ETS, suppliers of liquid fuels in New Zealand have obligations to surrender emission units in
proportion to fuel sold for domestic consumption. The current obligation is one New Zealand unit (NZU)
per two tonnes of CO emissions equivalent. The cost of these units is passed on in the fuel price. This 1-
2
for-2 obligation is effectively an emissions obligation to New Zealand and results in an additional cost per
additional unit of fuel consumed. The national obligation is equivalent to the aggregate of the obligations
of the individual firms. GHG emission costs are thus already internalised in fuel prices via the ETS. The
OFFICIAL
level and nature of the obligation changes if the government takes on some new obligation, but it would
be expected that the costs of this would also be internalised via the ETS.
38 In addition to airborne emissions, those living near to transport infrastructure may experience negative externalities
due to noise and visual amenity, and contaminated water run-off may affect the natural environment. These effects are
difficult to quantify reliably, so we focus on the effects of airborne emissions here.
62
link to page 64 link to page 62
6
Externality modelling and estimation
The existence of the ETS means that it would be inefficient to further adjust the relative price of rail via a
subsidy on the grounds that usage of rail reduces New Zealand’s emissions obligation. Doing so would
effectively double-count the emissions obligation benefits, and would lead to an inefficiently low level of
road usage and inefficiently high level of rail usage, everything else equal.
In summary, we do not estimate benefits of rail usage associated with reductions in CO emissions, as any
2
associated benefits are already internalised by transport users via the operation of the ETS.
6.2.1.2
Particulate emissions and health effects
Airborne emissions from transport activity have direct negative effects on human health. These effects are
relatively localised (unlike the globally dispersed effects of CO emissions) and affect transport users as
2
ACT
well as any other individuals in the vicinity. If such costs created by transport activity are significant, a
THE
subsidy for rail could be appropriate, if rail emissions are lower than for other transport modes.
39
Accordingly, we estimate the total value of external health benefits for a given level of rail patronage.
Denne (2006) examined the health costs of various types of emissions in New Zealand, and concluded that
only the effects of particular matter smaller than 10 microns in diameter (PM10) and sulphur dioxide (SO )
2
were significantly large enough to measure. The effect of these emissions is to cause some people to die
earlier than they otherwise would. The cost of this is therefore the value of the lost years of life discounted
back to present value terms. We present marginal external cost estimates for PM10 and SO in
2
New Zealand in section
6.2.3 below.
UNDER
6.2.
2 Theoretical model
Again we follow the approach set out in Smart and Hefter (2012). Vehicle emissions are proportional to
the number of litres of fuel burnt. As discussed above, the effects of PM10 and SO emissions are felt by
2
the entire population. Thus it is appropriate to assume that
all of the emissions effects of changes in the
amount of transport fuel burnt are externalities. In other words, an additional passenger-km travelled by
car will generate some emissions, and all associated health costs are counted as externalities.
With this in mind, the quantity of fuel burnt depends largely on VKT, rather than passenger-km.
INFORMATION
1982
To illustrate, we use 𝛾𝑚 to represent the marginal external health costs of emissions for an additional
passenger-km travelled by mode
m. For simplicity we assume that the marginal external costs associated
with emissions are constant with respect to the volume of travel on each mode. Thus the total external
emissions benefit associated with rail travel is given by:
Ψ = 𝑅[𝜎bus(𝜓bus − 𝜓rail) + 𝜎car(𝜓car − 𝜓rail)]
(Equation 6.6)
RELEASED
Where:
𝑅 is total passenger-km travelled by rail
𝜎bus is the change in passenger-km travelled by bus for a given change in passenger-km travelled by rail
𝜎car is the change in passenger-km travelled by car for a given change in passenger-km travelled by rail.
OFFICIAL
The parameters 𝜎bus and 𝜎car capture the rate of substitution between use of rail and use of other transport
modes. Given these rates of substitution, the emissions externalities depend on the difference between
the marginal external cost per passenger-km travelled by rail versus by bus and by car.
39 The metropolitan rail fleet in Wellington is electric and the Auckland network will be electrified within a few years.
Around half of New Zealand electricity generation is hydroelectric, with no emissions. The remaining generation
capacity is relatively efficient compared to vehicles and located away from population centres in many cases.
63
link to page 63
Metropolitan rail: external benefits and optimal funding
6.2.
3 Quantification
Denne (2006) reports estimates of the marginal external health costs of PM10 and SO for New Zealand.
2
Our estimates are based on his figures, inflated to 2013 dollars. These calculations are shown in tables
6.6 and 6.7
Table 6.6
Estimated marginal external cost of PM10
g PM/ litre
litres/100km
g PM/km
health cost
$ per VKT
$/tonne PM
Car (petrol)
1.00
9
0.050
5850
0.00053
Bus (diesel)
3.40
30
0.060
5850
0.00597
THE ACT
Source: Calculated from Denne (2006).
Table 6.7
Estimated marginal external cost of SO2
g SO /litre
litres/100km
g SO2/km
health cost
$ per VKT
2
$/tonne SO
2
Car (petrol)
0.112
9
0.010
3,456
0.000035
Bus (diesel)
0.084
30
0.025
3,456
0.000087
Source: Calculated from Denne (2006).
UNDER
Overall we estimate a marginal external health cost per VKT of $0.000561 for cars and $0.00605 for
buses. On this basis, the marginal external health costs associated with reduced vehicle emissions due to
rail usage are insignificant, even if we assume that all rail passengers use cars in the absence of rail and
that the marginal external health cost of rail is zero.
40
6.3 Agglomeration and competition benefits
Agglomeration externalities are productivity benefits arising in cities and other employment-dense
INFORMATION
1982
regions. There is a branch of the economics literature that examines these effects and develops methods
for quantifying them. Public transport can generate agglomeration benefits by reducing the cost of travel
into a CBD, with the change in relative prices stimulating commuting activity by some people.
This topic has been covered very well in New Zealand through recent work by Hazledine et al (2013). In
that work, the agglomeration benefits of two projects were estimated. The central connector bus corridor
RELEASED
in Auckland was estimated to produce almost $2 million of benefits per annum by 2021, which is 23% of
the ‘conventional’ benefits. The double tracking and electrification of the rail corridor to Waikanae was
estimated to produce a total NPV benefit of $3.45 million which is only 3% of ‘conventional’ benefits.
Agglomeration benefits of this type only arise when more people travel. They are consequently most
relevant to the decisions over capital investment projects that will induce extra travel. While it is
theoretically valid to use estimates of agglomeration benefits as part of the gap between the private and
OFFICIAL
social calculus for rail usage, two factors need to be borne in mind with this approach to avoid double
counting:
40 Although Auckland services currently rely on diesel powered locomotives and multiple units, this analysis is based on
an electrified service, as electrification is scheduled to be completed within the next two years.
64
6
Externality modelling and estimation
• If agglomeration benefits are used to justify a capital subsidy for a construction project, it would not
then be valid to consider them again when setting optimal fares.
• If the congestion benefits of usage are evaluated based on an expectation that all current rail
passengers would travel by road in the absence of rail, then it is not valid to also add an
agglomeration benefit.
The second point may need some elaboration. Consider how a rail commuter would respond if rail
services were no longer available. If they would travel by road, then the rail service is contributing to a
reduction in road congestion, and this effect should be counted as part of the congestion externality. If
they would stay at home or work locally, then the rail service is contributing to an agglomeration benefit,
but no congestion benefit.
THE ACT
For this project, we have included all rail trips as part of the congestion benefit and so we have not
estimated separate agglomeration benefits. While we consider this conservative approach is appropriate in
relation to existing levels of rail patronage, agglomeration benefits may become relevant if any increase in
future rail patronage involves a significant number of journeys that would not otherwise occur.
6.3.
1 Increased commercial activity and competition
As well as agglomeration benefits, rail may also benefit businesses which are located near to rail stations.
Retail businesses in particular may obtain spillover benefits from rail services as a result of increased foot
traffic. Over time, such benefits are likely to be reflected in higher commercial property rents and,
UNDER
therefore, feed through into upward impacts on property values.
However, a substantial proportion of this additional activity is likely to be a diversion of trade away from
other existing businesses. This diversion effect would work to reduce the value of sites negatively affected
by rail. However, there may remain a small positive impact arising from the fact that commuters have a
greater range of retail choices available to them. Nevertheless, we consider that the overall net impact is
likely to be negligible once diversion is factored into the analysis.
Similarly, if rail reduces road congestion and provides improved transport options, this reduction in the
INFORMATION
generalised cost of transport can result in increased competition between some firms, particularly those
1982
that rely on road or rail transport, either directly or because their consumers rely on transport services.
This can generate additional output and lower prices in these downstream markets. In the absence of
quantitative estimates of these impacts we have used a conservative approach and considered these
benefits to be negligible.
6.4
RELEASED
Crash and safety benefits
The use of rail results in fewer vehicle journeys which may result in fewer traffic crashes. Fewer crashes
may in turn result in less physical harm, lower emergency and healthcare costs, and lower crash damage
costs. Some portion of these costs would constitute negative externalities arising from road transport.
Therefore to the extent that they are avoided because of increased rail use, these avoided negative
OFFICIAL
externalities of road transport constitute external benefits of rail.
Although less traffic is likely to mean fewer crashes, less congestion also means that traffic speeds are
higher. Consequently, while there may be fewer crashes in the absence of rail, those that do occur may be
more serious. Additionally, the presence of rail may lead to a small number of rail-related incidents, for
instance around level crossings with pedestrians. The external cost of these would work to offset the
benefits of rail to some degree.
65
link to page 64
Metropolitan rail: external benefits and optimal funding
6.4.
1 Principle
Fewer crashes arising from less road traffic would reduce total road crash costs. However, it is only the
proportion of crash costs that are externalities that are relevant to determining the external benefit of rail
that may justify subsidisation. Those crash costs that are effectively incorporated into the generalised cost
of transport faced by motorists (ie internalised), and therefore inform peoples’ decisions regarding which
mode of travel they choose, would not constitute externalities.
For instance, crash damage costs incurred by motorists, whether via insurance or by direct liability, as well
as healthcare costs covered by the Accident Compensation Corporation (ACC) and incorporated into
vehicle operating costs are implicitly factored into peoples’ decisions regarding their chosen mode of
ACT
transport. This suggests that such costs are not true externalities. The exceptions to this are those crash
THE
costs, physical harm or emotional distress incurred by those others than motorists who have chosen to
drive. This could include third parties affected by crashes, such as pedestrians, family members of crash
victims, property owners who suffer uninsured loss from road crashes, and taxpayers who are forced to
fund emergency service costs that are not covered by the ACC.
6.4.
2 Quantification
One approach to estimating the possible scale of the potential external crash benefits of rail would be to
multiply the rate at which crashes occur by the VKT avoided by the existence of rail to establish an
estimate of the number of crashes. This number could then be multiplied by the average external costs of
UNDER
traffic crashes.
Based on the transport modelling outlined in section 6.1.5, the absence of rail in Wellington would lead to,
at most, an additional 141.6 million VKT per year. The corresponding figure for Auckland is 144.6 million
VKT per year. Given that these estimates are based on scenarios in which all rail users would instead use
cars in the absence of rail, the actual increase in VKT is likely to be much lower. Based on the scenarios we
have estimated, actual increases in VKT are more likely to be less than half of these figures, ie under 70
million VKT per year.
Over the entire road network as a whole, road injury crashes occur at a rate of around 25 per 100 million
INFORMATION
1982
VKT
.41 However, whether crashes occur at the same rate over the roads that are affected by the existence
of rail is uncertain.
If crash rates on suburban roads and city motorways in Auckland and Wellington are lower on a per
kilometre travelled basis than on rural roads and state highways elsewhere, applying the rate above will
overestimate the actual number of crashes avoided. As a result, these figures suggest that the number of
RELEASED
injury crashes avoided because of rail may be in the order of around 10 to 15 per year in both Auckland
and Wellington. Although there may be a much larger number of non-injury crashes, more minor crashes
are less likely to generate significant externalities. However, if crashes are more likely to occur at higher
speeds, then a reduction in speed caused by increased congestion may also reduce the rate at which
crashes occur.
Given that a substantial proportion of resulting crash costs, such as damage costs, are not likely to be true
OFFICIAL
externalities, and because higher speeds resulting from less congestion could increase crash rates, we
have taken a conservative approach and assumed that the external crash and safety benefits of rail that
would justify subsidisation are negligible.
41 www.transport.govt.nz/ourwork/TMIF/Pages/SS014.aspx
66
link to page 66
6
Externality modelling and estimation
6.5 Option value benefits
Individuals may place a positive value on the existence of rail services irrespective of whether they use
these services. This value may stem from the fact that rail can provide an alternative form of transport
should other modes not be available. This is referred to as an option value.
Additionally, it is possible that some individuals may also obtain benefits from the existence of rail arising
from strong personal preferences for the wider use of rail over private vehicles or merely for aesthetic
reasons, ie train spotters. These benefits may arise as a result of environmental concerns and a perception
that rail has environmental advantages. These can be described as non-use, or existence, benefits.
ACT
The value that individuals place on having access to rail, or its existence, even if they do not intend to use
THE
rail services, are reflected in their ‘willingness to pay’ for the continued existence of rail services. This
willingness to pay is separate from any benefits that they may obtain from actual usage.
6.5.
1 Quantification
In the absence of actual transactions in which individuals directly contribute towards the cost of rail, it is
necessary to estimate the willingness to pay of individuals using other means. In some cases hedonic
pricing analysis may be useful for estimating these benefits. Such analysis could be used to determine the
additional value individuals place on properties that have access to rail compared with properties that do
not. However, it would be difficult to determine the extent to which any such rail premium related to any
UNDER
option value residents obtained compared with any consumer surplus benefit any residents obtained from
actual use. In any case, we did not obtain sufficient data to allow us to undertake such analysis.
Another approach to estimating the option value of rail is through the use of contingent valuation
methods which seek to identify how much individuals would be willing to pay to obtain, or maintain, rail
services. This is primarily achieved using willingness-to-pay surveys. While this approach has the
advantage of being relatively straightforward to implement, willingness-to-pay surveys also have a number
of drawbacks. For instance, responses may be highly sensitive to the framing of questions. Respondents’
answers to hypothetical questions may also not reflect what they would actually be prepared to pay in
INFORMATION
1982
practice, and responses may be affected by cognitive biases. In this case, it may also be difficult for
respondents to differentiate between non-use values and any consumer surplus benefits from rail usage.
Because of these drawbacks, more complex methods such as choice experiments are increasingly being
used because they provide more accurate estimates. Choice experiments involve the use of more complex,
detailed surveys that obtain information about the trade-offs individuals and households are prepared to
RELEASED
make in order to obtain the benefits of a specific policy or investment.
Unfortunately no choice experiment studies relating to willingness to pay for rail have been conducted in
Auckland and Wellington. However, we are aware of willingness-to-pay studies regarding access to rail that
have been carried out overseas,
42 and one study recently undertaken in New Zealand. Wallis and Wignall
(2012) estimated option values and non-use values for public transport in several areas in New Zealand. In
particular, this study undertook a willingness-to-pay survey to generate estimates of the option and non-
OFFICIAL
use values of commuter rail in three locations, Te Kuiti, Featherstone and Tuakau.
Data from this study suggests that the option and non-use value per household of rail is $86 in Tuakau
(60km south of Auckland) and $132 in Featherston (65km north of Wellington). These value estimates
were multiplied by the rail catchments in Auckland and Wellington, estimated at approximately 110,000
42 For instance see Geurs et al (2006).
67
link to page 67
Metropolitan rail: external benefits and optimal funding
and 150,000 households respectively. This approach would suggest that total option value benefits may
be as high as $9.5 million in Auckland and $15 million in Wellington.
However, we believe that these estimates overestimate the likely option values for the majority of
households in these rail catchments. This is because alternative modes of public transport in Tuakau and
Featherston into the respective CBDs are either extremely limited or relatively expensive. Specifically, there
are likely to be few, if any, buses servicing Auckland and Wellington from these areas and taxi journeys
may cost in excess of $100. In contrast, the majority of households in both rail catchments are in less
remote, urban areas for which there are more abundant alternative transport alternatives, eg cycling,
walking, buses, taxis. Consequently, we consider that actual option value benefits are likely to be
substantially smaller than these figures although in the absence of further information it is not possible to
THE ACT
estimate these values with any precision.
6.6 Wider social benefits
The benefits that disadvantaged individuals obtain from using rail are direct user benefits (ie consumer
surpluses) and therefore do not constitute external benefits of rail that justify subsidisation.
43 Aside from
these direct use benefits however, external gains may arise if the wider community places a positive value
on the ability of certain groups to have sufficient access to transport. That is, there may be a willingness
to pay across the wider community to ensure that disadvantaged individuals have access to the provision
of affordable transport services.
UNDER
We presume it is this willingness to pay that is reflected in the existing subsidised taxi services available for
disabled individuals in both Auckland and Wellington (NZ Transport Agency 2014). Individuals that qualify
for the taxi schemes are eligible for subsidies of 50% of taxi fares up to $80 per journey, ie the maximum
subsidy is $40.
Given the existence of subsidised taxis services, the provision of rail services for disabled users effectively
lowers the costs to the community (ie ratepayers and taxpayers) of providing specialised subsidised
services to these individuals. Consequently, we have included the value of disabled taxi subsidies that are
potentially avoided by the use of rail as an external benefit of rail.
INFORMATION
1982
6.6.
1 Quantification
Figures from Auckland Transport suggest there are currently around 45,000 rail journeys undertaken in
Auckland by disabled users each year. As similar figures for Wellington are not available, we have assumed
that the proportion of disabled journeys to total journeys is similar to Auckland and applied this ratio to
RELEASED
total patronage figures. This suggests there are around 50,000 rail journeys per year in Wellington by
disabled individuals.
We then assume that that each of these rail journeys would have otherwise have been undertaken in a
subsidised taxi, and that each journey would have attracted the maximum annual taxi subsidy of $40. This
implies that the cost avoided by the use of rail may be up to $1.8 million in Auckland and $2 million in
Wellington. Given that these figures assume that each of these journeys would have attracted the
OFFICIAL
maximum subsidy if taken by taxi, these estimates should be considered upper bounds as some
proportion of these journeys are likely to attracted subsidies lower than $40.
43 Concessionary fares provided to targeted groups can be thought of as transfers which increase the consumer
surpluses of these users at the expense of those who fund rail.
68
link to page 68 link to page 69 link to page 69
6
Externality modelling and estimation
6.7 Resilience
If an adverse event disrupts elements of the road networks in either Wellington or Auckland, metropolitan
rail may provide an alternative means of transportation. Consequently, rail improves the overall resilience
of the entire transport network. This may generate external benefits in the form of fewer delay costs
and/or the fewer losses of commercial and social activity that would otherwise occur if road networks
were compromised.
Disruptions to the road network may range from relatively short term, eg a crash may block a road for
several hours, to more severe and longer lasting disruptions, for instance a natural disaster or
construction failure may close a motorway for a period of days or weeks. Similarly a severe shock to oil
THE ACT
supplies could substantially curtail private motor vehicle use but leave electrified rail services
unaffected.
44
Because resilience benefits arise largely from the existence of the rail network and are not affected by
changes in usage over time, it may be inappropriate to internalise these benefits into fare subsidies.
However, it may still be appropriate for some degree of public contribution towards the overall total cost
of rail on the basis of network resilience impacts.
6.7.
1 Quantification
Because of the high degree of uncertainty regarding the likelihood and scale and possible disruptions to the
UNDER
transport network, resilience benefits are inherently difficult to quantify. The magnitude of the contingency
benefit of rail is related to the disruption costs that would be avoided by using rail to bypass the road
network in the event usage of the road network is curtailed. Disruption costs include the costs of delay and
the economic and social activity lost as a result of road network blockages. The expected resilience benefit
would be equal to the sum of avoided disruption costs from all possible types of road network disruptions
multiplied by the probability of each type of adverse event that would cause disruption.
We are unaware of any attempts to estimate these values for Auckland or Wellington, or for any other
similar jurisdiction overseas. We understand that most empirical studies regarding transport network
INFORMATION
1982
resilience tend to focus on transport modelling and network optimisation rather than quantifying
resilience benefits. Studies that do attempt to quantify resilience benefits typically consider specific
investments or projects.
45
Work recently undertaken by Aecom for the Transport Agency established a general framework for
assessing resilience that could be applied to specific parts of the transport network.
46 The framework
RELEASED
considered various features such as the importance of aspects of a piece of infrastructure or network and
the ability to resolve potential disturbances, including existing network redundancy as well as the
organisational capability of network operators to address disturbances and to implement and manage
repairs. This may help inform the quantification of transport resilience benefits in the future.
OFFICIAL
44 The Transport Agency also defines resilience to include the ability of the transport network to more effectively handle
changes in transport patterns over time, for instance because of demographic changes. To the extent that such
changes directly impact on the congestion benefits arising from rail usage these issues may be more appropriately
dealt with by considering specific changes to traffic congestion costs over time. For a discussion of how demographic
changes may affect congestion costs in Auckland, see section 7.6.1.
45 For example, see:
http://assets.dft.gov.uk/publications/winter-resilience-in-transport/an-assessment-of-the-case-for-
additional-investment.pdf. 46 See: www.nzta.govt.nz/resources/research/reports/546/
69
link to page 69
Metropolitan rail: external benefits and optimal funding
In the absence of currently available data we have not attempted to generate an estimate of the external
resilience benefit of rail. Instead, we have considered several aspects of the road and rail networks in
Auckland and Wellington that may be suggestive of the potential magnitude of resilience benefits,
particularly in light of the likelihood of certain types of adverse events.
For rail to provide a resilience benefit, it must be useable in the event that there is a disruption to the road
network. This may be less likely in some areas and in relation to some adverse events. For instance both
State Highway 1 and the Upper Hutt and Melling rail lines in Wellington run adjacent to each other along
the side of the harbour north of the CBD. Any natural disaster that would seriously impact upon State
Highway 1 in this location, such as an earthquake or tsunami, is also likely to adversely affect the rail
lines
.47 Similarly, any large-scale seismic disturbance (eg new volcanic activity) that disrupted the Southern
THE ACT
Motorway in Auckland may also affect the Southern Rail line which runs in close proximity to the
motorway on the Auckland isthmus. In other areas rail lines may be sufficiently distant from elements of
the road network that may be more susceptible to damage from natural disasters, eg the Western line and
State Highway 16 in Auckland.
Road-specific disruptions are more likely to be the result of incidents such as traffic crashes. In the case of
severe crashes that render parts of the road network unusable, rail services may indeed provide useful
alternatives and provide a resilience benefit. Although more prevalent than natural disasters, these
disturbances are likely to be relatively short-term, and require less than one day to alleviate. Additionally,
unless road users have sufficient warning of network blockages they may not be able to adjust their travel
plans to utilise rail.
UNDER
Consequently, although there is a definite resilience benefit from the existence of rail, it would appear
that adverse events that would tend to generate the greatest potential disruption costs are likely to be
those that are perhaps less likely to occur, eg roading damage from natural disasters or oil shocks.
Conversely, road network disruptions that are more likely to occur would possibly be relatively short-lived
and impose lower disruption costs, eg serious traffic crashes.
6.8 Disturbance externalities
INFORMATION
1982
The operation of rail services through population centres creates noise and negative aesthetic impacts.
These negatively impact upon the wider community, in particular residents of properties that are located
adjacent to railway lines. It also generates delays for motorists and pedestrians at level crossings.
The negative effect of noise disturbances and aesthetic impacts are likely to feed through into property
values that are lower for affected properties than they otherwise would be in the absence of rail.
RELEASED
These negative impacts are likely to be most highly correlated with train frequency rather than patronage.
Whereas the number of passengers on any given carriage makes no difference to noise disturbances and
traffic delays, the more services in operation the greater these impacts. Therefore, a short-run perspective
would suggest that it may not be appropriate for these impacts to be incorporated into fares, for instance
by reducing any specific per journey subsidies that are justified by other positive externalities.
OFFICIAL
However, if over the long run usage were to increase, we would expect that increased patronage would
result in an increased frequency of services as existing services reach capacity. Therefore, in this case it
47 Where this rail corridor may provide some resilience benefit is in relation to its unintended function as a barrier
between the sea and the road. Although rail services were affected by the June 2013 storm events, State Highway 2 was
largely protected from sea damage.
70
6
Externality modelling and estimation
may be efficient for such externalities to be internalised into fares, similar to how fixed-cost investments
required to expand capacity are converted into long-run marginal costs.
Regardless of whether or not these impacts are incorporated into prices by adjusting fares, such impacts
should be included in any cost-benefit analysis of either rail in general or specific rail services.
6.8.
1 Quantification
Estimating the value of disturbance externalities could be achieved by undertaking hedonic pricing
analysis of property values, provided sufficiently detailed property value information is available. Such
analysis could estimate the amount by which properties values are lower if they are located next to rail
infrastructure taking all other relevant variables into account. As this would form part of a wider cost-
THE ACT
benefit analysis of rail and is not directly relevant to the setting of fares, it is outside the scope of this
paper.
The cost of traffic delays created by level crossings could be estimated using total travel time delays
multiplied by an appropriate value of value. Because this impact is not directly correlated with rail usage,
at least insofar as service frequency is unaffected, along with an absence of readily available traffic
modelling data, we have not attempted to quantify this impact. We also expect that overall traffic delay
impacts would tend to be relatively small when compared with the total congestion alleviation benefits of
rail, although we are aware that planned increased service frequency in Auckland from 2016 may result in
significant delays at some crossings located close to major arterials.
UNDER
INFORMATION
1982
RELEASED
OFFICIAL
71
Metropolitan rail: external benefits and optimal funding
7
Findings
7.1 Scope of findings
Assessing the overall optimal level of funding for rail, not only in relation to fare subsidies but also
network infrastructure, involves considering several issues. At a broad level, there is a policy question
regarding the net impact on society of metropolitan rail as a whole, and whether public investment is
warranted at all. Determining this would require a full cost-benefit analysis of rail to evaluate the costs and
benefits of different configurations of rail infrastructure against reasonable alternatives.
THE ACT
However, such an extensive cost-benefit analysis was outside the scope of the research. Additionally, the
local and central government agencies responsible for rail have committed to funding rail infrastructure
and services for the foreseeable future. Therefore, this report assumes that some form of public funding
will continue and takes as given the current and planned future configuration of rail infrastructure in
Auckland and Wellington. We refer to this as the ‘going concern’ assumption because it reflects the fact
that all current planning decisions are based on the view that metropolitan rail should continue to operate.
We also treat as given the absence of efficient road pricing, which contributes to congestion. Similarly, we
have taken as given the structure of other transport modes, such as buses, and ticketing systems at the
time this research was undertaken. To the extent that there is currently unnecessary duplication of some
bus and train routes, the current structure of the public transport network may be sub-optimal and may
UNDER
also contribute towards congestion. Should these networks be re-designed and integrated ticketing
introduced, some proportion of existing congestion might be alleviated.
Given these assumptions, this report estimates the level of fare revenue and total subsidies that are most
appropriate, and how public funding for these subsidies should be raised. Because of data limitations
regarding a number of key variables, the estimates contained in this report should not be considered as
highly precise or definitive. Rather this report uses available information to provide an important first step
in understanding the optimal subsidisation of commuter rail in New Zealand.
INFORMATION
1982
7.2 Background
Metropolitan rail services in both Auckland and Wellington currently support a similar level of patronage,
roughly around 11 million trips per year. However, over the past decade Wellington has experienced
relatively stable passenger volumes whereas Auckland has experienced high levels of growth. In response
RELEASED
to improvements in infrastructure and services, patronage in Auckland increased from around two million
trips in 2000. These levels have subsequently dipped slightly since the peaks experienced during the
Rugby World Cup 2011. Closures during network upgrades have also reduced passenger volumes, with
total patronage for the year to November 2013 being around 10.5 million trips. More recent figures
indicate that passenger volumes are again increasing.
The cost of operating urban rail services in Auckland in the 2011/12 financial year was $105 million.
OFFICIAL
Around one quarter of this ($28 million) was recovered from farebox revenue. The remaining $77 million
shortfall was split between the Transport Agency and Auckland Council on a 60:40 basis. This proportion
is set to change by 1% a year until the share of subsidy funding is 50:50.
72
7
Findings
Figure 7.1
Metropolitan rail patronage, actual and forecast
20
18
Auckland
16
Wel ington
14
12
10
8
6
THE ACT
4
2
0
Continuing upgrades to the rail system in Auckland, including the rollout of electrified services, are expected
to increase costs to around $145 million per year. This increase includes many of the capital costs of
electrification, including new rolling stock. Patronage is also forecast to increase, to around 19 million trips
per annum by 2020. Patronage will rise further if the proposed $2.2 billion City Rail Link (CRL) is
UNDER
constructed. If built, the CRL is projected to increase patronage to nearly 50 million trips per annum by
2041.
The cost of operating passenger rail services in Wellington in the 2011/12 financial year was estimated at
around $77 million, with farebox revenue contributing approximately half of this amount ($39 million). As
in Auckland, 60% of the shortfall has been funded by the Transport Agency with the remaining 40% funded
by Greater Wellington, although these proportions are to change by 1% a year until the share becomes
50:50. Total capital expenditure on improvements to Wellington’s rail system in 2012 was $129.7 million.
This has increased steadily from $24 million in 2007 because of a recent sequence of capital investments.
INFORMATION
1982
Table 7.1
Auckland and Wellington metropolitan railways, 2011/12 financial year
Auckland
Wellington
Route km
100
175
Stations
38
49
RELEASED
Lines
3
5
Annual patronage, trips
10.9m
11.3m
Total passenger km
145m
270m
Average trip length, km
15.2
23.8
OFFICIAL
Revenue and subsidies
Average fare
$2.60
$3.50
Total farebox revenue
$28m
$39m
Average subsidy/trip
$7.00
$3.30
Total subsidy
$77m
$37m
73
Metropolitan rail: external benefits and optimal funding
7.2.
1 Policy environment
As with the wider rail network, policy towards New Zealand’s metropolitan rail systems has fluctuated over
much of the past two decades. Policies regarding public funding, organisational structures and the level of
public ownership have changed several times over this period. Many of the capital investments in rail
networks during this period, particularly in Auckland, have been the result of one-off decisions rather than
components of an overarching, long-term framework that encompasses transport networks more widely.
Although successive governments have released general transport policy statements that include broad
principles regarding rail funding, it is not clear that all major rail funding decisions have been arrived at
through in-depth, robust economic cost-benefit analysis.
THE ACT
7.3 Theoretical concepts and practical limitations
Two economic concepts are important in determining the optimal level of public funding for commuter
rail. These are the marginal costs of services, and externalities from usage.
Ensuring that prices for rail services are economically efficient means that, as a starting point, fares
should be based on the marginal (incremental) cost of additional usage. This ensures that trips are only
undertaken if the value generated by that trip is greater than the marginal cost incurred in facilitating it.
This is a fundamental starting point for economic efficiency. However, a consequence of setting fares
based on marginal costs is that farebox revenue does not cover the relatively high fixed costs associated
UNDER
with rail. Some other funding source is therefore required to meet the shortfall. The existing funding from
central and local government agencies can be seen as playing this type of role.
An alternative pricing method would be to set fares at the average cost of service. In this case no additional
funding would be required. However, fares set at this level would inefficiently deter usage of rail by some
passengers who are willing to pay all of the costs they impose on the rail system. We consider that this
inefficiency is incompatible with the going concern assumption. Since trains are running anyway, all
passengers who are willing to pay their marginal costs should be accommodated, provided capacity exists.
The second important concept is that positive externalities arising from rail usage may justify additional
INFORMATION
1982
subsidisation to reduce fares below marginal cost. The primary positive externality from metropolitan rail
is reduced traffic congestion, particularly at peak times. Where such positive spillovers exist, fares should
be reduced below marginal costs to encourage greater patronage to reflect the wider marginal social
benefits of rail usage.
Although these two economic concepts can provide a policy rationale for subsidising fares, practical
RELEASED
constraints can make the precise implementation of efficient fares for rail services difficult. For instance,
while moves to integrated ticketing could lead to more efficient public transport outcomes overall, they
could constrain the scope to set prices for individual rail services in isolation. Similarly, although regular
adjustments in fares might better reflect changes in externalities over time, such changes could cause
widespread confusion amongst passengers. Furthermore, single fares must often be applied to large
groups of consumers despite the fact that the costs and/or externalities of certain services within these
groups may differ considerably.
OFFICIAL
Additionally, determining efficient fares to a high degree of precision requires extensive analysis of
detailed information regarding a range of different variables. The information required includes, amongst
other things, demand elasticities for rail services at different times, locations and by different groups of
users. Determining the precise optimal mix of funding sources would also require knowing the relative
economic efficiency costs of the multitude of different methods of raising revenue. In the absence of such
74
7
Findings
detailed information, this analysis should be viewed as providing broad guidance rather than precise,
definitive policy prescriptions and detailed recommended prices.
In this regard, there are three key points to note regarding these estimates. First, estimates of the
marginal costs of rail services are sensitive to the treatment of the large capital investments currently
being undertaken and those planned for the future. Assumptions regarding future patronage levels also
have a material impact on these estimates.
Second, our analysis assumes any revenue shortfall brought about by marginal-cost pricing is funded by
public subsidies. The other funding options we have disregarded are the use of two-part tariffs or to set
fares above efficient levels (eg average cost pricing). This public funding assumption is made because
there are practical constraints to instituting lump sum ‘connection’ charges on rail users that would be
THE ACT
necessary as part of any two-part tariff. Additionally, several sources of public funds (eg property rates,
petrol excise and vehicle registration fees) are likely to impose relatively low economic efficiency costs in
comparison to higher rail fares. Nevertheless, should policymakers not wish to implement marginal cost
pricing we have clearly separated this component in our results.
Third, subsidies reflecting the positive spillovers from rail usage should ideally vary for each individual rail
journey as these externalities are time- and location-specific. However, analysing these effects is highly
complex and there is substantial difficulty implementing this in practice. Therefore we have adopted a
simplified approach and have estimated total annual externalities. As a result, the implications for the
optimal split between public funding and farebox revenue are then determined on an aggregate basis.
UNDER
Because of these and other uncertainties we have undertaken sensitivity analysis and present our
estimates as broad ranges.
7.4 Marginal costs of metropolitan rail
To determine the appropriate level of public funding for metropolitan rail we have undertaken a two-step
process. First, we have estimated the marginal cost of rail services in both Wellington and Auckland. This
provides a starting point for determining efficient fares and, consequently, how much public funding may
INFORMATION
1982
be justified to cover fixed costs if total farebox revenue is insufficient. The second step is to subtract from
marginal cost-based fares the positive externalities from rail usage.
Using available cost forecast and passenger volume projections, we have generated approximate
estimates of the appropriate long-run marginal cost measures. Because of the uncertainty inherent in
regarding future costs and patronage projections we have provided ranges of marginal costs; the extent of
RELEASED
the uncertainty means these ranges are relatively wide.
Estimates for Auckland are subject to additional uncertainty as a result of the substantial changes to
services and the network currently being undertaken. Recent and current investments totalling well over
$1 billion include replacement of rolling stock, electrification, redevelopment of a number of stations,
duplication of the Western Line, and various other safety and reliability improvements to the network. This
is forecast to lead to significant growth in passenger numbers which impacts on the estimated long-run
OFFICIAL
marginal cost.
A further complicating factor in Auckland is the proposed CRL. As it is not yet clear when, and if, this
project will commence, we have estimated the marginal cost of rail in Auckland both without the CRL and
with it. We have assumed that if it proceeds, it would be completed in 2023. This is midway between the
Auckland Council’s and the government’s preferred completion dates.
75
link to page 70
Metropolitan rail: external benefits and optimal funding
We estimate that the appropriate long-run marginal cost measure for Auckland if the CRL is not included is
between $4 and $5 per trip depending on the discount rate chosen. Our estimated short-run marginal cost
of rail services in Wellington is between $4.10 and $5.30. Note that these estimates do not include the
value of positive externalities from rail usage (see section 7.2).
Table 7.2
Long-run marginal cost estimates, $ per passenger
Network
Low
High
Auckland – without CRL
$4.00
$5.00
Wellington
$4.10
$5.30
THE ACT
If the CRL is included in our analysis, our estimated range for long-run marginal costs increases to
between $5.60 and $7.65.
These estimates are multiplied by patronage figures to determine the hypothetical total farebox recovery
that setting fares equal to marginal costs would generate. The resulting total farebox revenue figures are
then compared with the total costs of these services to estimate the amount of unrecovered fixed costs
that would require subsidisation.
As indicated in table 7.2, setting average fares equal to the midpoint estimate of marginal costs would
result in a revenue shortfall of around $100 million (70% of costs) in Auckland for the current year.
However, increased patronage would see this shortfall reduced to around $58 million (40%) in 2020,
UNDER
assuming operating costs remain unchanged.
48 For Wellington the revenue shortfall from efficient
(marginal cost) pricing would fall from 38% of current costs to 32% in 2020 as patronage increases.
Table 7.3
Estimates of marginal costs, revenues and marginal cost pricing shortfalls (without CRL)
Auckland
Wellington
2013
2020
2013
2020
Marginal cost ($/trip)(a)
$4.50
$4.50
$4.70
$4.70
Patronage (m trips/year)
10
19
11
13
INFORMATION
1982
Fare revenue ($m)
45
87
53
63
Operating costs ($m)(b)
145
145
85
85
Shortfall ($m)
$100m
$58m
$32m
$22m
(a) Midpoint estimates, Auckland estimate is without CRL
(b) Assumed constant over time
RELEASED
7.5 External benefits of rail
Having established estimates for marginal cost-based fares we have estimated the value of positive
externalities from rail usage. These values are subtracted from hypothetical total farebox revenue to
estimate the appropriate level of public subsidisation. To do this, we have generated quantitative
OFFICIAL
estimates on rail externalities based on the information and data available. In particular, traffic modelling
provided by the respective councils has helped inform congestion externality estimates. Where data is
48 In practice, operating costs are likely to increase to some extent along with increased patronage although the rate of
increase is likely to be less than the increase in patronage.
76
7
Findings
limited we have provided approximate estimates of potential magnitudes. Where data is unavailable we
have provided qualitative descriptions.
7.5.
1 Reduced traffic congestion
The primary external benefit from metropolitan rail services is a reduction in congestion on road networks
and improved travel times for car drivers. Traditional methods of quantifying this benefit involve multiplying
travel time savings using appropriate values of time saved. However, there is a growing debate about
whether this is the best method to evaluate these benefits. Some recent evidence suggests that such
congestion benefits may not be fully realised because reduced travel times lead to changes to the patterns of
land use, eg increased suburban residential development. As a result, it may be that over the longer term,
ACT
the actual benefits of congestion reductions arise from land use changes rather than travel time savings.
THE
Despite this, in the absence of a widely established alternative valuation method, we have used the
traditional travel time saving approach to estimate this externality. We used road network modelling
results provided by Greater Wellington Regional Council and Auckland Council to estimate the extent to
which the current level of rail patronage reduces congestion.
We modelled peak and inter-peak time periods separately and considered the extent to which average
travel times for road users would increase if the rail network did not exist, given the current levels of
patronage. For Auckland, because of expected demographic changes we also generated estimates based
on forecasts provided by Auckland Council of road and rail usage 20 years into the future.
UNDER
In addition to the effect on road travel times, we also considered ‘schedule rearrangement’ impacts. These
are the costs that arise from some motorists choosing to travel at less preferred times to avoid
congestion. Our estimates of these costs are based on modelling previously undertaken for the Transport
Agency. Given the uncertainty regarding the impacts, these estimates are provided as a broad range from
zero up to an estimated maximum upper bound.
The congestion modelling required estimating the level of road usage if the rail networks in Auckland and
Wellington did not exist, so as to determine how much congestion is prevented by current rail patronage.
We did this under three assumptions: INFORMATION
1982
1 All rail passenger-km became car passenger-km in the absence of rail.
2 Rail passengers substituted to a mix of mostly cars and some other public transport modes.
3 Rail passengers substituted to a mix of mostly other public transport modes and some cars.
The first assumption is an extreme case which generates a maximum upper estimate of the congestion benefit.
RELEASED
Current estimates of congestion benefits of rail are significantly higher in Wellington than in Auckland.
Our presumption is that this is because of the relatively high proportion of total travel by rail in Wellington
compared with Auckland, particularly in peak time. In Wellington rail comprises 17% of peak-time
passenger-km network. In contrast, Auckland’s rail usage comprises only 2% of peak-time passenger-km.
Table 7.4
Summary of congestion modelling results ($m per annum)
OFFICIAL
Without rail scenarios –
Travel time
Re-scheduling
Total congestion
passengers switch to:
benefit
benefit
benefits
Wellington
Cars only
67m
0–45m
$67m–$112m
Mostly cars, some buses
44m
0–30m
$44m–$74m
Mostly buses, some cars
21m
0–14m
$21m–$35m
77
Metropolitan rail: external benefits and optimal funding
Without rail scenarios –
Travel time
Re-scheduling
Total congestion
passengers switch to:
benefit
benefit
benefits
Auckland
Cars only
24m
0–16m
$24m–$40m
Mostly cars, some buses
16m
0–11m
$16m–$27m
Mostly buses, some cars
7m
0–5m
$7m–$12m
Auckland – 2031
Cars only
84m
0–57m
$84m–$141m
ACT
We expect that severe road network bottlenecks on State Highways 1 and 2 in Wellington also mean that if
THE
rail passengers were diverted away from rail this would have a relatively significant impact on travel times.
By comparison Auckland’s road system provides greater network diversity with fewer bottlenecks.
Although currently relatively small in comparison with Wellington, the estimated congestion benefits for
Auckland are likely to grow over time as both road usage and rail patronage increase.
We note that congestion benefit estimates do not include any roading network expansion costs that might
be incurred in the absence of rail. This is because investments in expanding roading capacity are
undertaken primarily to reduce congestion. Therefore, including roading expansion costs would effectively
double count congestion costs.
UNDER
7.5.
2 Health benefits from reduced vehicle emissions
To the extent that rail emissions per passenger-km are lower than other transport modes, there are health
externalities associated with rail usage. Airborne emissions such as small particulates affect human health
and can result in premature deaths. The costs of this are the value of additional years of life lost,
discounted to the present.
The best available estimates for these costs in New Zealand are extremely small. The estimated marginal
external health cost per vehicle-km due to PM10 emissions from cars is in the order of 0.03 cents per
vehicle-km. Estimated marginal external health costs for other types of emissions are even smaller. Thus
INFORMATION
1982
even if rail had zero emissions, the health externalities are negligible and do not justify a subsidy.
Similarly, any change in external crash costs because of rail are also likely to be negligible.
7.5.
3 Environmental benefits
GHG emissions from New Zealand vehicles have a global impact, not a local impact. The proportion of the
RELEASED
global climate change cost borne by New Zealand due to an additional tonne of GHG emissions is therefore
very small. Thus external damage costs experienced by New Zealand as a result of the country’s GHG
emissions from vehicles do not justify subsidising rail usage.
The costs to New Zealand of GHG emissions are better measured as the costs of coming into compliance
with New Zealand’s obligations to limit these emissions. New Zealand has chosen not to be bound by
emissions commitments in the second commitment period of the Kyoto Protocol, but it has effectively
OFFICIAL
taken on commitments by including certain emissions sources and sinks in the ETS.
The ETS effectively creates an emissions obligation for New Zealand and results in an additional cost per
unit of liquid fuel consumed. To the extent that rail patronage uses less liquid fuel per passenger-km than
other transport modes, usage of rail reduces the emissions obligation cost for New Zealand and this is a
benefit.
78
7
Findings
However, the ETS mechanism means that the relative cost of travelling by rail versus other modes already
reflects this benefit. This is because the ETS allows emissions obligation costs to flow through to liquids
fuels prices, which affect the relative costs of travel on different modes. A further subsidy for rail
(reducing the price of rail relative to other modes) would effectively double-count these benefits and is not
justified.
We also consider that other potential environmental impacts, such as reduced road run-off or reduced
roading footprint as a result of fewer road capacity investments, are also insignificant.
7.5.
4 Agglomeration benefits
Agglomeration benefits are factored into cost-benefit analyses for major roading projects. We agree with
THE ACT
the EEM that these benefits will only be material for ‘large and complex urban transport activities’, which
by definition includes metropolitan rail. The source and mechanism of agglomeration benefits is as
follows:
• A step change in transport infrastructure reduces travel costs into a large urban location such as the
Auckland or Wellington CBD.
• In response, residents travel to that location more frequently and at lower cost for work productivity
increases via localisation and urbanisation effects and the total predicted increase in GDP is regarded
as the size of the agglomeration benefit. UNDER
Agglomeration benefits are therefore a potential externality of rail that is relevant to the cost-benefit
analysis for new metro rail infrastructure. However the case for including agglomeration benefits as part
of a usage subsidy is weaker and should be considered jointly with the benefits of relieving road
congestion.
To the extent that rail passengers would otherwise travel by road, there is no agglomeration benefit
because no
extra people travel to central locations. This is the assumption we use here. To do otherwise,
we would need to estimate the share of rail passengers that (in the absence of rail) would not travel by
road, apply agglomeration effects for those passengers and reduce the congestion benefit for them to
INFORMATION
avoid double counting.
1982
While we consider this conservative approach is appropriate in relation to existing levels of rail patronage,
agglomeration benefits may become relevant if any increase in future rail patronage involves a significant
number of journeys that would not otherwise occur.
7.5.
5 Option value of rail
RELEASED
Households may obtain a benefit from having access to rail services even if they are not used. The option
to use rail, whether directly or by visitors, provides a benefit to households located near the rail network.
This benefit is likely to be capitalised into higher values for these properties.
The only available data regarding potential option and non-use values of metropolitan rail suggests that
the value per household of rail access is $86 in Tuakau (60km south of Auckland) and $132 in Featherston
OFFICIAL
(65km north of Wellington). Using these option values across the rail catchments in Auckland
(approximately 110,000 households) and Wellington (approximately 150,000 households) the total option
value benefits may be as high as $9.5 million and $15 million in Auckland and Wellington respectively.
However, these estimates probably overestimate the option values for the majority of households in these
rail catchments. This is because alternative modes of public transport in Tuakau and Featherston are
either relatively limited (buses) or relatively expensive (taxis). In contrast the majority of households in rail
79
Metropolitan rail: external benefits and optimal funding
catchments are located in less remote, urban areas for which there are more abundant transport
alternatives, eg cycling, walking, buses, taxis. Consequently, we consider that actual option value benefits
are likely to be substantially smaller than these figures.
7.5.
6 Wider social benefits
Although the direct use (consumer surplus) benefits of rail to disadvantaged individuals do not constitute
externalities, providing transport services to such groups can generate wider benefits. This occurs if the
community values the provision of low-cost transport services for certain individuals, eg disabled persons,
and there is a willingness to pay for it.
This willingness to pay is likely to be reflected in the existing subsidised taxi services available for
THE ACT
disabled individuals in both Auckland and Wellington. To the extent that rail services might be an
alternative method of providing more affordable transport services for disabled users, their existence
could effectively lower the costs to the community (ie ratepayers and taxpayers) of subsidised taxi
services. Rail journeys can be an effective substitute for taxi services when the origin and destination
points are close to rail stations and these stations have disabled access. Therefore, a reduction in total
disabled taxi subsidies, because of increased use of rail, would constitute a wider social benefit of rail.
Based on annual disabled usage estimates of around 45,000 journeys in Auckland and 50,000 in
Wellington, and assuming that each journey would have required the maximum available subsidy per
journey of $40 if taken by taxi, the annual subsidy cost saved by the use of rail could be up to $1.8 million
UNDER
in Auckland and $2 million in Wellington. Given that these figures assume each of the journeys would have
attracted the maximum subsidy if taken by taxi, the estimates are upper bounds as the actual benefits are
likely to be lower than these figures.
7.5.
7 Improved transport system resilience
If an adverse event disrupts elements of the road network in either Wellington or Auckland, the presence
of metropolitan rail may avoid delays and enable the transportation of more people than would otherwise
be the case. Avoidance of loss of travel and travel delay costs would constitute an external benefit of
INFORMATION
metropolitan rail.
1982
The magnitude of resilience benefits is related to the likelihood of road-specific transport disruptions and
the transport loss and delay costs that would be imposed by these disruptions. In general, the less likely
the disruption the greater the potential disruption costs, eg roading damage from a natural disaster or an
oil supply shock. Conversely, road network disruptions that are more likely to occur will probably be
relatively short lived and impose lower delay costs, eg traffic crashes.
RELEASED
7.5.
8 Negative external impacts
As well as positive externalities, metropolitan rail also generates negative externalities. These negative
impacts can include noise disturbances experienced by properties located near railway lines and are
reflected in lower values for affected properties. Crashes and traffic delays incurred by motorists at level
crossings are another negative externality of rail.
OFFICIAL
These externalities are more closely related to the frequency of services and the existence of rail itself
rather than specific levels of patronage. For instance, noise disturbance, traffic delay and crash
externalities will arise regardless of whether carriages are empty or full. In this regard, these impacts may
be more relevant to any overall cost-benefit analysis of rail rather than an estimation of the optimal fare
subsidy, although over the longer term patronage levels may have some impact on service frequency and
80
7
Findings
resulting negative externalities. Despite this, the difficulty in estimating these externalities means that
these impacts remain unquantified in this analysis.
7.5.
9 Summary of external impacts
Based on transport network modelling provided by the respective councils, we estimate that the current
external usage-based benefits of metropolitan rail are likely to have a value of somewhere between $7
million and $40 million per year in Auckland, and $21 million to $112 million per year in Wellington. The
other external impacts of rail that are less correlated with patronage, but may nevertheless influence the
level of overall public funding, are also outlined in table 7.4.
Table 7.5
Summary of metropolitan rail externalities (2012)
THE ACT
Impact
Auckland
Wellington
Highly correlated with usage
Reduced congestion
$7m–$24m
$21m–$67m
Avoided schedule rearrangement
<$16m
<$45m
Environmental benefits
$0
$0
Health benefits
$0
$0
Agglomeration
$0
$0
Less correlated with usage
UNDER
Option value
<$9.5m
<$15m
Social benefits
<$1.8m
<$2m
Resilience (positive)
Unquantified
Unquantified
Disturbance (negative)
Unquantified
Unquantified
Although the congestion externalities of rail in Auckland are significantly smaller than in Wellington, we
expect this to change over time given Auckland’s forecast population growth. Congestion externalities
avoided from the usage of Auckland’s metropolitan rail services could become substantially larger given
INFORMATION
1982
its population is projected to grow by 33% (nearly 500,000) to just under two million by 2031. We estimate
that the (undiscounted) annual value of positive congestion externalities from metropolitan rail could be in
the vicinity of $80 million per year by this time. Additional schedule rearrangement benefits could be up
to a further $60 million per year.
7.6
RELEASED
What is the optimal subsidy for metropolitan rail?
The optimal subsidy for metropolitan rail depends on a number of factors, including the level of
investment in, and the pricing of, other modes of transport. However, considering all of these factors in
detail is outside the scope of this study. As a result we have taken the structure of the broader transport
network and the pricing of other modes as given. We have also assumed that rail will continue to be
publicly funded to some extent, which effectively presumes that there is a net benefit from the continued
OFFICIAL
existence of metropolitan rail.
To estimate the appropriate level of subsidy we have undertaken a two-step process. First, we have
estimated the marginal costs of rail services. This sets a benchmark for establishing efficient fares.
Second, we have estimated the externalities generated by rail which may justify subsidising fares below
marginal costs.
81
Metropolitan rail: external benefits and optimal funding
Because of uncertainty regarding several aspects of this analysis, we have undertaken sensitivity analysis
and considered several scenarios. Consequently we present our estimates as broad ranges to reflect the
extent of uncertainty around several key variables.
One area of uncertainty is estimating the marginal cost of services. In particular there is a tension between
the use of short-run or long-run measures of marginal costs for the purposes of establishing efficient
fares. In the very short run the marginal cost of an additional passenger will be close to zero. Using this
measure would imply setting fares at very low levels, resulting in the need for a high degree of external
funding to cover fixed costs. In contrast over the very long run marginal costs will tend towards average
costs. Using this measure fares would be set much higher and little subsidisation would be required to
cover fixed costs. While we have attempted to estimate the most appropriate measure of marginal costs
THE ACT
for both rail networks based on the information provided, this may be an issue that would benefit from
further study should more data become available.
We have also made several conservative assumptions regarding externalities in an effort to avoid
overestimating optimal fare subsidies. In particular, we have excluded potential option value benefits from
our operating subsidy estimates. This is because the magnitude of these benefits is subject to high
uncertainty and these benefits may be more closely tied to operating schedules than to patronage
volumes. Likewise we have excluded an allowance for potential wider social benefits, although the
maximum estimate for these effects is relatively insignificant.
Additionally, we have excluded the ‘cars only’ scenarios from our congestion benefit estimate ranges. This
UNDER
is because it is unlikely that in the absence of rail all existing rail passengers would switch to driving.
Instead we expect that if rail did not exist, more extensive bus services would be provided and these
would be utilised to a greater extent than existing services.
We also note that practical constraints can also make the implementation of efficient rail fares difficult.
Historic (zonal) fare structures and ticketing systems can potentially constrain fare setting. Similarly, while
integrated ticketing can lead to more efficient public transport outcomes overall, it can limit the scope to
set prices for individual rail services in isolation. Additionally, single fares must often be applied to large
groups of consumers despite the fact that the costs and/or externalities of certain services within these
INFORMATION
1982
groups may differ considerably.
Nevertheless, based on several assumptions, such as taking the current configuration of rail infrastructure
and other transport modes as given, our analysis suggests that the appropriate level of public funding for
rail fares in Auckland is currently somewhere between $102 million and $132 million per year. The
corresponding range for Wellington is $47 million to $85 million. Again, this estimated range takes
current rail and other infrastructure as given.
RELEASED
Table 7.6
Optimal subsidy estimates 2013, $m
Estimates
Auckland
Wellington
Total cost(a)
$145m
$85m
Subsidy components
OFFICIAL
Shortfall from marginal cost pricing
95m – 105m
26m – 39m
Externality benefits
7m – 27m
21m – 74m
Total subsidy(b)
$102m – $132m
$47m – $85m
(a) Excludes major network upgrades/replacements not funded by farebox revenue
(b) Where subsidy components exceed costs, subsidy capped to total cost
82
7
Findings
Including the current electrification process, the total cost of operating rail services in Auckland is
estimated to have increased to $145 million per year. Excluding possible CRL costs, establishing
economically efficient prices based on long-run marginal costs suggests that average fares should be in
the vicinity of $4 to $5 per trip. Based on current patronage this would result in farebox revenue of
around $40 million to $50 million over a year. This would leave a shortfall of between $95 million to $105
million in unrecovered costs which would require funding.
Additionally, the positive externalities arising from rail use in Auckland, chiefly avoided traffic congestion,
could justify further subsidisation in the region of an additional $7 million to $27 million. This implies
that total rail subsidies in Auckland should currently be somewhere in the order of 70% to 91% of total
costs. The midpoint of this range implies an optimal subsidy rate of approximately 80% of total costs.
THE ACT
Given current patronage this midpoint would result in an average fare of $2.60 per trip.
The cost of operating rail services in Wellington is estimated at $85 million per year. Setting fares on the
basis of marginal costs, estimated to be around $4.10 to $5.30 per trip, would result in a shortfall of
approximately $26 million to $39 million. Additionally, rail usage in Wellington generates external
benefits estimated to range from as low as $21 million to as high as $74 million.
Consequently, our analysis suggests that the optimal subsidy is somewhere between 55% and 100% of
total costs. The midpoint of this range suggests a subsidy rate of around three quarters of total costs
would be appropriate. Given current patronage this midpoint would result in an average fare in the order
of $1.70 per trip.
UNDER
Table 7.7
Optimal subsidy estimates 2013, % of current total costs
Optimal subsidy
Auckland
Wellington
High estimate
91%
100%
Midpoint estimate
80%
78%
Low estimate
70%
55%
7.6.
1 Impact of future changes
INFORMATION
1982
These estimates are based on a number of factors, including present population levels, the existing
configuration of rail and other transport networks, and current rates of patronage and traffic congestion.
Consequently, optimal fare subsidies are likely to change over time as these variables change.
This is particularly true in Auckland where patronage is forecast to increase substantially. The increase in
RELEASED
patronage is in part because of improvements to rail services and restructuring of the bus network and in
part because of continuing population growth. For a given level of average fares, this would result in
higher farebox revenue and fewer unrecovered costs, reducing the funding necessary to cover fixed costs.
For instance, if patronage in Auckland rises to 19 million by 2020 as forecast, farebox revenue would
roughly double. Assuming average fares were unchanged, this change would decrease the level of
unrecovered costs that would need to be funded through subsidy by almost half.
OFFICIAL
Offsetting this effect to some extent is that Auckland’s ongoing population increase is also likely to
significantly increase traffic congestion, and in turn increase the positive spillover effects of rail usage. On
its own, this effect would suggest greater subsidisation of fares. Preliminary transport modelling suggests
that by 2031 the congestion costs avoided by rail could, under the worst congestion scenario, range from
$85 million to $140 million per year. These positive externalities would work to greatly increase the
optimal rail subsidy for Auckland. However, in the absence of additional transport modelling and analysis,
83
link to page 76 link to page 84
Metropolitan rail: external benefits and optimal funding
it is not clear what the net impact of these two offsetting effects on the optimal subsidy will be in the
future.
Figure 7.2
Expected impact on optimal subsidy of population and patronage increases in Auckland
$
Congestion
externality
THE ACT
Marginal cost
pricing
shortfall
Tim
2013
A further major complicating factor in Auckland is the proposed CRL. If the CRL proceeds as proposed, it
would increase both costs and patronage (and associated positive externalities). These impacts would also
UNDER
affect the optimal level of public funding in Auckland.
The CRL is forecast to cost $2.2 billion (2013 dollars). It is projected to lead to annual patronage of nearly
50 million trips by 2041, more than double the volume expected without the CRL. Incorporating these
increased costs and increased patronage projections into the analysis results in an estimated long-run
marginal cost that is higher than current estimates, ie between $5.60 and $7.65 depending on the
discount rate used.
49
Using this estimated range of values for long-run marginal cost we subtract the current value of positive
INFORMATION
1982
externalities, estimated to range from $7 million to $27 million. At current patronage levels, the positive
externality amounts to between $0.67 and $2.57 per passenger. Subtracting these amounts from the
long-run marginal cost estimate implies that the appropriate average fare would currently be somewhere
between $3 and $7 per trip.
50 Using the midpoint estimate of long-run marginal cost ($6.63) narrows this
range to between $4 and $6 per trip, depending on the magnitude of positive externalities.
RELEASED
There are two points to note regarding these estimates. First these estimated ranges are based on current
patronage levels. However, increased patronage from the CRL is likely to increase the value of the external
benefits from rail usage, particularly congestion reduction. This is especially so for those commuters who
would switch to rail as a result of the new routes and destinations that the CRL would provide. The
City
centre future access study (SKM 2012) estimated the CRL would generate additional external benefits in
terms of reduced road congestion with a present value of $400 million over a 30-year period. In isolation,
this effect would suggest that average fares should be further reduced below marginal cost by increasing
OFFICIAL
the level of optimal subsidy.
49 A 6% discount rate corresponds to the $5.60 estimate; an 8% discount rate corresponds to the $7.65 estimate.
50 Positive externalities of $7 million correspond to the $7 fare estimate; positive externalities of $27 million
correspond to the $3 estimate.
84
7
Findings
Counter to this effect, the projected increase in patronage and associated farebox revenue would, on its
own, imply a greater recovery of fixed costs. This would have the effect of reducing the optimal level of
subsidisation. In the absence of more detailed modelling, the overall net impact of these two effects on
the level of optimal subsidisation is uncertain.
Second, these estimates assume that fares within the ranges outlined above would not materially alter
future patronage levels from those which have been projected. To more accurately determine the impact
of different fares on future patronage levels it would be necessary to undertake more complex analysis
using demand elasticity estimates. Such analysis is outside the scope of this study.
In contrast to Auckland, Wellington’s public transport network is relatively mature and the regional
population is forecast to grow at a more modest rate. This means that the optimal subsidy for Wellington
THE ACT
is likely to remain relatively stable over time.
7.7 How should funding be raised?
Having determined there are policy rationales for subsidising rail fares, we outline two main principles that
should guide the choice of funding sources:
• economic efficiency
• equity (ie fairness).
UNDER
From an economic efficiency perspective, the funding required for subsidies should be raised in the
manner that imposes the lowest cost on the wider community. The more costly (less efficient) the funding
mechanisms used to raise revenue, the less subsidisation is justified.
Although we consider that economic efficiency should be the primary concern when raising public funds,
some revenue mechanisms give rise to equity (fairness) concerns and may not be politically acceptable.
This means that policy makers may wish to trade-off efficiency and equity concerns when deciding on
funding sources.
Practical constraints are also important. In other sectors where marginal cost-based pricing is insufficient
INFORMATION
1982
to cover fixed costs, shortfalls are often funded via two-part tariffs. For example, per unit usage prices for
gas and electricity are typically set with usage being priced at marginal cost and any shortfall recovered
from lump sum connection charges. Although these two-part tariffs are both equitable and efficient,
applying these to metropolitan rail would be problematic. Periodic lump sum ‘connection’ charges would
likely also have a large negative impact on casual rail usage by occasional passengers, as would fares
based on average cost discussed above.
RELEASED
This analysis therefore proceeds on the assumption that any revenue shortfall from marginal cost pricing
would be publicly funded. There are several obvious sources of funding that are likely to have relatively
low efficiency costs (eg property rates, fuel excise and vehicle registration). However, recognising that
policymakers may wish to employ average cost pricing we have specifically estimated the funding
requirement that would arise from marginal cost-based pricing as opposed to that related to internalising
OFFICIAL
positive externalities (see table 7.5).
Similarly, the public funding of fare subsidies may also give rise to efficiency and equity trade-offs. For
instance, from an equity perspective those who benefit from rail should contribute towards funding, eg
tolls on motorists that benefit from reduced congestion. However, it can be difficult and costly to target
these individuals. This example also illustrates a further point. Such targeted congestion charges could
effectively provide efficient road pricing by internalising negative congestion externalities. This would
eliminate the road congestion rationale for subsidising rail fares below marginal cost.
85
Metropolitan rail: external benefits and optimal funding
7.7.
1 Economic efficiency
Public funds for rail subsidies should ideally be raised in the most economically efficient manner that is
practically possible.
Applying the principle of economic efficiency requires that the administration, compliance and economic
(deadweight) costs of revenue collection measures should be minimised. This implies that revenue
instruments should be simple, and easy to implement and comply with. Ensuring that administration
costs, compliance costs and the distortionary deadweight costs of taxation are minimised in turn justifies
a larger degree of subsidisation. The higher the costs incurred in raising revenue, the lower the level of
subsidisation that is justified.
THE ACT
To minimise efficiency costs, any revenue instrument should either cause as little distortion to economic
activity as possible or alternatively should correct for some form of market failure, as is the case with
‘corrective’ taxes.
While most revenue instruments impose distortionary economic costs, corrective taxes can improve the
overall welfare of the wider community to the extent that they internalise negative externalities. Examples
of these can include taxes on cigarettes, which seek to internalise the external health costs arising from
smoking and lead to improved outcomes for the wider community.
Importantly, applying the principle of economic efficiency does not require that the source of funds for rail
subsidies need be associated with the transport sector in any way. If existing revenue instruments broadly
UNDER
meet the non-distortionary, economic efficiency criteria, it may be preferable to use these to avoid
incurring additional transitional and set-up costs inherent in implementing new revenue instruments. For
example, if property-based rates currently levied by councils are relatively efficient at raising revenue, it
may be appropriate to increase these rather than implement a new revenue instrument that imposes
additional administrative and compliance costs.
7.7.
2 Equity
In contrast to economic efficiency, the principle of equity (fairness) implies that those who gain the most
INFORMATION
1982
from subsidised metropolitan rail services should contribute the most towards public funding. Although
some revenue instruments may be more economically efficient than others, some of the more efficient
instruments may be considered unfair by a significant proportion of the wider community. A lack of
perceived fairness can limit the extent that certain options are politically acceptable and sustainable.
For instance, general taxation or property rates may be considered less equitable than fuel excise and
road user charges. This is because funds would be sourced from taxpayers throughout the country, or
RELEASED
ratepayers throughout a region, as opposed to motorists, some of whom will directly benefit from reduced
congestion. Similarly, general fuel taxes may be considered less equitable than regional fuel taxes that
target motorists in Auckland and Wellington. However, even regional fuel taxes would impose levies on a
large number of motorists who do not benefit from rail. This is because much of this tax revenue would
come from those who drive outside of peak times or on roads unaffected by rail. Similarly, parking levies
would apply to many motorists that do not benefit from rail and would also impose additional
OFFICIAL
administrative and compliance costs to establish and maintain.
Conversely revenue instruments that may be considered more equitable by the wider community could
give rise to serious economic efficiency problems. For instance, as outlined in more detail in section 7.7.8,
using congestion charges to fund rail is inefficient where these charges are applied to motorists that
benefit from reduced congestion because of rail. Instead, congestion charges are more appropriate as a
86
link to page 84 link to page 87
7
Findings
revenue raising tool if applied to roads that are unaffected by rail. Although more economically efficient,
this counter-intuitive result is likely to be considered by the community as much less equitable.
7.7.
3 Funding options
Because undertaking a detailed evaluation of each of these factors for all possible revenue instruments is
beyond the scope of this analysis, we have instead focused on a few key revenue instruments most likely
to be considered by policy makers. In so doing we note that there is no economic rationale for funding
mechanisms to necessarily be related to transport in any way.
The funding options we considered include:
ACT
• property rates levied by councils
THE
• fuel excise, road user charges and vehicle registration fees, which comprise the NLTF administered by
the Transport Agency
• general taxation collected by the central government
• regional fuel taxes and parking levies
• congestion charges
• land value capture instruments.
7.7.
4 Property rates
UNDER
The instruments likely to impose the fewest costs are property rates levied by councils. These would exist
regardless of whether rail is subsidised, so they would not incur additional administrative or compliance
costs. Additionally, the distortionary effects (ie deadweight costs) from levying tax on property are likely
to be relatively low.
Although some ratepayers gain from rail services, many ratepayers in Auckland and Wellington do not
directly benefit from access to rail services or reduced traffic congestion.
51 Consequently, some may
consider that it is unfair to use revenue from property rates to fund rail. A possible counter argument is
INFORMATION
1982
that ratepayers within these regions benefit indirectly as a result of these cities having more efficient
transport systems which may make them more productive and more liveable.
52
7.7.
5 National Land Transport Fund
The next most efficient source of current funding is vehicle registration fees, and to a lesser extent, fuel
RELEASED
excise and road user charges (RUCs), which form the NLTF. These instruments impose some efficiency
costs, particularly fuel excise and RUCs because of their distortionary impact in reducing transport
activity. However, these efficiency costs are also likely to be relatively low because the elasticity of demand
for petrol (and presumably also diesel vehicle use) is relatively low. Additionally, these instruments would
exist regardless of whether rail is subsidised, so they would not incur additional administrative or
compliance costs.
OFFICIAL
From an equity perspective, taxes levied on motorists may be considered more equitable than other
sources like property rates and general taxation. However, the only motorists who gain from metropolitan
51 For example, individuals who live in the southern and eastern suburbs of Wellington or on Auckland’s North Shore
may not obtain any direct benefit from rail.
52 See section 4.3.6 for a more detailed discussion of the issue of equity and identifying those groups that benefit from
metropolitan rail.
87
Metropolitan rail: external benefits and optimal funding
rail are those who travel at peak times to certain central city locations in Auckland and Wellington using
motorways and arterial roads for which rail services are substitutes. Therefore sourcing revenue from the
NLTF is not necessarily an especially targeted approach from an equity perspective.
7.7.
6 General taxation
Compared with council rates or the NLTF, using revenue from general taxation is likely to impose higher
efficiency costs. This is because the distortionary effects of taxing other assets or activities, such as
income or goods and services, are likely to be higher General taxation may be considered less equitable
than fuel excise and RUCs because funds would be sourced from taxpayers nationwide rather than from
motorists.
THE ACT
7.7.
7 Regional fuel taxes and parking levies
Regional fuel taxes and parking levies would be a more equitable alternative to the NLTF as they would
target motorists only in those areas where rail services exist. However, even regional fuel taxes and
parking levies would impose levies on a large number of motorists who do not benefit from rail either
because they drive outside peak times or on roads unaffected by rail.
These instruments would also impose additional administrative and compliance costs, particularly with
regards to implementation. This means they may be less efficient than the other existing measures
outlined above.
UNDER
7.7.
8 Congestion charges
While most revenue raising instruments have distortionary impacts and incur economic costs, some may
have efficiency benefits and can improve the overall welfare of the wider community. These include
‘corrective’ taxes which seek to internalise negative externalities.
Road congestion charges are an example of such an efficiency enhancing mechanism that can also be a
revenue raising tool. Such charges can improve overall welfare to the extent that these internalise the
external congestion delay costs of vehicle travel at peak times and establish appropriate ‘road pricing’.
INFORMATION
1982
Although introducing such charges would generate additional administrative and compliance costs, such
an instrument nevertheless has the potential to improve overall economic efficiency by better allocating
scarce resources, eg road space at peak times.
Despite this, there is an important caveat regarding using road pricing initiatives to fund rail. In the
absence of efficient road pricing, road congestion can justify subsidising rail services, because rail reduces
the external costs of congestion. However, if the costs of that congestion are internalised directly, as they
RELEASED
are with road pricing, then there is no longer a negative congestion externality. Therefore, if efficient
congestion charges are introduced the externality justification for subsidising rail disappears. This means
that road pricing should be considered as a more efficient alternative for addressing congestion than
subsidising rail, rather than a means of raising funds.
In this situation, instituting rail subsidies as well as applying congestion charges to routes that already
OFFICIAL
benefit from rail would effectively ‘double count’ these externalities. This implies that congestion charges
should be instituted instead of rail subsidies. If this is not possible on routes for which rail is an effective
substitute, the revenue required to fund rail subsidies should be raised from congestion charges imposed
on routes that do not already benefit from rail.
88
7
Findings
A third alternative is to ‘mix and match’ rail subsidies and congestion charges, by splitting the external
congestion cost and rail benefit across both modes. As an example, half the costs of congestion could be
reflected in rail subsidies and the other half in congestion charges.
Regardless of the mix of congestion charges and rail subsidies, the efficient approach of not charging
motorists for the congestion benefit they obtain from rail is counter to that dictated by the concept of
fairness. A more equitable, and less efficient approach, would be that those motorists who benefit most
from rail through reduced traffic congestion should contribute most to rail subsidies.
7.7.
9 Land value capture
One group which benefits directly from metropolitan rail comprises those who obtain use of ‘consumer
THE ACT
surplus’, benefits. These surpluses consist of the total value users place on rail journeys less the amount
they are required to pay in fares. Although stemming from direct usage, these benefits are likely to be
incorporated to some extent into the values of property located near the rail network. As a result, these
benefits may ultimately be captured by property owners, regardless of whether they use rail services.
Similarly, businesses near rail stations may also gain from increased sales, although as with residential
properties, any increase in sales may be passed through to property owners in the form of higher rents
and, subsequently, capitalised into property values.
Consequently, an instrument that could both better target those who benefit from rail as well as have
relatively low efficiency costs is a land value capture mechanism. This would be somewhat similar to
UNDER
existing property rates except it would be limited to properties close to railway stations and tax increases
in property value arising from the benefits of being in close proximity to rail services.
In theory, such an approach would be relatively efficient because, if set correctly, it would not distort
people’s transport, work and living decisions. However, in practice many of the benefits of proximity to
existing rail services will have already been capitalised into property values. As a result, many of these
gains will have already been realised by former property owners who have since sold.
Therefore, if used to fund existing services this approach would effectively result in arbitrary lump sum
INFORMATION
levies being imposed on some property owners who may not have obtained any benefits from rail. This
1982
would present serious equity concerns. This means that land value capture is a more appropriate funding
instrument for specific future investments that increase property values rather than to fund existing
services.
From an equity perspective there may also be a rationale for compensation to the owners of commercial
properties who have been adversely affected by rail. For instance, some businesses and property owners
RELEASED
may have suffered because of a diversion of custom to other firms that are located closer to the rail
network.
OFFICIAL
89
Metropolitan rail: external benefits and optimal funding
Figure 7.8
Selected revenue instruments
Funding source
Pros
Cons
Property rates
Low efficiency costs
Some equity concerns
No admin and compliance costs
NLTF (fuel excise, RUCs,
Low efficiency costs
Some equity concerns
vehicle registration)
No admin and compliance costs
Congestion charges
Potentially efficiency enhancing
Potential efficiency costs or equity concerns –
depends on routes and charges
Additional admin and compliance costs
ACT
General taxation
Low or no admin and compliance
Some efficiency costs
THE
costs
Equity concerns
Regional fuel tax
Low equity concerns
Some efficiency costs
Additional admin and compliance costs
Parking levies
Low equity concerns
Some efficiency costs
Additional admin and compliance costs
Land value capture
Low efficiency costs
Practical limitations
Additional admin and compliance costs
Equity concerns if applied to fund existing rail
services
UNDER
INFORMATION
1982
RELEASED
OFFICIAL
90
8
Recommendations
8
Recommendations
The findings of this analysis have several policy implications. Our recommendations for addressing these
are as follows:
8.1 Optimal fare subsidy: Auckland
The amount of subsidy funding currently provided to rail in Auckland is slightly less than the optimal
estimated range. The large majority of the optimal fare subsidy arises from the revenue shortfall that
would arise if fares were set based on long-run marginal costs, rather than the external benefits of rail
THE ACT
use. However, if patronage increases as projected, much of this shortfall will be reduced as farebox
revenue rises. Therefore, over the near term the level of fare subsidisation that may be justified by
marginal cost pricing is likely to fall substantially.
In contrast, over the longer term expected demographic changes and the associated increase in traffic
congestion are likely to increase the external benefits of rail. This would have the opposite effect and
would work to increase the optimal subsidy. In the absence of further study, it is not possible to
determine the net impact of these changes on the optimal subsidy over time.
Because of the relatively long-term nature of decisions regarding where to live and work, and the possible
inertia surrounding shifts in modal patterns, the Transport Agency may wish to revisit this analysis in the
UNDER
future and consider the optimal subsidy for rail services in Auckland over a longer time period. Such a long-
run approach could have the benefit of promoting greater stability in fares and may avoid negative impacts
on the demand for rail services that could occur if fares are significantly adjusted on a regular basis.
8.2 Optimal fare subsidy: Wellington
As with Auckland, the current level of subsidisation in Wellington may be lower than optimal, albeit only
slightly lower than the estimated range. In particular, the possibility that the external benefits of avoided
INFORMATION
1982
traffic congestion generated by rail in Wellington are substantial may justify larger a subsidy than that
currently provided.
Unlike Auckland, the relatively maturity and stability of rail services, patronage and demographic trends in
Wellington means that the optimal level of subsidisation is unlikely to change significantly in the
foreseeable future.
RELEASED
8.3 Source of public funds
Overall, there does not appear to be a strong policy rationale for large-scale changes to current funding
sources. Revenue instruments such as property rates levied by councils and the NLTF are reasonably
efficient when compared with many other possible revenue instruments. However, further detailed analysis
of alternative mechanisms would provide more insight into the relative costs and benefits of different
OFFICIAL
approaches.
91
Metropolitan rail: external benefits and optimal funding
8.4 National Farebox Recovery Policy
The National Farebox Recovery Policy requires councils to ensure that public transport users contribute
their fair share of the costs of services. This analysis can help inform the relevant councils in refining their
target farebox recovery ratios.
The National Farebox Recovery Policy has a stated aim of achieving an overall national average farebox
recovery rate for public transport of no less than 50%. Therefore, to the extent that the estimated optimal
subsidy funding for Auckland and Wellington is currently higher than 50%, this is inconsistent with the
policy.
ACT
While it may still be possible for the overall national average rate of farebox recovery to be 50%, this may
THE
require subsidies for public transport in other areas or for modes to be reduced to levels that are sub-
optimal. This suggests it may be appropriate to review the policy itself.
8.5 Funding assistance rates
Funding assistance rates refer to the proportion of approved transport activity subsidies that are funded
out of the NLTF.
The ongoing reduction in the Transport Agency’s funding assistance rates for rail, which requires councils
to contribute greater shares of subsidies, may enhance overall economic efficiency. This is because a
UNDER
greater share of funding will be sourced from property rates levied by councils, which is likely to impose
fewer distortionary impacts and be more economically efficient than many other sources, including fuel
excise duties, RUCs and vehicle registration fees. This in turn would justify greater subsidisation for rail,
improving the overall welfare of the wider community.
8.6 Economic evaluation manual
The EEM is used by organisations such as councils for evaluating and preparing funding applications to
INFORMATION
1982
the Transport Agency.
The findings of this report do not directly impact on the EEM, although one issue raised in this analysis
that the Transport Agency may wish to consider further is the approach to valuing the benefits of reduced
congestion arising from transport investments. The standard approach as used in this analysis is to
estimate the value of time travel savings. However, the Transport Agency may wish to investigate
approaches that incorporate changes in land use patterns resulting from transport investments.
RELEASED
OFFICIAL
92
9
References
9
References
Abley, S, M Chou and M Douglass (2008) National travel profiling part A: Description of daily travel
patterns.
NZ Transport Agency research report 353.
Allison, N. D Lupton and I Wallis (2013) Development of a public transport investment model.
NZ
Transport Agency research report 524.
Alternative Funding for Transport (2013)
Funding Auckland’s transport future. Public discussion
document.
ACT
APB&B (2010)
Business case: Auckland CBD rail link. Prepared for KiwiRail and ARTA.
THE
Arter, K, C Buchanan, P Buchanan and R Meeks (2006)
Agglomeration benefits of CrossRail. Association for
European Transport and contributors.
Asada, Y and F Yamazaki (2006)
Measurement of the congestion externality in rail commuting in the Tokyo
metropolitan area. Sophia University, Meikai University.
Booze Allen Hamilton, Institute for Transport Studies, University of Leeds and associated consultants
(2005)
Surface transport costs and charges study. Report for the Ministry of Transport.
Button, K (2005) The economics of cost recovery in transport.
Journal of Transport Economics and Policy
39, no.3: 241–257.
UNDER
Chung, P (2012) Walkable catchments analysis at Auckland train stations: New Lynn, Glen Innes and Mt
Albert – 2012.
Auckland Council technical report 2012/023.
Clark, H (2008) Speech on the launch of KiwiRail.
The New Zealand Herald. Accessed 27 April 2014.
www.nzherald.co.nz/nz/news/article.cfm?c_id=1&objectid=10519328.
Creedy, J (2009) The distortionary costs of taxation. Background paper for the Tax Working Group, Session
Five.
INFORMATION
Cullen, M (2008)
Back on track – infrastructure for NZ. Speech. Accessed 27 April 2014.
1982
www.railpage.com.au/f-t11343161-s0-0-asc.htm
Currie, G (2011)
New perspectives and methods in transport and social exclusion research, Sydney:
Emerald Group Publishing.
Denne, T (2006)
Enabling biofuels: biofuel economics. Covec report for the Ministry of Transport.
RELEASED
Department for Transport, UK (2005)
Transport, wider economic benefits, and impacts on GDP. Discussion
paper.
Ernst & Young (1997)
Alternative transport infrastructure investments and economic development for the
Auckland region. Report for the Keep Auckland Moving Campaign (ARC and the region’s TLAs).
Faulhaber, G (1975) Cross-subsidization: pricing in public enterprises,
The American Economic Review 65,
OFFICIAL
no.5: 966–977.
Fisher, G, K Rolfe, T Kjellstrom, A Woodward, S Hales, A Sturman, S Kingham, J Peterson, R Shrestha and D
King (2002)
Health effects due to motor vehicle air pollution in New Zealand. Report to the Ministry of
Transport.
Geurs K, R Haaijer and B Van Wee (2006) Option value of public transport: methodology for measurement
and case study for regional rail links in the Netherlands.
Transport Reviews 26, no.5: 613–643.
93
Metropolitan rail: external benefits and optimal funding
Gramlich, E (1990) How should public infrastructure be financed?
Conference series, Federal Reserve Bank
of Boston, pp223–245. Accessed 28 April 2014. www.bos.frb.org/economic/conf/conf34/conf34g.pdf
Greater Wellington Regional Council (GWRC) (2013)
Wellington regional rail plan 2010 – 2035. Revised
edition. Wellington: GWRC.
Grimes, A (2008)
The role of infrastructure in developing New Zealand’s economy. Paper presented to
Institute of Policy Studies Spring 2008 lecture series.
Guerra, E (2010)
Valuing rail transit: comparing capital and operating costs to consumer benefits.
Berkeley: University of California.
HAPINZ (2012)
Updated health and air pollution in New Zealand study. Prepared for Health Research
THE ACT
Council of New Zealand, Ministry of Transport, Ministry for the Environment and New Zealand
Transport Agency. Accessed 20 March 2013. www.hapinz.org.nz/.
Hazledine, T, S Donovan and J Bolland (2013) The contribution of public transport to economic
productivity.
NZ Transport Agency research report 514. 63pp.
Independent Pricing and Regulatory Tribunal (2012)
Review of maximum fares for CityRail services from
January 2013. Final report, November 2012.
Institute for the Study of Competition and Regulation (1999)
The privatisation of New Zealand Rail part 2:
quantitative cost benefit analysis. Accessed 27 April 2014.
UNDER
www.iscr.org.nz/f251,5018/5018_tranzrail_part_2_100799.pdf.
Institute for the Study of Competition and Regulation (2009)
The history and future of rail in New Zealand.
Kemp, A, V Mollard and I Wallis (2012) Value capture mechanisms for funding transport infrastructure.
NZ
Transport Agency research report 511. 107pp.
Kennedy, D (2013) Econometric models for public transport forecasting.
NZ Transport Agency research
report 518. 407pp.
Kennedy, D and I Wallis (2007) Impacts of fuel price changes on New Zealand transport.
Land Transport
INFORMATION
1982
NZ research report 331.
Longley, I, S Kingham, K Dirks, E Somervell, W Pattinson and A Elangasinghe (2013) Detailed observations
and validated modelling of the impact of traffic on the air quality of roadside communities.
NZ
Transport Agency research report 516. 203pp.
Mathur, S, and A Smith (2012) A decision-support framework for using value capture to fund public
RELEASED
transit: lessons from project-specific analyses.
Mineta Transportation Institute report 11–14.
Medda, FR and M Modelewska (2011)
Land value capture as a funding source for urban investment: the
Warsaw metro system. Ernst & Young.
Ministry of Transport (MoT) (2005)
National rail strategy to 2015. Accessed 27 April 2014.
www.transport.govt.nz/about/publications/Documents/nationalrailstrategy.pdf
OFFICIAL
Ministry of Transport (MoT) (2013a)
Auckland metro rail funding and ownership package. Accessed 28
April 2014. www.transport.govt.nz/ourwork/rail/aucklandmetrorail/
Ministry of Transport (MoT) (2013b)
Wellington metro rail funding and ownership package. Accessed 28
April 2014. www.transport.govt.nz/ourwork/rail/wellingtonmetrorail/
Ministry of Transport (MoT) (2013c)
Government policy and funding for rail. Accessed 28 April 2014.
www.transport.govt.nz/ourwork/rail/governmentpolicyandfundingforrail/
94
9
References
National Infrastructure Unit (2010)
National infrastructure plan. Accessed 28 April 2014.
www.infrastructure.govt.nz/plan/mar2010
New Zealand Institute of Economic Research (2013)
Appraising transport strategies that induce land use
changes. Public discussion document. Working paper 2013-04.
New Zealand Transport Agency (2010a)
Economic evaluation manual, volumes 1 and 2.
New Zealand Transport Agency (2010b) Notification of NZTA’s expectations regarding farebox recovery
and funding policies in regional public transport plans and regional land transport programmes.
General circular policy: no 10/03.
New Zealand Transport Agency (2010c)
Fare policy decision-making guide. THE ACT
New Zealand Transport Agency (2012) Estimating indirect benefits for public transport economic
appraisals.
NZTA Research, supplementary issue.
New Zealand Transport Agency (2014) Total mobility around New Zealand: a guide to the total mobility
scheme in the different regions around New Zealand. Accessed 28 April 2014.
www.nzta.govt.nz/resources/total-mobility-scheme/docs/total-mobility-around-new-zealand.pdf.
PriceWaterhouseCoopers (2004)
Infrastructure audit: infrastructure stocktake. Wellington: Ministry of
Economic Development.
Roth, A (1988) Introduction to the Shapley value. Pp1–30 in
The Shapley value, A Roth (Ed) New York:
UNDER
Cambridge University Press, Accessed 28 April 2014.
http://catdir.loc.gov/catdir/samples/cam031/88002983.pdf.
Sinclair Knight Merz (SKM) (2012)
City centre future access study. Study technical report for Auckland
Council and Auckland Transport.
Smart, M (2008)
Value of CityRail externalities and optimal government subsidy. CRA International, final
report. Prepared for IPART.
Smart, M (2008) An empirical estimate of CityRail’s marginal costs and externalities. Wellington: Law and
INFORMATION
1982
Economic Consulting Group.
Smart, M and E Hefter (2012) External benefits of CityRail services – final report to IPART. Wellington:
Sapere Research Group.
Tax Working Group (2009) Design of the income tax/transfer system – background paper for the Tax
Working Group, Session One, 24 July 2009.
RELEASED
The Treasury (2001a)
Tax review. Issues paper June 2001.Wellington: The Treasury.
The Treasury (2001b)
Tax review. Final report October 2001. Wellington: The Treasury.
The Treasury (2002) National rail – how to progress the options.
Treasury report T2002/1756. Wellington:
The Treasury.
The Treasury and Crown Company Monitoring Advisory Unit (2009) Joint officials report on rail funding
OFFICIAL
and policy.
CCMAU report KWR-033/A72197. Wellington: The Treasury, CCMAU.
Wallis, I and D Lupton (2013) The costs of congestion reappraised.
NZ Transport Agency research report
489.
Wallis, I and D Wignall (2012) The benefits of public transport – option values and non-use values.
NZ
Transport Agency research report 471.
95
Metropolitan rail: external benefits and optimal funding
Appendix A: Rationale for government buy-back of
rail assets
The specific justifications for the government buy-backs that occurred from 2002 to 2008 are outlined in
the following sources:
• A 2002 Treasury report
National rail – how to progress the options recommended the government
negotiate with Tranz Rail to buy back the rail infrastructure, in order to further the government
objectives of:
THE ACT
-
network integrity – this being the ability to maintain and extend the network in terms of coverage
and maintenance levels
-
service coverage – this is the ability to increase service levels or alter the type of services provided
-
alternative operators – the ability for alternative operators to access the network.
• The National Infrastructure Unit’s (2010)
National infrastructure plan stated:
Political and public concern about under-investment in the rail network resulted in government buy-
back of the track network in 2004. Subsequent government concern about an effective on-going
subsidy for the private rail operator, through public investment in the track network, led eventually to
a full public ownership of the entire rail business in 2008..
UNDER
• A 2004 infrastructure audit by PriceWaterhouseCoopers pointed to low levels of asset-replacement by
New Zealand Rail in the years since privatisation, resulting from its poor financial performance.
• A speech by Finance Minister Michael Cullen in 2008 expressed a political preference to subsidise a
state-owned enterprise instead of a foreign-owned company.
• A speech by Prime Minister Helen Clark in 2008 stated:
Our government has bought back the rail business for strategic reasons... it also has become clear
INFORMATION
1982
that our rail system cannot survive without substantial government subsidies into the future. That,
together with the need to develop a more sustainable and integrated transport system for our
country, makes the case for public ownership compelling in the 21st century.
RELEASED
OFFICIAL
96
Appendix B: Financial analysis
Appendix B: Financial analysis
To complement our work on the distribution of metropolitan rail benefits, we also undertook a financial
analysis to indicate the outcome for particular groups of allocating costs in line with benefits. This was
achieved by building a spreadsheet model that holds recent and forecast cost data for metropolitan rail in
Wellington and Auckland.
The model allows users to explore a range of cost allocation scenarios and can accommodate the slotting-
in of different cost shares as these emerge from new information, further research, or negotiated
agreement. In its default form, the model uses the following parameter set for the cost shares.
THE ACT
• farebox: 30% to 60% in steps of 10%
• road users: 10% to 30% in steps of 10%
• central government: 15% to 25% in steps of 10%
• local government: balance to 100%
The default parameter set is loosely based on recent experience, and these values can be changed as
better information emerges. The balancing share which is labelled ‘local government’ could equally be
thought of as ‘owners of property near stations’ or as some combination of this group and the wider
ratepayer community.
UNDER
The model is also designed to illustrate the difference between a pay-go system for capital expenditure
and a depreciation-based alternative in which the capital costs are spread over time. In the latter case, the
model user can adjust both the duration of time for recovering capital and the interest rate payable.
Annual capital charges are then allocated across the benefitting groups in the selected proportions.
B1 Data
The model uses Transport Agency data on rail patronage, rail passenger-km and rail vehicle-km, and
INFORMATION
1982
forecasts of these variables out to 2018/19. It also draws on operating and capital cost data from the
Transport Agency and in the case of Wellington it uses the latest forecasts of capital expenditure provided
by the Greater Wellington Regional Council.
An interesting feature of the Wellington data is the very lumpy nature of the recent and forecast capital
expenditures as shown in figure B.1.
RELEASED
OFFICIAL
97
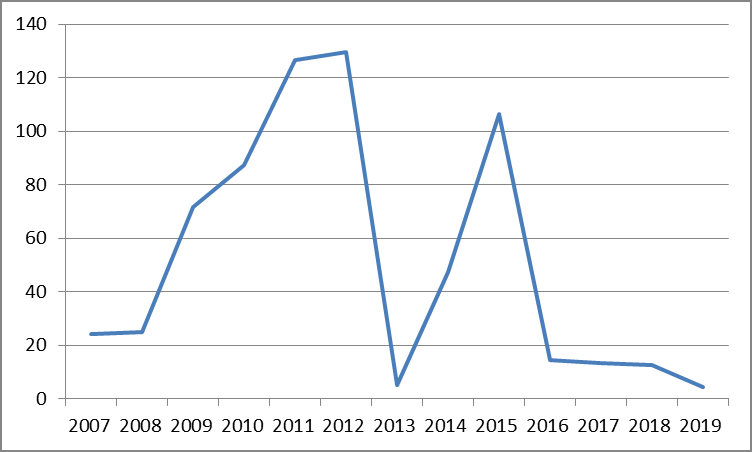
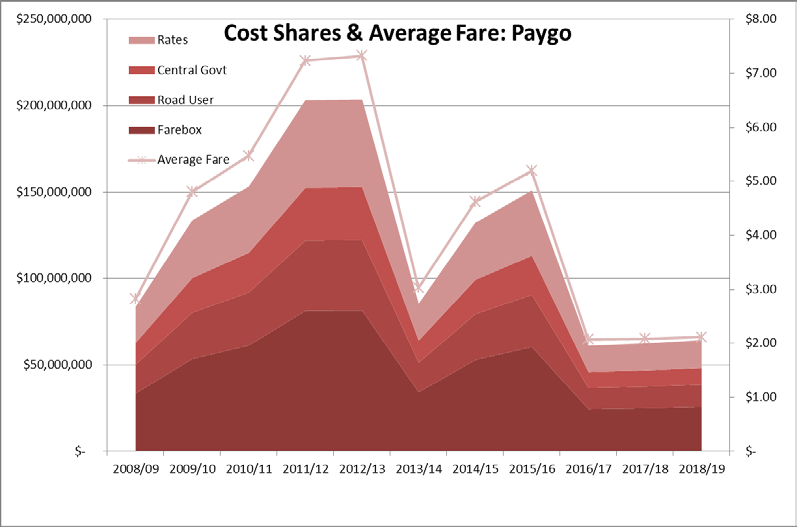
Metropolitan rail: external benefits and optimal funding
Figure B.1
Actual and projected capital expenditure, Wellington ($m)
THE ACT
B2 Illustrative results
UNDER
The main value of this model is that it translates benefit shares into cost allocations. However it is also of
interest to see how different the cost allocations look depending on the treatment of capital expenditure.
In figure B.2 we show how costs would have been allocated for Wellington metropolitan rail under a pay-go
approach to capital investment, and forecasts for these shares out to 2019.
Figure B.2
Indicative cost allocation and average fares: Wellington; pay-go
INFORMATION
1982
RELEASED
OFFICIAL
98
link to page 87 link to page 99
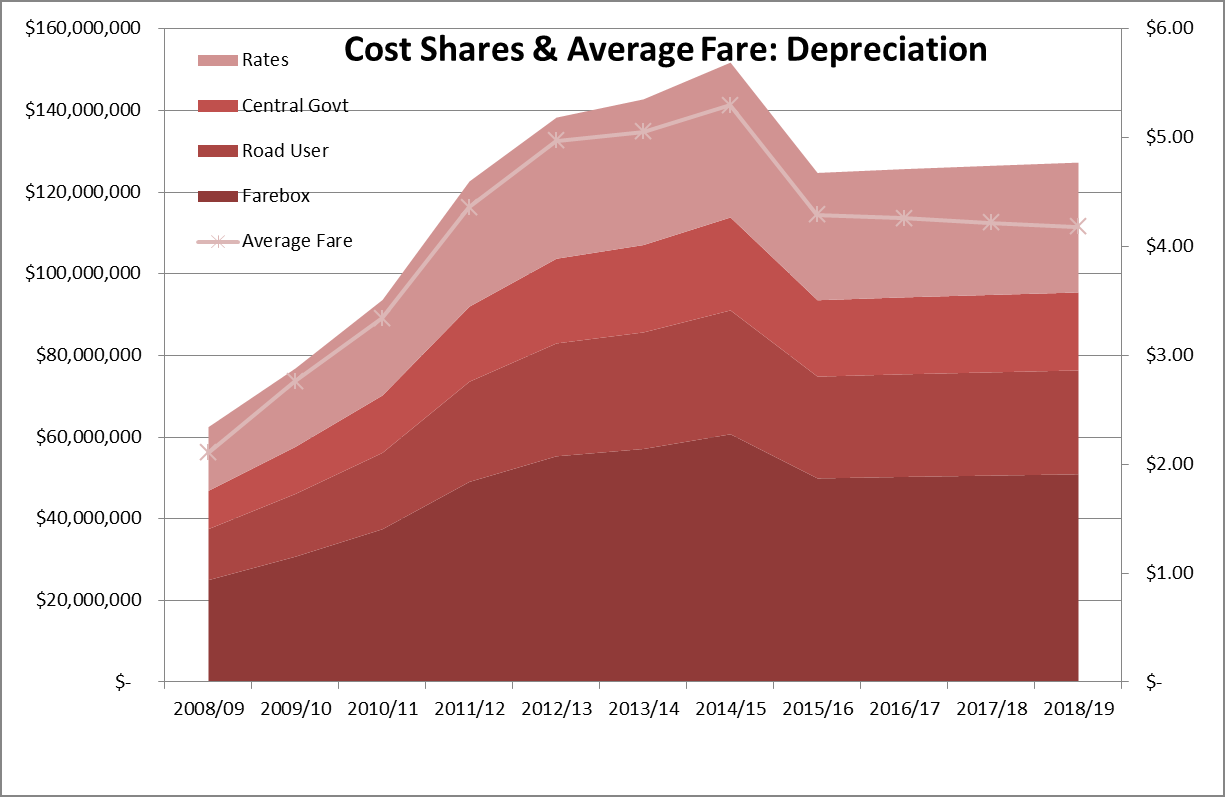
Appendix B: Financial analysis
This figure is based on the following allocated shares:
53
• farebox
40%
• road users (NLTF)
20%
• central government
54
15%
• local government
25%
It will be noted that the average fare oscillates in line with total costs, which are lumpy because of capital
spending. Fares range from around $7 to around $2 in just a few years. By contrast, figure B.3 shows the
same situation except with a smoothing out of capital spending through the use of debt financing at an
ACT
interest rate of 6% per annum.
THE
Figure B.3
Indicative cost allocation and average fares: Wellington depreciation over 10 years
UNDER
INFORMATION
1982
In this case fares are much more stable, in the range of $4 to $5 over the forecast period.
Another useful experiment is to hold average fares constant and track the total subsidy required. As
RELEASED
shown in figure B.4 below (which uses Wellington data), the size of the subsidy depends heavily on the
treatment of capital expenditure, with the time profile for the pay-go method again being much more
volatile.
OFFICIAL
53 These shares are used as an illustrative example and do not necessarily reflect the optimal amounts.
54 Sourced from general taxation.
99
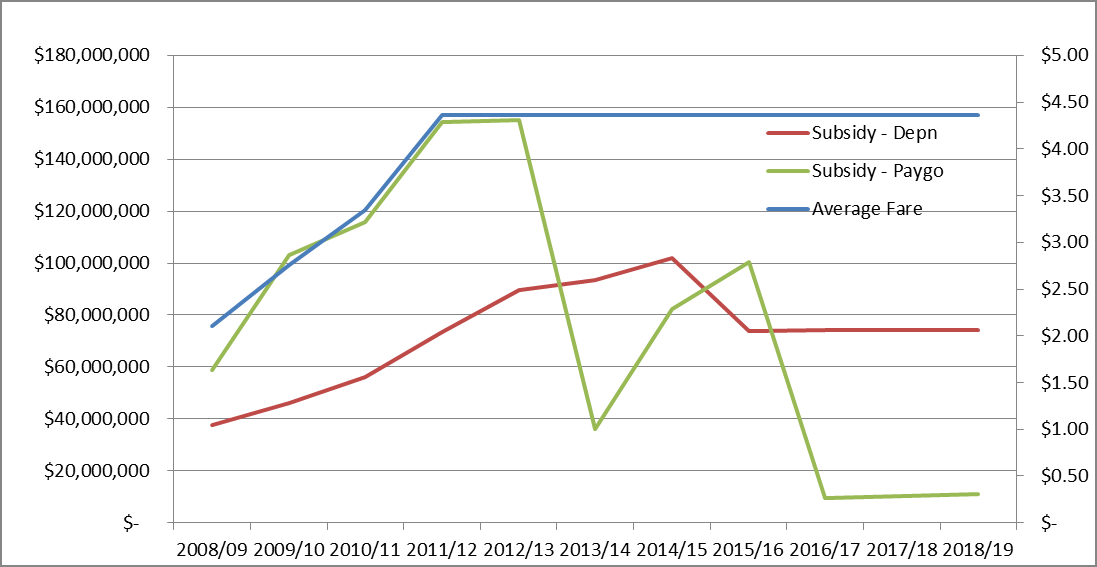
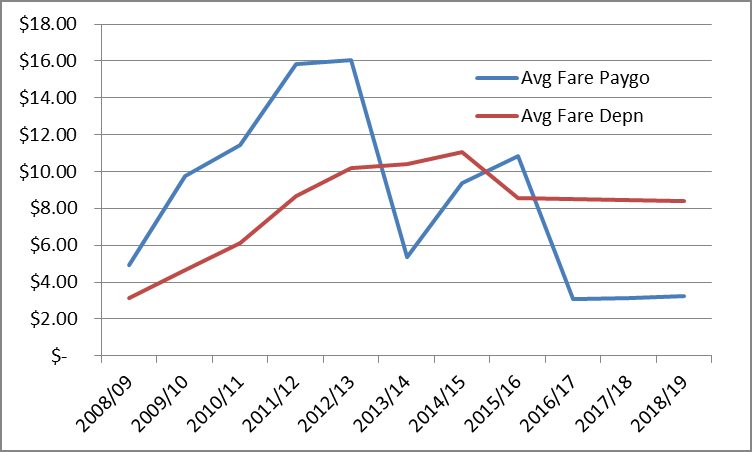
Metropolitan rail: external benefits and optimal funding
Figure B.4
Wellington simulation with constant fares over forecast period
THE ACT
Conversely, we might consider what happens to average fares if the total subsidy is fixed over time. In the
simulation shown in figure B.5 we fix the total subsidy at $25m per annum and allow fares to adjust to
recover the balance of cost. The same general pattern would emerge with higher levels of constant
subsidy.
UNDER
Figure B.5
Wellington simulation with constant total subsidy
INFORMATION
1982
RELEASED
OFFICIAL
100
Document Outline