 CORPORATE OFFICE
Level 1
CORPORATE OFFICE
Level 1
32 Oxford Terrace
Telephone: 0064 3 364 4160
Christchurch Central
Fax: 0064 3 364 4165
CHRISTCHURCH 8011
[email address]
20 November 2017
Health Sector Workers Network
Email: [FYI request #6624 email];
Dear Health Sector Workers Network,
RE Official information request CDHB 9711
I refer to your email dated 2 October 2017 requesting the following information under section 12 of the Official
Information Act from Canterbury DHB.
1. What is the financial value of efficiency gains made in the 2016/2017 financial year?
Canterbury DHB does not have an efficiency programme as such. As part of our on-going processes, we regularly
review and seek to improve efficiency opportunities.
With the continued constraints on Government funds, we recognise the need to maximise value from our limited
resources and continuously identify and reduce unnecessary cost and waste. Please note that this does not entail
a purely financial focus on achieving efficiencies, rather, we seek to deliver services in more effective and efficient
ways, reduce waste and duplication, and make the best use of our resources.
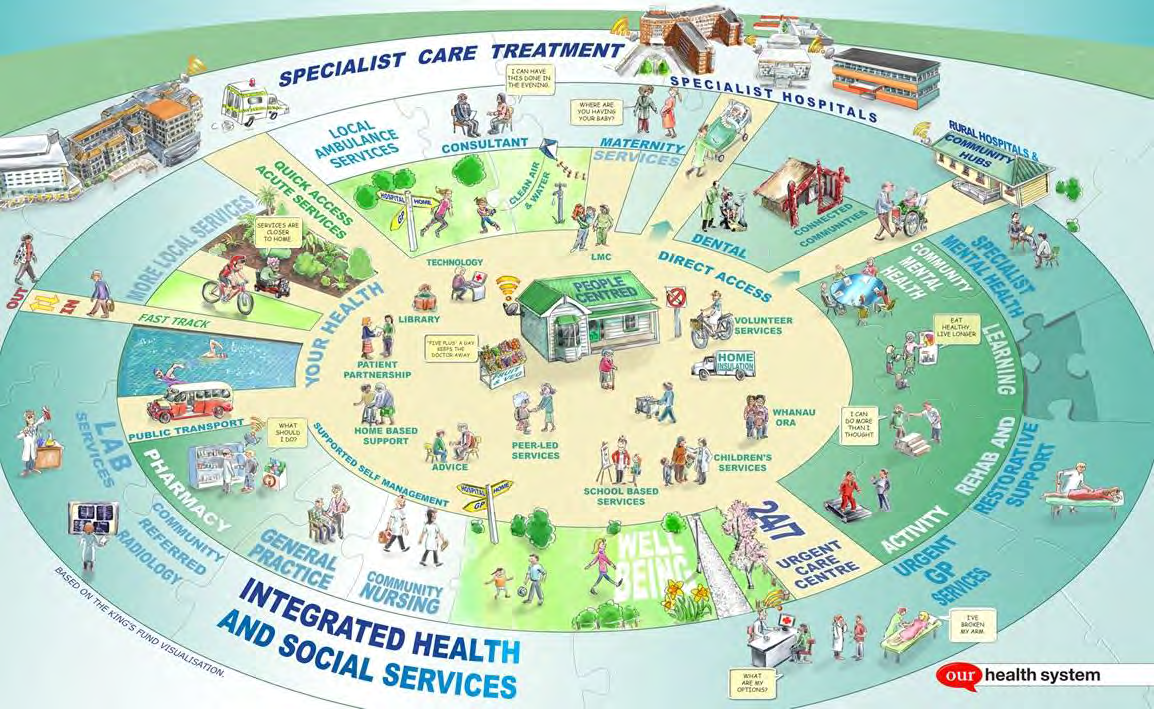
Our vision is of an integrated system that supports people to stay well and provides the right service, in the right
place at the right time. When people are supported to stay well, they need fewer hospital-level interventions and
spend less time in hospital. This not only results in better health outcomes for the individual but also reduces
demand and frees up health resources.
Over the past few years Canterbury DHB has seen a significant reduction in hospital bed utilisation despite the
challenges from holding the unenvious status of enduring New Zealand’s most catastrophic natural disaster. This
has not only saved thousands of bed days but also enabled thousands of people who would otherwise have been
admitted into hospitals with acute medical conditions to receive treatment and care in their own homes.
Please find attached as
Appendix 1 our Benefits Realisation Report, September 2017.
2. What were the 2016/2017 financial year budgeted and actualised personnel costs by service and personnel
category?
The budgeted and actual 2016/17 personnel cost by Personnel Category is as follows:
PERSONNEL COST BY CATEGORY
ACTUAL $M
BUDGET $M
Medical Personnel
213.4
210.7
Nursing Personnel
284.9
282.0
Allied Health Personnel
110.7
110.4
Support Personnel
21.8
21.7
Management/Administration Personnel
91.9
92.8
Total
722.7
717.6

The actual 2016/17 personnel cost by Division is as follows:
PERSONNEL COST BY DIVISION
ACTUAL $M
Rural Hospitals
25.3
Older Persons Health & Rehab
80.0
Medical & Surgical; Womens & Childrens
423.3
Hospital Support & Labs
33.0
Mental Health
92.6
Community Public Health
9.2
Subsidiaries
19.0
Support & Governance
40.3
Total CDHB
722.7
Notes:
a) Personnel cost by service is not easily obtainable due to some staff costs being shared between service
areas. We have therefore provided personnel costs by Division.
b) We are declining to provide a response for the budgeted and actualised personnel costs by service under
section 18(f) of the Official Information Act - i.e.
“… that the information requested cannot be made
available without substantial collation or research”.
3. What were the predicted savings or efficiency gains expected for personnel costs for the 2016/2017 financial
year by FTE and financial value, stratified by service and personnel category?
To the best of our ability, Canterbury DHB manages personnel costs [including Individual Employment Agreements]
within the parameters of our annual budgets. These budgets are developed as part of the annual planning process
for Canterbury DHB.
4. What is the planned financial value of efficiency gains for the 2017/2018 financial year?
Please refer to our response to question 1 above.
5. What are the current predicted savings for personnel costs for the 2017/2018 financial year? (For example –
what is the anticipated financial value that will be included in the efficiency gains data for the 2017/2018
financial year if personnel costs keep to budget)
Please refer to our response to question 1 above.
I trust that this satisfies your interest in this matter.
Yours sincerely
Carolyn Gullery
General Manager
Planning, Funding & Decision Support
BENEFITS REALISATION-
UPDATE – SEPTEMBER 2017
“We need the whole system to be working
for the whole system to work.”
Canterbury DHB| September 2017
1
link to page 5 link to page 5 link to page 7 link to page 8 link to page 9 link to page 9 link to page 11 link to page 11 link to page 12 link to page 15 link to page 18 link to page 20 link to page 22 link to page 25 link to page 26
CONTENTS
BENEFITS: PROGRESS AGAINST THE DBC .......................................................................................................... 3
AVERAGE LENGTH OF STAY ................................................................................................................................................... 3
BED DAYS ACTIVITY................................................................................................................................................................ 5
AGED RESIDENTIAL CARE UTILISATION ................................................................................................................................. 6
BACKGROUND ................................................................................................................................................. 7
REALISING THE BENEFITS ....................................................................................................................................................... 7
WHAT WE’VE ACHIEVED .................................................................................................................................. 9
NO DEFICIT ............................................................................................................................................................................ 9
DECREASED AGED RESIDENTIAL CARE RATES ...................................................................................................................... 10
INCREASED INTERVENTION RATES ...................................................................................................................................... 13
INCREASED SURGICAL DISCHARGES .................................................................................................................................... 16
REDUCED WAITING TIMES ................................................................................................................................................... 18
DECREASED ACUTE MEDICAL DISCHARGE RATE .................................................................................................................. 20
INCREASED ACCESS TO DIAGNOSTICS ................................................................................................................................. 23
DECREASED ADVERSE EVENTS ............................................................................................................................................. 24
Canterbury DHB Benefits Realisation Update – September 2017
2
Benefits: Progress against the DBC
This section provides a summary of three areas of quantifiable benefits in patient care outlined in the Detailed
Business Case (DBC). These represent the major benefits that can be addressed through development of the
model of care as new facilities are developed. Further details about these are provided in subsequent
sections. According to the available data, benefits are updated either annually, quarterly or monthly.
AVERAGE LENGTH OF STAY
After accounting for demographic growth assumptions in the DBC indicated that demand would be modifiable
to create efficiencies in length of stay of five percent for general medicine, cardio/respiratory, acute general
surgery, elective general surgery, acute orthopaedic surgery and elective orthopaedic surgery. A further step
change of two percent would be achievable in 2019 when both Burwood and Christchurch hospital rebuilds
are operational.
In 2014/15 compared with 2011/12 (baseline for the DBC) the standardised acute length of stay had decreased
by eight percent, the elective length of stay decreased by 6.2 percent and the acute medical length of stay
decreased by 10.2 percent (shown in figures below). This is achieving better than projected benefits and
shows stronger performance than national changes.
Standardised Acute LOS
4.504.27
4.34
4.23
4.13
4.03
3.96
3.91
4.004.27
4.29
3.86
3.77
4.02
3.98
3.50
3.76
3.67
3.66
3.49
3.40
3.00
2006/07 2007/08 2008/09 2009/10 2010/11 2011/12 2012/13 2013/14 2014/15
Canterbury DHB
NZ
Canterbury DHB Benefits Realisation Update – September 2017
3
Standardised Elective LOS
3.84
3.86
3.82
4.00
3.67
3.55
3.49
3.36
3.503.74
3.67
3.72
3.24
3.16
3.54
3.41
3.00
3.18
3.18
3.12
2.99
2.50
2006/07 2007/08 2008/09 2009/10 2010/11 2011/12 2012/13 2013/14 2014/15
Canterbury DHB
NZ
Standardised Acute Medical LOS
4.504.11
4.17
4.02
3.89
3.79
4.00
3.73
3.69
4.15
4.23
3.63
3.56
3.92
3.50
3.85
3.65
3.57
3.55
3.00
3.27
3.24
2.50
2006/07 2007/08 2008/09 2009/10 2010/11 2011/12 2012/13 2013/14 2014/15
Canterbury DHB
NZ
In 2015/16 the national measure for length of stay was altered to account for day cases with limited
longitudinal comparison yet available. Progress against this measure continues to be monitored longitudinally
with both surgical and medical acute length of stay relatively flat. This will be monitored closely as it appears
to be a symptom of demand exceeding capacity.
Length of stay
2.70
2.55
2.52
2.52
2.50
2.50
2.50
2.30
2.37
2.40
2.41
2.41
2.40
2.10
1.90
1.70
1.55
1.53
1.55
1.55
1.54
1.50
1.59
1.54
1.53
1.52
1.52
1.30
Base Line 2015
F16 Q4 Result
F17 Q1 Result
F17 Q2 Result
F17 Q3 Result
Canterbury elective LOS
Canterbury acute LOS
NZ elective LOS
NZ acute LOS
Canterbury DHB Benefits Realisation Update – September 2017
4
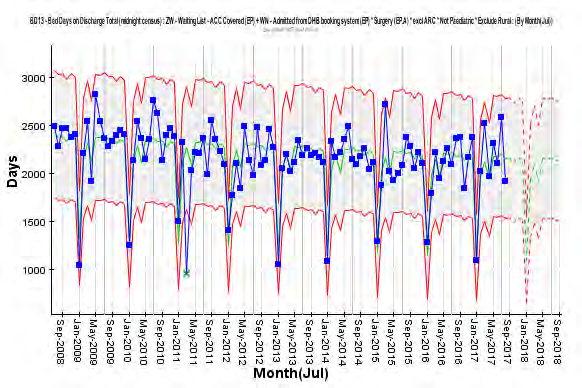
BED DAYS ACTIVITY
Bed days are a combination of changes in discharge rate and changes in length of stay. Apart from the DBC
assumption of decreased length of stay of five percent across all specialities, assumptions were made for
intervention rates with demand efficiencies of five percent for general medicine, cardio/respiratory, two
percent for acute general surgery and acute orthopaedic surgery (and 0% for elective general surgery and
elective orthopaedic surgery). In all, the combined actual increase in beds days across medical/surgical and
older person’s rehab from 2011/12 to 2016/17 is 5,309 bed days (2.3%) despite significant population growth.
This has resulted from a reduction of 6.9 percent in medical/surgical bed days and 23.1 percent fewer bed days
for older person’s rehab compared with the 2011/12 DBC. Note: older person’s rehab bed days has increased
as planned following the opening of the Burwood redevelopment.
The Canterbury health system has significantly out-performed the DBC bed day assumptions.
Medical/Surgical discharges and bed days
190000
100000
185000
95000
180000
90000
s
s 175000
85000
ge
ay
d 170000
80000
ar
d
ch
165000
75000
Be
Dis
160000
70000
155000
65000
150000
60000
F2012
F2013
F2014
F2015
F2016
F2017
Bed Days 2012 DBC
Actual bed days
Discharges 2012 DBC
Discharge Actual
Older Person's Rehab discharges and bed days
90,000
4500
4300
80,000
4100
3900
70,000
s
s
3700
ge
ay
d 60,000
3500
ar
d
ch
3300
Be 50,000
Dis
3100
2900
40,000
2700
30,000
2500
F2012
F2013
F2014
F2015
F2016
F2017
2012 DBC bed days
Actual bed days
2012 DBC discharges
Actual discharges
Canterbury DHB Benefits Realisation Update – September 2017
5
AGED RESIDENTIAL CARE UTILISATION
Utilisation of ARC in Canterbury has been high relative to other DHBs. Through a series of interventions the
DBC assumes that Rest Home bed days per population will reduce to the national average by 2020. Other ARC
bed types are not assumed to reach the national average in the 10 year forecast period.
Rest Home level care has achieved 207,040 fewer bed days in 2016/17 compared with 2009/10, while bed
days in Hospital level care have decreased slightly (477). On a population rate basis, Canterbury’s aged
residential care utilisation has fallen below South Island rates. Canterbury’s rest home bed utilisation has gone
from 4.0% above the South Island rate (including Canterbury) in 2009/10 to 4.3% below in 2016/17 for over
65s. At the same time, Canterbury’s hospital bed day population rate has moved from 10.6% above the whole
of South Island rate to 1.3%. The rate of rest home and hospital level bed days have fallen by 41.7% and 16.1%
respective between 2009/10 and 2016/17.
Age Residential Care - Bed Days for Canterbury from 2008
70000
60000
50000
40000
30000
20000
10000
0
7 10 1 4 7 10 1 4 7 10 1 4 7 10 1 4 7 10 1 4 7 10 1 4 7 10 1 4 7 10 1 4 7 10 1 4 7 10 1 4
2007/2008 2008/2009 2009/2010 2010/2011 2011/2012 2012/2013 2013/2014 2014/2015 2015/2016 2016/2017
Dementia
Hospital Care
Psychogeriatric
Rest Home
Canterbury DHB Benefits Realisation Update – September 2017
6
Background
This report provides the eleventh three-monthly brief update on the benefits realisation first presented in
November 2014 which outlined a series of indicators of the outcomes identified in the investment logic map
for Canterbury’s major capital investments. This summary presents the indicators and provides commentary
on recent trends and the impacts of any changes.
The three key directions in Canterbury’s Health Services vision for future health services are:
Further development of services that support people to take increased responsibility for their health and
a change of approach within existing services to support this
Development of primary health care and community services’ capacity and capability to support people in
a community based setting and provide a point of ongoing continuity
Freeing up secondary care based specialist resources to be responsive to episodic events, more complex
cases and the provision of advice and support to primary care.
Redeveloping facilities was identified as a necessary enabler to meet the future need of the Canterbury Health
System in a 2010 Business Case.
The earthquakes of 2010 and 2011 have had a major impact on the people of Canterbury as well as the
Canterbury Health System. While the health system has been able to maintain and deliver innovative services
to address the emerging needs of our population, there remain a number of significant challenges and
successes; we still have broken buildings, and stretched capacity and we have a population that is more fragile
and more likely to require support from our health system, particularly for mental health services. The
ongoing delivery of care and services in buildings that don’t comply with new building codes while we repair
and redevelop our building stock requires balance with the immediate harm caused by denying our population
access to services.
The ongoing uncertainty is draining the community’s resilience and related health issues are emerging. We
face further challenges to meet our population’s needs with sub-standard housing, crowded, damp and cold
conditions. We look forward to occupying new/redeveloped facilities in the coming months.
The opening and occupation of the redeveloped Burwood Campus has delivered the first major hospital build
within the broader investment program. While realising the advantages of this new infrastructure will take
time, transition has been smooth and new practices are being established.
REALISING THE BENEFITS
The benefits to be realised from the facilities redevelopment program are directly linked to the objectives for
the health system. Benefits realisation focuses on ensuring that the full hypothesised benefits of the projects,
primarily improved health service provision, are achieved.
Designing the best-fit benefits realisation approach has been undertaken alongside the development of a
‘whole of system’ outcomes framework for the Canterbury Health System. The DBC and the associated
Investment Logic Map developed to support the Business Case underpin the benefits realisation approach.
It should be recognised that the new facilities are an enabler in a transformational journey that commenced
well before the development of the Business Cases and as such will continue after the commissioning of the
Canterbury DHB Benefits Realisation Update – September 2017
7
new buildings. In this context the benefits should be viewed as accruing from an integrated strategy for
transformation that goes beyond the implementation of the new facilities.
Investment Logic Map
PROBLEM
INTERVENTIONS
BENEFITS
SOLUTION
High Level
Ways of Working
Assets Needed
Lack of available beds
Develop shared
Living within our
Patient-centred model
m
2014
system-wide vision &
A
means
of care
planning
yste
Patient
Workforce
Agreed clinical
management
unsustainable
Redesign model of
Equity of outcomes
ed S
pathways
system
care, with consumer
B
n
participation, to be
rai
Fragmented system
patient-centred
st
Clinical prioritisation
2014
on
Increased system
C
Poor flow
productivity to
Increased
Redesign enablers to
C
a
Better, Sooner, More
match demand
diagnostic capacity
support model of care:
in
Convenient:
d
Funding
Primary-
Fiscally unsustainable
Workforce
an
secondary shift
IT
Earlier diagnosis
Services in the
2015
Physical
D
community,
Dem
Clinically
infrastructure
closer to home
g
unsustainable
System
n
Shared decision
Increased ATR
si
partnerships
making
facility capacity
Earlier access to care
Lack of post-disaster
E
crea
Workforce model
capacity
In
2018
Patient Safety
Funding allocation
Benefit
Key Performance Indicators
F
Increased hospital
capacity
A
No deficit
Production Planning
A & B
Decreased Aged Residential Care (rest home) rates
B, C & D
Increased intervention rates
B, C, D & E
Increased surgical discharges
Lean Thinking
B, C, E & F
Decreased wait times (for community, primary and secondary care,
and for diagnostics)
Shared health record
B, D & E
Decreased acute medical discharge rate
B, E & F
Increased diagnostic access
B & F
Decreased adverse events
Canterbury DHB Benefits Realisation Update – September 2017
8
What we’ve achieved
The following section represents a report on the Key Performance Indicators identified in the
Investment Logic
Map. This is in addition to the work we are undertaking to manage the increased earthquake-related demand
(especially mental health and emergency services) which were not anticipated in the Business Cases.
NO DEFICIT
Situation
Canterbury has to manage within its financial means in a post-earthquake environment. Although external
review of our financials has confirmed that Canterbury was on track to achieve a surplus in 2010/11 prior to
the February earthquake, there has been earthquakes costs totalling $107 million over the four years following
the earthquake; Canterbury has delivered a cumulative deficit of $84 million which has been deficit funded by
the Ministry of Health.
Since 2015/16 Canterbury’s financial position has been explored through two external reviews conducted by
PwC which have consistently indicated Canterbury DHB’s operating expenditure is well managed but
depreciation, interest and capital charge are having and will continue to have a significant impact for the
foreseeable future. Stage 2 of the PwC financial review focused on financial and system sustainability has
been analysed and a number of strategies have been implemented to ensure operational efficiencies of 0.8%
are achieved in 2017/18 (achieving cumulative annual efficiencies of 0.8% each year will be extremely
challenging in light if Canterbury’s falling share of the national funding pool).
The expected funding path in the DBC has not eventuated as Health has received a lower funding growth rate
than advised by the National Health Board in 2012. While achieving operational efficiencies has mitigated the
lower funding path, the fall in national share of the funding pool has created a deficits in 2016/17 and forecast
in 2017/18.
What did we do about it?
Over the past five years Canterbury has developed new service delivery models, funding and contracting
mechanisms that minimise the financial risks and enable the continuation of service delivery despite
constrained theatre and bed capacity. Most community services are now capacity contracted and elective
services are creatively purchased which in aggregate are 13 to 17 percent below national pricing.
Furthermore the PwC review and other recent analysis has demonstrated Canterbury is relatively efficient in
its service delivery in comparison with similar DHBs. This finding is consistent with recent reports from
Treasury which Canterbury DHB the fifth most efficient DHB and is within five percent of the best DHB, and the
Australasian benchmarking group, Health Round Table, which rated Canterbury as the most efficient of the
larger DHBs.
The predicted post-disaster increase in mental health demand has resulted in services running at or over
capacity. To meet the mental needs of Canterbury’s population, the DHB has continued to develop its model
of care with a community focus investing in mental health services from other funding envelopes to better
Canterbury DHB Benefits Realisation Update – September 2017
9
address the needs with timely intervention. The population’s extraordinary post-disaster mental health need
has been recognised with the Government providing an additional $20 million over four years.
Performance against KPI
Canterbury’s budgeted deficit for 2017/18 is $53 million.
While Canterbury’s population share has increased since 2014/15 our funding share has significantly
decreased; the historical differential of approximately 0.30% between population share and funding share has
expanded to 0.77%. This change represents real revenue decreases of $43.9 million in 2015/16 and $59.7
million (greater than the deficits in each of these years).
Share of population, funding and funding at historical 0.30% lower than pop
share
11.8%
11.6%
11.4%
11.2%
$43.9M $59.7M
11.0%
10.8%
10.6%
10.4%
2007-08 2008-09 2009-10 2010-11 2011-12 2012-13 2013-14 2014-15 2015-16 2016-17 2017-18
Share of population
Share of PBF Funding
Funding share at -0.30% of pop
Over the last six years (2011/12 to 2017/18) Canterbury’s funding has increased by $220 million or 19.2%.
However, if had increased at the national average of 23.7%, funding over the last six years would have
increased by $292 million.
DECREASED AGED RESIDENTIAL CARE RATES
Situation
Canterbury lost 635 aged residential care (ARC) beds post-quake. Due to a large scale private investment there
is now an oversupply of capacity which has allowed a return of respite capacity. Canterbury has historically
had a high proportion of older people in ARC, which was identified as a measure to be reduced as part of our
investment logic approach.
Canterbury DHB Benefits Realisation Update – September 2017
10
What did we do about it?
Canterbury has invested in new models of care (integrated district nursing and restorative home-based
support and CREST in particular) which had been designed to keep people well and healthy in their own home
and reduce the rate of entry to ARC.
Performance against KPI
Canterbury continues to have an increasing aged population and has the largest DHB populations of over 65
years and over 75 years in absolute numbers, however while remaining above average these proportions of
national share have slightly reduced as the national population also ages.
Change in demographics between Censuses
40,000
35,000
30,000
25,000
20,000
15,000
10,000
5,000
0
+
–4
–9
0
5
–14
–19
–24
–29
–34
–39
–44
–49
–54
–59
–64
–69
–74
–79
–84
85
10
15
20
25
30
35
40
45
50
55
60
65
70
75
80
2006 Census
2013 Census
However the rate at which people are entering aged residential care has declined and there are over 560
fewer people in rest home and hospital level care than in 2009/10. This represents a reduction in the
proportion of people aged over 75 years in institutional care as well as a reduction in absolute numbers.
Proportion of 75+ people living in own homes
88.0%
87.0%
86.0%
85.0%
84.0%
83.0%
82.0%
Canterbury %
South Island %
Canterbury DHB Benefits Realisation Update – September 2017
11
The length of stay on entry has also reduced from 50% remaining in care at 26 months in 2006 to 50% being in
care under12 months.
Age Residential Care - Bed Days for Canterbury from 2008
70000
60000
50000
40000
30000
20000
10000
0
7 10 1 4 7 10 1 4 7 10 1 4 7 10 1 4 7 10 1 4 7 10 1 4 7 10 1 4 7 10 1 4 7 10 1 4 7 10 1 4
2007/2008 2008/2009 2009/2010 2010/2011 2011/2012 2012/2013 2013/2014 2014/2015 2015/2016 2016/2017
Dementia
Hospital Care
Psychogeriatric
Rest Home
What does this mean?
The combined interventions have meant expenditure on Aged Residential Care has plateaued since 2010
despite price increases each year. The annualised foregone expenditure for 2017 were $26.7M for hospital
level and 19.4M for rest home level based on projections from 2009/10.
The Detailed Business Case proposed Canterbury would decrease Rest Home bed days from 27% above the
national average in 2011/12 back to the national level by 2020. This has been achieved in advance.
Canterbury DHB Benefits Realisation Update – September 2017
12
Change in actual versus projected ARC costs from 2009/10
$200,000,000
$180,000,000
$160,000,000
$140,000,000
$120,000,000
$100,000,000
$80,000,000
$60,000,000
$40,000,000
$20,000,000
$-
Dementia
Hospital Care
Psychogeriatric
Rest Home
Total
Dementia projected
Hospital Care projected
Psychogeriatric projected
Rest Home projected
Total projected
INCREASED INTERVENTION RATES
Situation
Ensuring an increasing focus on planned care underpinned the investment logic map, particularly over winter
when acute demand is highest increasing the risk of cancelling surgery. This has been addressed by increasing
the range and level of community interventions (e.g. Acute Demand Management Services, CREST, Medication
Management, and Community Falls Prevention) to reduce acute admissions and allow greater planned activity.
What did we do about it?
Canterbury is severely constrained by the number of theatres available for surgery. The Electives Recovery
Programme outsourcing was established to ensure sufficient theatre time and capacity in key areas to improve
intervention rates. In house theatre utilisation has been maximised resulting in annual growth in the
proportion of outsourcing (now 14% of all elective surgery) to guarantee improved intervention rates.
However this ability to further increase outsourcing is now being limited by the complexity of surgery that
means it cannot be performed in the private system. Increased attention on important pathways such as
fractured neck of femur and major joint surgery have been the focus of new approaches under the enhanced
recovery after surgery initiative.
Canterbury DHB Benefits Realisation Update – September 2017
13
Performance against KPI
Canterbury’s intervention rates are significantly above national rates for angiography, angioplasty, cataracts
and major joints (which has improved in recent years). Only cardiac surgery is below national intervention
rates.
Standardised intervention rate - angiography (per 10,000)
45
40
35
30
25
20
15
10
5
0
31 Mar 2013
31 Mar 2014
31 Mar 2015
31 Mar 2016
31 Mar 2017
Angiography
Angiography
Angiography
Angiography
Angiography
National Intervention Rate per 10,000
Standardised Intervention Rate per 10,000
Standardised intervention rate - angioplasty (per 10,000)
18.00
16.00
14.00
12.00
10.00
8.00
6.00
4.00
2.00
0.00
31 Mar 2013
31 Mar 2014
31 Mar 2015
31 Mar 2016
31 Mar 2017
National Intervention Rate per 10,000
Standardised Intervention Rate per 10,000
Canterbury DHB Benefits Realisation Update – September 2017
14
Standardised intervention rate - cardiac surgery (per 10,000)
6.80
6.60
6.40
6.20
6.00
5.80
5.60
5.40
5.20
5.00
4.80
31 Mar 2013
31 Mar 2014
31 Mar 2015
31 Mar 2016
31 Mar 2017
National Intervention Rate per 10,000
Standardised Intervention Rate per 10,000
Standardised intervention rate - major joint (per 10,000)
30.00
25.00
20.00
15.00
10.00
5.00
0.00
31 Mar 2013
31 Mar 2014
31 Mar 2015
31 Mar 2016
31 Mar 2017
National Intervention Rate per 10,000
Standardised Intervention Rate per 10,000
Standardised intervention rate - cataracts (per 10,000)
39.00
38.00
37.00
36.00
35.00
34.00
33.00
32.00
31.00
30.00
29.00
31 Mar 2013
31 Mar 2014
31 Mar 2015
31 Mar 2016
31 Mar 2017
National Intervention Rate per 10,000
Standardised Intervention Rate per 10,000
Canterbury DHB Benefits Realisation Update – September 2017
15
What does this mean?
Canterbury’s intervention rates have meant people in Canterbury have better access to elective surgical
services resulting in Canterbury DHB achieving the Health Target volumes each year.
INCREASED SURGICAL DISCHARGES
Situation
Bed capacity at Christchurch Hospital was reduced post-quake resulting in increased risk of cancelling surgery
over winter (as above).
The Intensive Care Unit is running at maximum capacity, preventing some elective surgery and blocking patient
flow.
What did we do about it?
Our Electives Recovery Programme was implemented, including establishing outsourcing contracts for elective
surgery with private hospitals including leased theatres where our staff perform the surgery.
We introduced the Orthopaedic Non-Weight Bearing Model of Care for non-weight bearing patients (after
neck of femur, or NOF, surgery). Access to dedicated acute theatre lists for orthopaedics was increased to
reduce pre-operative waiting (especially for fractured NOFs). This has reduced the requirement for beds and
delivered a better outcome for patients by providing faster access to surgery and less time in hospital.
More recently, our focus has been on developing Enhanced Recovery After Surgery (ERAS) processes for hip
and knee replacement which have resulted in improved patient pathways and less waiting.
Performance against KPI
Canterbury has delivered more elective surgery to its population. This has been achieved despite the
substantial removal of minor interventions such as Avastin and simple skin lesions from the analysed elective
surgery volumes.
Canterbury DHB Benefits Realisation Update – September 2017
16
Elective surgical delivery - health target
25,000
21,064
21,452
20,000
16,534
17,093
16,990
17,773
15,372
15,000
10,000
5,000
0
2010/11
2011/12
2012/13
2013/14
2014/15
2015/16
2016/17
Surgical Elective (old target)
Electives delivered by Canterbury (new target)
Updated with new (2015/16) health target definition
There has been an overall 39.6% increase in health target elective surgery delivery between 2010/11 to
2016/17. The planned electives have increased 28.3% during this period which has been accomplished with a
3.0% reduction in bed days.
Despite difficulties earlier Canterbury achieved its elective target of a 550 target uplift and surpassed this by
over 400 electives in 2016/17. However, achieving the increasing demand remains challenging due to system
constraints – there are insufficient theatres and hospital beds in Canterbury to deliver the services for our
population until the opening of the Acute Services Building. In addition, we are reaching limits for outsourcing
both in terms of capacity and ability to cope with complexity among our private sector partners. Canterbury
aims to achieve targets this year by increased outsourcing.
Canterbury DHB Benefits Realisation Update – September 2017
17
What does this mean?
The large increase in elective surgery maintained within a similar bed day level demonstrates internal
efficiencies of over 40% across this time.
REDUCED WAITING TIMES
Situation
Capacity constraints in all parts of the system put pressure on achieving wait times. This applies to theatre
capacity, bed capacity, outpatient capacity and diagnostic capacity.
What did we do about it?
HealthPathways, ERMS (electronic request management system) and more recently HealthOne have
contributed to ensuring that only priority people are referred to secondary care and much of the required care
is now delivered in a community-based setting. These tools support a model of care with improved triage and
enables hospital clinicians to provide advice without seeing the patient face-to-face.
The impact of these initiatives so far is:
Medical specialists see 79 people for FSA for every 100 people seen nationally and 31% of all recorded
virtual FSAs are conducted in Canterbury – a more efficient use of time
Surgical specialists see 77 people for FSA for every 100 people seen nationally and deliver 25% of all
virtual FSAs
Almost11,000 procedures were delivered in general practice in 2016/17 funded by the DHB
General practice accessed 45,227 radiology investigations delivered free in the community without their
patients needing an FSA.
Performance against KPI
Aligned to national direction Elective Services Performance Indicator (ESPI) Waiting Times in Canterbury have
been reduced with fewer patients waiting 120 days for First Specialist Assessment and Treatment (ESPI 2) and
resulting treatment (ESPI 5).
Canterbury DHB Benefits Realisation Update – September 2017
18
ESPI 2: Number of people waiting >120 days for FSA
500
450
400
350
300
250
200
150
100
50
0
l 14
g 14
14
15
15
15
15
15
16
16
16
16
16
17
17
17
17
p
v 14
c 14
b
r 15
n
l 15
g 15
p
v 15
c 15
b
r 16
n
l 16
g 16
p
v 16
c 16
b
r 17
n
Ju
u
ct 14
o
ar
p
Ju
u
ct 15
o
p
Ju
u
ct 16
o
p
A
Se
O
N
De
Jan
Fe
M
A
May 15
Ju
A
Se
O
N
De
Jan
Fe
Mar
A
May 16
Ju
A
Se
O
N
De
Jan
Fe
Mar
A
May 17
Ju
ESPI2
ESPI5
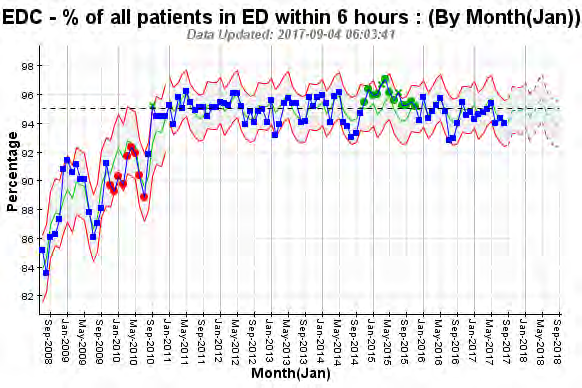
In all but a few quarters since 2010 Canterbury achieved the ED Waiting Time National Health Target of 95% of
people either discharged or admitted within six hours.
Canterbury has focused on high productivity in the provision of diagnostics to our population. Waiting times
for non-urgent CT and MRI scans have been under pressure as volumes have grown and recruitment of staff
has long lead times. Colonoscopy waiting times have shown improved performance.
Canterbury DHB Benefits Realisation Update – September 2017
19
CT and MRI scans within 6 weeks
100%
90%
80%
70%
60%
50%
40%
30%
20%
10%
0%
Jul-16 Aug-16 Sep-16 Oct-16 Nov-16 Dec-16 Jan-17 Feb-17 Mar-17 Apr-17 May-17 Jun-17
CT scans (42 days)
MRI scans (42 days)
Colonoscopy waiting times
120%
100%
80%
60%
40%
20%
0%
Jul-16 Aug-16 Sep-16 Oct-16 Nov-16 Dec-16 Jan-17 Feb-17 Mar-17 Apr-17 May-17 Jun-17
Urgent colonscopy 14 days
Non-urgent colonscopy 42 days
Surveillance colonscopy 84 days
What does this mean?
People in Canterbury are being seen quickly. This approach is ‘best for patient, best for system’ meaning
timely treatment, less waste and rework and greater potential for people to regain functional abilities in their
lives. More rapid access also impacts on the anxiety people have while waiting for their diagnostics and
increased trust in the system.
DECREASED ACUTE MEDICAL DISCHARGE RATE
Situation
After the 2011 earthquakes, there was a reduction in medical beds. While some capacity has been restored,
there are fewer total hospital beds today than pre-quake. Our ARC capacity was also under pressure with
Canterbury DHB Benefits Realisation Update – September 2017
20
frequent blocked patient flow from Assessment, Treatment and Rehabilitation (AT&R) which in turn blocked
flow from General Medicine, stretching the capacity of the entire system.
The lack of flow meant unplanned medical services (or acute demand) put at risk delivery of planned health
care (e.g. electives). Meanwhile, services had to prepare for post-quake populations with greater health need
as a result of increased deprivation, poor housing and winter.
The importance of managing acute demand is recognised in the IPIF program with acute bed days being one of
the four system level measures being monitored from July 2016.
What did we do about it?
Our Acute Demand Management Services (ADMS) were enhanced and ramped up to increase community
capability and capacity to manage acutely unwell patients and reduce unplanned admissions and bed demand.
Medical ward beds were reconfigured and AMAU was extended as key strategies to cope with acute medical
admissions.
The Community Rehabilitation Enablement and Support Team (CREST) was introduced to increase supported
discharge options and reduce acute and ARC admissions and readmissions – particularly among the older
population. A new triage and diversion system was designed to send Ambulance and ED patients to the
primary care After Hours Clinics to further decrease acute demand from people who could be better
supported in the community.
Performance against KPI
Canterbury has continued to maintain its relatively low rate of acute medical admissions. While national acute
admission rates have grown significantly, increases in Canterbury have been modest.
Acute Medical Admission Rate
(standardised per 100,000)
9,000
8,000
6,809
6,886
6,944
7,231
7,348
7,457
7,503
7,657
7,638
7,000
5,815
5,834
6,000
5,000
4,000
4,795
4,545
4,742
4,761
5,031
4,981
5,025
5,246
5,174
5,348
5,625
3,000
2,000
1,000
0
Canterbury
NZ
There has been a reduction in unplanned occupied beds (medical, surgical and AT&R) since the earthquakes,
while the associated discharges have increased indicating greater efficiency within our services.
Canterbury DHB Benefits Realisation Update – September 2017
21
The assumptions about growth after accounting for demographic growth in the detailed business case (DBC)
relied on modified demand efficiencies for intervention rates of 5% for general medicine, cardio/respiratory,
2% for acute general surgery and acute orthopaedic surgery (and 0% for elective general surgery and elective
orthopaedic surgery) and length of stay efficiencies of 5% for all specialties, with a further step change of 2% in
2019.
Medical/Surgical discharges and bed days
190000
100000
185000
95000
180000
90000
s
s 175000
85000
ge
ay
d 170000
80000
ar
d
ch
165000
75000
Be
Dis
160000
70000
155000
65000
150000
60000
F2012
F2013
F2014
F2015
F2016
F2017
Bed Days 2012 DBC
Actual bed days
Discharges 2012 DBC
Discharge Actual
Older Person's Rehab discharges and bed days
90,000
4500
4300
80,000
4100
3900
70,000
s
s
3700
ge
ay
d 60,000
3500
ar
d
ch
3300
Be 50,000
Dis
3100
2900
40,000
2700
30,000
2500
F2012
F2013
F2014
F2015
F2016
F2017
2012 DBC bed days
Actual bed days
2012 DBC discharges
Actual discharges
What does this mean?
The ability to prevent or slow unplanned demand growth is a strength of the Canterbury Health System and an
outlier nationally. Between 2006/07 and 2016/17 acute medical admissions grew by 17 percent in Canterbury
compared with 31 percent nationally. If Canterbury performed at the national average there would be
approximately 13,000 more acute medical admissions.
The financial impact of an increased admission rate can be modelled; assuming an average national length of
stay of 3.56 days (excluding day cases), 109 additional beds would be required, equating to approximately
$30M in 2016/17.
Canterbury DHB Benefits Realisation Update – September 2017
22
Against the ambitious DBC assumptions, Canterbury admissions to medical/surgical were higher in 2016/17
than forecast by 10.3 percent, however to medical/surgical bed days were 6.9 percent below forecast (and had
only grown 3.9% since the 2011/12 DBC baseline). In addition, admissions to older person’s rehab were 19.1
percent lower in 2016/17 than forecast and bed days were 23.1 percent below the DBC forecast (and had
decreased by 2.0 percent since the 2011/12 DBC baseline). This represents a total decrease of 1,212 bed days
since 2012 despite the opening of more capacity at Burwood Hospital.
The reduced demand for acute medical beds has averted significant capital expenditure costs in the hospital
redevelopment programme.
INCREASED ACCESS TO DIAGNOSTICS
Situation
Following a rationalisation of private providers post-quake, the expectation of delivery of radiological
diagnostics continues to increase. The need to repair the facilities of the remaining provider over time put the
maintenance of service delivery at risk.
What did we do about it?
We purchased the kit (at book value), took over the lease and employed the staff from the closing private
radiology provider. This provided much needed staff resources and a second MRI machine as well as other
useful equipment. The ability to deliver diagnostics from a second site has been invaluable in maintaining
access to outpatient and community referred diagnostics. HealthPathways has provide an agreed mechanism
for ensuring appropriate access to radiology services.
With the Burwood Hospital redevelopment, expanded radiology services will be provided from this site using
both new and existing kit as well as staff from Merivale.
Performance against KPI
Direct access to community radiology via general practice has been a strength of the Canterbury Health
System with over 40,000 investigations now conducted each year.
Canterbury DHB Benefits Realisation Update – September 2017
23
Community radiology investigations
50000
45000
40000
35000
30000
25000
20000
15000
10000
5000
0
2011/12
2012/13
2013/14
2014/15
2015/16
2016/17
What does this mean?
Direct access to radiology from general practice (through an active referral triage process) has been enabled by
HealthPathways to support clinical practice and reduce wait times resulting in better outcomes.
DECREASED ADVERSE EVENTS
Situation
Capacity constraints in all parts of the system, building damage and the complexity of delivering services in
broken buildings, temporary accommodation with associated moves and decanting across multiple sites has
put pressure on reducing adverse events.
What did we do about it?
Canterbury has been a leading participant in all of the national quality and safety improvement programmes.
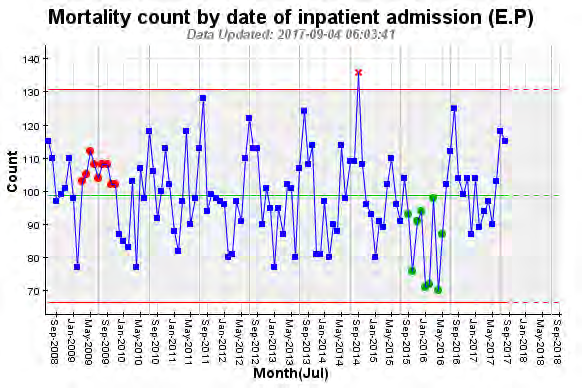
Performance against KPI
Mortality KPIs have been closely monitored over time.
Canterbury DHB Benefits Realisation Update – September 2017
24
Rate of all-cause mortality under 65 (age-standardised) demonstrates Canterbury Maori are better off than
Maori in other parts of New Zealand while non-Maori have similar rates.
National All-cause Mortality
350
300
250
200
150
100
50
0
2007
2008
2009
2010
2011
2012
SI Maori
NZ Maori
SI Non-Maori
NZ Non-Maori
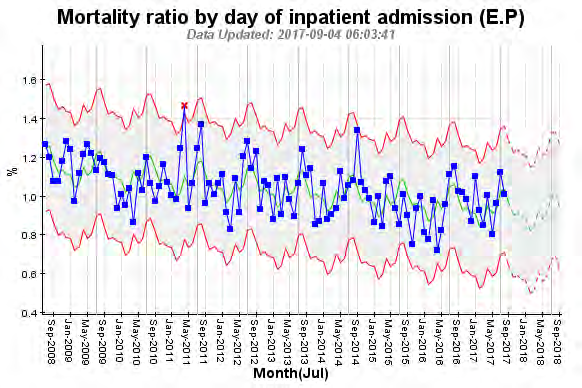
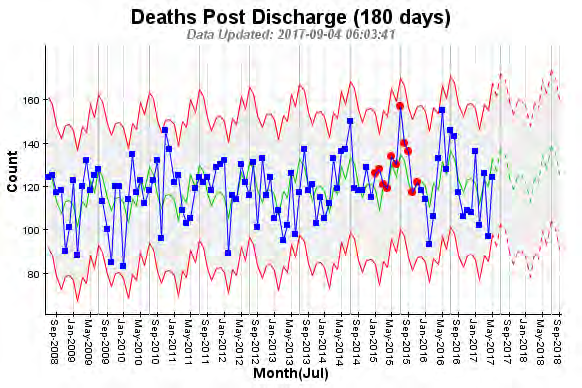
What does this mean?
The balancing metric of mortality is important to the Canterbury Health System due to the focus on
community care. The low acute medical admission rate means there is a concentration of acuity in our
hospitals as only those who require hospital level care are admitted and those less complex patients remain in
the community. To date hospital mortality measures do not reflect unintended effects despite greater risk and
increased complexity.
Canterbury DHB Benefits Realisation Update – September 2017
25
Monitoring community mortality will also provide warning signs as we push the boundaries of what can be
treated in the community.
Canterbury DHB Benefits Realisation Update – September 2017
26
Document Outline