 N E W Z E A L A N D
WHY INVEST IN NEW ZEALAND’S HOTEL SECTOR?
1 DEMAND
N E W Z E A L A N D
WHY INVEST IN NEW ZEALAND’S HOTEL SECTOR?
1 DEMAND First-rate demand drivers combined with superb
international connectivity have fuel ed a boom in high-value
international visitation.
2 INFRASTRUCTURE New Zealand’s world-class transport
infrastructure and regional diversity provide clear tourism routes
and a captive market for hotel investment.
OPEN
3 GROWTH Hotels in New Zealand are experiencing record
operating performance and strong growth in ADR, RevPAR
for Investment in New Hotels
and occupancy rates.
4 DEVELOPMENT Additional hotel development is required to
maintain a sustainable balance between demand and supply –
and delivery of projects is critical in Auckland.
IMAGE — Aoraki / Mount Cook, Southern Alps
Why invest in New Zealand’s hotel sector?
1 DEMAND
First-rate demand drivers combined with superb
international connectivity have fuelled a boom in
high-value international visitation.
The New Zealand tourism sector is in its strongest-
China is also set to surpass Australia by 2024 as New Zealand’s
Holidays and ‘Visiting Friends and Relatives’
At present, 48 percent of all capital invested in New Zealand
ever growth cycle, driven by an extraordinary boost in
largest visitor market by spend. A key factor driving this shift is
are the prime purposes for visiting New Zealand
hotels is of international origin. The majority is from Singapore
international visitors. Visitor arrivals to New Zealand
a strong trend towards the Free and Independent Traveller
(28%), followed by Hong Kong (12%) and Australia (4%).
FIT travellers represent a strong and growing New Zealand
achieved a record 3.7 million in 2017, representing a
(FIT) segment, and away from tours and groups.
visitor segment, which is boosted by the increasing adoption
52 percent increase from 2009 and continuing to
FIGURE 4
exceed official forecasts.
In August 2017, FIT visitors accounted for approximately
of a more independent travel style by Chinese and other
Share of ownership in New Zealand hotels
75 percent of all visitor visas issued to Chinese visitors to
international visitors. FIT visitors typically spend more money
by room count as at June 2018
The Ministry of Business, Innovation, and Employment
New Zealand, a significant increase from 40 percent in August
than other visitor types, leading to higher hotel room rates.
(MBIE) predicts this exceptional growth in international
2013. The Chinese FIT segment is highly lucrative, as these
visitors to continue. MBIE’s most recent forecasts suggest
FIGURE 3
visitors typically stay longer and spend more money relative
New Zealand
52%
international visitor arrivals will total 5.1 million annually
Share of international visitor arrivals in
to other visitor types.
Australia
by 2024, representing seven-year growth of 38 percent and
New Zealand by purpose of visit
4%
Singapore
28%
1.4 million visitors.
FIGURE 2
2018
2018
Hong Kong
12%
In 2018, New Zealand topped the World Bank's list of best
Share of international visitor arrivals
China
3%
countries to start and run a business, and was ranked the fifth
in New Zealand by market
Japan
0%
Holiday
52%
best country to visit in the Lonely Planet Best In Travel list.
Other
1%
Australia
39%
2017
VFR
29%
Business
8%
Australian and Chinese holidaymakers are leading the
China
11%
Other
influx of international visitors
11%
Source: Colliers
Japan
3%
Australia and China are New Zealand’s largest international
Korea
Occupancy rates in Auckland rank with the best in the
2%
visitor markets, contributing half of all international visitors in
2017
Asia Pacific
US
9%
2017. Visitor arrival growth projections to 2025 place China's
UK
7%
A surge in international visitors to New Zealand has helped
growth firmly ahead of all other markets. Annual Chinese
Germany
3%
make Auckland one of the strongest-performing markets in the
visitor arrivals are expected to increase 107 percent from
Other
26%
Asia Pacific region. Hotel occupancy rates in Auckland and
418,000 in 2017 to 866,000 by 2025.
Holiday
55%
Queenstown are on par with the likes of Sydney and Melbourne,
VFR
28%
which are experiencing similar patterns of tourism growth to
FIGURE 1
2025
Business
7%
New Zealand.
International visitor arrivals to New Zealand
Australia
35%
Other
10%
China
16%
FIGURE 5
6
Japan
3%
Hotel occupancy in major Asia Pacific markets
Korea
2%
as at July 2018
5
2025
millions
US
10%
Source: Statistics New Zealand, MBIE visitor arrival forecasts, Fresh Info
4
UK
6%
86%
82%
85%
83%
82%
89%
Germany
3%
3
Other
25%
Low hotel transaction activity makes new build and
Auckland Osaka Hong Kong Sydney Melbourne Singapore
construction a more likely path to market entry
2
Source: Statistics New Zealand, MBIE visitor arrival forecasts, Fresh Info
Source: CBRE, TIA
There have been few major hotel transactions in the last
two years – a testament to strong KPIs across the industry
1
which are encouraging owners to hold onto their assets.
Visitor arrivals to New Zealand,
As such, development in the form of new build and
0
3
5
construction projects is likely to be the preferred option
2008
2009
2010
2011
2012
201
2014
2015
2016
2017
2018
2019
2020
2021
2022
2023
2024
202
for future market entry.
Source: Statistics New Zealand, MBIE visitor arrival forecasts, Fresh Info
4 | Hotel Investment In New Zealand
Hotel Investment In New Zealand | 5


2
World-class transport infrastructure
INFRASTRUCTURE
New Zealand’s transport infrastructure offers excellent connectivity between all of the country’s major visitor hubs,
and to the rest of the world. Key infrastructure includes:
New Zealand’s world-class transport infrastructure and regional diversity
provide clear tourism routes and a captive market for hotel investment.
5 international airports, 30 regional
The highest ratio of road
17 seaports,
4,000
Underserved demand
with 33 international
airports, offering
per capita in the world,
allowing for
kilometres
carriers and 46 direct
direct and efficient
with 11,000 kilometres of
significant growth of rail track
flight routes, serving
access around
state highways and 80,000 in the cruise line
Underserved demand percentages reflect the percentage
Reasons for this include acceptable price, acceptable routing,
major overseas markets
the country
kilometres of local roads
sector
of total market demand potential that is unmet, as travellers
convenient travel time, and airline preference. Auckland
who want to fly between these international cities and
International Airport Limited (AIAL) uses sophisticated
New Zealand cannot secure an airline seat.
network modelling capabilities to determine these figures.
Tourism is supported by New Zealand’s
regional diversity and interlinked routes
Underserved demand for travel to New Zealand
New Zealand’s impressive regional diversity and compact size
with clear infrastructure routes make tourism flows more
UK Germany Hong Kong China South Korea Japan Taiwan Canada
USA
predictable. This presents an opportunity to invest in
established tourism routes such as Auckland, Rotorua, Taupō,
37% 42% 15% 36% 48% 26% 24% 33% 33%
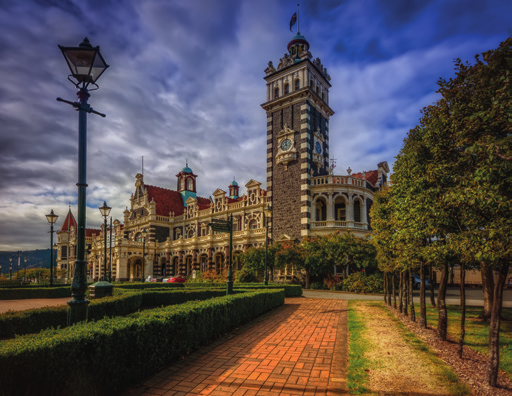
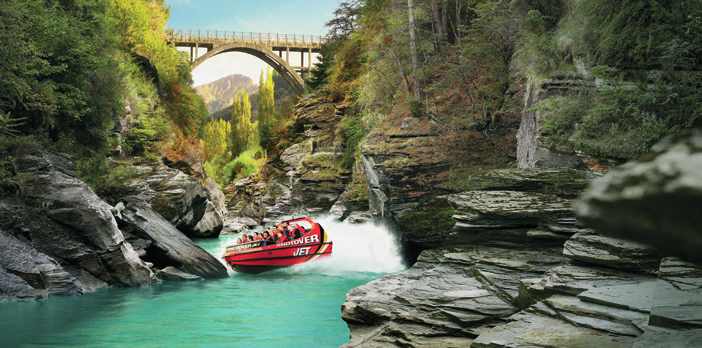
Wellington, Christchurch, Queenstown, and Dunedin.
All international visitor arrivals by plane enter New Zealand
AUCKLAND
through airports servicing these destinations.
New Zealand’s largest and
most multi-cultural gateway city
in a magnificent seaside setting
TAUPŌ
Nature’s ultimate playground
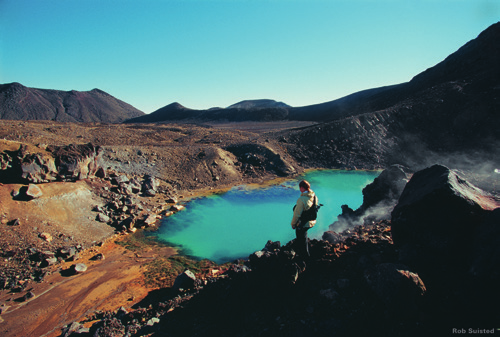
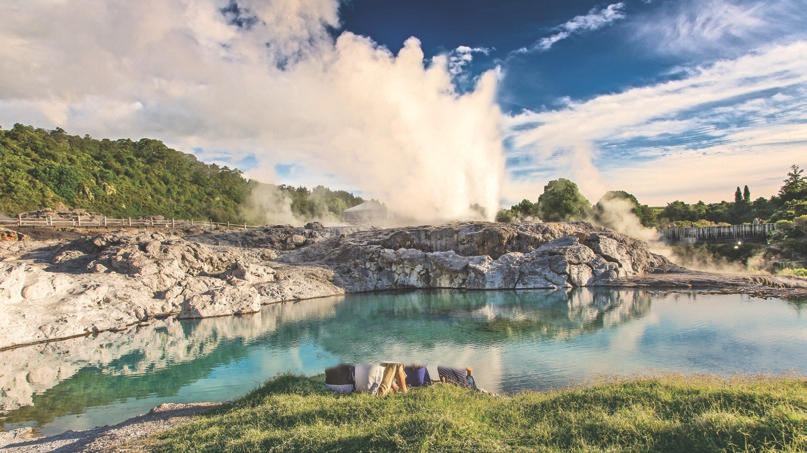
ROTORUA
and ski resort destination
Geothermal natural hot springs
town and centre of indigenous
Māori culture
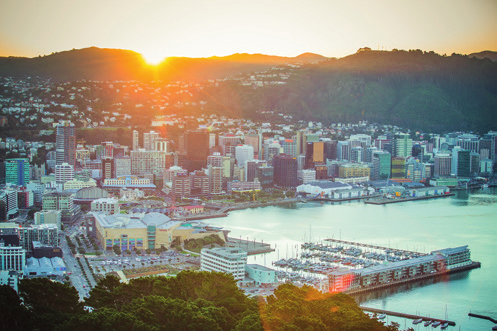
WELLINGTON
Capital of New Zealand and
CHRISTCHURCH
celebrated art, cultural and
creative hub
Rapidly re-emerging gateway
to the South Island
QUEENSTOWN
DUNEDIN
32%
29% 39% 25% 24% 42% 35% 38% 38%
The Southern Hemisphere’s
India
Singapore
Indonesia
Australia
New Zealand Philippines
Chile Argentina Brazil
premier four-season resort
A region of unique landscapes
Domestic
destination
and fascinating cultural history
6 | Hotel Investment In New Zealand
Hotel Investment In New Zealand | 7
