
45 Pipitea Street
Wellington
24 April 2026
Phone 0800 25 78 87
dia.govt.nz
Joshua Riley
[FYI request #34241 email]
Tēnā koe Joshua
Your Official Information Act request, reference OIA 2526-1024
Thank you for your email of 25 March 2026 to the Department of Internal Affairs (Department)
requesting the following information under the Official Information Act 1982 (the Act):
“My request relates to the report titled "Vulnerable Communities Exposed to
Flood Hazard," dated August 2022 and proactively released by the DIA in
October 2022. Specifically, I am seeking the underlying data, modeling, and
communications used to establish the boundary and classification of the
Hokianga Harbour / Hokianga Region as a vulnerable community exposed to
flood hazard (as listed in Table 1 and Figure 1 of the report).
I am requesting the following specific information referenced in the report's
methodology (Section 4):
1. NIWA Composite Data (Section 4.7): Al specific surface-river flood hazard
data and coastal flood hazard data (including the +1.2m sea level rise scenario)
that NIWA provided to the DIA or its contractors for the Hokianga area.
2. Qualitative "Mural Board" Data (Section 4.8): Copies of the specific notes,
comments, and mapping pins that Regional Council River Managers and
Tonkin+Taylor flood practitioners placed on the online 'Mural Board' map
regarding the Hokianga Harbour area.
3. GIS/Riskscape Outputs (Section 4.9 & 4.10): The ARCGIS map layers,
shapefiles, or Riskscape outputs that show exactly how the hazard data was
overlaid with the NZDep 2018 SA1 unit data to establish the specific geographic
boundaries of the "vulnerable community" in Hokianga.
4. Historical Validation (Section 4.11): Any specific records from the Historical
Weather Events Catalogue (NIWA) or Radio New Zealand archives that were
used to validate the flood hazard exposure specifically for the Hokianga area.
If this information is held in digital mapping formats (such as GIS shapefiles or
KML/KMZ files), I would prefer to receive it in those original formats alongside
any standard PDF reports.”
Response to the request
Question 1.
In response to question 1, it is noted by the Department, that NIWA provided surface river
flood and coastal flood modelling to Tonkin and Taylor to feed into their summary report. This
report is titled
Review of Vulnerable Communities Exposed to Flood Hazard in New Zealand.
This is attached as
Appendix A.

Te Tari Taiwhenua
Department of Internal Affairs
Please note the limitations and assumptions set out in pages 11-14 of the Tonkin and Taylor
report as you read it. Some of the critical limitation about the report includes that:
• the report was a snapshot in time;
• the report was carried out in a short timeframe and requires further checks with
stakeholders for accuracy;
• severity of flood hazard at dif erent locations is not known; and
• urban flood hazard has not been investigated at the property level.
With regards to your question, we also refer you to NIWA’s
Coastal Flood Layers Viewer
linked here:
https:/ niwa.maps.arcgis.com/apps/instant/slider/index.html?appid=842bf7ef81cf4faaa1d5b0c3
013c733f.
This model shows a map of New Zealand Aotearoa, allowing you to navigate anywhere on the
map and view sea level rise scenarios of up to 200cm. Information on functions, data and
references are found by clicking the icons on the right-hand side of the map.
Specific information on the data used by NIWA to inform the Tonkin and Taylor report, and
subsequently the Department’s report
Vulnerable Communities Exposed to Flood Hazard,
dated August 2022, may be obtained by contacting NIWA directly.
Question 2.
A link to the
Mural Board is found on page 4 of the Tonkin and Taylor report attached as
Appendix A. You can enter the
Mural Board by logging in as a visitor.
Question 3.
We refer you to NIWA’s
Coastal Flood Layers Viewer, in response to question 1 and NIWA’s
RiskScape website linked here:
https://www.riskscape.org.nz/.
Question 4.
Links to access records from the
Historical Weather Events Catalogue (NIWA) or
Radio New
Zealand archives can be found on page 11 of the Tonkin and Taylor report attached as
Appendix A.
Accessing the Ombudsman
You have the right to seek an investigation and review by the Ombudsman of this decision.
Information about how to make a complaint is available at
https://www.ombudsman.parliament.nz or freephone 0800 802 602.
Nāku noa, nā
Jade Badcock
Manager, Ministerial Services
Water Services Reform Programme
Appendix A
Review of vulnerable communities exposed to a flood hazard in
New Zealand
Executive Summary
This report, prepared for the Department of Internal Affairs (DIA), provides maps showing vulnerable
communities exposed to a flood hazard (names and locations only). This information forms part of a
response to Community Resilience Minister’s question around “
How many other ‘Westports’ are
there in New Zealand?”.
Ministers were interested to find out how many communities suffer from
both a high level of socio-
economic vulnerability and exposure to a high1 flood hazard in New Zealand, as Westport does?
In response to a tight deadline the analysis was conducted using the knowledge of flood experts
from across New Zealand, including technical experts from Tonkin & Taylor Ltd (T+T) and the River
Managers Group2. Supplementing this was an analysis completed by the National Institute of Water
and Atmospheric research (NIWA).
NIWA was engaged to use their existing composite flood hazard map of New Zealand3, which
consists of existing fluvial and pluvial flood hazard maps produced by various regional and local
councils, and coastal flooding data maps. As detailed in this report, this dataset combines historical
flood maps with modelled flood maps of a wide range of average recurrence intervals (ARIs) – i.e.
from 10 to 500-year ARI, and some flood extents of unknown ARI. The dataset was compiled in 2018
from available flood data and does not include more recent flood modelling information produced
around New Zealand. The mapping layer does not contain any information as to the severity of the
hazard (i.e. depth, speed or duration of flooding). The composite flood hazard map was intersected
with the NZDEP2018 data which is an indication of the socio-economic status of communities in
each ‘NZ Stats Area 1’ (available at
: EHINZ)4. The dataset classifies communities by socio-economic
status into 10 deciles (10% increments) based on nine census variables. NZDEP2018 Decile 10
represents areas with the highest socio-economic needs and was adopted by the DIA for the
purposes of this study as representing those communities who are likely to be worst affected by any
flood event, all else being equal. For the purposes of this study, these are referred to as “vulnerable”
under the Official Information Act 1982
communities, though we note that this term often has a more broad definition with respect to
flooding. This first-pass screening approach from NIWA provided useful corroboration and a basis for
refinement of the analysis completed by flood experts.
Due to the limitations and assumptions of the adopted approach it is certain that
there will be some
vulnerable communities missing from the maps provided in this report and communities included
that may not be exposed to a high flood hazard. Whilst not providing a comprehensive list of
Released
vulnerable communities exposed to a flood hazard, what the work does do is provide a sense of the
1 Due to insufficient data being available at a national scale on the severity of exposure to flood hazards (in a consistent
manner), it was not possible to define if communities were exposed to a ‘high’, ‘moderate’ or ‘low’ flood exposure from
the NIWA analysis. Flood experts were asked where communities had a high exposure to flooding.
2 The River Managers Group consists of the lead flood managers from each regional council in New Zealand
3 Paulik, R., Collins, D., and Craig, H. (2019). New Zealand Fluvial and Pluvial Flood Exposure. Accessed
at: (PDF) New
Zealand Fluvial and Pluvial Flood Exposure (researchgate.net)
4 Environmental Health Intelligence New Zealand (2018). Accessed via website. Visi
t: EHINZ
1
link to page 20
scale of this kind of exposure across the country and identify key areas for further work (see
recommendations in Section 4).
Communities with a
population of 505 or more that sit both within a floodplain as defined within the
composite flood hazard maps and score
10 on the NZDEP2018 Decile (i.e. vulnerable communities)
were flagged as the communities exposed to a flood hazard in response to the Ministers’ question.
A key limitation with the NIWA analysis is that the individual maps that are included within the
composite national data set each use different methods, thresholds and climate change allowances
across the country (i.e. for the most part each council uses different methods and parameters to
develop their flood hazard maps). There is not a single consistent flood hazard data set for New
Zealand. This is currently being developed by NIWA through their project:
Mā te haumaru ō nga
puna wai ō Rākaihautū ka ora mo ake tonu: Increasing flood resilience across Aotearoa
Without time to subject each council’s flood hazard data set to analysis or quality assure (QA) the
metadata used within the NIWA analysis, the approach is considered rudimentary and likely leading
to wrong identification/non-identification of communities in places. The approach extracted the
floodplain extents and captured any communities that are located within the footprint of a 100-year
floodplain from the composite flood hazard map. The average recurrence interval (ARI) interval
footprint of the floodplain will vary across the regions, further constraining outputs, and it is noted
that overland flow paths can often exist outside of the extent of identified/mapped floodplains
meaning that they would not be identified in the NIWA analysis. Effectively, communities are either
‘in’ or ‘out’ of the floodplain (sometimes referred to as flood prone areas). There are significant
limitations with this which are detailed in this report. The socio-economic data was then overlaid to
see where NZDEP2018 Decile 10 communities were located within floodplain footprints.
Comments from technical experts from around the country were supplemented by this NIWA data
to identify overlaps, gaps, or inconsistencies with the NIWA analysis.
The main output from this work are
indicative maps of socio-economically vulnerable communities
that, based on available information, are likely to be exposed to a flood hazard.
To confirm the exposure to a flood hazard of locations identified in this report site specific analysis
would need to be completed. This report is designed to give an overview of the scale of flood
exposure for socio-economically vulnerable communities in New Zealand, and as a preliminary
under the Official Information Act 1982
investigation to a first phase of work. Recommendations are provided in Sectio
n 4 for next steps.
This report is structured in four parts:
1
Methodology
2
Limitations and Assumptions
3
Maps of communities identified through the analysis
Released
4
Recommendations
5 Community was defined during discussion with DIA and T+T as being a population of over 50 people as it represented a
small settlement. Defining communities at a lower population number would have brought up many more locations in the
analysis. Ministers were interested in getting an understanding of the scale of the problem so looking at where larger
vulnerable populations might be concentrated necessitated a minimum population cut-off for defining ‘community’.
2
Applicability
This report has been prepared for the exclusive use of our client the Department of Internal Affairs
for them to report back to Community Resilience Ministers.
under the Official Information Act 1982
Released
3
link to page 7 link to page 18 link to page 8 link to page 9
1
Methodology
The analysis primarily relied on observations and comments from technical experts, canvassed
through the use of an online mural board.
A secondary source of information was provided by NIWA, who developed a methodology for
combining existing flood hazard mapping with socio-economic vulnerability mapping to identify
communities likely to be both subject to flood hazard and high socio-economic vulnerability.
The outputs from the NIWA analysis were then used to sense check against the information
provided by flood experts. This section provides an overview of the approach taken to generate each
data set. Limitations and assumptions of this approach are then set out in the subsequent section.
1.1
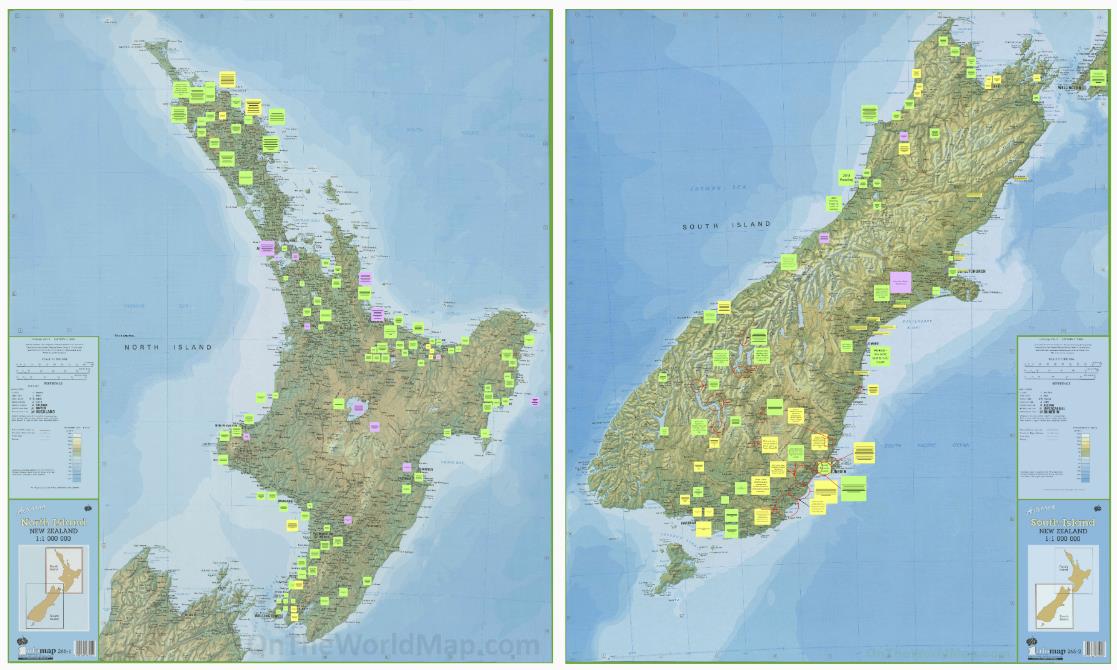
Observations/comments from flood practitioners (Mural Board)
A qualitative task was completed to draw on the expertise of flood practitioners from around the
country as to their knowledge of communities exposed to flooding. To access this knowledge a
mural
board was shared with flood experts from T+T and the River Managers Group. Both groups were
asked to identify where socio-economically vulnerable communities were believed to be exposed to
high coastal, fluvial, and/or pluvial flood hazard (though noting that flood hazard experts are not
likely to also be experts on socio-economic data sets). Information was also received via email and
added to the mural board. The results of this exercise are presented in
Figure 1.
A limitation with this qualitative form of analysis is that experts had extensive knowledge of flood
hazards but relatively less knowledge of socio-economic data. As a result, a number of locations
which do not suffer from a high level of socio-economic vulnerability were flagged through the
exercise. For example, locations such as Queenstown and Wanaka were noted on the mural board,
despite not having NZDEP2018 Decile 10 units identified within the towns. All qualitative results
were cross-checked against the NIWA analysis (see below) prior to their inclusion or exclusion from
of the maps provided in Sectio
n 3.
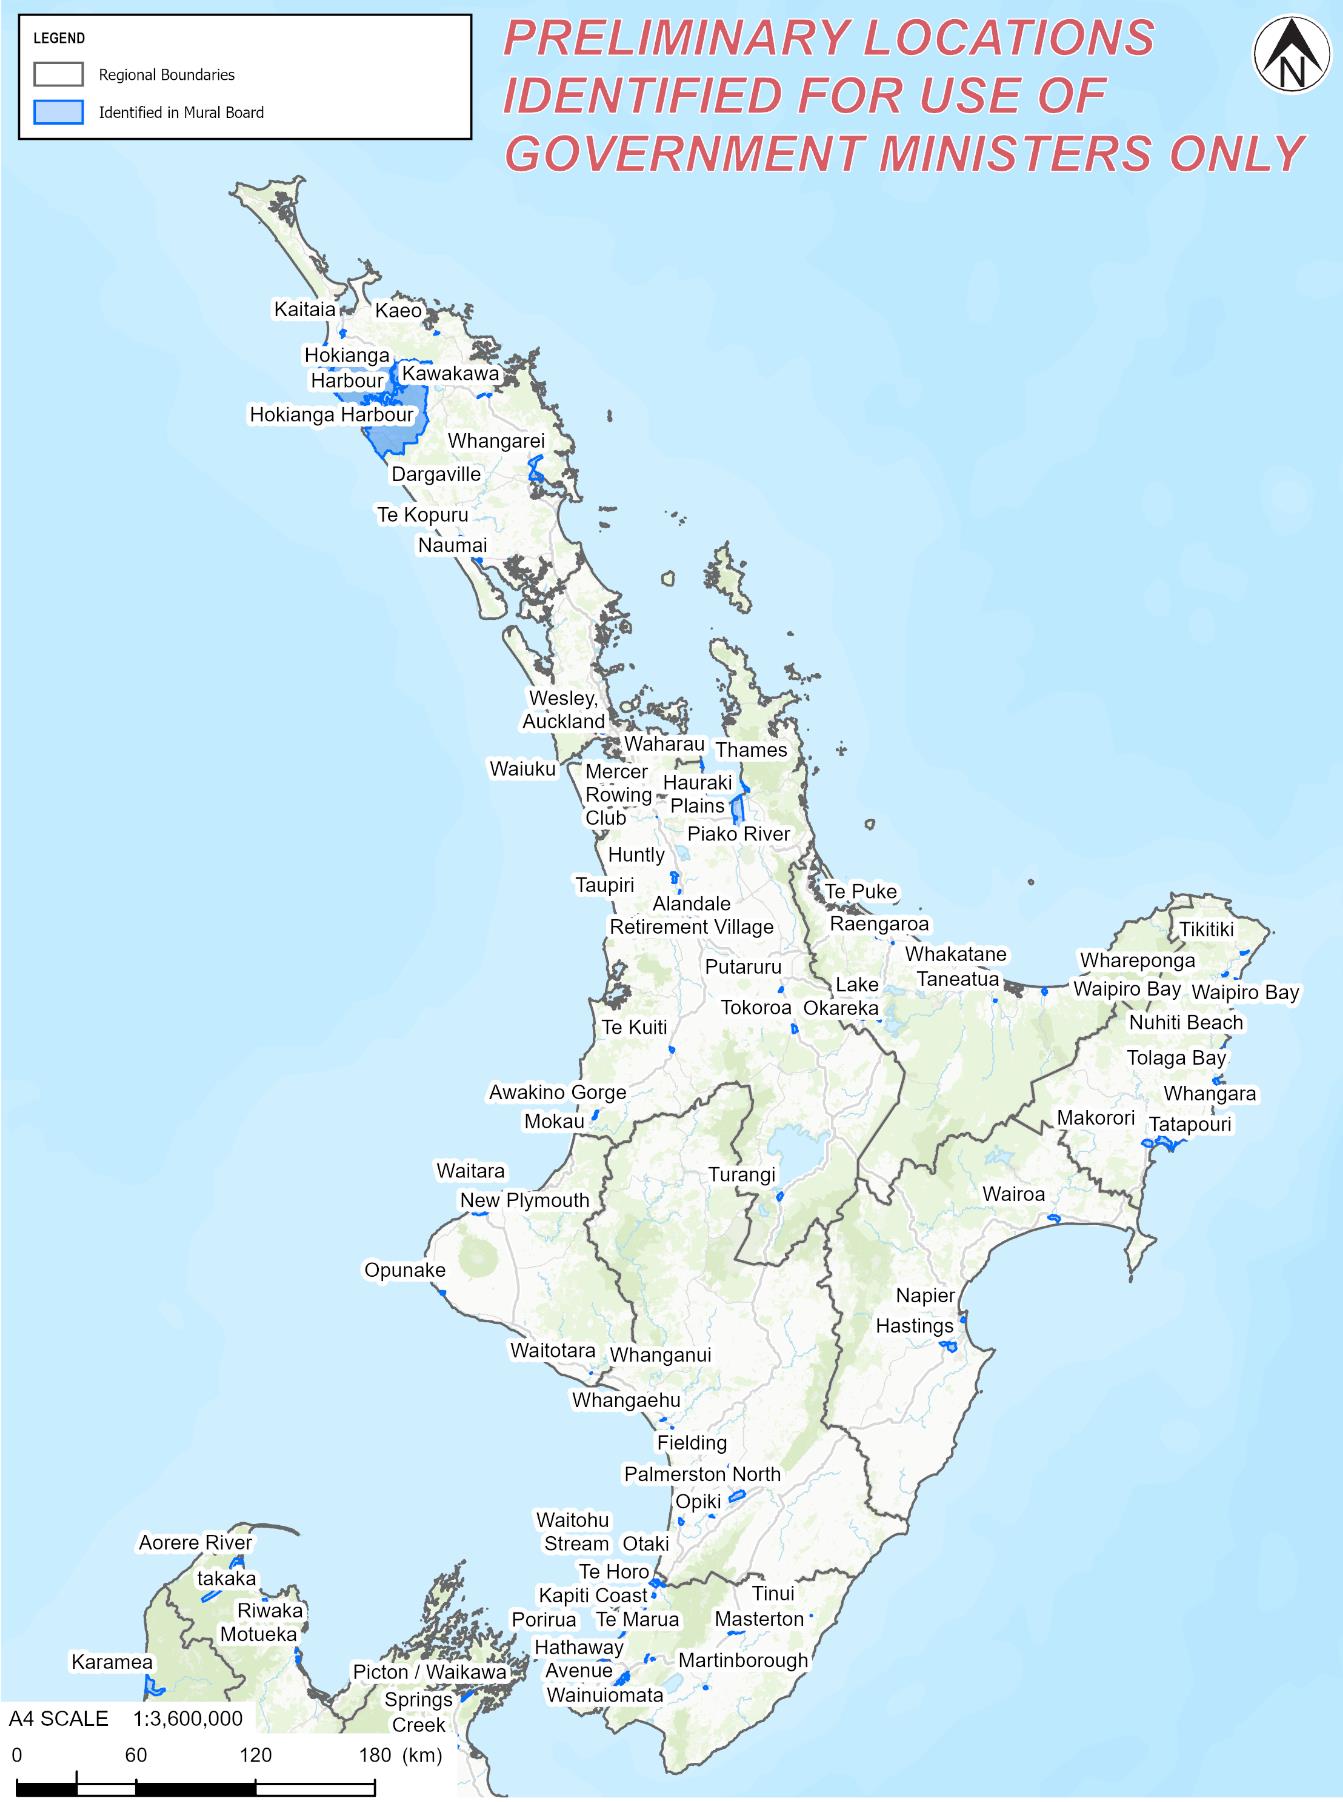
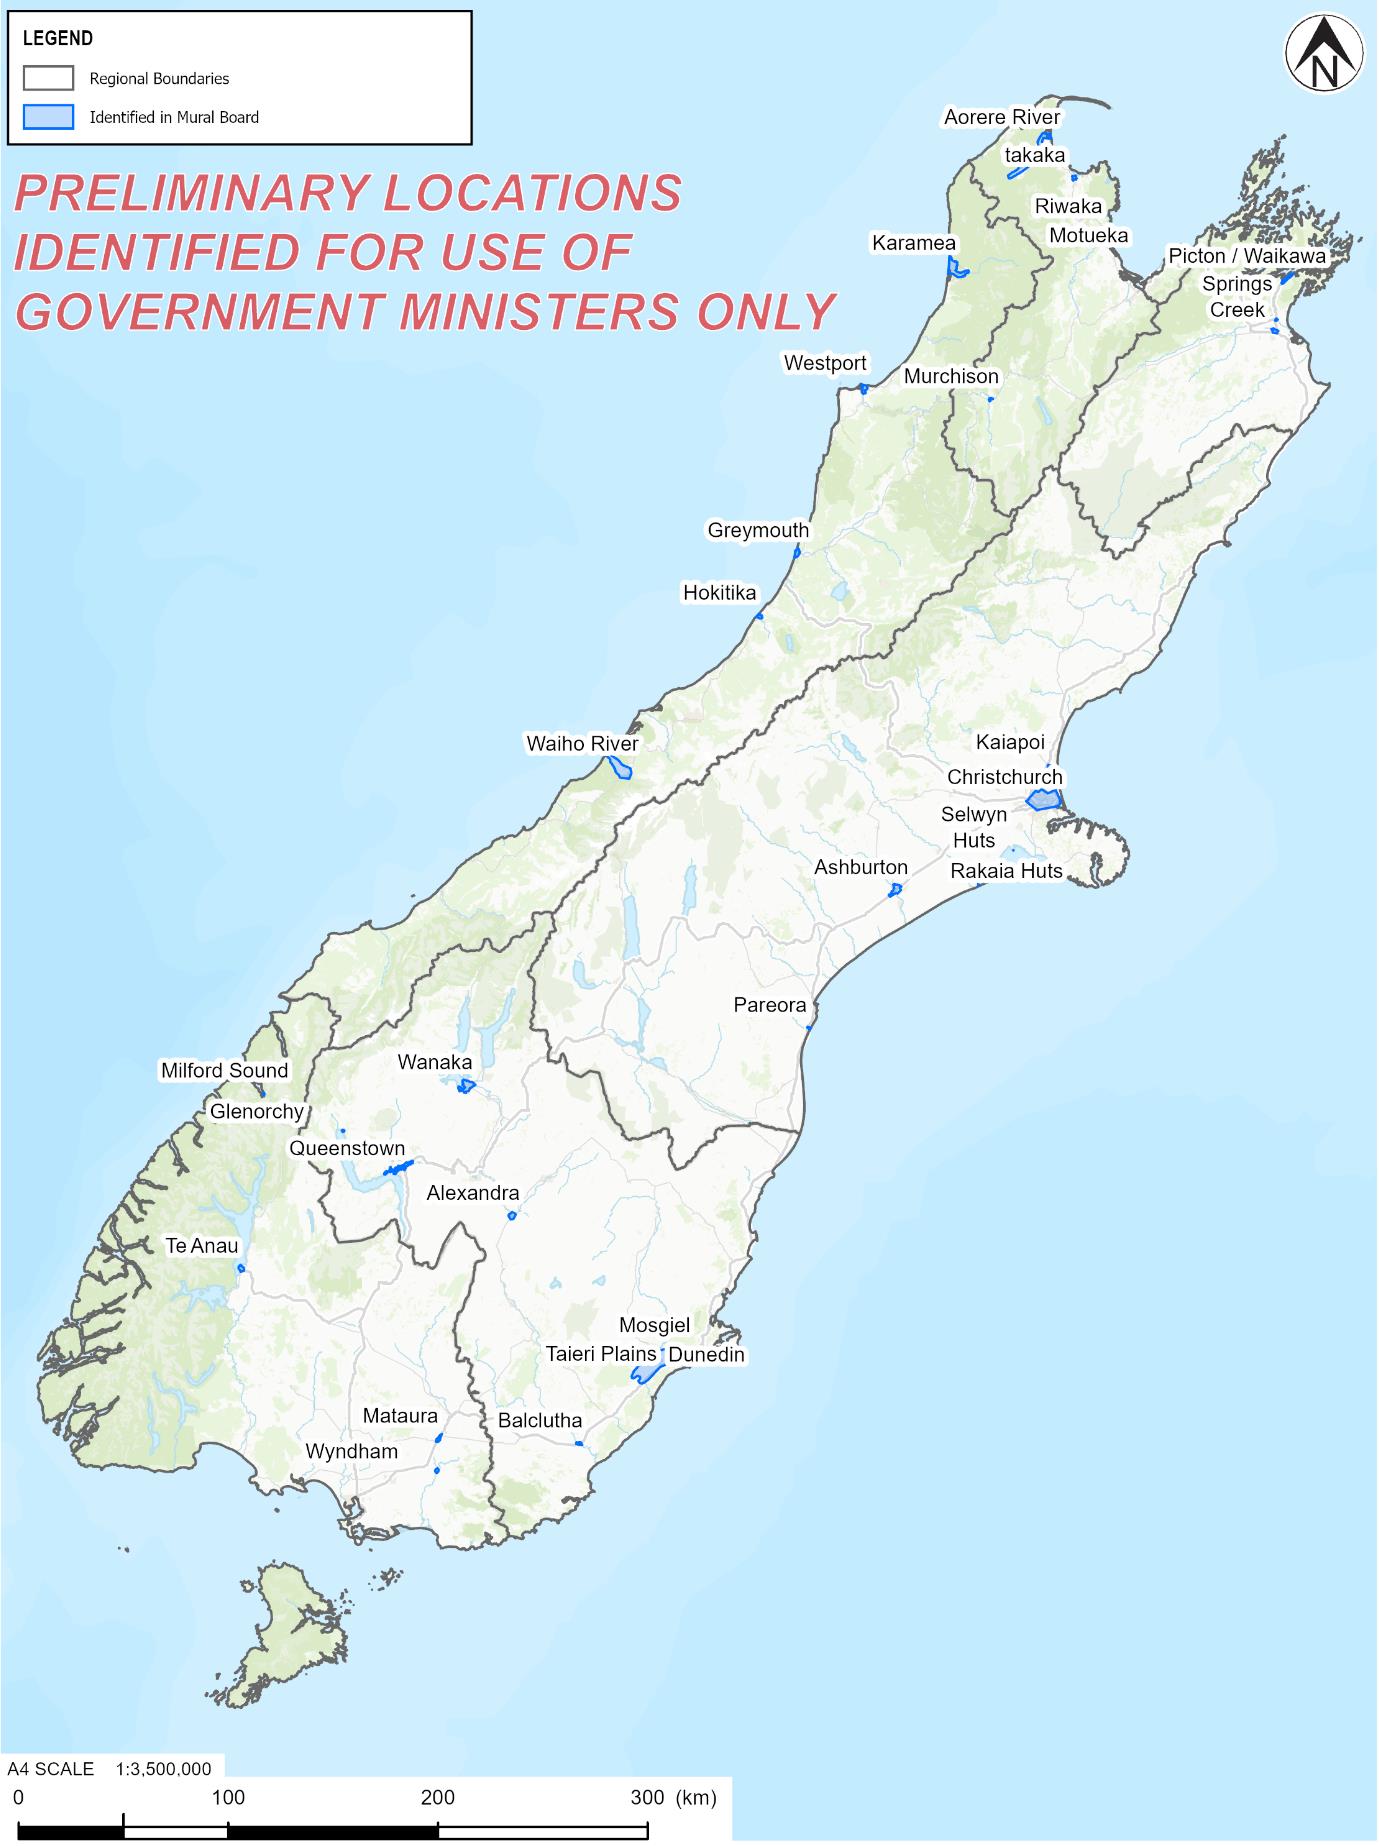
The results from the mural board were exported to a .csv file and then converted to .shp files. These
under the Official Information Act 1982
are presented in
Figure 2 (North Island) and
Figure 3 (South Island).
Released
4
under the Official Information Act 1982
Released
Figure 1: Final mural board with notes added by T+T specialists and the River Managers Group
5
under the Official Information Act 1982
Released
Figure 2: Map of the North Island showing areas identified by flood practitioners as having high flood hazard
and likely high socio-economic vulnerability.
6
under the Official Information Act 1982
Released
Figure 3: Map of the South Island showing areas identified by flood practitioners as having high flood hazard
and likely high socio-economic vulnerability.
7
link to page 14 link to page 11 link to page 12
1.2
NIWA Analysis
NIWA used their RiskScape tool to identify NZDep2018 Statistical Area 1 (SA1) unit boundaries that
intersect with floodplain areal extents derived from a national composite flood hazard data set
which was developed using their methodology below.
The first step was to prepare the national composite flood hazard data set which includes:
1)
A composite fluvial-pluvial flood hazard area map from public sources; and
2)
Coastal flood hazard area maps based on 100-year average recurrence interval (ARI) sea level
events for both the present-day scenario and including +1.2m sea level rise (SLR) (i.e. NZ
RCP8.5 H+ SLR projection for 2123, as adopted by NIWA)
NIWA’s metadata information on this dataset is provided
Appendix A. Following the preparation of
the ‘national composite flood hazard layer’ the NZDEP 2018 SA1 units were imported into RiskScape
and intersected with the composite flood hazard layer. Any SA1 units with a Decile score of 10 (i.e.
most vulnerable according to socio-economic metrics) that were located within a floodplain extent
were identified as socio-economically vulnerable communities potentially exposed to a flood hazard
and taken forward for further analysis.
Further to the above, an estimate of usually resident populations within SA1 units exposed to a flood
hazard was completed by NIWA to understand the proportion of the population flagged as being
exposed to a flood hazard. This was done using their recommended approach below:
• Broadly identifying what ‘objects’ from the Land Information New Zealand (LINZ) building
outlines dataset may represent a habitable building (i.e. assumed these are objects with an
outline area between 70m2 and 1000m2);
• Estimate the number and outline area of defined habitable buildings within SA1 units;
• Calculate a m2 population rate for SA1 units (i.e. outline area of defined habitable
buildings/usually resident population);
• Estimate the number and outline area of defined habitable buildings within SA1 units
exposed to fluvial, pluvial and/or coastal flooding; and
• Join the above information to SA1 units that had a NZDEP2018 Decile 10 score.
under the Official Information Act 1982
For the purposes of this analysis, a
community was defined as a location (i.e. small settlement,
town, city, but not the sum of isolated rural properties over a large area) with a population of
more than 50 people (as per DIA/T+T discussion and agreement).
It should be noted due to the method employed there is
low confidence in the population
estimates derived from the analysis above and population counts of exposure to flood hazard is not
provided in this report. This aligns with the scope which was to identify
locations only. Refer to
Released
Sectio
n 2 for further details about the limitations associated with the population estimates.
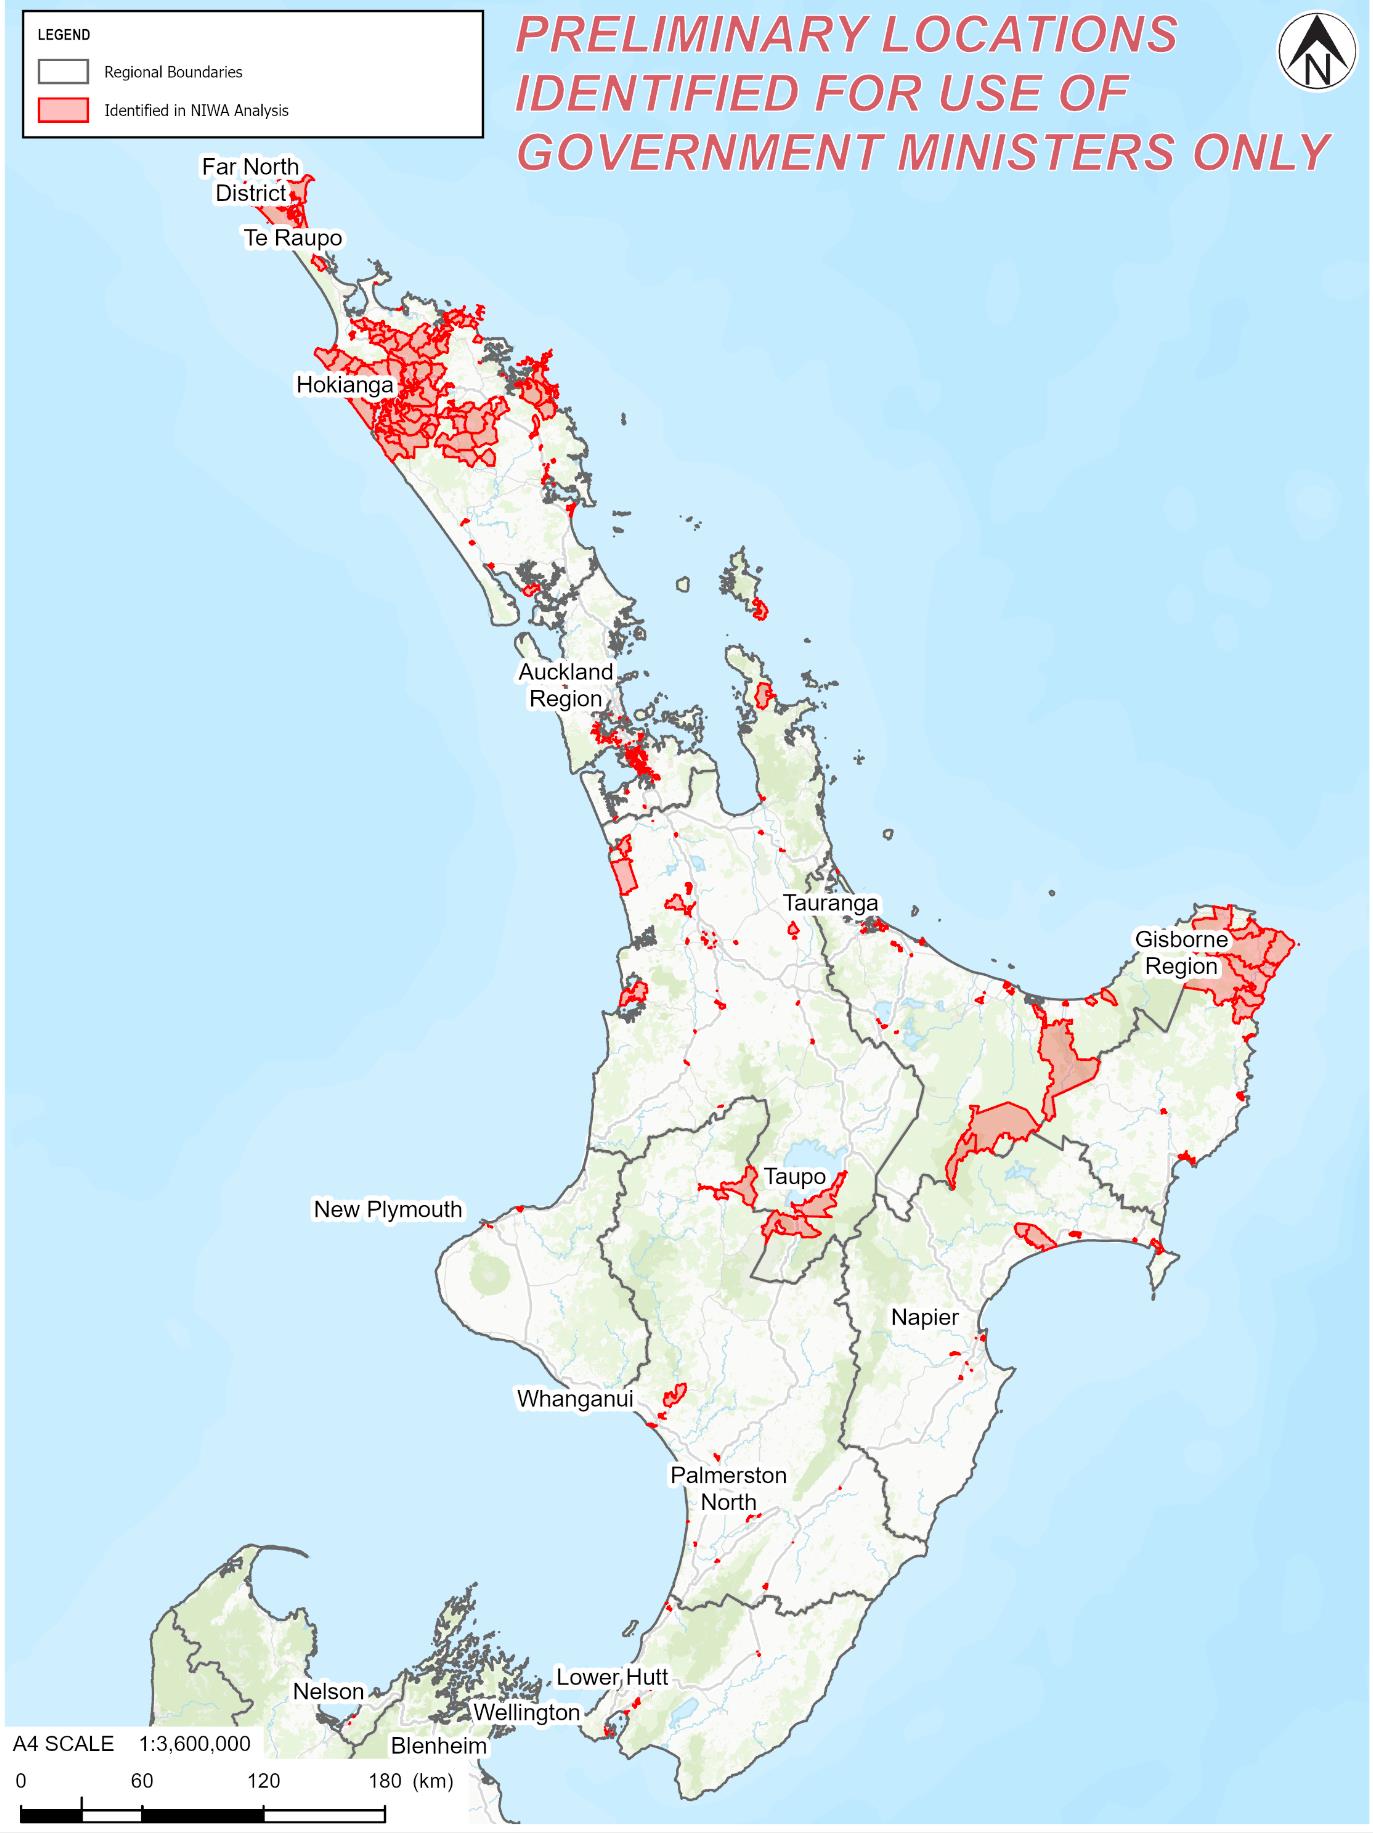
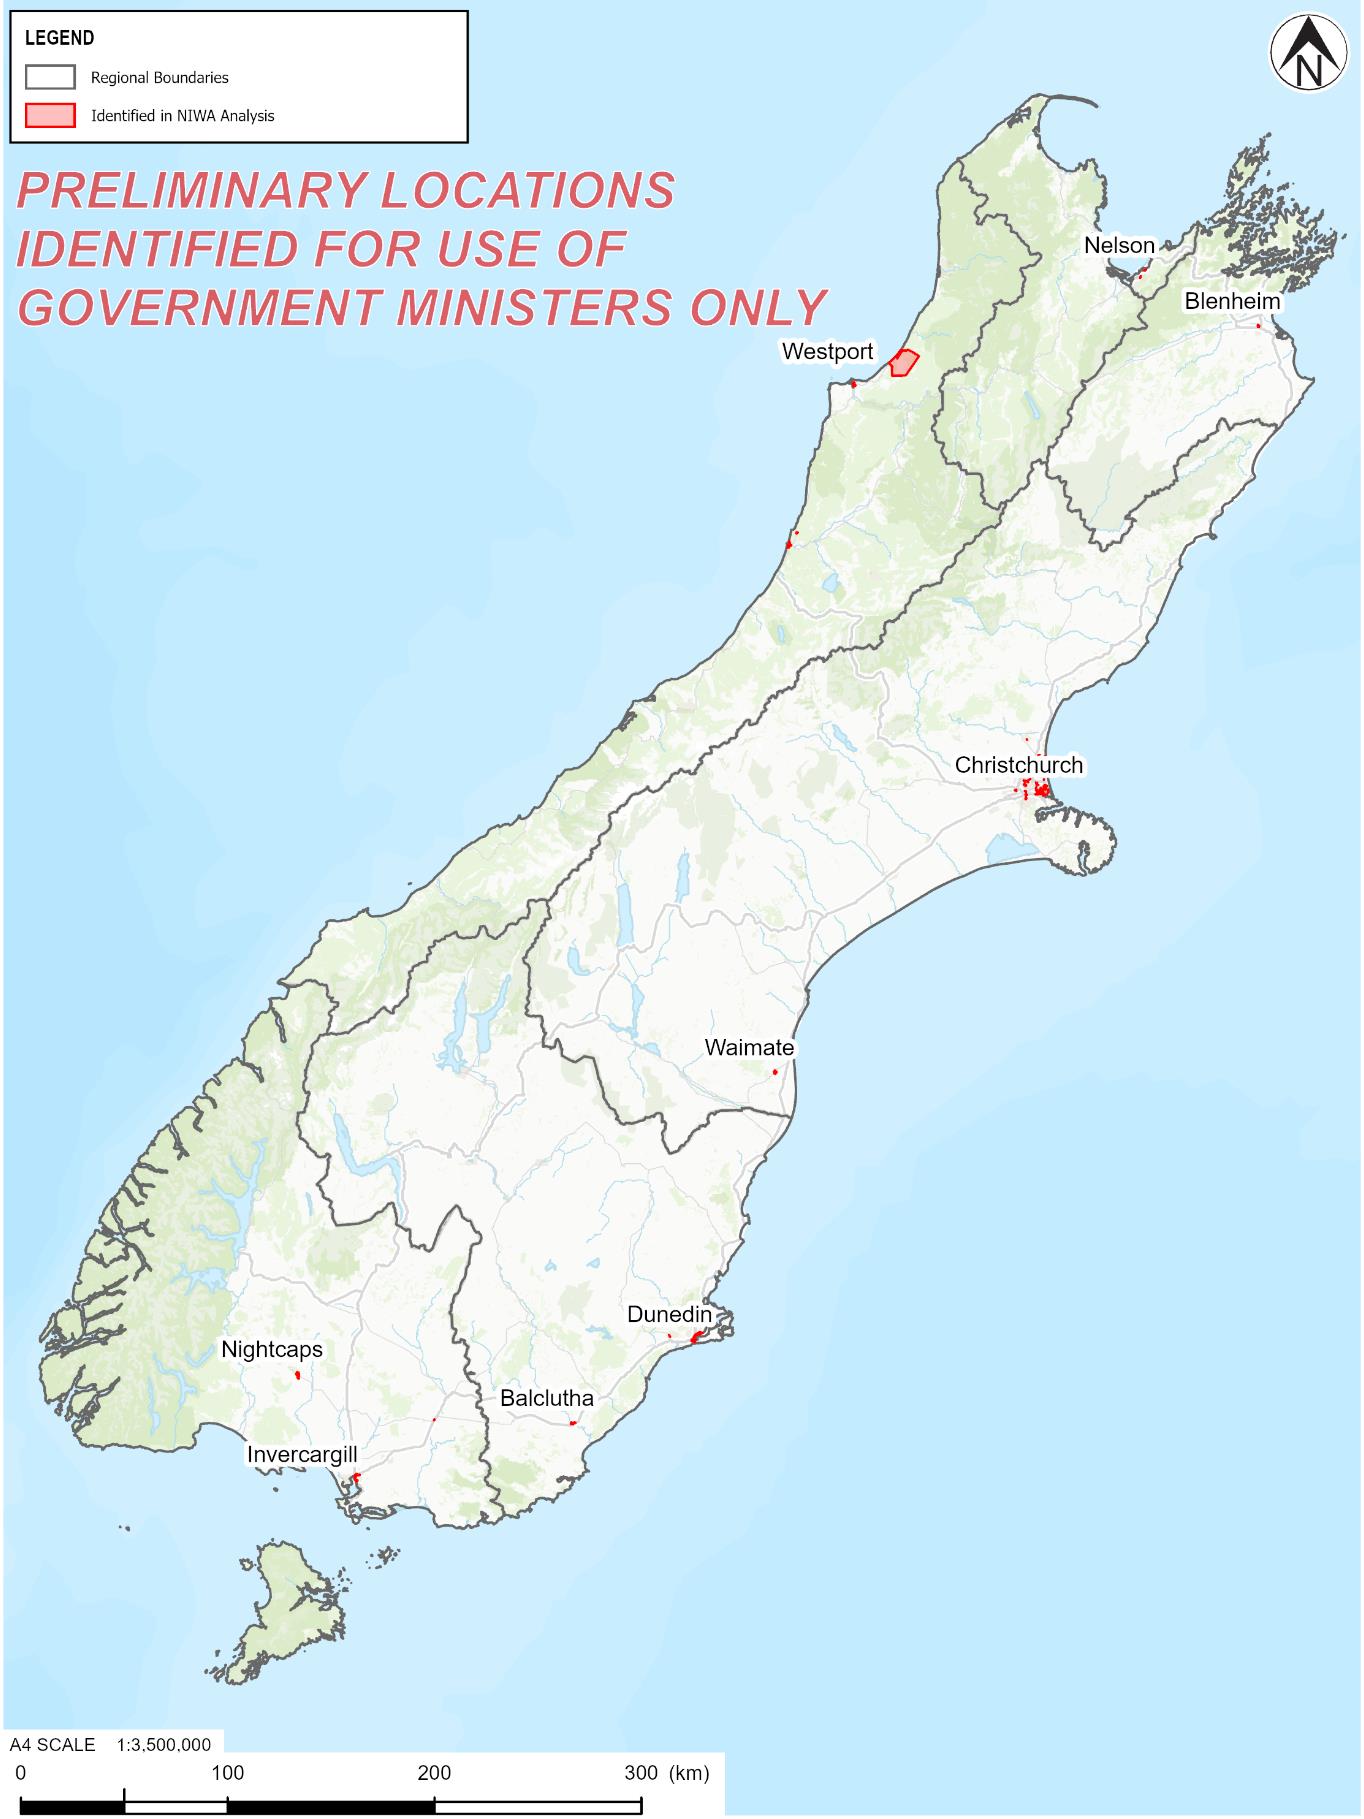
Following the processing of the datasets the RiskScape model was run, and outputs generated.
Outputs were reviewed by NIWA and provided in spatial (.shp) and tabular (.csv) formats. These are
presented
in Figure 4 (North Island) and
Figure 5 (South Island).
8
under the Official Information Act 1982
Released
Figure 4: Map of the North Island showing areas identified from the NIWA analysis as being exposed to flood
hazard and a high socio-economic vulnerability score (i.e. NZDEP2018 Decile 10)
9
under the Official Information Act 1982
Released
Figure 5: Map of the South Island showing areas identified from the NIWA analysis as being exposed to flood
hazard and high socio-economic vulnerability (i.e. NZDEP2018 Decile 10)
10
link to page 14 link to page 18 link to page 14 link to page 14
1.3
Combining the datasets
GIS layers were created from both the NIWA data and flood practitioner (Mural Board) data sets,
uploaded to ArcPro, and overlaid to identify areas where the two datasets intersected. These areas
were then reviewed against the
Historical Weather Events Catalogue (NIWA) and the new archive on
Radio New Zealand (RNZ) to review historical flood events for areas identified in the analysis. This
cross-check helped build confidence that the areas identified are exposed to a flood hazard. It
should be noted that schemes currently proposed, being implemented, or recently finished which
may reduce exposure to flood hazard were not captured as part of this screening – see the ‘flood
barriers assumed effective’ assumption in Sectio
n 2.
The intersected areas were confirmed and included in the maps presented in Sectio
n 3.
Further to the above locations, areas identified in the NIWA analysis but not flagged by comments
on the mural board were reviewed using the historical weather events catalogue and RNZ archive. If
it was clear the community identified had a population of more than 50 people (checked against
satellite imagery and census data), was identified within a Decile 10 unit in the NZDEP2018 data, and
had some history of flooding or were otherwise believed to be flood-prone (e.g. through past
modelling or assessment known to flood practitioners and/or included in NIWA’s composite flood
layer), the location was included in the final map. If the areas in the NIWA list did not have any
communities with a population of more than 50 people, then the area was removed from the final
maps. See ‘Defining Community’ assumption in Sectio
n 2.
A similar process was completed for the qualitative data that was not identified within the NIWA
data. Once completed any remaining locations were added to the final maps. As stated earlier, a
number of locations identified through the qualitative task were removed from the final maps as
they did not meet the socio-economic threshold.
It is noted that due to limitations with this approach (see Section
2), mainly associated with the tight
timeframe, the communities identified on the maps in Section 3 are not exhaustive. What the
approach does allow for is an
indicative view of locations around the country providing a rough
number of highly vulnerable communities that are exposed to a flood hazard. Although
acknowledged as not being a comprehensive list, what the work does is provide a sense of the scale
of this issue in New Zealand.
under the Official Information Act 1982
Released
11
link to page 10
2
Limitations and Assumptions
o
DEFINING COMMUNITY: Community is defined as a NZ Stats Area 1 (SA1) (or collection of
areas) with a population greater than 50 in 2018. Refer to Section
1.2 as to how the
population count was derived – it is noted that there is low confidence in the method used.
Adjacent areas in urban / built up areas were reviewed and included (i.e. an SA1 area of 25
adjacent to a SA1 area of 60 giving a total population of 85 for a single town would have
been included in the analysis). A way to refine this process would be to set a higher
population threshold and subject the selected areas to more detailed analysis. For example,
the population of Westport is approximately 4,500 whereas there are many communities
identified on the mural board that have a population of only a few hundred. Whilst this
approach could focus investigations, the risk is large regions that consist of multiple small
communities could be missed (see Hokianga / Smaller Communities limitation below).
o
DEFINING SOCIO-ECONOMIC VULNERABILITY: Communities included are those categorised
as Decile 10 communities within the NZDEP2018 Decile dataset (available
at EHINZ).
Communities with a lower score than 10 (or containing no Decile 10 units) have been
excluded from the analysis. It is noted that in future analysis the Decile threshold could be
broadened to incorporate more communities. Decile 10 locations are generally neighboured
by Decile 8 and 9 communities, however there were exceptions. An example of a community
that was excluded is Karamea on the West Coast of the South Island which is known to have
flooding issues and is Decile 9.
o
SNAPSHOT IN TIME: The information is based on a snapshot in time and is not likely to be
reflective of the current or future situations within the towns identified. For example, the
NZDEP2018 data is a snapshot of socio-economic data from 2018 and will not incorporate
economic changes to communities as a result of Covid-19 and subsequent impacts of high
inflation. The regional flood hazard maps compiled within the NIWA analysis have been
created at different times, meaning the timing of the NZDEP2018 data and flood hazard data
is unlikely to match in the majority (if not all) locations submitted to analysis.
o
FLOOD BARRIERS ASSUMED EFFECTIVE: The analysis does not account for the failure of
flood defences in most places (i.e. assumes defences operate effectively to their designed
under the Official Information Act 1982
level of service). See ‘Stopbank / Dam Failure’ for more information as some council data
incorporates flood defence breach modelling. It is also noted that in some areas of the
country flood schemes are in the process of being built so historical events may not be an
effective proxy for future hazard.
o
NO CLIMATE CHANGE EFFECTS INCLUDED FOR FLUIVAL AND PLUVIAL FLOODING
Released
(MOSTLY): The composite flood hazard maps used for this analysis incorporates present-day
pluvial and fluvial hazard for most locations (i.e. does not incorporate increased exposure to
pluvial and fluvial flood hazards due to climate change). This is due to the different
modelling work done by different councils. There are some exceptions such as the Auckland
Region and Nelson, which include climate change scenarios within their flood hazard maps.
As a result, mixed probabilities are represented within the NIWA data set. This is another
way that the data is inconsistent across the country and could have potentially resulted in
overstating or understating the floodplain extents in different locations. Refer NIWA’s
metadata information on the composite flood layer in
Appendix A for more information.
12
link to page 20 link to page 18
o
STOPBANK / DAM FAILURE: Council flood hazard maps may or may not represent the risk
from a breach or failure of a stopbank. This will be dependent on the modelling completed
for each region. For example, in some locations such as Lower Hutt there is flooding from
stopbank breach / overtopping. In other locations with residual flood risk (e.g. Napier City
from Tutaekuri River) this is not represented. Dam failure is also not captured within the
composite flood map.
o
BASED ON THE 100 YEAR ARI COASTAL FLOOD EVENT: The analysis is based on 100-year ARI
coastal flood hazard layers as a national dataset. Analysis of more frequent (e.g. 10-year or
20-year ARI) coastal flooding should be undertaken to understand which communities are
likely to be affected more frequently, but this is not included in this analysis.
o
VERTICAL LAND MOVEMENT AT THE COAST: The coastal flood hazard layers include an
allowance for climate change. This is represented by a 1.2m increase in sea levels above
present-day levels. The analysis doesn’t explicitly represent vertical land movement (i.e.
subsidence or uplift) which will vary around the coast and would alter the level of the land
relative to the sea level. The analysis is based on a total relative increase in coastal depths
(i.e. the combined net effect of sea level rise and vertical land movement). Some areas of
the coastline will experience a total relative increase of 1.2m sooner than others.
o
NO GROUNDWATER FLOODING: Flood hazard includes exposure to fluvial, pluvial, and
coastal flooding. It excludes groundwater flooding, but this is captured to a certain extent
within the antecedent conditions of the fluvial models (i.e. a high groundwater table / soil
saturation will result in more rapid flooding from fluvial sources). Groundwater flooding has
been subject to less modelling meaning the datasets are less complete relative to fluvial and
coastal flooding. There is a current NIWA project ‘Future Coast Aotearoa’ that is looking into
groundwater hazards from coastal flooding. It would be useful to examine this data set once
available.
o
EXISTING INEQUALITY: It is assumed that there is an existing inequality between the flood
hazard mapping available, in that those communities better able to fund flood hazard
mapping are likely to have more information available about exposure to flood hazards (i.e.
Auckland Council). Whereas regions with a smaller rating base are less able to define flood
hazard exposure and as a result there may be socio-economically vulnerable communities
under the Official Information Act 1982
missed from some of the regional council data sets.
o
FLOODPLAIN ‘IN OR OUT’: The flood maps used for this project only provide areal extents of
floodplains which show locations ‘in or out’ of flood hazard exposure zones – they do not
provide other hazard severity information, such as depth, velocity or duration. For example,
a community in a floodplain extent could be subject to flooding of 1.5m depth during the
100-year ARI event, but there is nothing distinguishing this exposure from another
Released
community in the same floodplain extent being exposed to 0.1m depth of flooding during
the same event.
The analysis is on the exposure of communities to flood hazard and does
not provide information as to the level of damages or consequences (I.e. risk to life) that
may result from this exposure. In reality, some flooding presents lower hazard or risk to
people and property. A key recommendation further detailed in Section
4 is that depth and
velocity information is reviewed for the locations identified in the maps in Section
3.
13
link to page 10 link to page 20 link to page 17
o
CAMPSITES EXLUDED: Due to the delineation of populated areas exposed to flood hazards
being based on buildings, the analysis does not account for individuals and/or communities
exposed to a flood hazard who reside in campground (I.e. in caravans).
o
BASED ON AVAILABLE DATA: The analysis is based on available flood hazard maps published
by councils. Flood hazard modelling/mapping is an ongoing process for most councils. We
are aware of councils who have recently updated their flood mapping but have not yet
published the maps. Please refer to the metadata provided by NIWA and included as
Appendix A for the versions of the flood hazard maps used for this study.
o
POPULATION ASSUMPTIONS: Due to the way the population was derived, it is possible that
some buildings such as woolsheds or other storage units were classified as ‘habitable’. Also
refer to the ‘CAMPSITES EXCLUDED’ limitation. This would also not account for seasonal
populations and temporarily occupied buildings such as baches. A manual check of areas
showed that there was a low level of confidence in the population estimates derived using
the methodology outlined in Sectio
n 1.2.
o
QUALITATIVE COMMENTS: Notes on the mural board are a form of qualitative analysis and
are subjective. For example, comments could provide an example of known flooding in a
certain location, but it may not capture flooding of all impacted areas (e.g. Mataura floods
2020 affected communities between Gore and Invercargill. However, only Mataura was
identified on the Mural Board). A number of affluent areas were included on the mural
board but were excluded from the maps in Section 3 (i.e. if a location did not have any
NZDEP2018 Decile 10 units the location was removed from the maps).
o
SOCIO-ECONOMIC VULNERABILITY IS NOT A PROXY FOR HAZARD: It should be noted that
there are other communities outside the analysis that may face more severe hazards due to
flooding, including the potential for loss of life, but are not identified in this assessment as
they do not meet the socio-economic criteria required for this assessment (i.e. NZDEP 2018
Decile 10). An example of this is Karamea on the West Coast of the South Island (Decile 9
community).
o
HEAVILY URBANISED AREAS: Pluvial flooding in urban areas is generally associated with
more rapid flooding and a higher level of certainty due to factors such as the capacity of
stormwater networks, blockages impacting overland flow paths, and changes in impervious
under the Official Information Act 1982
land use cover. These areas generally tend to be subject to more modelling. The qualitative
assessment identified broad urban areas susceptible to flooding and suffering socio-
economic deprivation in urban areas (e.g. South Dunedin). The NIWA analysis provided an
indication of SA1 units in certain urban areas (e.g. Mangere in Auckland), but without
reviewing the individual area specific flood models within each region there is a very high
Released
level of uncertainty as to the most vulnerable urban areas to flooding. The review of detailed
urban modelling available for most urban centres around the country is a key
recommendation in Section
4. Specific locations within urban areas have not been provided
as part of this project and should be incorporated later when sufficient time is available to
review urban flood models from around the country.
o
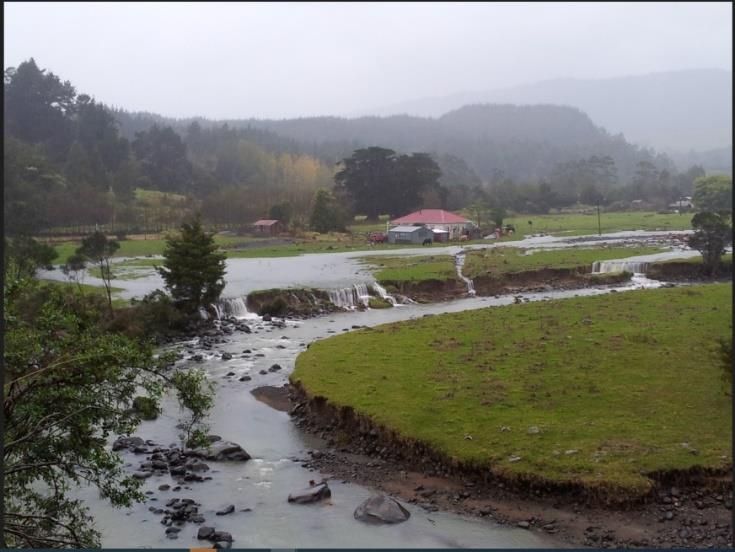
HOKIANGA / SMALLER COMMUNITIES: Through the qualitative assessment isolated houses
and smaller communities were flagged by the River Managers Group. For examp
le, Figure 6
was provided by Northland Regional Council as an example of a flood event near a
vulnerable property in Waimamaku (Hokianga). Hokianga was considered an exception
14
because the entire region is classified as Decile 10
and consists of multiple small
communities. Another similar region was the East Cape, but in this area, communities were
clearly identified within the mural board. By flagging the Hokianga region further analysis
can be done in this area to identify the locations exposed to a flood hazard. This type of
regional analysis could also be completed in other areas of the country such as the West
Coast of the South Island if the socio-economic vulnerability threshold was adjusted (i.e.
broaden to include lower decile communities). However, around the country there will be
isolated properties and very small communities that are exposed to a flood hazard that have
not been identified in this project.
Figure 6: Isolated property in Waimamaku sent through by Northland Regional Council. Property in
proximity of a debris flow causing the nearby river to find a new path.
under the Official Information Act 1982
Released
15
link to page 18 link to page 19
 3
Maps of identified communities
3
Maps of identified communities
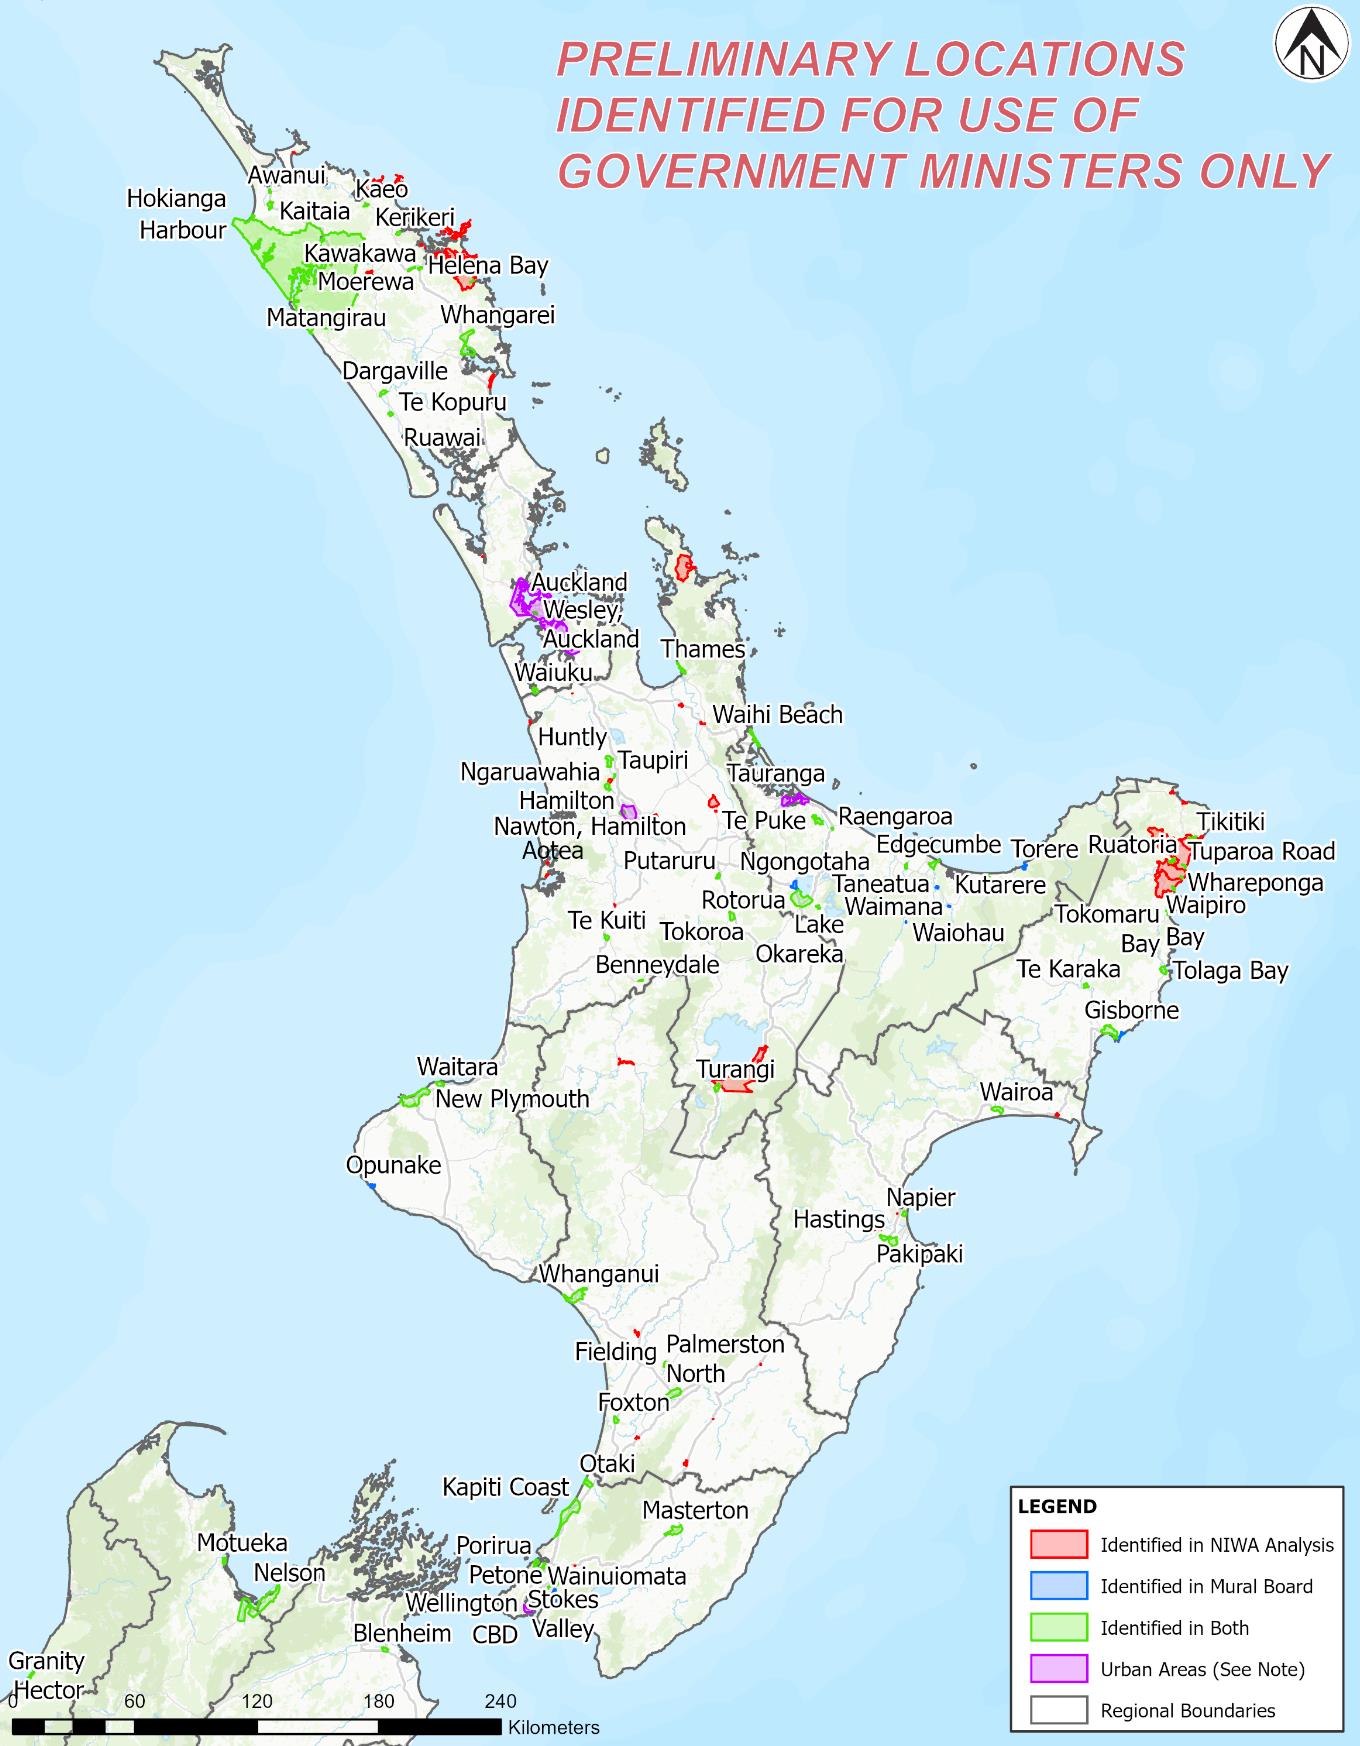
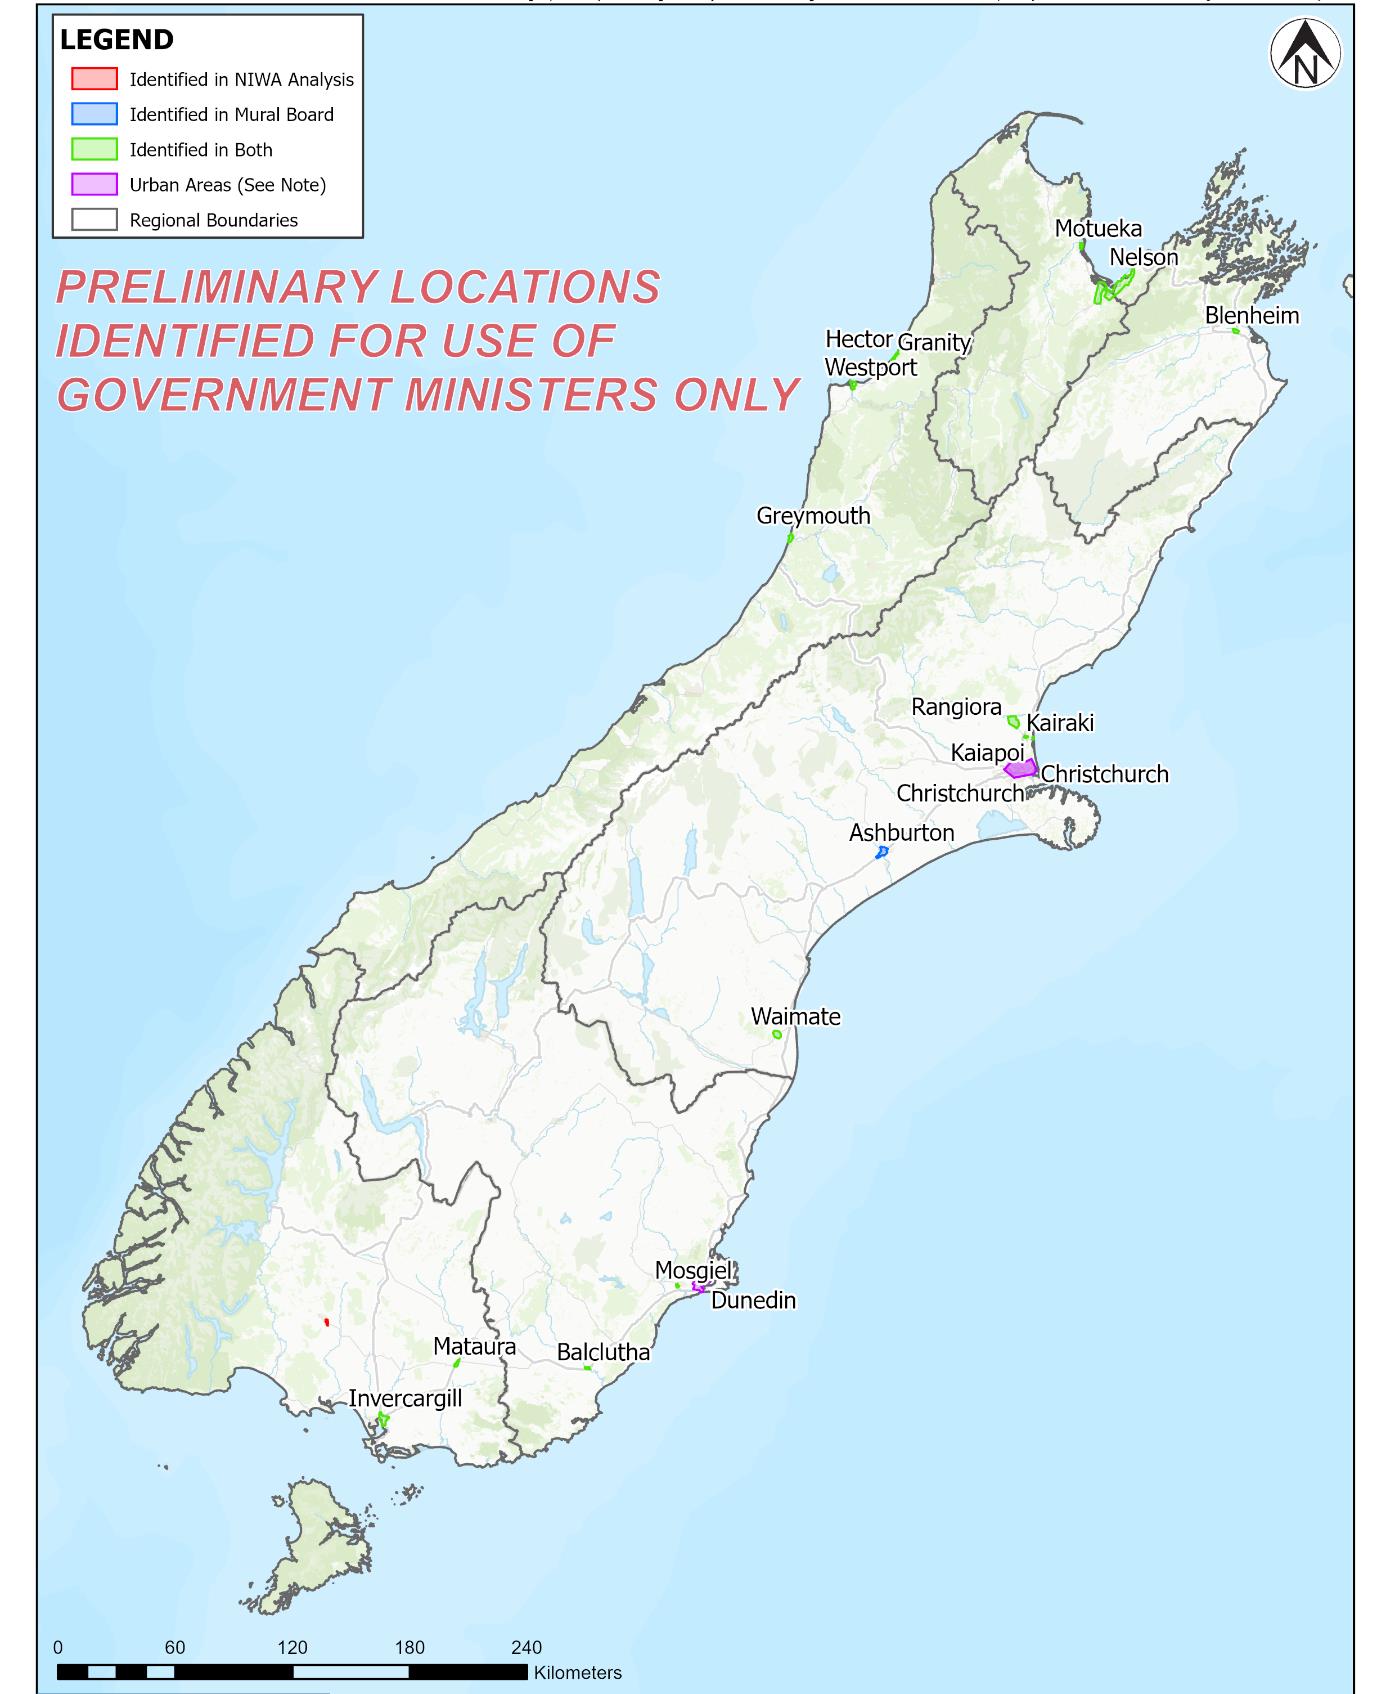
Refer to the methodology in Section 1 as to ho
w Figure 7 (North Island) and
Figure 8 (South Island)
were created.
under the Official Information Act 1982
Released
Figure 7: Final locations (North Island) identified from both the NIWA analysis and mural board (please note
urban areas require further analysis – see recommendation in Section 2)
16
under the Official Information Act 1982
Released
Figure 8: Final locations (South Island) identified from both the NIWA analysis and mural board (please note
urban areas require further analysis – see recommendation in Section 2)
17
link to page 14 link to page 18
4
Recommendations – Next Steps
As was discussed in Sectio
n 2 there are a number of limitations and assumptions with the maps
presented in Section 3 due to the tight timeframe to provide an answer to the Minister’s question.
What has been provided are
indicative maps of locations exposed to a flood hazard and suffering
from high socio-economic vulnerability.
The work done provides a basis for future work that could examine in greater detail the severity of
hazard faced by communities identified in this report. As per earlier comments, this report only
identifies exposure to hazard (not the severity of the hazard). It must also be restated that
there will
be communities exposed to a flood hazard that will have been missed from the maps provided,
and some included who do not face exposure to a hazard. The intention of this work is to provide a
sense of the scale of the number of NZDEP2018 Decile 10 communities around the country that are
exposed to a flood hazard and use this a basis for a more comprehensive study in the future.
It may be useful to revisit the question when the flood hazard dataset from NIWA is available in the
next 1-2 years. This could potentially make it easier to complete this type of assessment.
Alternatively the question could be further explored now using the available flood hazard data sets
from different regional councils around the country.
The following recommendations are provided:
-
Further analysis of heavily urbanised areas. Specifically, Auckland, Hamilton, Tauranga,
Wellington, Christchurch, and Dunedin. Communities within these cities would need to be
reviewed via the area specific flood hazard models for these locations. Following this,
analysis could be broadened to include even smaller urban centres such as, but not limited
to Nelson, Rotorua, Whangarei, and Gisborne.
-
Analysis of a broader range of ARI events (i.e. higher frequency events such as 10-year, 20-
year ARI intervals) alongside a review of lower frequency events (i.e. 100-year ARI and
greater). The July 2021 flood in Westport was estimated between a 50 to 100-year ARI6.
-
For the locations identified on the maps in Section
3 review the depth and velocity
information available from the existing flood models to understand the severity of hazard.
under the Official Information Act 1982
-
Timing has not allowed the River Managers Group to review the maps in this report to
confirm they accurately represent the comments left on the mural board.
-
Further to a review from the River Managers Group in future, the indicative locations could
also be reviewed by government organisations such as Civil Defence and the EQC to broaden
the pool of flood hazard experts commenting on the communities identified through this
Released
project.
-
Analysis of ratepayer data for locations identified to understand what communities would
struggle to fund flood resilience schemes. It may be the case that urban areas in Auckland
and Christchurch may be less vulnerable in the future as they are assumed to have a greater
ability to fund flood schemes compared to smaller towns such as Wairoa or Westport.
6 LandRiverSea (2022). The science behind the Buller floods, rainfall events and river modelling. Community PowerPoint
Presentation. June, 2022.
18
-
Review insurance coverage of private properties for locations identified (and any further
locations identified in subsequent analysis) to further understand the economic vulnerability
of communities.
-
Review the flood schemes currently planned or being implemented around the country to
review if any of the locations identified are or will be benefiting from flood defences.
-
Because flood hazard and associated natural hazard data sets (e.g. Tsunami impact
assessments) are constantly being reviewed and updated via independent studies across the
country, it may be useful to consider a live dashboard / data portal with a live status of
hazard exposure for communities. The status of communities could be updated when new
data is available. Currently the volume of material and ongoing work being done by regional
councils, local authorities, EQC, NIWA and Civil Defence means any form of analysis will only
provide a very limited temporal snapshot of flood exposure.
under the Official Information Act 1982
Released
19
Appendix A – NIWA Metadata
Input data for the composite flood hazard map produced by NIWA.
Table 1: GIS RESTful Services
Organisation
Url
Auckland Council
https://mapspublic.aklc.govt.nz/arcgis3/rest/services/
Bay of Plenty Regional Council
http://gis.boplass.govt.nz/arcgis/rest/services/
Environment Canterbury
https://gis.ecan.govt.nz/arcgis/rest/services/
http://maps.gdc.govt.nz/H5V2_7/Index.html?viewer=TairawhitiDown
Gisborne District Council
load
Greater Wellington Regional
http://mapping.gw.govt.nz/arcgis/rest/services
Council
Hawkes Bay Regional Council
https://opendata-hbrc.opendata.arcgis.com/datasets/
Horizons Regional Council
https://gisdmz.horizons.govt.nz/arcgis/rest/services/
Marlborough District Council
http://maps.marlborough.govt.nz/arcgis/rest/services/
Nelson City Council
https://www.topofthesouthmaps.co.nz/arcgis/rest/services/
Northland Regional Council
http://hilltop.nrc.govt.nz/nrcwebmap/rest/services/
https://gis.cluthadc.govt.nz/arcgis/rest/services/DistrictPlan/MapSer
Otago Regional Council
ver/
Environment Southland
http://gis.es.govt.nz/arcgis/rest/services/Public/
Tasman District Council
https://www.topofthesouthmaps.co.nz/arcgis/rest/services/
Christchurch City Council
https://opendata.ccc.govt.nz/DistrictPlan/service.svc/get
Clutha District Council
https://gis.cluthadc.govt.nz/arcgis/rest/services
Dunedin City Council
http://apps.dunedin.govt.nz/arcgis/rest/services/
Hamilton City Council
http://gisviewer.hcc.govt.nz/arcgis/rest/services/
Kapiti Coast District Council
http://maps.cera.govt.nz/arcgis/rest/services/KCDC
MacKenzie District Council
http://maps.mackenzie.govt.nz/arcgis/rest/services/
New Plymouth District Council
http://maps.npdc.govt.nz/arcgis/rest/services
Queenstown Lakes District Council
http://qldcmaps.qldc.govt.nz/arcgis/rest/services
Rotorua Lakes Council
http://geo.rdc.govt.nz/arcgis/rest/services/BOPLASS
Taupo District Council
https://gis.taupodc.govt.nz/arcgis/rest/services
under the Official Information Act 1982
Tauranga City Council
http://gismob.tauranga.govt.nz/arcgis/rest/services
Thames Coromandel District
https://services5.arcgis.com/MYtLmLEStmKgdmln/ArcGIS/rest/
Council
Waimate District Council
http://gis.waimatedc.govt.nz/arcgis/rest/services
Western Bay of Plenty District
http://arcgis.westernbay.govt.nz/arcgis/rest/services
Council
Released
Whakatane District Council
http://maps.whakatane.govt.nz/arcgis/rest/services/ArcGISOnline
20
Table 2: Flood Map Metadata (for national composite flood hazard data set)
Owner
Name
Year
Max. ARI
Method
Climate change
DEM and 'fill' tool used to identify
depressions, then flow direction tool to
Overland flow paths
identify upstream catchments and calculate
Auckland Council
2013
100
None
2000 to 4000 sq m
the catchment area, overland flow paths were
then calculated if between 2000 and 4000 sq
m (ArcGIS)
DEM and 'fill' tool used to identify
depressions, then flow direction tool to
Overland flow paths
identify upstream catchments and calculate
Auckland Council
2013
100
None
4000m sq m to 3ha
the catchment area, overland flow paths were
then calculated if between 4000 sq m and 3ha
(ArcGIS)
DEM and 'fill' tool used to identify
depressions, then flow direction tool to
Overland flow paths
Auckland Council
2013
100
identify upstream catchments and calculate
None
3ha and above
the catchment area, overland flow paths were
then calculated if greater than 3ha (ArcGIS)
under the Official Information Act 1982
Flood prone areas defined as "the extent of
land within a topographical depression that
water will pond on in a 1% flood event,
Auckland Council
Flood prone areas
2014
100
HIRDS to 100 years
assuming any outlet to the depression is
blocked" (AC Memo 19/12/2014). Layer
generated using LiDAR and GIS techniques.
Released
21
Flood plains defined as "the area of land that
Auckland Council
is inundated by water during a specific flood
(AECOM, DHI, MWH,
event" (AC Memo 19/12/2014
Various (none or a 16.8%
URS, T&T, OPUS,
Flood plains
2014
100
www.aupihp.govt.nz/documents/docs/aupihp
increase in rainfall)
Jacobs, GHD, URS
memohearingtopic026att220141219.pdf).
modelling)
Multiple modelling techniques - 1D (MOUSE)
and 2D (MIKE FLOOD & MIKE 21).
Bay of Plenty
Regional Council
Opotiki 1% AEP flood
2016
100
Numeric modelling
None
(Harrison Grierson
model
modelling)
Bay of Plenty
Regional Council
Opotiki 1% AEP with
2016
100
Numeric modelling
1m SLR
(Harrison Grierson
climate change
modelling)
Bay of Plenty
Bay of Plenty 2004
Aerial photography, field mapping, and
2004
>100
NA (event mapping)
Regional Council
flood
surveyed information from the 2004 flood
Rotorua Lakes
Lake Rotorua (RL 281.18m) and Rotoiti (RL
Rotorua inundation
2016
50
None
Council
280.46m) levels - bathtub over LiDAR
Tauranga City
Tauranga overland
2014
100
LiDAR data, GIS methods
None
Council
flow path extent
Mapped flood plains (primarily based on
Tauranga City
Tauranga flood hazard 2013
100
LiDAR) in areas where further development
None
Council
city plan area
possible (brown and greenfield development)
under the Official Information Act 1982
Tauranga City
Tauranga flood hazard 2013
100
2D catchment model of extreme rainfall event None
Council
(extreme rainfall)
Tauranga City
Matua 100 year flood
100 year in line with 2014
Council (DHI
2014
100
Numeric modelling - 2D (MIKE FLOOD)
depths
recommendations
modelling)
Released
22
Numeric modelling (MIKE 21 and MIKE
URBAN)
Western Bay of
(http://www.westernbay.govt.nz/our-
Plenty District
Wairoa (WBOP)
2016
100
services/property/natural-
None
Council (DHI
floodable area
hazards/Documents/DHI%20Wairoa%20Storm
modelling)
water%20Catchment%20Modelling%202016_
web.pdf)
Western Bay of
Various from numeric modelling (MIKE 21 and
Plenty District
Western Bays
2004-
MIKE URBAN) of maximum probable
Council (Duffill Watts
100
Various
floodable area
2012
development to LiDAR catchment mapping.
and King, Opus, T &
Flood maps shown on DP.
T)
Numeric modelling (MIKE 21 and MIKE
URBAN) of maximum probable development
Western Bay of
(http://www.westernbay.govt.nz/our-
Plenty District
Waihi Beach (WBOP)
16.8% increase in rainfall +
2017
100
services/property/natural-
Council (T & T
floodable area
20 year ARI SL
hazards/Documents/Tonkin%20and%20Taylor
modelling)
%20Waihi%20Beach%20Stormwater%20Mode
l%20Report%202017.pdf)
Whakatane District
Whakatane inundation
Assessment using LiDAR, areas below RL
-
Unknown
None
Council
risk zone
103.6m in risk zone
Ashburton District
Council
Various methodologies including previous
Ashburton flood map
2014
200
None
(Environment
events, LiDAR, numeric modelling
under the Official Information Act 1982
Canterbury mapping)
Numeric 2D modelling showing areas where
Christchurch City
Christchurch fixed
Not specified, but
2016
~200
fixed floor levels must be applied in
Council
floor level area
considered
development
Christchurch City
Lake Ellesmere
2016
-
Historic event mapping
None
Council
management area
Released
23
Christchurch City
Christchurch flood
Various methodologies including previous
2016
-
None
Council
management area
events, LiDAR, numeric modelling
Christchurch City
Christchurch flood
2016
-
LiDAR mapping
None
Council
ponding
Numeric modelling showing areas where flood
Christchurch City
Waimakariri River
2016 guidance values for
2016
50
depth multiplied by velocity is ?1 or depths
Council
flood plain high hazard
Canterbury used
are >1m
500
Christchurch City
Waimakariri River
(protection Floodplain protected by stopbanks, mapped
1950s
None
Council
stopbank floodplain
level of
with LiDAR data
stopbank)
MacKenzie District
1D numeric modelling of Ohau-Pukaki Canal
Canal breach area
2004
-
None
Council
breach
MacKenzie District
Kimbell flood area
-
~50
Mapped extent of previous events
None
Council
MacKenzie District
MacKenzie potential
Various methodologies including previous
2004
200
None
Council
flooding areas
events, LiDAR, numeric modelling
Selwyn District
Council
Selwyn Ecan defined
Various methodologies including previous
2016
200
None
(Environment
flood zones
events, LiDAR, numeric modelling
Canterbury mapping)
Numeric modelling (MIKE 21 and MIKE
URBAN)
Waimakariri District
Flood depth (North of
(https://www.waimakariri.govt.nz/__data/ass
2016 guidance values for
under the Official Information Act 1982
2016
200
Council
Waimakariri River)
ets/pdf_file/0017/19313/Waimakariri-District-
Canterbury used
Localised-Flood-Hazard-Assessment-July-
2015.pdf)
Waimate District
Various methodologies including previous
Waimate flood region
2014
200
None
Council
events, LiDAR, numeric modelling
Released
24
(Environment
Canterbury mapping)
Some numeric modelling but primarily LiDAR
2006
and previous event mapping of areas (river
Gisborne District
Gisborne District flood (updat-ed ~100
and flood way, high/med/low hazard,
Various
Council
zones
2016)
ponding, old river loops, urban stormwater
ponding, etc.). Included in District Plan
Some numeric modelling but primarily LiDAR
2007
and previous event mapping of areas (river
Gisborne District
Gisborne flood hazard
(updat-ed ~100
and flood way, high/med/low hazard,
Various
Council
areas
2016)
ponding, old river loops, urban stormwater
ponding, etc.). Not included in District Plan
Hawkes Bay Regional Hawkes Bay flood risk
Numeric modelling - variety of methods, local
2017
50-100
None
Council
areas
scale models joined to give risk areas
Horizons Regional
Cloverlea 200yr wet
Numeric modelling using MIKE11 and MIKE21
None assumed that 0.5%
2008
200
Council
extent
of 0.5% AEP event of Cloverlea area
current will be 1% by 2090
Horizons Regional
Feilding 200yr wet
Numeric modelling using MIKE11 and MIKE21
None assumed that 0.5%
2008
200
Council
extent
of 0.5% AEP event of Fielding area
current will be 1% by 2090
Horizons Regional
Herbertville 200yr wet
Numeric modelling using MIKE11 and MIKE21
None assumed that 0.5%
2008
200
Council
extent
of 0.5% AEP event of Herbertville area
current will be 1% by 2090
Horizons Regional
Mangatainoka 200yr
Numeric modelling using MIKE11 and MIKE21
None assumed that 0.5%
2008
200
Council
wet extent
of 0.5% AEP event of Mangatainoka area
current will be 1% by 2090
Horizons Regional
Ohakune 200yr wet
Numeric modelling using MIKE11 and MIKE21
None assumed that 0.5%
2008
200
Council
extent
of 0.5% AEP event of Ohakune area
current will be 1% by 2090
under the Official Information Act 1982
Horizons Regional
Oroua Mangaone
Numeric modelling using MIKE11 and MIKE21
None assumed that 0.5%
2008
200
Council
200yr wet extent
of 0.5% AEP event of Oroua Mangaone area
current will be 1% by 2090
Horizons Regional
Pahiatua 200yr wet
Numeric modelling using MIKE11 and MIKE21
None assumed that 0.5%
2008
200
Council
extent
of 0.5% AEP event of Pahiatua area
current will be 1% by 2090
Horizons Regional
Pohangina 200yr wet
Numeric modelling using MIKE11 and MIKE21
None assumed that 0.5%
2008
200
Released
Council
extent
of 0.5% AEP event of Pohangina area
current will be 1% by 2090
25
Horizons Regional
Taumarunui 200yr wet
Numeric modelling using MIKE11 and MIKE21
None assumed that 0.5%
2008
200
Council
extent
of 0.5% AEP event of Taumarunui area
current will be 1% by 2090
Horizons Regional
Turakina 200yr wet
Numeric modelling using MIKE11 and MIKE21
None assumed that 0.5%
2008
200
Council
extent
of 0.5% AEP event of Turakina area
current will be 1% by 2090
Horizons Regional
Tutaenui 200yr wet
Numeric modelling using MIKE11 and MIKE21
None assumed that 0.5%
2008
200
Council
extent
of 0.5% AEP event of Tutaenui area
current will be 1% by 2090
Horizons Regional
Upper Gorge 200yr
Numeric modelling using MIKE11 and MIKE21
None assumed that 0.5%
2008
200
Council
wet extent
of 0.5% AEP event of Upper Gorge area
current will be 1% by 2090
Horizons Regional
Upper Mangaone
Numeric modelling using MIKE11 and MIKE21
None assumed that 0.5%
2008
200
Council
200yr wet extent
of 0.5% AEP event of Upper Mangaone area
current will be 1% by 2090
Horizons Regional
Waikawa-Manakau
Numeric modelling using MIKE11 and MIKE21
2008
200
None
Council
200yr wet extent
of 0.5% AEP event of Waikawa-Manakau area
Horizons Regional
Whakarongo 200yr
Numeric modelling using MIKE11 and MIKE21
None assumed that 0.5%
2008
200
Council
wet extent
of 0.5% AEP event of Whakarongo area
current will be 1% by 2090
Horizons Regional
Whangaehu 200yr wet
Numeric modelling using MIKE11 and MIKE21
None assumed that 0.5%
2008
200
Council
extent
of 0.5% AEP event of Whangaehu area
current will be 1% by 2090
Horizons Regional
Whanganui 200yr wet
Numeric modelling using MIKE11 and MIKE21
None assumed that 0.5%
2008
200
Council
extent
of 0.5% AEP event of Whanganui area
current will be 1% by 2090
Horizons Regional
Aerial photography mapping and digitising,
1976 flood extent
-
-
NA (event mapping)
Council
including internal ponding
Horizons Regional
Aerial photography mapping and digitising,
1988 flood extent
-
-
NA (event mapping)
Council
including internal ponding
Horizons Regional
Mangatainoka
Aerial photography mapping and digitising,
2000
~100
NA (event mapping)
under the Official Information Act 1982
Council
October 2000 flood
including internal ponding
Horizons Regional
Mana January 2005
Aerial photography mapping and digitising,
2005
~50
NA (event mapping)
Council
flood
including internal ponding
Horizons Regional
SH57a October 2005
Aerial photography mapping and digitising,
2005
-
NA (event mapping)
Council
flood
including internal ponding
Horizons Regional
Waikawa-Manakau
Aerial photography mapping and digitising,
2008
-
NA (event mapping)
Released
Council
January 2008 flood
including internal ponding
26
Horizons Regional
Mangahao SH2
Aerial photography mapping and digitising,
2010
-
NA (event mapping)
Council
September 2010 flood
including internal ponding
Horizons Regional
Makowhai Stream
Aerial photography mapping and digitising,
2010
-
NA (event mapping)
Council
September 2010 flood
including internal ponding
Horizons Regional
Aerial photography mapping and digitising,
October 2010 flood
2010
-
NA (event mapping)
Council
including internal ponding
Horizons Regional
Aerial photography mapping and digitising,
October 2013 flood
2013
-
NA (event mapping)
Council
including internal ponding
Horizons Regional
Whanganui flood
Aerial photography mapping and digitising,
2015
100
NA (event mapping)
Council
(June 2015)
including internal ponding
Horizons Regional
Observed flood extent
Aerial photography mapping and digitising,
2004
100
NA (event mapping)
Council
February 2004
including internal ponding
Numeric modelling using MIKE11 and MIKE21
None - have assumed that a
Horizons Regional
FPM modelled 200yr
2013
200
of 0.5% AEP event (not complete - some areas 0.5% AEP current event will
Council
wet extent
of region missing)
be a 1% event by 2090
Coarse scale flood mapping using a variety of
Horizons Regional
Indicative flooding
1990s
~200
sources (previous events, topographic data,
None
Council
affected area
field surveys, etc)
Land defined into 4 levels - L1 shallow, low-
velocity flooding 2% AEP; L2 depth/velocity
Marlborough
not well understood but affected by 2% AEP
Marlborough District Environment Plan
2017
50
flood or within 8m of lake; L3 deep, fast
None
Council
flood hazard plan
flowing water in 2% AEP event; L4 land that
could be affected by deep, fast flowing water
under the Official Information Act 1982
if flood defences overwhelmed
Nelson City Council
Numeric modelling of flood extent - 2D (MIKE
1m SLR, 15.5% increase in
Nelson flood 2100
2016
100
(T&T modelling)
21 and MIKEFLOOD)
rainfall
Nelson City Council
Nelson flood 2100
Numeric modelling of flood depth - 2D (MIKE
1m SLR, 15.5% increase in
2016
100
(T&T modelling)
depth
21 and MIKEFLOOD)
rainfall
Released
27
Nelson City Council
Nelson flood present
Numeric modelling of flood extent - 2D (MIKE
(T&T, Opus, MWH
2016
100
None
day
21 and MIKEFLOOD)
modelling)
Northland Regional
Northland 100 year
Various methodologies including previous
2013
100
None
Council
flood extent
events, LiDAR, numeric modelling
Northland Regional
Northland 10 year
Various methodologies including previous
2013
10
None
Council
flood extent
events, LiDAR, numeric modelling
Numerical modelling of runoff and channel
Northland Regional
flow assuming Maximum Probable
Far North District MPD
Council (GHD
2012
10
Development using MOUSE and MIKE 11
None
floodplain (10 year)
modelling)
(https://www.fndc.govt.nz/services/fndc-
maps/Stormwater-Model-Build-Report.pdf)
Numerical modelling of runoff and channel
Northland Regional
flow assuming Maximum Probable
Far North District MPD
Council (GHD
2013
100
Development using MOUSE and MIKE 11
20.1% increase in rainfall
floodplain (100 year)
modelling)
(https://www.fndc.govt.nz/services/fndc-
maps/Stormwater-Model-Build-Report.pdf)
Numeric modelling - 1D catchment mapping
(http://www.wdc.govt.nz/BuildingandPropert
Whangarei District
WDC District Plan -
2001
50
y/Land-
Current climate only
Council
flood susceptibility
Hazards/Documents/Flood%20Zone%20Repor
ts/Flood-susceptibility-mapping-report.pdf)
Based on Otago flood hazard area layer (ORC
Clutha District
Clutha flood prone
1998
~100
data) with some additions based on previous
None
under the Official Information Act 1982
Council
land
local-scale events
Clutha District
Council (Otago
Clutha deep floodway
Overland flow pathways identified from LiDAR
2012
-
None
Regional Council
corridors
and previous events, usually 1-2m deep
modelling)
Released
28
Clutha District
Clutha rural and semi-
Council (Otago
Overland flow pathways identified from LiDAR
rural floodway
2012
-
None
Regional Council
and previous events
corridors
modelling)
Clutha District
Council (Otago
Clutha urban floodway
Overland flow pathways identified from LiDAR
2012
-
None
Regional Council
corridors
and previous events
modelling)
Floodplain area that will be flooded by the
Clutha District
north and west branches of the Tokomairiro
Council (Otago
Tokomairiro floodway
River (historic and topographic information).
2012
-
None
Regional Council
corridor
Area 1A -
modelling)
https://www.orc.govt.nz/media/3796/milton-
2060-strategy.pdf
Wider floodplain area where flows of the
Clutha District
Tokomairiro Riveare still deep and fast to
Council (Otago
cause a safety risk (historic and topographic
Tokomairiro floodplain 2012
-
None
Regional Council
information). Area 1B -
modelling)
https://www.orc.govt.nz/media/3796/milton-
2060-strategy.pdf
Clutha District
Ponding areas (identified using historic and
Council (Otago
Clutha ponding areas
2012
-
topographic information) to the N and W of
None
Regional Council
2A
SH1
modelling)
under the Official Information Act 1982
Clutha District
Council (Otago
Clutha ponding areas
Ponding areas (identified using historic and
2012
-
None
Regional Council
2B
topographic information) to the S and E of SH2
modelling)
Released
29
Clutha District
Clutha urban ponding
Council (Otago
Ponding areas (identified using historic and
areas (outside of 2A,
2012
-
None
Regional Council
topographic information) in urban areas
2B)
modelling)
Minimum flood level
Observational methodology using terrain and
Dunedin City Council area - Waitati and
2015
~100
None
historic flood extent analysis
Karitane
2.5 degree increase in
Minumum flood level
Numerical modelling of hill catchment run-off
temperature, providing a
Dunedin City Council
2015
~100
area - Dunedin
and rain on grid
20% increase in rainfall
intensity
Very high hazard. Various approaches
Various - assume that
Dunedin hazard 1 -
combined - including historic event mapping,
hazard zones 2 and 3 will
Dunedin City Council
2006
<100
flood
LiDAR inspection, and some 2D numeric
become 1 with climate
modelling
change
Very high hazard. Various approaches
Various - assume that
Dunedin hazard 1
combined - including historic event mapping,
hazard zones 2 and 3 will
Dunedin City Council
2014
<100
(flood) overlay zone
LiDAR inspection, and some 2D numeric
become 1 with climate
modelling
change
Very high hazard. Various approaches
Various - assume that
Dunedin hazard 1A
combined - including historic event mapping,
hazard zones 2 and 3 will
Dunedin City Council
2014
<100
(flood) overlay zone
LiDAR inspection, and some 2D numeric
become 1 with climate
modelling
change
Various - assume that
under the Official Information Act 1982
High hazard. Various approaches combined -
Dunedin hazard 2 -
hazard zones 2 and 3 will
Dunedin City Council
2006
>100
including historic event mapping, LiDAR
flood
become 1 with climate
inspection, and some 2D numeric modelling
change
High hazard. Various approaches combined -
Dunedin hazard 2
Various - assume that
Dunedin City Council
2014
>100
including historic event mapping, LiDAR
(flood) overlay zone
hazard zones 2 and 3 will
Released
inspection, and some 2D numeric modelling
30
become 1 with climate
change
Moderate hazard. Various approaches
Various - assume that
Dunedin hazard 3 -
combined - including historic event mapping,
hazard zones 2 and 3 will
Dunedin City Council
2006
>200
flood
LiDAR inspection, and some 2D numeric
become 1 with climate
modelling
change
Moderate hazard. Various approaches
Various - assume that
Dunedin hazard 3
combined - including historic event mapping,
hazard zones 2 and 3 will
Dunedin City Council
2014
>200
(flood) overlay zone
LiDAR inspection, and some 2D numeric
become 1 with climate
modelling
change
Variety of sources - primarily LiDAR and past
Otago Regional
Otago flood hazard
2015
-
event (aerial photography and surveys) with
None
Council
area
occasional numerical modelling
Queenstown Lakes
Queenstown flood
Numeric modelling - 2D of a dam burst
2006
-
None
District Council
map - dam break
scenario
Queenstown Lakes
Queenstown flood
Numeric modelling - using WaterRide
2006
100
None
District Council
map - rainfall
software for rainfall event
Environment
Various - primarily mapping of previous events
Southland Floodplains
2016
-
None
Southland
and topological information
Areas identified from LiDAR and previous
New Plymouth
Flood detention area
1990s
-
events that would potentially act as a spillway
None
District Council
spillway
during a flood event
New Plymouth
New Plymouth flood
Topographic information primarily - township
-
-
None
District Council
plain
areas only
under the Official Information Act 1982
Waitara 3200 cumec
NIWA
2014
100
Gerris numeric modelling
18% uncertainty
water level
Waitara 3780 cumec
NIWA
2014
200
Gerris numeric modelling
20% uncertainty
water level
Waitara 4540 cumec
22% uncertainty and 20%
NIWA
2014
200
Gerris numeric modelling
Released
water level
for climate change
31
Waitara 4660 cumec
NIWA
2014
500
Gerris numeric modelling
26% uncertainty
water level
Waitara 5590 cumec
26% uncertainty and 20%
NIWA
2014
500
Gerris numeric modelling
water level
for climate change
Variety of sources - primarily LiDAR and past
Tasman District
Tasman District flood
2014
-
event (aerial photography and surveys) with
None
Council
zones
occasional numerical modelling
Tasman District
Aorere December
2010
-
Aerial photography mapping and digitising
NA (event mapping)
Council
2010 flood
Tasman District
Aorere January 1985
1985
-
Aerial photography mapping and digitising
NA (event mapping)
Council
flood
Tasman District
Brooklyn Riwaka 1976
1976
-
Aerial photography mapping and digitising
NA (event mapping)
Council
flood
Tasman District
Ellis Creek and Pohara
2011
-
Aerial photography mapping and digitising
NA (event mapping)
Council
December 2011 flood
Ewes Valley and
Tasman District
Redwood Valley June
1980
-
Aerial photography mapping and digitising
NA (event mapping)
Council
1980 flood
Ewes Valley and
Tasman District
Redwood Valley June
1982
-
Aerial photography mapping and digitising
NA (event mapping)
Council
1982 flood
Tasman District
Kaituna 1974 flood
1974
-
Aerial photography mapping and digitising
NA (event mapping)
Council
Tasman District
under the Official Information Act 1982
Mill Stream 1986 flood 1986
-
Aerial photography mapping and digitising
NA (event mapping)
Council
Tasman District
Motueka August 1990
1990
-
Aerial photography mapping and digitising
NA (event mapping)
Council
flood
Tasman District
Motueka July 1983
1983
-
Aerial photography mapping and digitising
NA (event mapping)
Council
flood
Released
32
Tasman District
Moutere July 1983
1981
-
Aerial photography mapping and digitising
NA (event mapping)
Council
flood
Tasman District
Orinoco Creek March
1986
-
Aerial photography mapping and digitising
NA (event mapping)
Council
1986 flood
Tasman District
Pitfure June 1980
1980
-
Aerial photography mapping and digitising
NA (event mapping)
Council
flood
Tasman District
Pitfure June 1982
1982
-
Aerial photography mapping and digitising
NA (event mapping)
Council
flood
Tasman District
Riwaka August 1980
1980
-
Aerial photography mapping and digitising
NA (event mapping)
Council
flood
Tasman District
Takaka July 1983 flood 1983
-
Aerial photography mapping and digitising
NA (event mapping)
Council
Tasman District
Upper Motueka April
1974
-
Aerial photography mapping and digitising
NA (event mapping)
Council
1974 flood
Tasman District
Waiiti July 1983 flood
1983
-
Aerial photography mapping and digitising
NA (event mapping)
Council
Tasman District
Wairoa December
1983
-
Aerial photography mapping and digitising
NA (event mapping)
Council
1983 flood
Tasman District
Wairoa January 1986
1986
-
Aerial photography mapping and digitising
NA (event mapping)
Council
flood
Tasman District
Wangapeka November 1997
-
Aerial photography mapping and digitising
NA (event mapping)
Council
1997 flood
None - assume that a 200yr
under the Official Information Act 1982 event today will become a
Tasman District
Takaka Q200 with no
Numeric modelling - 2D (LiDAR and
2011
200
100yr by 2090, 100yr
Council
McK bank
WaterRide) without informal stopbank
become a 60yr, 50yr
become a 30yr
None - assume that a 200yr
Tasman District
Takaka Q200 with McK
Numeric modelling - 2D (LiDAR and
2011
200
event today will become a
Council
bank
WaterRide) with informal stopbank
Released
100yr by 2090, 100yr
33
become a 60yr, 50yr
become a 30yr
None - assume that a 200yr
event today will become a
Tasman District
Takaka Q100 with no
Numeric modelling - 2D (LiDAR and
2011
100
100yr by 2090, 100yr
Council
McK bank
WaterRide) without informal stopbank
become a 60yr, 50yr
become a 30yr
None - assume that a 200yr
event today will become a
Tasman District
Takaka Q100 with McK
Numeric modelling - 2D (LiDAR and
2011
100
100yr by 2090, 100yr
Council
bank
WaterRide) with informal stopbank
become a 60yr, 50yr
become a 30yr
None - assume that a 200yr
event today will become a
Tasman District
Takaka Q50 with no
Numeric modelling - 2D (LiDAR and
2011
50
100yr by 2090, 100yr
Council
McK bank
WaterRide) without informal stopbank
become a 60yr, 50yr
become a 30yr
None - assume that a 200yr
event today will become a
Tasman District
Takaka Q50 with McK
Numeric modelling - 2D (LiDAR and
2011
50
100yr by 2090, 100yr
Council
bank
WaterRide) with informal stopbank
become a 60yr, 50yr
become a 30yr
None - assume that a 200yr
event today will become a
under the Official Information Act 1982
Tasman District
Takaka Q20 with no
Numeric modelling - 2D (LiDAR and
2011
20
100yr by 2090, 100yr
Council
McK bank
WaterRide) without informal stopbank
become a 60yr, 50yr
become a 30yr
None - assume that a 200yr
Tasman District
Takaka Q20 with McK
Numeric modelling - 2D (LiDAR and
2018
20
event today will become a
Council
bank
WaterRide) with informal stopbank
100yr by 2090, 100yr
Released
34
become a 60yr, 50yr
become a 30yr
Used 500 year event as CC
Tasman District
proxy - not a significant
Council (Sinclair
Brightwater-Wakefield 2013
500
Numeric modelling - 2D, 2m grid (MIKE 21)
increase from current 100
Knight Merz
flood map
year event due to defences
modelling)
and floodplain morphology
None - used 500 year event
Tasman District
as CC proxy - not a
Council (Sinclair
Q500 depth BW
significant increase from
2013
500
Numeric modelling - 2D, 2m grid (MIKE 21)
Knight Merz
(Brightwater)
current 100 year event due
modelling)
to defences and floodplain
morphology
None - used 500 year event
Tasman District
as CC proxy - not a
Council (Sinclair
Q500 depth WF
significant increase from
2013
500
Numeric modelling - 2D, 2m grid (MIKE 21)
Knight Merz
(Wakefield)
current 100 year event due
modelling)
to defences and floodplain
morphology
None - used 500 year event
Tasman District
as CC proxy - not a
Council (Sinclair
Q200 depth BW
significant increase from
2013
200
Numeric modelling - 2D, 2m grid (MIKE 21)
Knight Merz
(Brightwater)
current 100 year event due
modelling)
to defences and floodplain
under the Official Information Act 1982 morphology
Tasman District
None - used 500 year event
Council (Sinclair
Q200 depth WF
as CC proxy - not a
2013
200
Numeric modelling - 2D, 2m grid (MIKE 21)
Knight Merz
(Wakefield)
significant increase from
modelling)
current 100 year event due
Released
35
to defences and floodplain
morphology
Tasman District
Council (Sinclair
Q100 depth BW
2013
100
Numeric modelling - 2D, 2m grid (MIKE 21)
None
Knight Merz
(Brightwater)
modelling)
None - used 500 year event
Tasman District
as CC proxy - not a
Council (Sinclair
Q100 depth WF
significant increase from
2013
100
Numeric modelling - 2D, 2m grid (MIKE 21)
Knight Merz
(Wakefield)
current 100 year event due
modelling)
to defences and floodplain
morphology
None - used 500 year event
Tasman District
as CC proxy - not a
Council (Sinclair
Q50 depth BW
significant increase from
2013
50
Numeric modelling - 2D, 2m grid (MIKE 21)
Knight Merz
(Brightwater)
current 100 year event due
modelling)
to defences and floodplain
morphology
None - used 500 year event
Tasman District
as CC proxy - not a
Council (Sinclair
Q50 depth WF
significant increase from
2013
50
Numeric modelling - 2D, 2m grid (MIKE 21)
Knight Merz
(Wakefield)
current 100 year event due
modelling)
to defences and floodplain
morphology
under the Official Information Act 1982 None - used 500 year event
Tasman District
as CC proxy - not a
Council (Sinclair
Q20 depth BW
significant increase from
2013
20
Numeric modelling - 2D, 2m grid (MIKE 21)
Knight Merz
(Brightwater)
current 100 year event due
modelling)
to defences and floodplain
morphology
Released
36
None - used 500 year event
Tasman District
as CC proxy - not a
Council (Sinclair
Q20 depth WF
significant increase from
2013
20
Numeric modelling - 2D, 2m grid (MIKE 21)
Knight Merz
(Wakefield)
current 100 year event due
modelling)
to defences and floodplain
morphology
Hamilton City
Hamilton surface
Numeric modelling (MIKE FLOOD) of
2.08 degree warming
2012
100
Council
water flooding
catchment surface flooding
(HIRDS)
Numeric modelling (MIKE FLOOD) of flooding
Hamilton City
Hamilton culvert block
2.08 degree warming
2012
100
due to completely blocked culverts, catchpits,
Council
flooding
(HIRDS)
etc.
Taupo District
Numeric modelling using a "banks down"
Taupo defended area
2015
100
2 degree warming (HIRDS)
Council
approach
Numeric modelling of Hinemaiaia River,
Taupo District
Taupo flood hazard
2012-
Kuratau River, Tauranga-Taupo River, Tokaanu
Council (Opus
100
2 degree warming (HIRDS)
extent
2014
Stream, Tongariro River, and Whareroa
model)
Stream
Thames Coromandel
Numeric modelling of Taruru River, Te Puru
District Council
Thames Coromandel
2011-
River, Waiomu River, Pohue River, Tapu River,
0.5 m SLR, 2 degree
100
(Waikato Regional
flood hazard area
2016
Karaka Stream, Hape Stream, Whangarahi
warming
Council model)
Stream (MIKE 11) with 0.5m SLR
Waikato RACS (river &
Variety of sources - primarily LiDAR and past
Waikato Regional
1990s to
catchment services)
-
event (aerial photography and surveys) with
None
Council
present
flood hazard
occasional numerical modelling
under the Official Information Act 1982
Waikato Regional
Waikato River 1% AEP
WaterRide 1D modelling of river from Horotiu
2016
100
None
Council
flood model
to Port Waikato
430 (0.23%
Flood hazard areas for
Greater Wellington
AEP - Hutt
Numeric modelling from various sources.
the Greater
2018
Various
Regional Council
River); 100
Mostly 2D.
Wellington Region
Released
(1% - Otaki,
37
Porirua,
Mangaroa,
Wainuioma
ta,
Waiohine,
Waikanae,
Waiwhetu.
Kaipiti
Coast, Te
Kauru); 50
(2% -
Wairarapa)
Kapiti Coast District
Kapiti Coast flood
Numeric modelling - 2D of Kapiti Coast
2012
100
None
Council
maps
catchments
Westport 1% AEP
Gerris numeric modelling - including
NIWA
2011
100
None
flood
stopbanks
under the Official Information Act 1982
Released
38
