

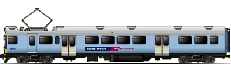
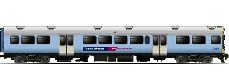
Real Time Information
Project Background
• Contract for design, supply, installation and mainteance
(5 years, extendable) awarded Sept 2009 to ACIS (now
Vix) with local partners Kordia
® and subcontractors
• To cover Metlink bus and rail networks (450 buses, 98
trains), 250 display signs
• Integration with Metlink website, mobile web, SCATS
traffic light priority
• Real Time Information was implemented on bus services
in the region 2010-2012


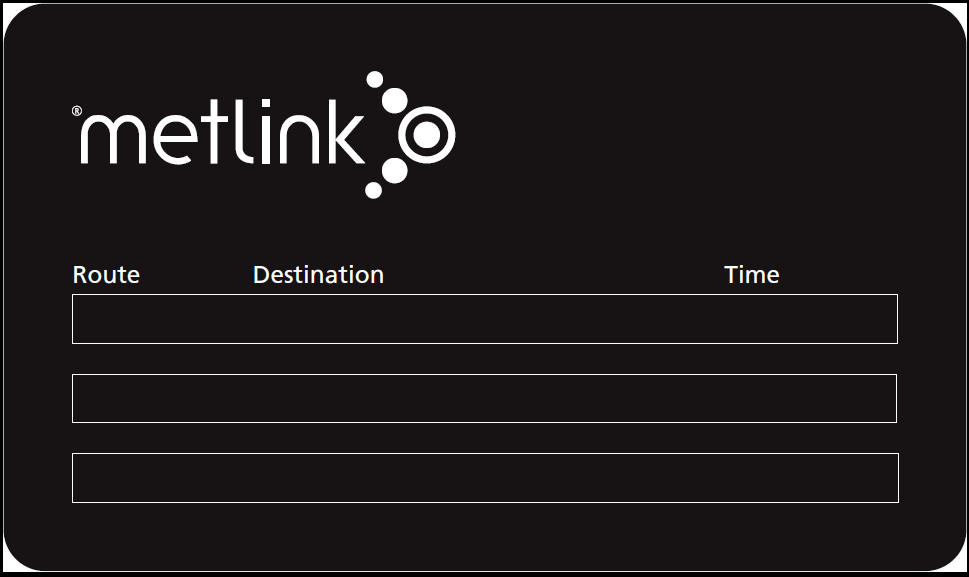
RTI Media
• Street and station display signs with audio
• Total of 250 display signs for installation across the
region
• 60 on railway station platforms (excl Wellington
Station, Kenepuru, Matarawa, Maymorn and Otaki)
• Indoor display screens
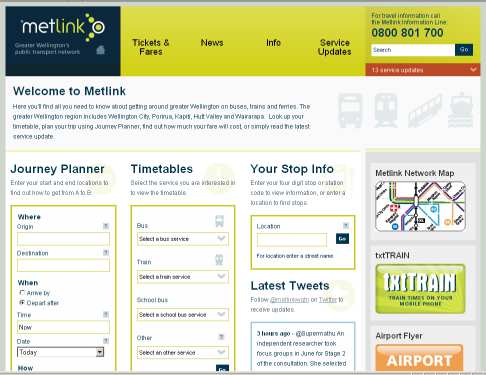
• Metlink website, mobile website
• Integration with Metlink journey planner, Google Transit
and third party apps to come


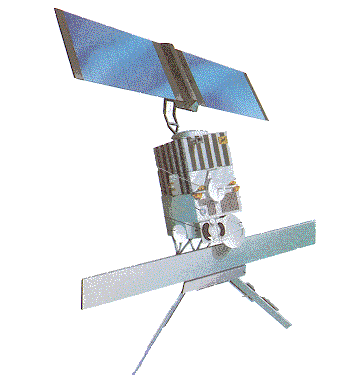


 Trains with ‘KMC’ equipment
GPS satellite
Mobile phone network
KiwiRail Networks (KUPE)
Operational Mgt System (OMS)
TranzMetro
Service linking
Operator Interface
(messaging etc)
Webservice; (i) train position (ii) linked service
Vix interface
GWRC
Vix RTI central system
Metlink website
Destination Service Time
WELL All stops Due
Mobile website
WAIK Ltd Stops 5 min
Bus replacements on Sunday
Journey Planner
Station display signs
Google maps
Third parties
Trains with ‘KMC’ equipment
GPS satellite
Mobile phone network
KiwiRail Networks (KUPE)
Operational Mgt System (OMS)
TranzMetro
Service linking
Operator Interface
(messaging etc)
Webservice; (i) train position (ii) linked service
Vix interface
GWRC
Vix RTI central system
Metlink website
Destination Service Time
WELL All stops Due
Mobile website
WAIK Ltd Stops 5 min
Bus replacements on Sunday
Journey Planner
Station display signs
Google maps
Third parties


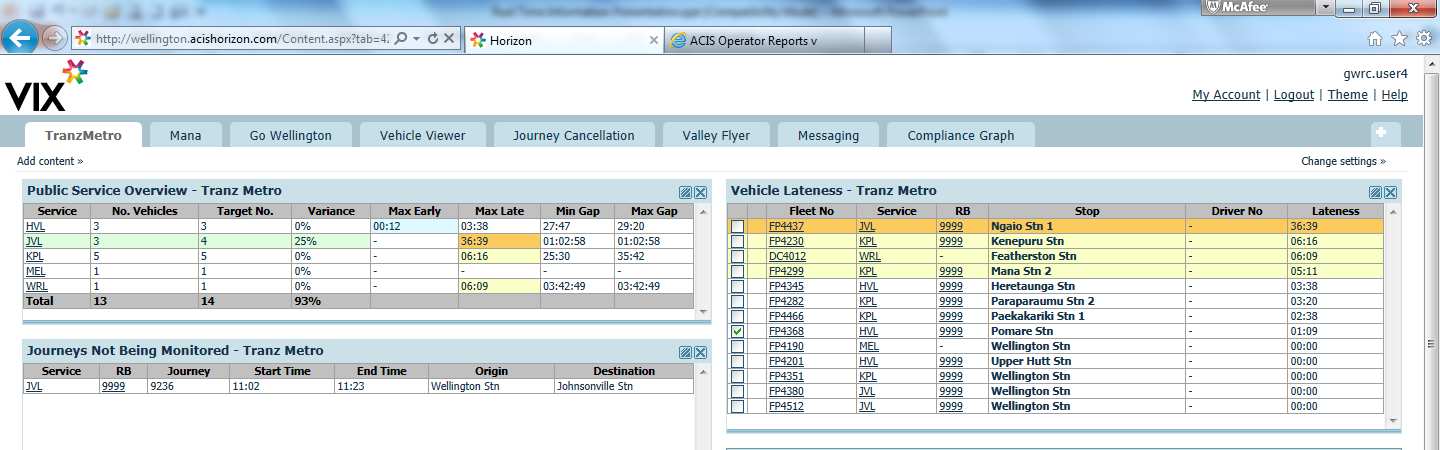
Vix Horizon web interface
Management by KiwiRail of daily activity


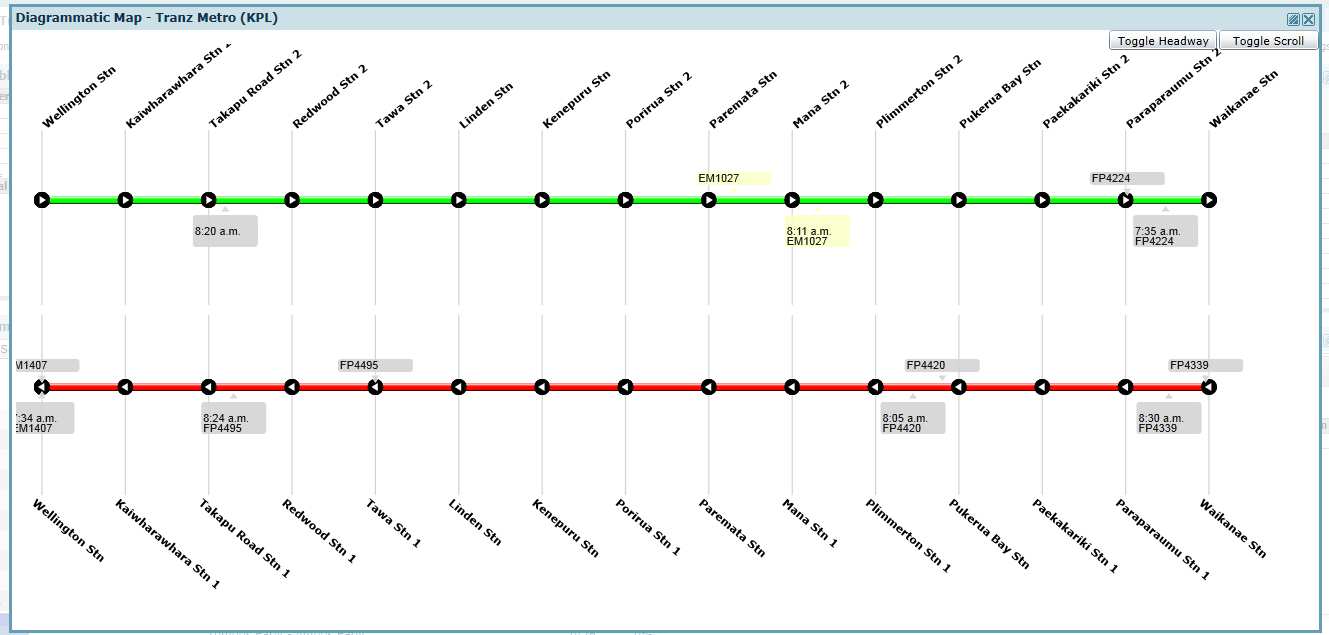
Diagrammatic Map shows by line the position on each line of
each train compared to schedule as a diagram


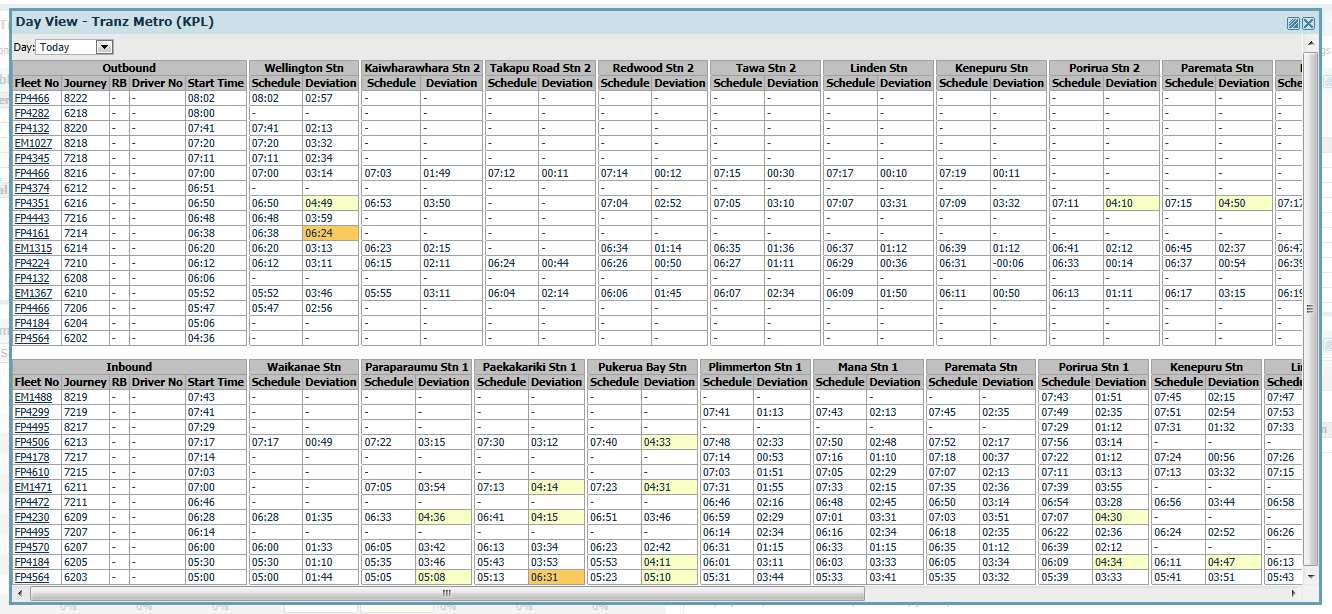
Day View shows by line the position on each line of each train
compared to schedule as a table


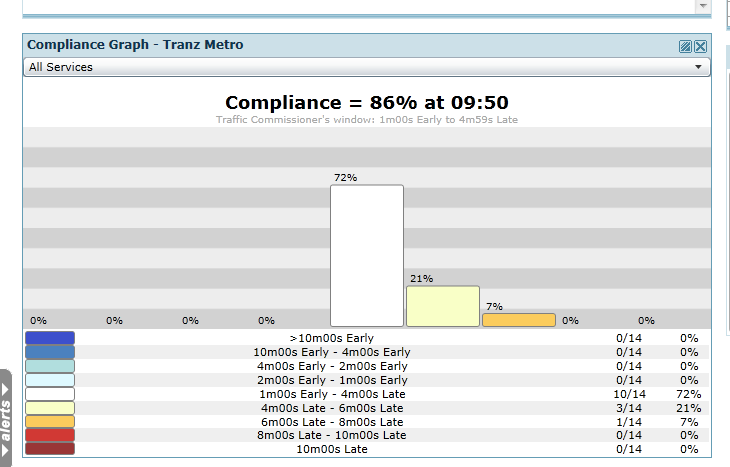
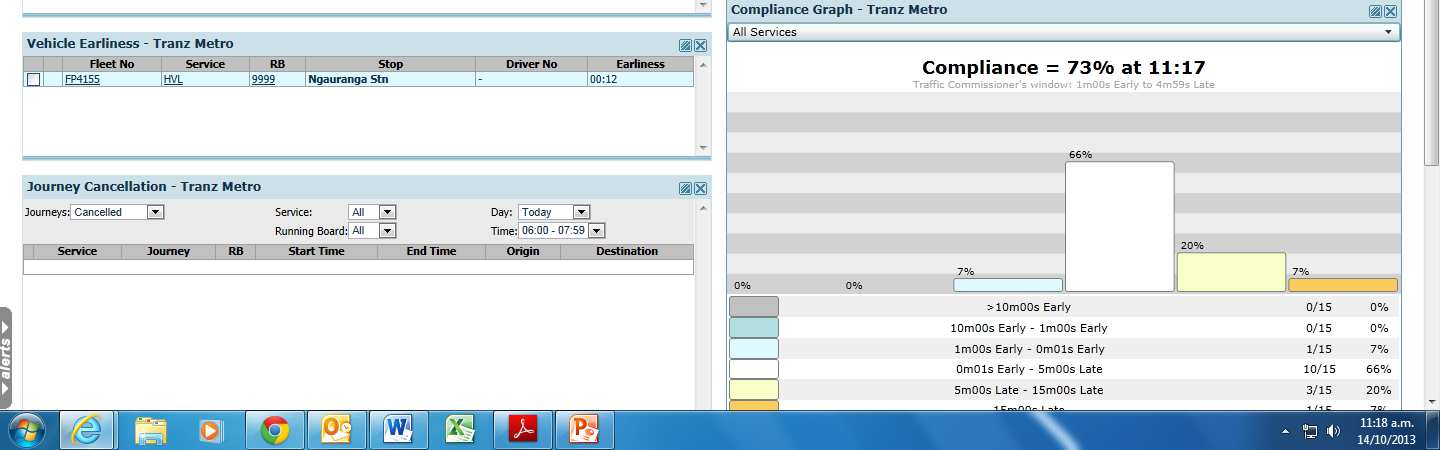
On-time Performance at a glance with customisable time bands


Management of service tracking and performance


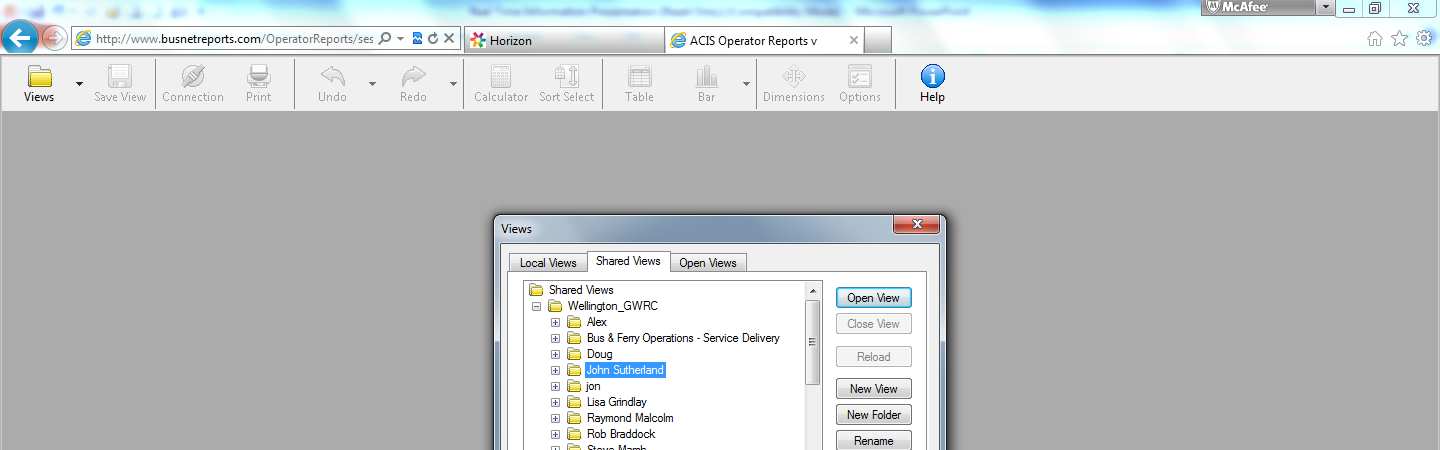
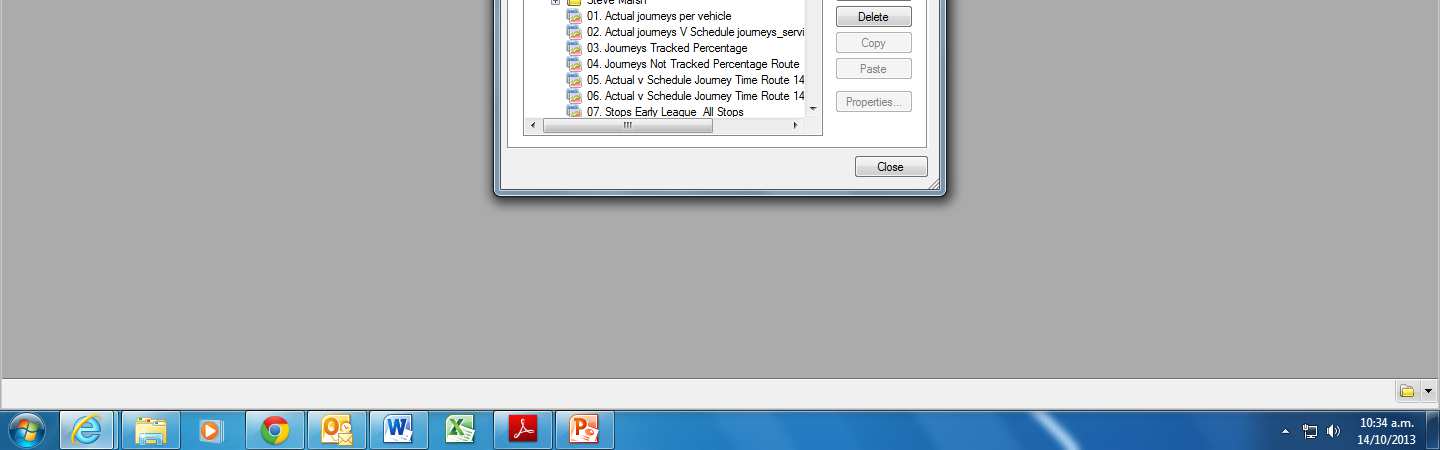


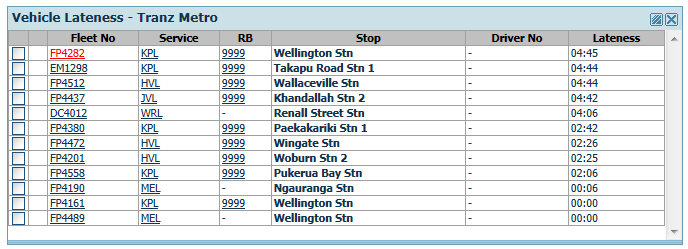
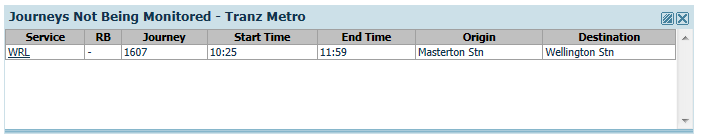
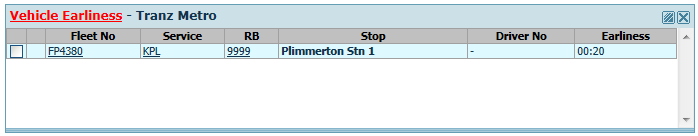
Operator Reports web interface
Database provides access to all RTI data


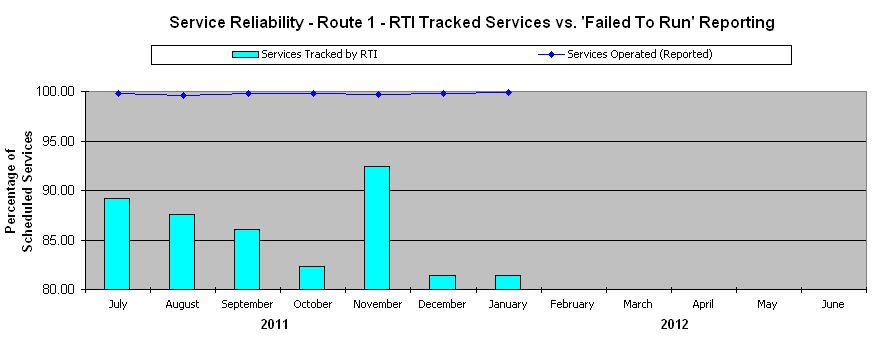

Service Quality Monitoring and Improvement
•
Enables early identification of
Network Performance issues
•
Easily identifies trends and areas to
focus attention on
•
Assists in investigations of
complaints
•
Provides accountability for reporting
by Operators;
•
Enables accurate reporting on
Operator Performance
•
Identifies timetable issues vs.
performance issues


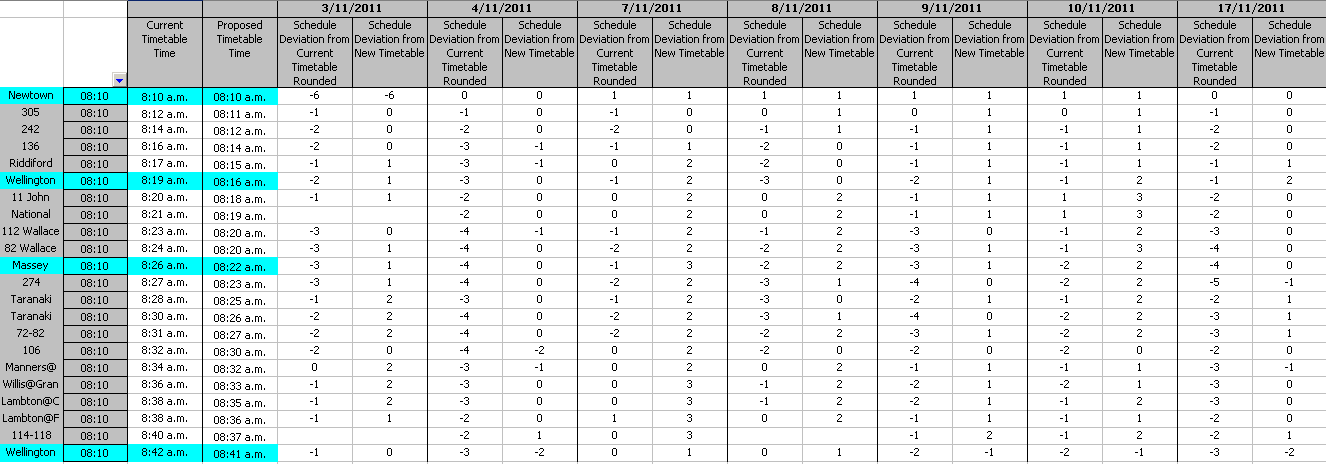
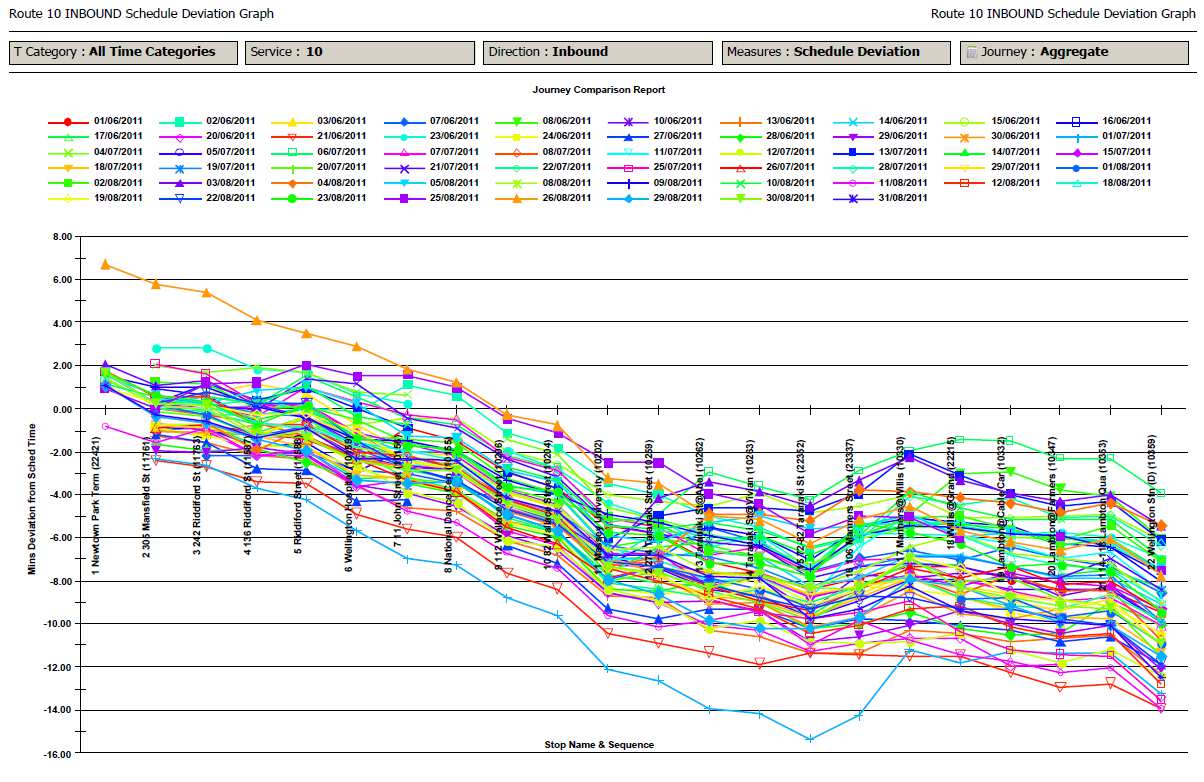
Schedule Optimisation
OUTBOUND - Route 10 - 18:15 - Control Chart
•
Easily identifies timetable issues
Schedule Deviation against Current Timetable
12.5
1
and operating trends within
10.0
11
1
1 111
1 1
1
individual routes
n
7.5
1
1 1
1
1
1
io
UCL=6.90
t
ia
v
5.0
e
D
_
le
X=3.21
•
Provides accurate daily data on
u
2.5
d
e
h
c
S
0.0
LCL=-0.48
individual journey running times
1
1
1
-2.5
1
1
1 111
to inform new timetables
-5.0
1
1 1
1
7
13
19
25
31
37
43
49
55
61
Observation
•
Enables pre-validation of
OUTBOUND - Route 10 - 18:15 - Control Chart
Schedule Deviation against New Timetable
12.5
proposed new timetables
10.0
n
7.5
•
Final process still being
io
t
1
ia
1
v
5.0
e
UCL=4.74
D
developed
le
u
2.5
d
_
e
X=1.40
h
c
S
0.0
LCL=-1.95
-2.5
1
1 1
-5.0
1
7
13
19
25
31
37
43
49
55
61
Observation