
 Operator Reports 2.n
User Guide
GS0897 Issue 12
Operator Reports 2.n
User Guide
GS0897 Issue 12
Copyright
The BusNet software and this documentation are copyright materials. No part of the BusNet
software or documentation may be reproduced, transmitted, transcribed, stored in a retrieval
system or translated into any language, or computer language, in any form or by any means
without the prior written permission of Advanced Communications & Information Systems
Ltd.
Advanced Communications & Information Systems Ltd specifically retains title to all BusNet
computer software. The software described in this guide is furnished under a licence
agreement and may only be installed, used, or copied in accordance with the terms of that
agreement.
BusNet is a trademark of Advanced Communications & Information Systems Ltd. All other
product names are trademarks of their respective owners.
The information in this guide is believed to be correct as of the date of publication. However,
our policy is one of continuous development and so the information in this guide is subject to
change without notice, and does not represent a commitment on the part of Advanced
Communications & Information Systems Ltd.
Copyright 2005 - 2010 Advanced Communications & Information Systems Ltd. All rights
reserved.
Page ii
Contents
About ACIS................................................................................................................................v
Contact ......................................................................................................................................v
BusNet system overview ........................................................................................................vi
Related documentation.........................................................................................................viii
Conventions...........................................................................................................................viii
1.
Introduction ....................................................................................................................1
2.
Getting started................................................................................................................3
Before you start................................................................................................................3
Starting Operator Reports ................................................................................................3
3.
Understanding components .........................................................................................5
Dimensions in Operator Reports......................................................................................5
Measures in Operator Reports.........................................................................................9
4.
Using Executive Viewer...............................................................................................13
Create View/Folder ........................................................................................................13
Working with views.........................................................................................................14
Selecting members displayed ........................................................................................16
Initial member selection ............................................................................................16
Selecting members individually.................................................................................17
Selecting members by group ....................................................................................19
Moving dimensions ........................................................................................................20
Stacking dimensions ......................................................................................................21
Showing and hiding dimensions ....................................................................................23
Suppressing missing rows or columns...........................................................................25
Working with tables and charts ......................................................................................26
Displaying a table and chart at the same time..........................................................26
Creating a chart.........................................................................................................26
Page iii
Creating a chart over stacked dimensions ............................................................... 28
Adding calculations........................................................................................................ 29
Printing and exporting sheets ........................................................................................ 31
5.
Report templates ......................................................................................................... 33
Opening reports............................................................................................................. 34
Service Compliance report ............................................................................................ 35
Daily Service Performance reports................................................................................ 36
Journey Tracked Analysis report................................................................................... 37
Journey Time report ...................................................................................................... 38
Journey Comparison report ........................................................................................... 39
Page iv
About ACIS
Since its formation almost 10 years ago, ACIS’ innovative and dynamic forward thinking has
turned it into one of Europe’s leading suppliers of Real Time Passenger Information (RTPI)
and Bus Operator fleet management. Dedicated to the improvement of public transport
through technology, it is the UK's biggest provider of traffic signal priority systems for the
public transport and traffic control sectors, using both General Packet Radio Service (GPRS)
and Private Mobile Radio (PMR) technologies.
ACIS is able to offer a complete package of IT solutions, systems design and configuration,
high-end engineering assembly and installation, project management and delivery, as well
as a dedicated customer services team and vital ongoing maintenance and software support
staff.
The UK-based company employs over 120 people to design, develop, supply and maintain
RTPI systems to Public Transport Operators, Local Governing Authorities, vehicle
manufacturers and passengers. With over 33 major systems across the UK, Holland and
Scandinavia, ACIS tracks over 4000 vehicles and delivers information to over 30,000
information points, both on and off route.
ACIS’ award-winning BusNet product range offers diversity, choice, efficiency and reliable
information solutions. From visual displays to web and mobile communications, ACIS has
taken a lead with its investment in new technologies such as Web, WAP, SMS and voice
messaging. It continues to develop products, investing over £1 million a year on Research
and Development.
Contact
ACIS Head Office
ACIS House,
168 Cowley Road,
Cambridge,
CB4 0DL
Tel: 01223 728700
Support:
Email: [email address]
Page v
 BusNet system overview
BusNet is a real-time solution for managing public transport systems. BusNet consists of a
number of components, linked by either radio and leased lines (PMR) or GPRS, which
together provide a range of benefits for the transport operator, local authorities and the
travelling public.
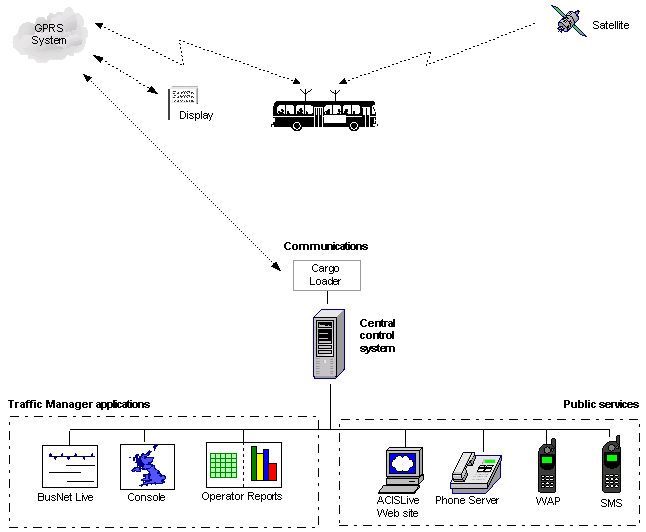
BusNet system overview (GPRS system)
The system is configured by loading service information (for example timetable, service,
vehicle and driver IDs) to the central control system and to equipment on the vehicle.
On-vehicle GPS equipment determines the vehicle's location, and the on-vehicle computer
sends regular location updates and service information to ACIS Cargo Loader, via a third-
party GPRS system, and Cargo Loader passes this information to the central control system.
The central control system uses this vehicle information to plot the vehicle's location against
schedule and service information, and generates arrival-time predictions. It then sends the
arrival-time predictions and schedule information to displays, and makes the same
information available to public web site, telephone, WAP and SMS services.
Web-based user interface components communicate with the central control system in order
to enable operators and managers to access real-time information on the location of vehicles
in their system, as well as historical reports for the services.
Page vi
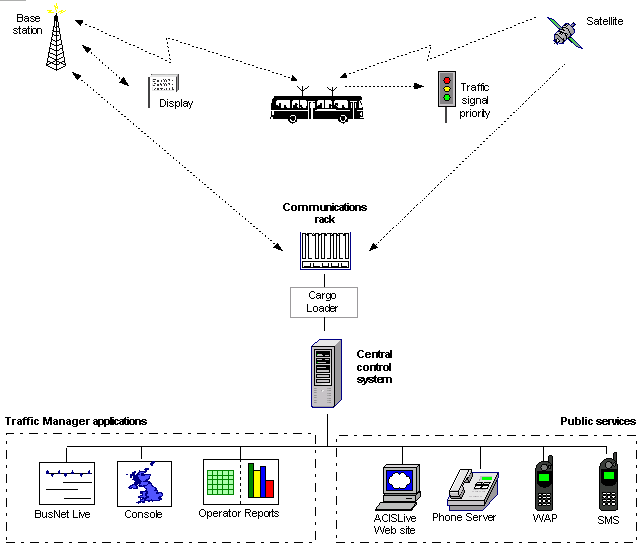 BusNet system overview (PMR system)
The system is configured by loading service information (for example timetable, service,
vehicle and driver IDs) to the central control system, displays and equipment on the vehicle.
On-vehicle GPS equipment determines the vehicle's location, and the on-vehicle computer
sends regular location updates and service information to the communications rack. The
communications rack sends differential GPS (DGPS) updates to the vehicle, which uses
them to make its location calculations more accurate. In addition, the communications rack
sends appropriate priority values to the vehicle, which the vehicle uses to determine whether
to send out a traffic signal priority request.
The communications rack components pass vehicle information to the displays, and the
displays use this information to plot the vehicle's location against schedule and service
information, and generate arrival-time predictions.
The communications rack also passes the vehicle information to the central control system,
over the lease lines, via ACIS' Cargo Loader. The central control system uses this vehicle
information to plot the vehicle's location against schedule and service information, and
generates arrival-time predictions. It then sends the arrival-time predictions and schedule
information to displays, and makes the same information available to public web site,
telephone, WAP and SMS services.
Web-based user interface components communicate with the central control system in order
to enable operators and managers to access real-time information on the location of vehicles
in their system, as well as historical reports for the services.
In a variation on this system, the central control system sends predictions and schedule
information to the displays, and configuration does not need to be loaded to the displays.
Page vii
Related documentation
This document should be used in conjunction with the following documents:
Temtec Executive Viewer User Manual
Full User Manual for Executive Viewer describing all the features in detail.
Conventions
This document employs the following conventions:
Identifies command-line or configuration file input and
Computer typeface
display text.
Indicates parts of input, naming or display text that is
Italic text /
Italic text
replaced with a value appropriate to your system.
Used for emphasis and to highlight the names or
Boldface
content of buttons, fields, check boxes and other
hardware or graphical user interface components.
On the title page, version numbers refer to product version, the GS number (GS0897)
identifies the document in the ACIS system, and issue numbers refer to updates of this
document.
Page viii
Operator Reports 2.n User Guide GS0897 Issue 12
1. Introduction
ACIS produces a suite of reports that provide management information on service
performance for a particular system or operator. This information is available to operators
with vehicles fitted with ACIS hardware via Operator Reports, which enable speedy access
to historical data.
Operator Reports are based on On-Line Analytical Processing (OLAP) as a technology for
creating fast, flexible interactive reports. Operator Reports are produced from data stored in
ACIS Data Warehouse, and are viewed and manipulated using Temtec Executive Viewer
user interface.
About this guide
This document describes some of the features available in Executive Viewer as well as basic
concepts behind Operator Reports and its components, and outlines how you can begin to
customise the reports that ACIS supplies. The content of this guide applies to Operator
Reports version 2.0 and later.
Follow the instructions in the
Getting Started chapter to run Operator Reports your
machine. The
Understanding components chapter provides background information
on how Operator Reports uses Executive Viewer to display reports.
You can then display the supplied template reports. See the
Report templates chapter
for details of the content of these reports, and suggestions on how you can customise
them.
For more background on how to customise the reports, you are recommended to run
through the overview of functionality in the
Using Executive Viewer chapter.
For full details on using Executive Viewer, see the Temtec Executive Viewer User Guide.
Page 1
Operator Reports 2.n User Guide GS0897 Issue 12
2. Getting started
Before you start
Operator Reports is accessed via the Internet. You need the following installed on your local
machine:
Internet Explorer 5.0 or higher
Executive Viewer Client (this can be downloaded as a plug-in first time you run)
You also need the following details, which your system administrator can get from ACIS
Product Support:
User name and password for Operator Reports
URL address / location of the Operator Reports installation
Starting Operator Reports
To start Operator Reports
1. Open Internet Explorer
2. Enter Operator Reports URL address in the address bar.
3. Login page will appear, where you enter you username and password.
4. After you click on ‘Login’ button Executive Viewer Client appears in the browser as an
empty workspace with tool bar at the top. This will be the workspace related to the
username and password that you entered.
Note: If you are running Operator Reports for the very first time, when you press the
Login button the automatic download of the plug-in shall begin, providing that you are
logged on as an with administrator rights.
You are ready to start using Operator Reports.
Page 3
Operator Reports 2.n User Guide GS0897 Issue 12
3. Understanding components
To be able to create different reports and configure ones that are already set up you need
some understanding of the components that Operator Reports is using.
Every report must consist of dimensions and measures and this chapter helps you
understand what they are and how are they set up.
Dimensions in Operator Reports
Dimensions help put the measures in the context and represent the skeleton of the reports.
The dimensions describe numerical data and are used to generate the aggregations. You
could also look at dimensions as an independent list of labels for the reports.
Every dimension has levels, which form a hierarchy within the dimension. For example, in
the
Calendar dimension,
January and
February are members of the
Month level,
2004 and
2005 are members of
Year level. You can use the term members to describe either all the
members in the entire dimension or only the members of a specific level within dimension.
In restricted dimensions the top level will be either
All or
Operator Name depending on user
access rights.
In un-restricted dimensions like
Calendar,
Stop Sequence or
Clock, top level is always
All,
which will include all data related to that dimension.
Following is the list of all dimensions available as well as levels and members within those
dimensions:
Yellow boxes represent additions in the version 2.1.
Dimensions
Levels
Member Properties
Calendar
All Calendar
Dim
Year
Dim
Month
Name
Dim Date
Day Name
Clock
All Clock
Day Time
Depot
All Depots
Operator
Name
Page 5
Operator Reports 2.n User Guide GS0897 Issue 12
Dimensions
Levels
Member Properties
Depot
Name
Direction
All Directions
Direction
Driver (Optional)
All Drivers
Operator Name
Driver No
Journey
All Journeys
Operator
Name
Depot Name
Public Service Code
Journey Start Time
Journey Ref (Optional)
All Journey Refs
Operator Name
Depot Name
Public Service Code
Journey Ref
Operator
All Operators
Operator
Name
Period
All Periods
Fiscal
Year
Dim
Period
Dim
Week
No
Dim Date
Day Name
Period 1 (Optional)
All Periods
Dim Year
Dim Period
Dim Week No
Page 6
Understanding components
Dimensions
Levels
Member Properties
Dim Date
Day Name
Period 2 (Optional)
All Periods
Dim Year
Dim Period
Dim Week No
Dim Date
Day Name
Running Board
All Running Boards
Operator
Name
Depot Name
Running
Board
Service
All Services
Operator
Name
Depot Name
Public Service Code
Member Name
Long Name, PipID
Variation Category
All Variation
Categories
Operator
Name
(Optional)
Variation Group
Variation Category
Mins From, Mins To
Stop
All Stops
County/Area (Optional)
Member Name
Long Name, PipID
Stop Category
All Stop Categories
Stop
Category
Page 7
Operator Reports 2.n User Guide GS0897 Issue 12
Dimensions
Levels
Member Properties
Stops Matched
All Stops Matched
Group
Name
Stop Sequence
All Stop Sequences
Stop Seq No
Stop Type
All Stop Types
Stop Type Group
Stop Type
Time Category
All Time Categories
Operator
Name
Time Category
Time From, Time To
Vehicle
All Vehicles
Operator
Name
Depot Name
Fleet No
LocalVID, Type
Day
All Days
Day Group
Day
Name
Note: Security implemented on cubes is restricting user to view some or all of the levels
within dimensions. Depending on users rights top level within dimension can be restricted to
a particular system or/and operator. For example if Cardiff user is trying to access reports it
will be restricted to Cardiff only and cannot view other systems. Also you could have users
for operator level and only data for that particular operator is visible.
To create your own report or to configure already existing ones, you need to follow
instructions in
Executive Viewer User Manual.
Page 8
Understanding components
Measures in Operator Reports
Measures are often described as summarisable numerical values that you use to monitor
your business. When looking for numerical information, your first question is which measure
do you want to see.
Following is the list of available measures in Operator Reports and short description:
Yellow boxes represent additions in the version 2.1.
Measure
Description
Journey Level Measures
Actual Journeys
Number of journeys tracked.
Note: Journey is classified as tracked if at least 10% of
stop observations are recorded along the journey.
Schedule Journeys
Number of scheduled journeys.
Note: Number of schedule journeys is calculated from
the latest source data provided to ACIS.
Cancelled Journeys
Number of cancelled journeys.
Note: Journey can be cancelled from BusNet Live 2.4
and later.
Part Cancelled Journeys
Number of part cancelled journeys.
Note: Part of the journey can be cancelled from BusNet
Live 2.4 and later.
Journeys Not Tracked
Number of journeys that were not tracked.
Actual Journey Percentage
Percentage of journeys tracked.
Note: This is the percentage of number of journeys
tracked against the number of scheduled journeys.
Not Tracked Percentage
Percentage of journeys not tracked.
Actual Journey Time
Actual time in minutes, bus has taken to complete
journey.
Note: This measure only includes journeys for which
the first and last stop was recorded correctly. Therefore
this measure can be based on less journeys that the
number of tracked journeys.
Page 9
Operator Reports 2.n User Guide GS0897 Issue 12
Scheduled Journey Time
Scheduled time in minutes for bus to complete journey.
Note: This measure only includes journeys for which
the first and last stop was recorded correctly. Therefore
this measure can be based on less journeys that the
number of scheduled journeys.
Maximum Journey Time
Maximum time bus has taken to complete journey.
Stop Level Measures
Observations
Number of times bus reported at the stop.
Maximum Earliness
Maximum bus early time.
Maximum Lateness
Maximum bus late time.
Compliance
Percentage of buses early, on time or late.
(Renamed from EOL Percentage)
Note: To get results using this measure it is necessary
that the variation category is selected or the measure
will not return any results.
Schedule Deviation
Deviation from schedule time of buses at the stop.
Note: This uses departure time for all stops except the
destination, which uses arrival time..
Schedule Run Time
Cumulative schedule run time.
(Renamed from Schedule Stop
Note: It’s the time taken form the beginning of the
Timing)
journey to the particular point along the journey (i.e. to
the particular stop) based on the schedule information.
Actual Run Time
Cumulative actual run time.
(Renamed from Actual Stop
Note: It’s the time taken from the beginning of the
Timing)
journey to the particular point along the journey (i.e. to
the particular stop) based on the actual information.
This records departure time for each stop.
Drive Time
Drive time between two linked stops along the journey.
Note: This time is the time from the departure from one
stop to the arrival at the next. It does not include
stationary time at the stop, only drive time between two
linked stops (these must be consecutive stops).
Page 10
Understanding components
Passenger Waiting Time
Passenger waiting time at the stop.
Note: This time represents the actual frequency of the
buses on the same public service. Because Operator
Reports only collects the data at the stop, this measure
also represents the headway.
Passenger Waiting Time
Deviation from the scheduled frequency.
Deviation
Note: This time represents the deviation from the
specified frequency of the buses on the same public
service. Because Operator Reports only collects the
data at the stop, this measure also represents the
headway deviation. Deviation can be measured only if
the scheduled frequency is provided in the source data.
Dwell Time
Dwell time of the buses at the stops.
Note: This is calculated by taking the difference
between departure and arrival time.
Notes:
These measures are only meaningful if used with correct dimensions. If wrong
dimensions are used to describe the measure you could get misleading information or no
information at all. All measures are available for all users and are not restricted in any
way. For more how to use measures when creating report, refer to
Executive Viewer
User Manual.
Page 11

Operator Reports 2.n User Guide GS0897 Issue 12
4. Using Executive Viewer
Following chapter describes some of the main functionalities within Executive Viewer. For
more functionality areas see the Executive Viewer User Guide.
Create View/Folder
To be able to create new views or folder the user need the right permissions associated with
the username and password. The system administrator or ACIS Product Support can give
these permissions to the user.
To open a new view with connection to a database:
1. Start Executive Viewer (follow the
Starting Operator Reports instructions in the
Getting Started chapter).
2. Click on the
Views button.
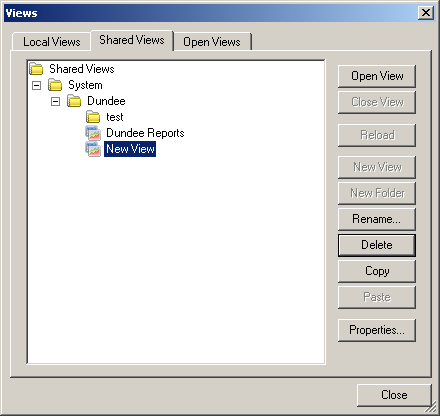
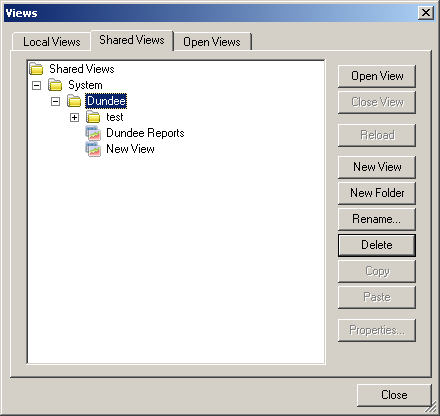
3. The
Views dialogue is displayed. Highlight where you want to store the new view and
click on
New View. New view is created under the generic name. At this point you may
decide to rename the view.
Page 13
Operator Reports 2.n User Guide GS0897 Issue 12
4. To create new folder highlight where you want to store the folder and click on the
New
Folder. New folder is created under the generic name. At this point you may decide to
rename the folder.
Working with views
To open, rename or delete a view/folder:
1. Start Executive Viewer (follow the
Starting Operator Reports instructions in the
Getting Started chapter).
2. Click on the
Views button.
3. The
Views dialogue is displayed.
4. Select a view name or folder name from the
Shared Views area.
To open a view: Click on the
Open View button. The view is opened. Also you
can double click on any view or folder to open it.
Page 14
Using Executive Viewer
To rename a view/folder: Click on the
Rename button. The view/folder name is
highlighted for you to enter the name for the view. Click outside of the view
name to save it.
To delete a view/folder: Click on the
Delete button. You are prompted to
confirm that you want to delete the view/folder. Click on
Yes to continue.
To copy a view: Highlight the view you wish to copy and click on the
Copy button. Then highlight the folder to which you want to save the copy and click on
the
Paste button. The copy of the view is created with the generic name. You
can choose to rename the view at this point. You can also copy views from
shared area into local area using this option.
The ability to copy views to another folder has been designed for those who prepare
views for use by others. By placing these views under the shared views they can give
others the benefit of prior preparation and analysis. Users can then copy shared views to
their local views and modify them according to their individual needs.
Page 15
Operator Reports 2.n User Guide GS0897 Issue 12
Selecting members displayed
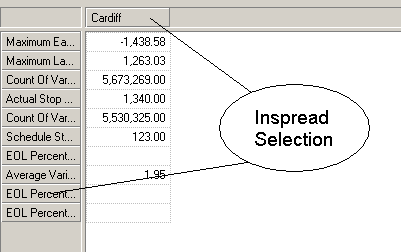
Initial member selection
When a database is initially opened, one dimension is put in the columns and measures are
put in the rows. This is known as the Inspread selection.
Executive Viewer displays the first dimensions in the OLAP database outline order in the
rows and the columns.
The default member of these dimensions will be selected.
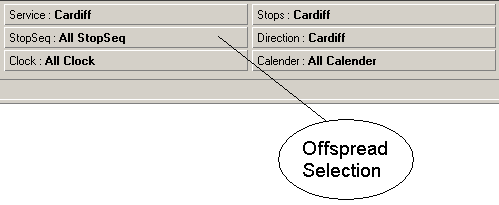
The other dimensions are placed in the Offspread area. The members selected in these
dimensions are the default members.
Note: Multiple Hierarchy dimensions are ignored when initially opening a database to
simplify the initial view.
Page 16
Using Executive Viewer
Selecting members individually
To select members individually:
1. Open a view. (See
Working with views section.)
2. Click on a member from a row or column.
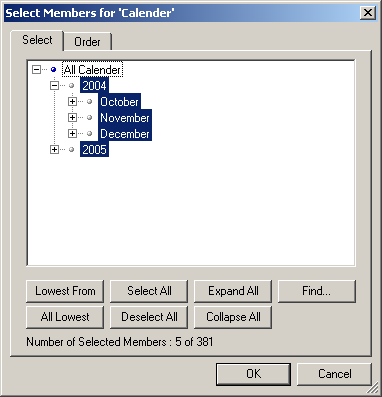
3. The
Select Members dialogue is displayed.
Click on a member's name to select it. Click on a selected member's name to deselect it.
(Selected members are highlighted.)
Notes:
You can expand or collapse the outline by clicking on the
+ or
– symbols or on
the
Expand All or
Collapse All buttons. When a member is selected and you
click the
+ symbol, the children will be selected as well.
To select all members from a dimension, click on the
Select All button.
To deselect all members, click on the
Deselect All button. This comes in handy
for a totally new selection.
To select all lowest members from a dimension, click on the
All Lowest button.
Page 17
Operator Reports 2.n User Guide GS0897 Issue 12
To select the lowest members below a particular member, select that member
(don't forget to deselect all members first), then click on the
Lowest From button.
For details of the
Find button, see the
Advanced Member Selection chapter of
the
Executive Viewer User Guide.
Page 18
Using Executive Viewer
Selecting members by group
To select members by group:
1. Open a view. (See
Working with views section.)
2. Click on a member from a row or column.
3. The
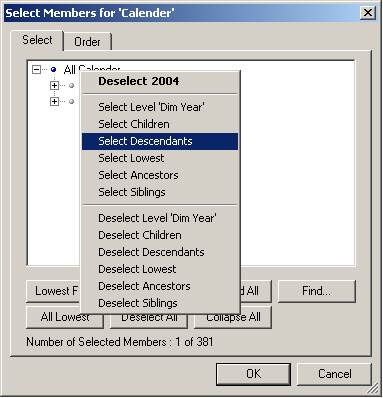
Select Members dialogue is displayed. Right-click on a member to display a list of
group selection options.
4. Click on one of the following options for the members you want to select:
Select Level LevelName (selects members of the same level)
Select Children (selects members one level below)
Select Descendants (selects members of all levels below)
Select Lowest
Select Ancestors (select members of all levels upwards)
Select Siblings (select members of the same level with the same parent)
Alternatively, you can deselect a group by clicking on the corresponding
Deselect options.
Page 19
Operator Reports 2.n User Guide GS0897 Issue 12
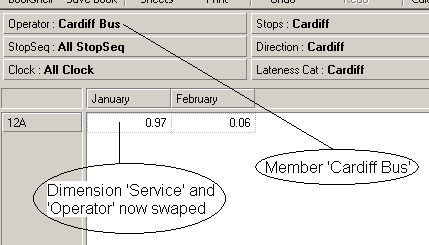
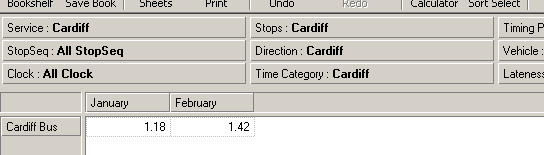
Moving dimensions
Drag the dimension from the column to the Offspread area, by clicking on the member with
your primary mouse button and dragging and releasing the mouse button on the member
you want to put in the columns.
The member you move remains selected. When dragging a dimension Inspread (the area of
the table with rows and columns), the previous member selection in that dimension is
displayed.
This means you can move dimensions around without losing any member selection.
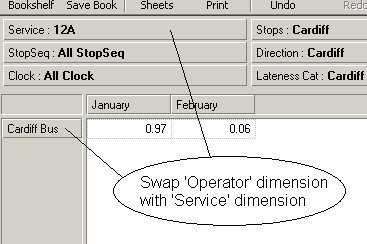
The dimension
Service is now swapped with the dimension
Operator. Note that the member
we used to swap the two dimensions (
Cardiff Bus from the
Operator dimension) remains
the selected member in the Offspread area.
Note: You can also drag and drop dimensions in a chart. See the
Charts chapter in the
Executive Viewer User Guide for more information.
Page 20
Using Executive Viewer
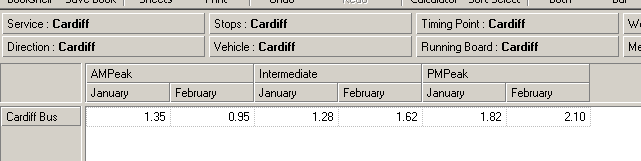
Stacking dimensions
The examples in this section assume you have opened an Operator Reports view.
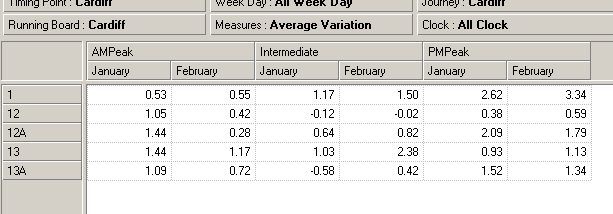
Example 1:
In the following example, we stack the
Time Category dimension on top of the
Calendar dimension to display the
AMPeak,
Intermediate and
PMPeak values for
January-
February, for operator
Cardiff Bus.
1. Click on the
Time Category dimension and hold the mouse button down.
2. Drag
the
Time Category dimension to the top part of column headers and release the
mouse button when the cursor displays the symbol.
3. A blue line is displayed on top or bottom of the
Calendar dimension, depending on
where you want to stack the members (if the
Calendar dimension is entirely blue-lined,
you will swap these dimensions).
4. Release the mouse button.
5. The screen now looks like this:
Note: In this example, the members
AMPeak,
Intermediate and
PMPeak are selected
because they were previously selected in the Inspread. For more details on member
selection, see the
Basic Member Selection chapter of the
Executive Viewer User
Guide.
Page 21
Operator Reports 2.n User Guide GS0897 Issue 12
Example 2:
You can also stack dimensions in rows. In this example, we stack the
Service dimension to
the right of the
Operator dimension.
1. Click on the
Service dimension and hold the mouse button down.
2. Drag
the
Service dimension to the
Operator dimension until the cursor displays the
symbol.
3. A blue line is displayed on the left or right of the
Operator dimension, depending on
where you want to stack the members (if the
Operator dimension is entirely blue- lined,
you will swap these dimensions).
4. Release the mouse button to stack the two dimensions.
5. The screen now looks like this:
Page 22
Using Executive Viewer
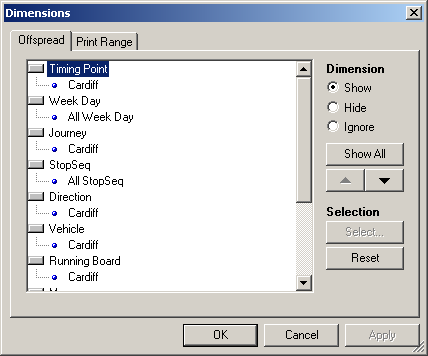
Showing and hiding dimensions
To determine which dimensions are visible on your screen:
1. Open a view. (See
Working with views section.)
2. Right-click on the table and select
Dimensions.
3. The
Dimensions dialogue is displayed.
4. You can now change which dimensions are displayed:
To show or hide a particular dimension: Click on the dimension to select it,
then select
Show or
Hide from the
Dimension option list on the right of the
dialogue. (For information about ignoring dimensions, see the
Advanced
Navigation chapter of the
Executive Viewer User Guide.)
To show all dimensions: Click on the
Show All button.
To change the order that dimensions are displayed: Click on a dimension to
select it, then click on the Up or Down arrows on the right of the dialogue.
To specify which members of a dimension to select Offspread: Click on a
member of the dimension to select it, then click on the
Select button. The
Select Offspread Member for DimensionName dialogue is displayed, and
you can select the members and click on
OK.
To revert to the dimensions displayed when the database was opened:
Click on the
Reset button. (See the
Basic Member Selection chapter of the
Page 23
Operator Reports 2.n User Guide GS0897 Issue 12
Executive Viewer User Guide for more information about the member
selection when a database is initially opened.)
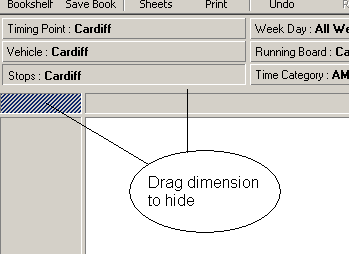
Alternative way to hide dimensions:
You can also hide dimensions by dragging it to the empty space at the top of the rows.
Page 24
Using Executive Viewer
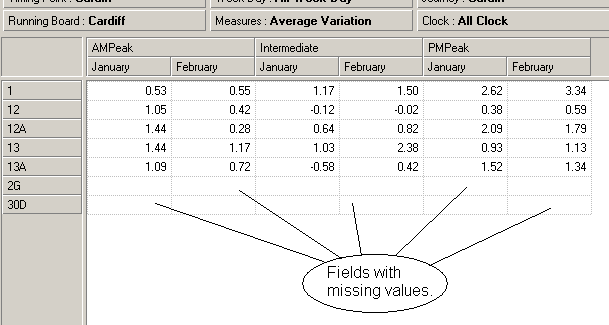
Suppressing missing rows or columns
When all values in a row and/or column are missing you can automatically suppress these
rows and/or columns from your display.
To suppress missing rows or columns:
1. Open a view. (See
Working with views section.)
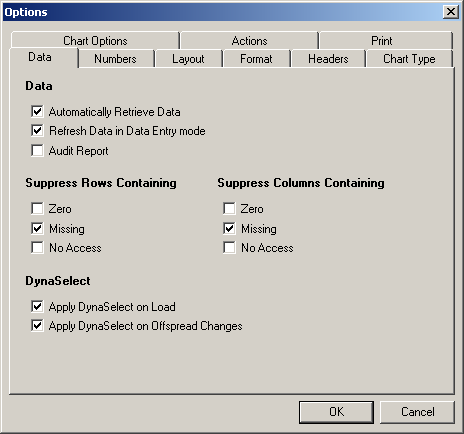
2. Right-click and select
Options.
The
Options dialogue is displayed.
Page 25
Operator Reports 2.n User Guide GS0897 Issue 12
3. On
the
Data tab, check the
Missing box from either or both of the
Suppress Rows
Containing and
Suppress Columns containing lists of options.
Note: In the case of stacked dimensions, this option can result in an asymmetrical view.
To make an asymmetrical selection, use the
Remove Missing Rows/Columns from
Selection option. See the
Data Selection chapter of the
Executive Viewer User Guide for more details.
4. Click
on
OK. The missing rows of columns are now suppressed from the selection:
Working with tables and charts
Displaying a table and chart at the same time
To display both a table and a chart on one screen:
1. Open a view. (See
Working with views section.)
2. Right-click on the current table or chart, and select
View As Table and Chart.
3. The screen will be divided in two sections, one showing the table and one showing the
chart
You can change the size of the table or the chart by dragging the splitter in the middle of
the screen to the required position.
Creating a chart
To create a chart:
1. Open a view. (See
Working with views section.)
Page 26
Using Executive Viewer
2. Select the members you want to display as a chart. For example, select the
Average
Variation value of five services over two months.
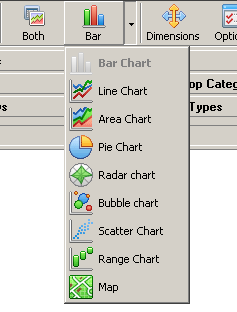
3. Click the Chart button on the toolbar to display your data as a chart. (This button is
labeled with the type of chart currently selected:
Use the drop-down list on this button to select the chart type that you want to display.
4. You can now edit your chart:
To add new members to the chart: Click on a member to display the
Select
Members dialogue. Select the members to display, then click on
OK. (See the
Selecting members displayed section for details.)
The members are added to the chart.
To change to a table view: Click on the Table button on the tool bar. Your table
will change accordingly when you select new members for the chart.
Note: You can still select other members in the Offspread dimensions when you have a
chart on screen. This means that you can display the same chart easily for different
member combinations.
Page 27

Operator Reports 2.n User Guide GS0897 Issue 12
Creating a chart over stacked dimensions
When your table has stacked dimensions in rows or in columns, the chart will be based on
the most inner dimensions.
The outer dimensions are moved to the bottom of the chart sheet with the selected members
retained.
Page 28
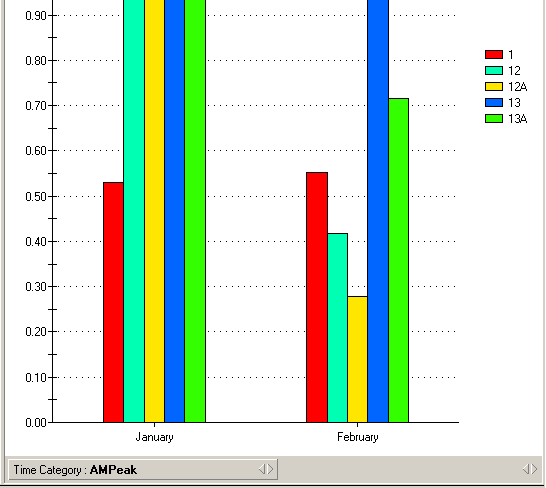
Using Executive Viewer
Example:
In this example, the table has both a
Calendar and
Time Category, where
Time Category is stacked on
Calendar (as in the table screenshot earlier in this section). The chart displays
the months, by
Calendar, with the
Time Category as selection members in the bottom
section of the chart (the Chart Bar), with the first member selected (in this case,
AMPeak). ,
If you click on the name of the
Time Category the
Select Members dialogue is
displayed, and you can display the chart for other members in the dimension.
To move to the next
Time Category: Click on the arrows next to the name in the
Chart Bar
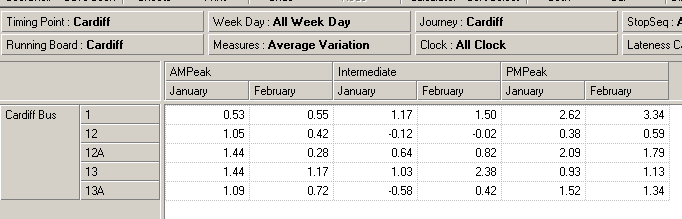
Adding calculations
To add a new calculation:
1. Open a view. (See
Working with views section.)
2. Click on the
Calculator button in the toolbar.
3. You can now use the calculator for your calculation.
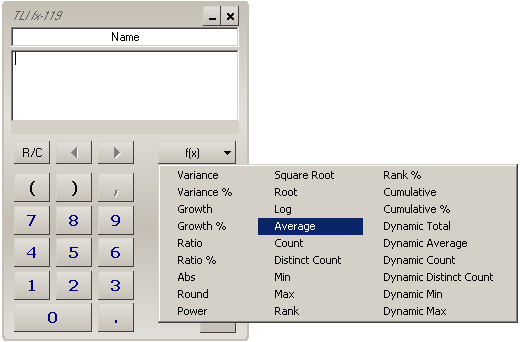
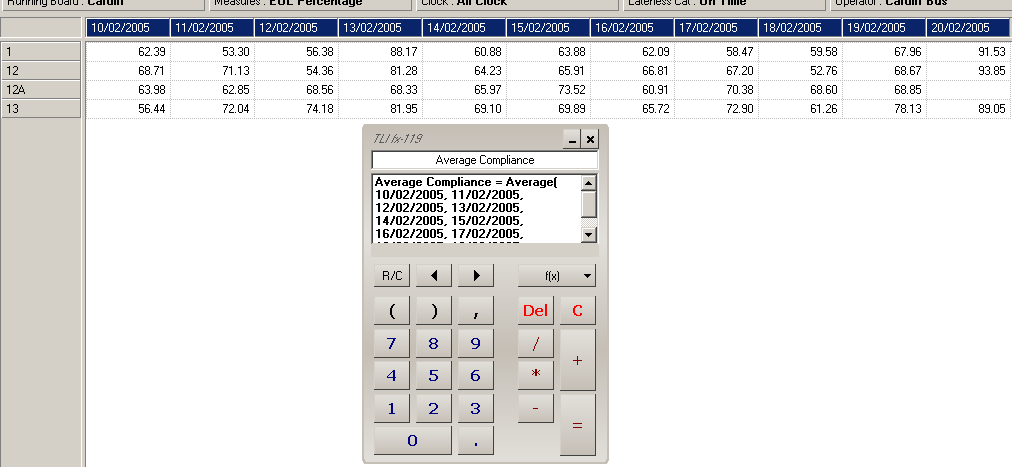
Example calculation:
As an example we want to get average compliance percentage over the period of 10
days (between 10/02/2005 and 20.02/2005) for services 1, 12, 12A and 13 (see the table
screenshot later in this section for a view of the table displayed).
To calculate:
i. Click
on
f(x) (functions) button, and select
Average from the list of functions.
ii.
On the sheet, click on all members between
10/02/2005 and
20/02/2005.
iii. In the name area at the top of the calculator, change the name of the calculation
to
Average Compliance.
iv. Click on the
= button to perform the calculation.
Page 29
Operator Reports 2.n User Guide GS0897 Issue 12
v.
Click on the
x at the top of the calculator to close it.
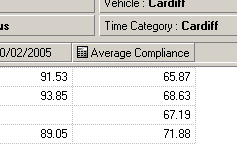
4. The calculation is added to your table.
A new member called
Average Compliance is added to the columns and shows the
average compliance percentage over the period you selected for services 1, 12, 12A and
13.
When you save the view, the calculation is stored, so that it is available when you re-
open the view later. The calculation is added to the dimension as a member, but will only
appear on this sheet. (Note that on the
Select Members dialogue, calculations are
included at the end of the list.)
Notes: Calculations you add can be used like any other member. They can be formatted,
moved, used in other calculations or used in the Offspread. Calculations do not have a
Level or Generation.
If you do not press the
+ button or any other of the operator buttons between two
members or values, a plus sign will be added automatically.
Page 30
Using Executive Viewer
Printing and exporting sheets
You can print sheets or export to PDF or Excel.
To print or export a sheet to PDF:
1. Open a view. (See
Working with views section.)
2. Click on the
Print button on the tool bar.
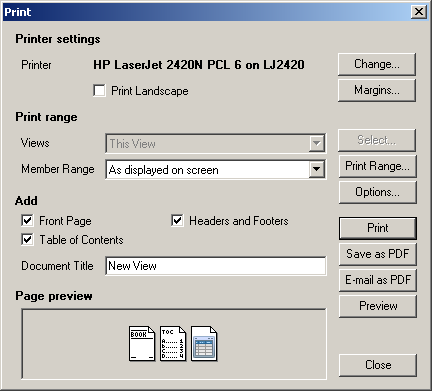
3. The
Print dialogue is displayed.
4. From
the
Views drop-down list, select the views that you want to print out (the options
are
This View,
Some Views (if you choose this option you are prompted to select the
views to print),
All Views).
You can also select a member range if you don't want to print the same members as
displayed on the screen.
5. From
the
Add options, check or uncheck the boxes to specify whether you want to
include a
Front Page,
Table of Contents or
Headers and Footers in the print-out.
Page 31
Operator Reports 2.n User Guide GS0897 Issue 12
6. You can now print or export your selection:
To print: Click on the
Print button.
To export to PDF: Click on the
Save as PDF button.
To export to PDF and email it: Click on the
E-mail as PDF button.
To export to Microsoft Excel:
1. Open a view. (See
Working with views section.)
2. Right-click on the sheet tab (at the bottom of the window), and select
Export To Excel
Workbook.
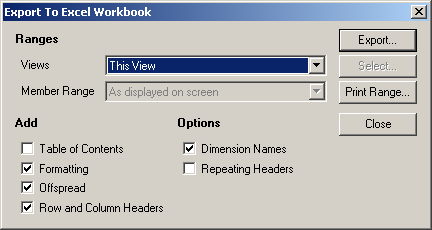
3. The
Export to Excel Workbook dialogue is displayed.
4. From
the
Views drop-down list, select the views that you want to print out (the options
are
This View,
Some Views (if you choose this option you are prompted to select the
views to print),
All Views).
You can also select a member range if you don't want to print the same members as
displayed on the screen.
5. Check or uncheck the
Add and
Options boxes to specify what you want to include in
the export.
6. Click on the
Export button to export your selection.
Page 32
Operator Reports 2.n User Guide GS0897 Issue 12
5. Report templates
Once you open Operator Reports you can see the following reports available as views in the
template folder.
Service Compliance
percentage of Compliant Departures per Service
Daily Service Performance
percentage of vehicles early, on time or late
Journey Tracked Analysis
observed journeys as a percentage of scheduled journeys
Journey Time
average journey time per Service
Journey Comparison
variance from scheduled time for each stop on a journey
Week Day Comparison
variance from scheduled time for each stop on journey, compared by day of the
week
Journey Survey
journey performance shown as time progression of the journey at each stop for
each day over a specified period of time
Ad Hoc Reports template reports set up for you to customise
These reports are built from report templates that ACIS supplies. For more information on
how to customise reports or add your own reports, see the
Executive Viewer chapter.
Page 33
Operator Reports 2.n User Guide GS0897 Issue 12
Opening reports
To open a report:
1. Click
on
Views and select
Shared Views tab.
2. A list of available views is displayed under the Template folder. These views have been
created by ACIS as template reports and can be changed by valid user to suite their
needs.
3. Select a view or entire folder and double click to open.
4. Operator
Reports
opens,
and you can see the following reports available as views tabs
at the bottom of the screen:
Service
Compliance
Daily Service Performance
Journey Tracked Analysis
Journey
Time
Journey
Comparison
Week Day Comparison
Journey
Survey
Ad Hoc Report (empty report)
These reports are built from report templates supplied with Operator Reports. See the
Template Reports chapter for details of how you can customise the reports.
5. Click on a tab to view the report.
Page 34
Report templates
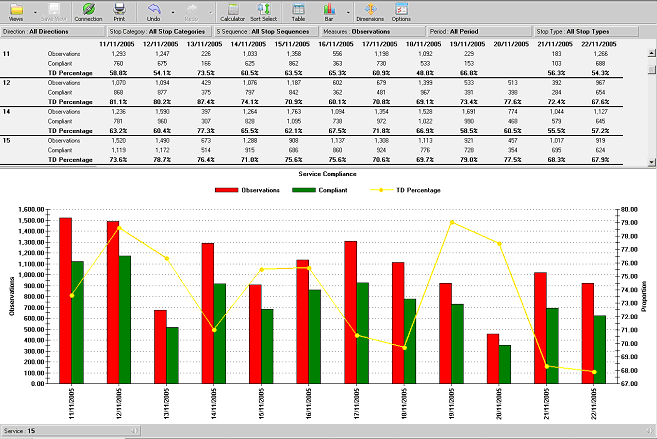
Service Compliance report
This report lists for each Service the count of observations, count and percentage of
Compliant Observations (Compliant refers to
On Time observations; the time range for
On Time is configurable).
This report gives an immediate view of the performance of each Service for the specified
dates. The bar chart that the report displays concerns for a single Public Service. You can
click on left and right arrows on the
Service dimension at the bottom of the chart (e.g.
Service: 27 in the example) to scroll between services.
The additional filters available to
Page 35
Operator Reports 2.n User Guide GS0897 Issue 12
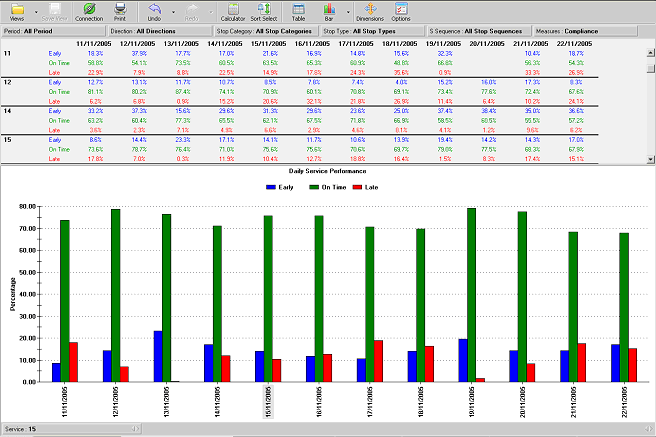
Daily Service Performance reports
This report illustrates:
percentage of Vehicles Early
percentage of Vehicles Late
percentage of Vehicles On Time
The report gives a summary of all services, which can be broken down to each Service. The
report covers every vehicle and every stop listed in the stop sequences and therefore
provides an unsurpassable level of service monitoring.
Page 36
Report templates
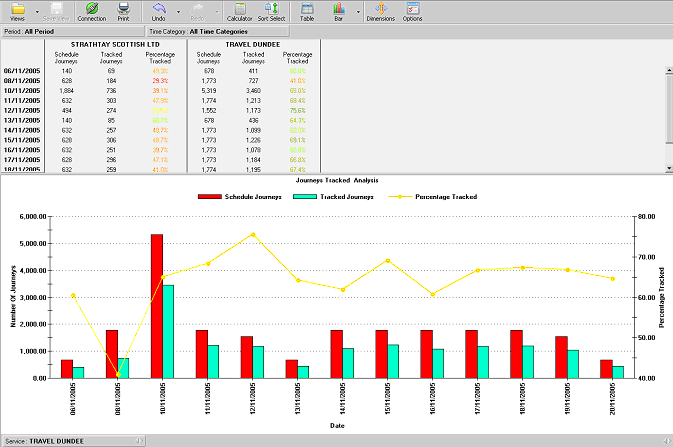
Journey Tracked Analysis report
This report produces a table and chart, which list the number of scheduled journeys
compared to the number of actual journeys (i.e. journeys that have more than 25% of route
tracked by BUSNET) and percentage, which have been observed during the different days.
Periods of the day are part of Time Category, which is specified by the customer. This can
be used to split the report down to the times of the day.
The report is for the specified period of time and is configurable.
The report displays a bar chart per operator or service. You can click on left and right arrows
on the
Service dimension at the bottom of the chart (Service: First) to scroll between
operators or services.
Page 37
Operator Reports 2.n User Guide GS0897 Issue 12
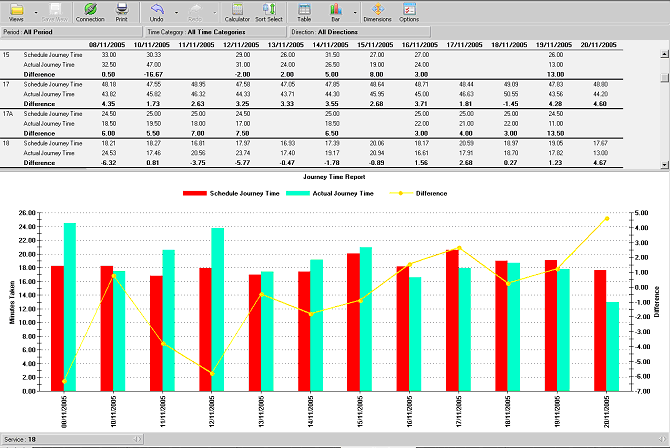
Journey Time report
This report displays a bar chart that shows the actual journey time against schedule journey
time for particular Operator or Service for each day in defined period.
The secondary line displays the difference between actual and schedule journey time.
Actual journey time will be an average of complete journeys (i.e. first and last stop picked up)
for the selected service or operator. And schedule journey time is average of the same
journeys that are included in the actual journey time.
This report displays a bar chart per Public Service. You can click on left and right arrows on
the
Service dimension at the bottom of the chart (Service: 50 in the example) to scroll
between services.
Page 38
Report templates
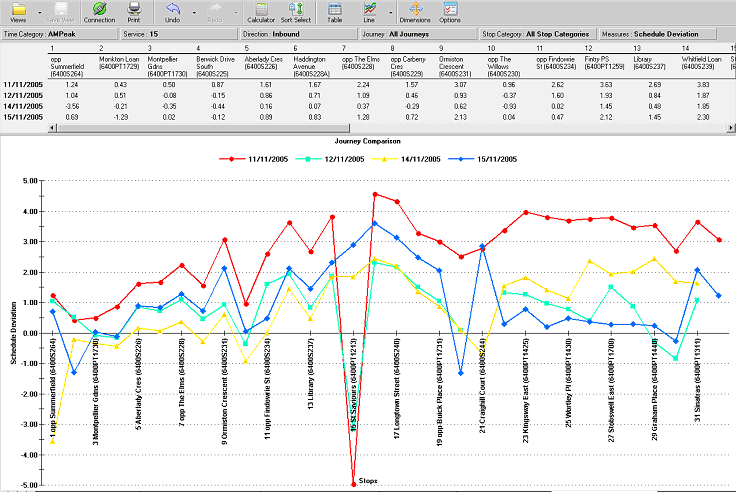
Journey Comparison report
This report is a line chart that compares performance of the journey by logging the number of
minutes of variance to the scheduled time at each stop on the journey. It is useful for
determining the spread of running time between stops and the performance of the journey on
a particular day.
This report displays line chart per service or journey and each line represent different date.
Using Direction dimension the user can filter the service to one direction only.
Periods of the day are part of Time Category, which is specified by the customer. This can
be used to group the journeys for a particular service by the periods of the day (E.g. AM
Peak).
Page 39
Operator Reports 2.n User Guide GS0897 Issue 12
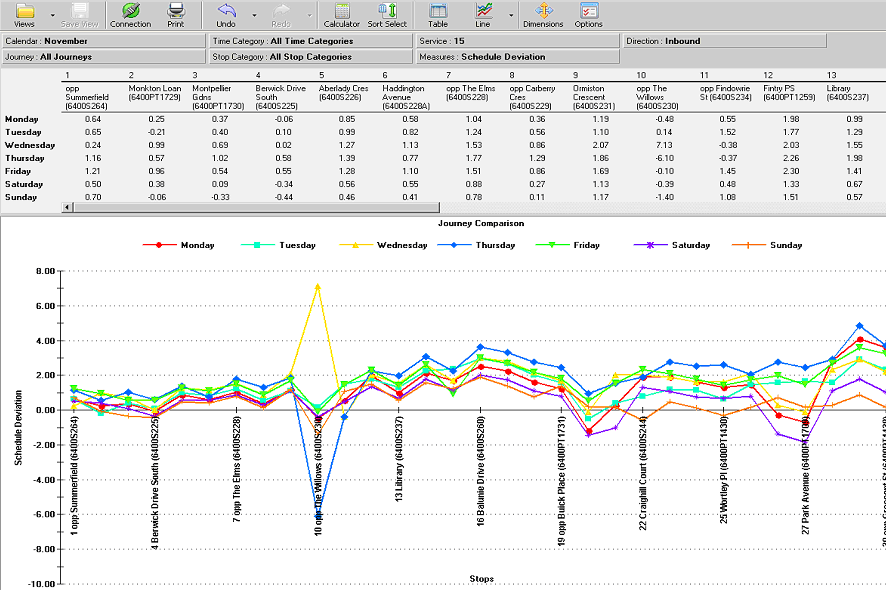
Week Day Comparison report
Like the Journey Comparison report, this report is a line chart that compares performance of
service or journey by logging the number of minutes of deviation to the scheduled time at
each stop on the journey; in addition, the Week Day Compliance report includes a
comparison by day of the week.
Each line on the chart reflects the average time of all the journeys on a particular day of the
week. The report is useful for showing whether such events as period ticket sales on
Monday or late night shopping day cause delays to buses, that do not occur on the other
days in the week.
Page 40
Report templates
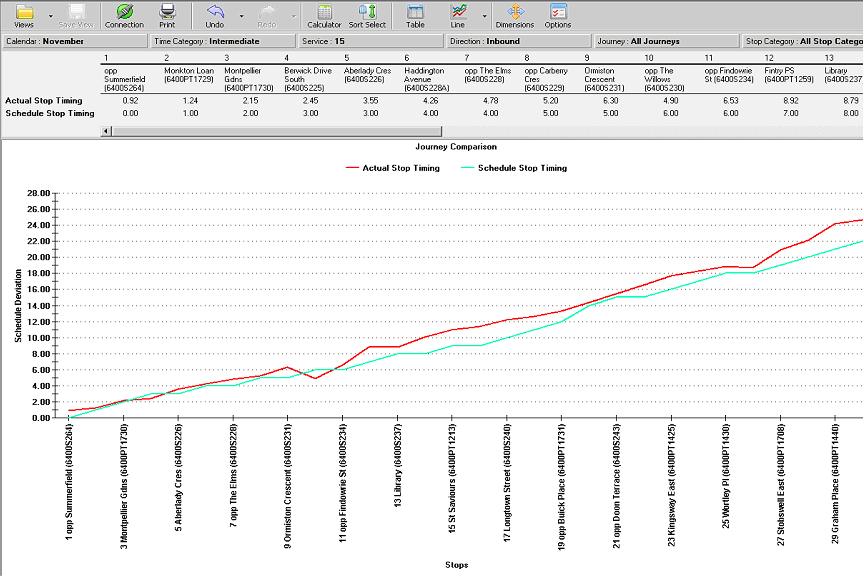
Journey Survey report
This report shows how a particular journey or service has operated by showing the actual
time progression of the journey against the schedule timings at each stop for each day in the
specified period of time. A steep incline suggests that bus was delayed, whereas a flat line
suggests the bus moved quickly between stops. The “ideal” line is a smooth diagonal line
that is almost identical as the schedule stop timings.
This report displays line chart. You can click on the
Calendar dimension at the top of the
report (Calendar: November in the example) to change dates.
Page 41