Particulate Matter Synopsis
within the Mount Maunganui Airshed
Background
Particulate matter is a common proxy indicator for air pollution. It affects more people than any
other pollutant. Particulate matter consists of a complex mixture of solid and liquid particles of
organic and inorganic substances suspended in the air. While particles with a diameter of 10
microns or less, (≤ PM10) can penetrate and lodge deep inside the lungs, the even more health-
damaging particles are those with a diameter of 2.5 microns or less, (≤ PM2.5). PM2.5 can
penetrate the lung barrier and enter the blood system. Chronic exposure to particles
contributes to the risk of developing cardiovascular and respiratory diseases, as well as of
lung cancer1.
Particulate Matter Sources within Mount Maunganui Airshed
Anthropogenic and natural particulate matter sources are always present within the Airshed.
Contributions of each will vary depending on temporal and spatial factors, along with levels of
activity and meteorological drivers. Cumulative situations may also arise whereby multiple
sources contribute to measured levels and on occasions the introduction of seemingly a small
source may result in elevated levels of concern.
Some examples of anthropogenic sources are -
Shipping emissions from energy systems,
Vehicle emissions such as road surface wear, tyre wear, brake wear, unsecure/”dirty”
loads, and exhaust emissions,
Aviation emissions from start-up, taxiing and take-off and landing, approach and
departure,
Train emissions from locomotive and shunting plant along with emissions from rail
corridors,
Industrial/commercial emissions from stacks and fugitive sources,
Port activities may include some aspects of the other items, but also material handling,
stockpile areas and open areas,
Construction and demolition activities,
Unsealed yards,
Grounds maintenance, such as at Blake Park,
Secondary particles formed from precursor aerosols,
Some storage facilities.
1 https://www.who.int/news-room/fact-sheets/detail/ambient-(outdoor)-air-quality-and-health
Some examples of natural sources are -
Sea spray particles
Crustal matter such as soil, beach system sediments, exposed estuary tidal flats.
Pollen/spores
Bush fire particles and dust from Australia.
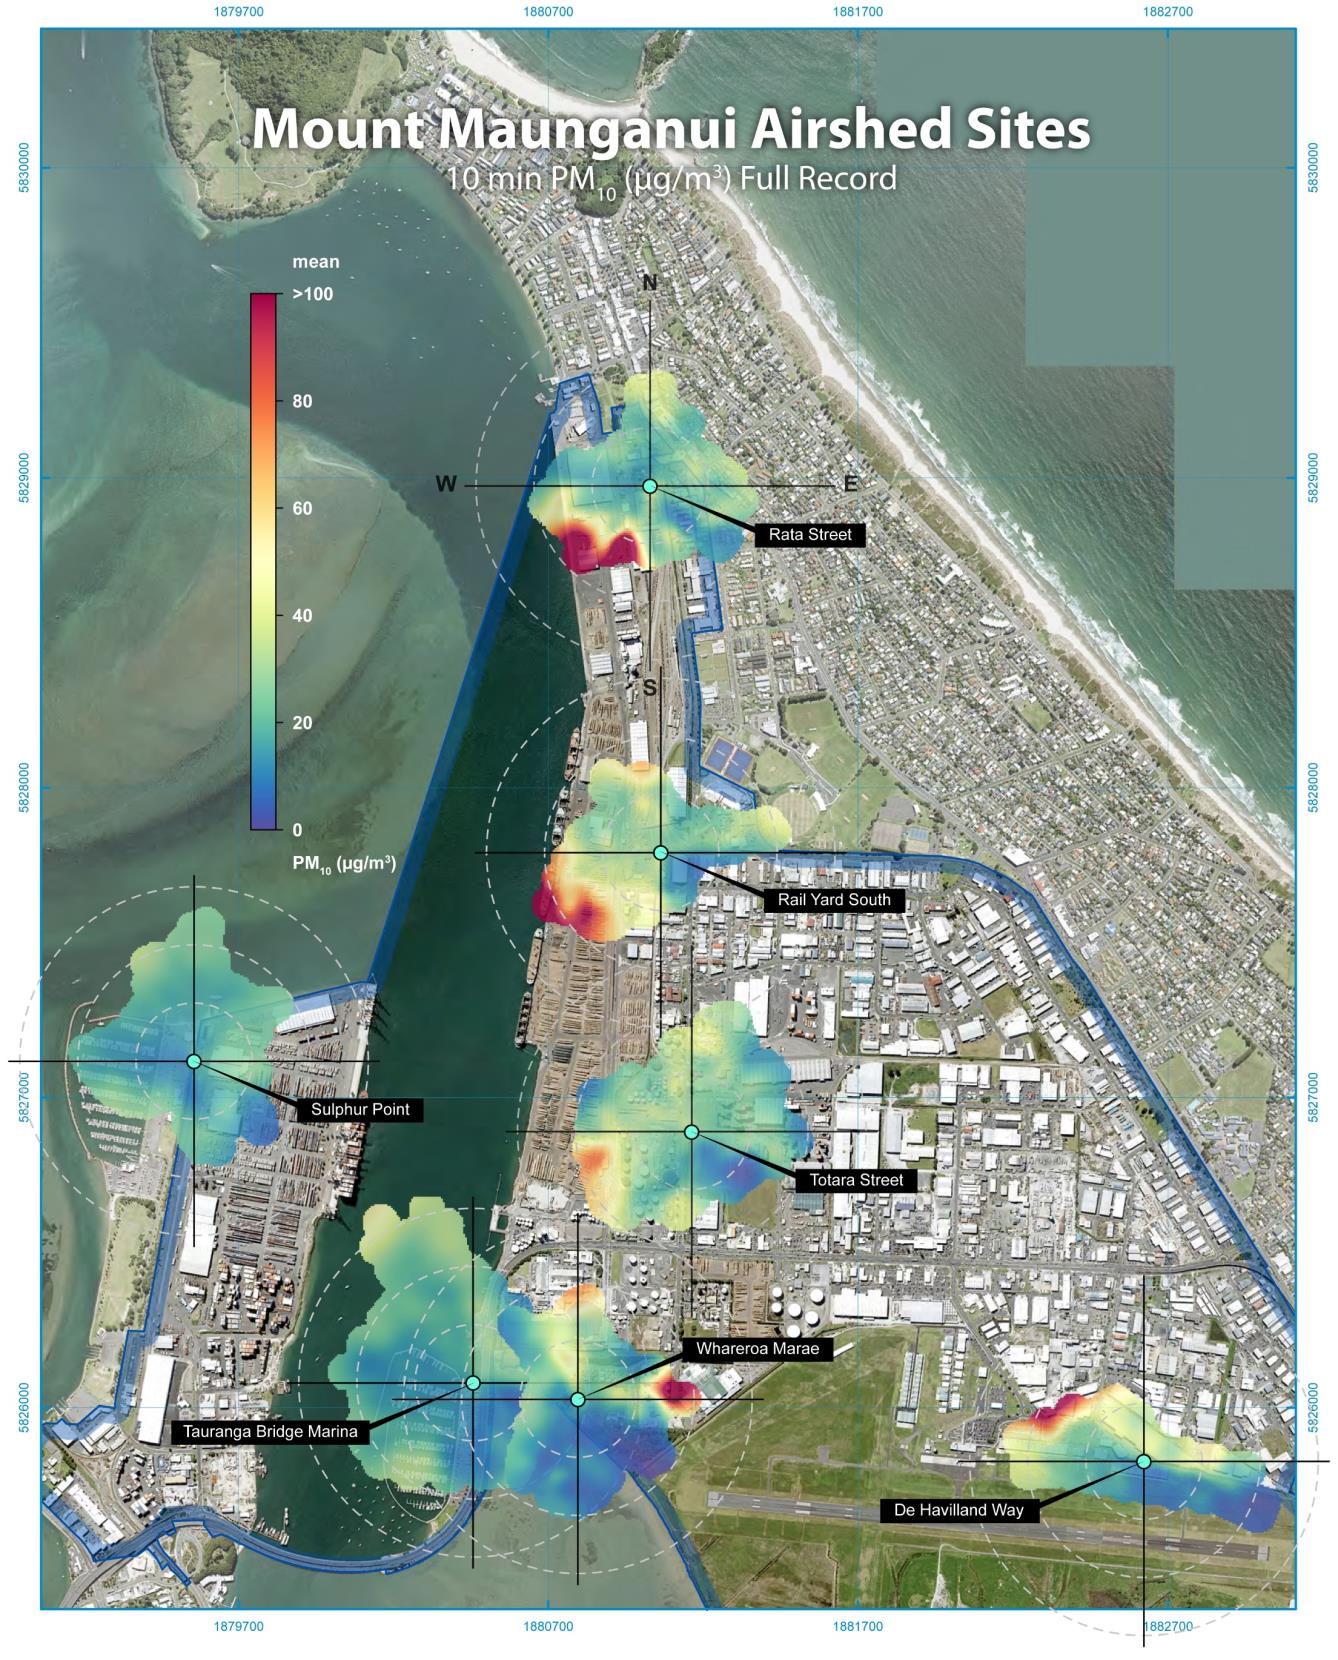 Particulate Matter Data for PM10 sites within Mount Maunganui Airshed
Figure –
Particulate Matter Data for PM10 sites within Mount Maunganui Airshed
Figure – Polar plots using 10 minute data indicate where elevated PM10 can originate from.
Council publications related to the Mount Airshed
Atmospheric Science Global Ltd., 2018,
A Meteorological Assessment and Development of a
3-Dimensional Meteorological Model for Air Quality Applications in the Tauranga Region for
2014, 2015 and 2016. Report prepared for the Bay of Plenty Regional Council.
Atmospheric Science Global Ltd, 2018,
Maximum Industrial Emission Limit Testing (MEL)
Modelling - Results for 1-hour and 24-hour SO2 for 2014, 2015 and 2016. Report prepared for
the Bay of Plenty Regional Council.
Atmospheric Science Global Ltd, 2018,
Continuous Emission Modelling and SO2 removals.
Results for 10-minute, 1-hour and 24- hour SO2 for 2014, 2015 and 2016 from Industry,
Airport, White Island, Shipping and Road Traffic. Report prepared for Bay of Plenty Regional
Council.
Atmospheric Science Global Ltd, 2019,
Addendum Document on the Comparison of two
Independent SO2 Emission Inventories for the Tauranga (2018) and Tauranga/Mount
Maunganui Area (2014 -2016). Report prepared for the Bay of Plenty Regional Council.
Bay of Plenty Regional Council, 2019,
Tauranga Moana, State of the Environment Report
2019, Environmental Publication 2019/04, 104p.
Emission Impossible, 2017,
2016 Dust Audit: Port of Tauranga, Client: Bay of Plenty Regional
Council, 58p.
Environet, 2018,
Tauranga Air Emission Inventory 2018, Prepared for Bay of Plenty Regional
Council, Prepared by Emily Wilton, Environet Ltd and John Iseli, Specialist Environmental
Services.
Iremonger, S.D., 2010,
Mount Maunganui ambient sulphur dioxide monitoring, Environmental
Publication 2011/03, Bay of Plenty Regional Council, ISSN: 1179-9471 (Online), 44p.
Iremonger, S.D., 2012,
Mount Maunganui Dust Monitoring, Environmental Publication
2012/04, Environment Bay of Plenty, ISSN: 1175 9372 (Print), 179p.
Iremonger, S.D., 2012,
A review of odour properties of H2S - Odour Threshold Investigation
2012, Bay of Plenty Regional Council, Environmental Publication 2012/06, ISSN: 1175-9372.
Iremonger, S.D., 2016,
Air Quality Monitoring, Dust and Sulphur Dioxide Levels, Bay of Plenty
Regional Council Snapshot Report.
Iremonger, S.D. & Mackay, M., 2020,
Ambient Air Quality Data Update 2020, Bay of Plenty
Regional Council Environmental Publication 2020/03, ISSN:1175-9471, 184p.
New Zealand Gazette, 2019
, Bay of Plenty Regional Airshed Notice, 2019, Dated at
Wellington this 17th day of October 2019, HON NANAIA MAHUTA, Associate Minister for the
Environment, 2019-go4960.
