 Overall
The number of approved SAC applications has increased year on year, since 2015 it has
increased by
218.7% - going from 6,843 applications in 2015 to 21,810 applications in 2024.
SAC Applications (Condition group)
SAC applications are broken down into 4 condition groupings of Sensory, Medical, Physical and
Learning. An application can exist in multiple groupings, with one being in both Sensory and
Learning for example.
Of the 21,810 applications (in 2024):
- 773 (3.5%) are Sensory
- 6,557 (30.1%) are Medical
- 1,595 (7.3%) are Physical
- 12,942 (59.3%) are Learning
The grouping which has increased the most in terms of counts of approved applications is
Medical – which has increased by 343.3% between 2015 and 2024, this is 1.56 times faster than
baseline. All other groupings have increased slower than baseline
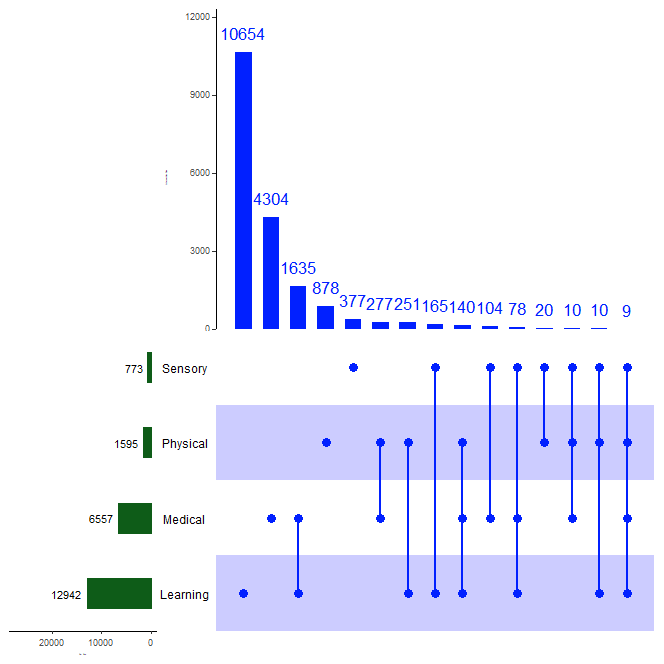
The below upset graph shows the usage of these groupings in 2024 (The blue figures at the top
are counts of applications within the combinations of groupings, while the counts by the green
bars refer to the counts of applications in each of the groupings (total)
It shows us that of the 5 most common combinations, 4 of them are instances where a SAC
application only falls into a singular condition group. The only ‘popular’ grouping which has
multiple conditions is Medical + Learning. These patterns seen in the graph have remained
relatively consistent since 2015 figures. It is important to note that schools are not required to
necessarily indicate all possible di iculties a student is facing when an application is made.
They are asked to focus on the key issue(s) that need to be addressed for the student to receive
the most appropriate SAC. Therefore this “grouping” data needs to be interpreted with care -
and not overinterpreted.
SAC Applications (Conditions)
The 4 condition groupings are made up of conditions in the below table. All of these have existed
for the past 10 years besides Illegible Writing (since 2020) and Independent Declaration (since
2018).
Sensory Conditions
Medical Conditions
Physical Conditions
Learning Conditions
Vision
AƩenƟon Deficit
Arm Hand
School Evidence
Hearing
AuƟsm
Back Leg
Independent Assessment
Depression
Head
Independent DeclaraƟon
Diabetes
Dyspraxia
Epilepsy
Muscular Neuro
ToureƩe’s
Cerebral Palsy
Other
Pregnancy
Illegible WriƟng
Using the overall 10-year increase of 318.7% as a baseline and only looking at conditions which
have at least 100 applications within them (in 2024), the following conditions have increased at
a rate higher than that of the baseline (between 2015 and 2024).
Medical
- Attention Deficit has increased 726.9% (from 275 to 2,274), this is at a rate 3.31 times
faster than baseline.
- Depression has increased 563.0% (from 408 to 2,705), this is at a rate 2.57 times faster
than baseline.
- Autism has increased 321.4% (from 344 to 1,449), this is at a rate 1.46 times faster than
baseline.
- Tourette’s has increased 304.0% (from 25 to 101), this is at a rate 1.39 times faster than
baseline.
Learning
- School Evidence has increased 583.5% (from 1,410 to 9,638), this is at a rate 2.66 times
faster than baseline.
- It is also worth noting that Independent Assessment has decreased (from 3,896 to
1,882) this is likely explained when coupled with the increase in School Evidence, where
schools have taken more an involved role in identification of SAC within their learners
seeing a move away from independent assessment identifying SAC learners.
It is also of note that a few conditions haven’t followed the patterns of increasing year on year
from 2015 to 2024. ‘Arm Hand’ and ‘Head’ conditions seemed to peak in 2021 and have since
decreased.
Extra Investigation
Of the types of medical conditions, it appears that Attention Deficit and Mental Health have
seen the largest proportional increases in the past 10 years. The ethnicity breakdown of these
learners shows that over the past 10 years, while still being the largest proportion of learners,
European ethnicity is the only decreasing demographic (from 82.5% of all Attention Deficit
learners in 2015 to 75.9% in 2024) + (from 82.6% of all Depression learners in 2015 to 73.0% in
2024).
All other ethnicities have increased which aligns with what was seen in the following ethnicity
breakdowns, a few increases of note.
- Pacific Peoples proportion in Depression learners has increased by 1.85 times since
2015 from 2.5% to 4.7%; should be noted that the population is small (11 to 151
learners)
- Māori learners make up the second largest ethnicity population for both specified
conditions, for Depression the proportion has increased 1.4 times from 9.6% to 13.9%
(42 to 449 learners).
- MELAA and Other Ethnicities see the largest proportional increases of 3.4 times and 2.7
times for Depression – but the population is so small it likely doesn’t hold much weight
(2 to 51 for MELAA and 2 to 40 for Other). For example, the same ethnicities have
increases of 1.7 and 3.7 times for Attention Deficit – the large discrepancies are
explained by starting population of 3 for MELAA and 1 for Other, highlighting the fact
these figures should not hold much weight.
Ethnicity
When looking at the how counts and rates of SAC applications has changed (since 2015),
broken down by ethnicity, we see di erences between rates of increase of uptake of SAC
between them.
The rates of increase and how they compare to baseline are for the largest ethnicities are:
- Māori learners’ uptake of SAC applications has increased by 414.6% (from 800 to 4,117)
this is at a rate 1.89 times faster than baseline
- Pacific learners’ uptake of SAC applications has increased by 493.0% (from 258 to
1,530) this is at a rate 2.25 times faster than baseline
- Asian learners’ uptake of SAC applications has increased by 631.3% (from 198 to 1,448)
this is at a rate 2.88 times faster than baseline
- European learners’ uptake of SAC applications has increased by 203.9% (from 6,009 to
18,200) this is at a rate 0.93 times as fast as baseline
EQI Group
When looking at the how counts and rates of SAC applications has changed (since 2019),
broken down by Equity Index Group, we see di erences between rates of increase of uptake of
SAC between them.
This data only goes back to 2019 as the backdating of EQI groups don’t go past that year.
The rates of increase and how they compare to 2019 figures for EQI Groups are:
- Fewer EQI Group learners’ uptake of SAC applications has increased by 64.3% (from
3,992 to 6,560)
- Moderate EQI Group learners’ uptake of SAC applications has increased by 91.3% (from
5,782 to 11,060)
- More learners’ uptake of SAC applications has increased by 120.3% (from 1,078 to
2,375)
- Unassigned Learners’ uptake of SAC applications has increased by 28.2% (from 1,600 to
1,815)
Approved SAC Applications by EQI Group 2019 - 2024
12,000
10,000
8,000
Fewer
6,000
Moderate
More
4,000
Unassigned
2,000
0
2019
2020
2021
2022
2023
2024
It is also worth considering the proportion of learners within each EQI group have an approved
SAC application each year – the table below is the proportion of total learners (who had a non-
withdrawn enrolment and entry in the given academic year) who had an approved SAC
application in the academic year, by EQI Group. It shows us that Fewer learners are more likely
to have SAC (approximately double) than their More counterparts and Unassigned always has
had the highest proportion.
The sharp increase in Unassigned between 2023 and 2024 could be attributed to lots of those
providers pulling out of NCEA and those learners still staying in NCEA are disproportionately
those who may need SAC entitlements
Academic Year
Fewer
Moderate
More
Unassigned
2019 8.0% 6.2% 3.9% 11.6%
2020 8.4% 7.0% 4.8% 11.4%
2021 9.6% 8.2% 5.6% 12.0%
2022 9.8% 8.5% 5.5% 12.4%
2023 10.1% 8.4% 4.6% 12.7%
2024 10.5% 8.9% 5.2% 16.0%