 Hakanoa Street calculations


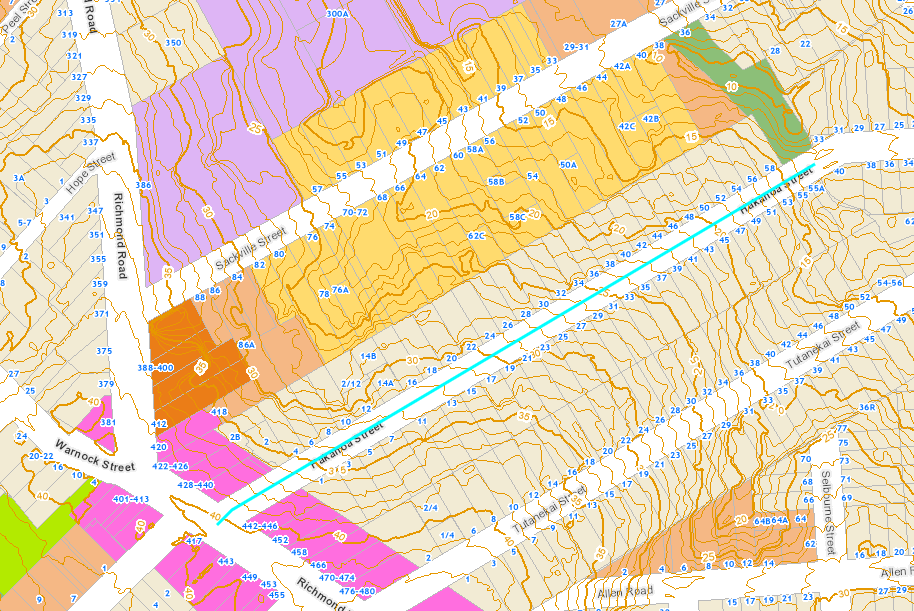 Pink = Business – Local Centre Zone = 100% imperviousness
White/Cream = Residential – Single House Zone = 60% imperviousness
Road = 90% imperviousness
Pink = Business – Local Centre Zone = 100% imperviousness
White/Cream = Residential – Single House Zone = 60% imperviousness
Road = 90% imperviousness
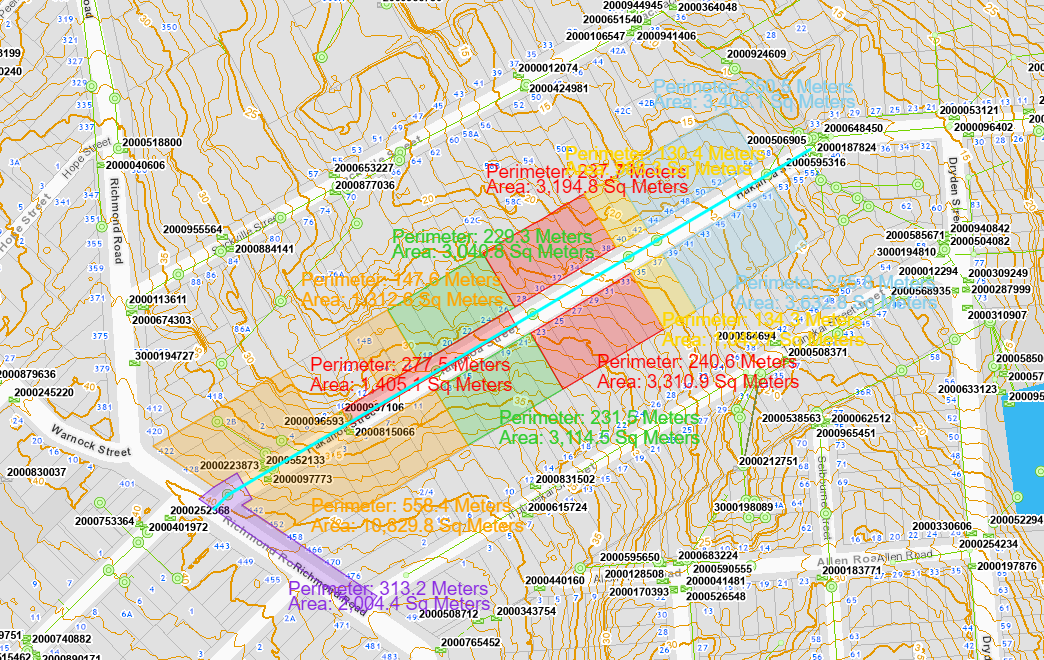
Sub-catchment 1 (Purple)
Perimeter: 313.2m
Area: 2,004.4m2
Zone: Road
Sub-catchment 2-a (Orange)
Perimeter: 558.4m
Area: 10,829.8m2
Zone: Road, residential – single house zone and business – local centre zone
Sub-catchment 2-b (Orange)
Perimeter: 147.6m
Area: 1,312.6m2
Zone: Residential – single house zone
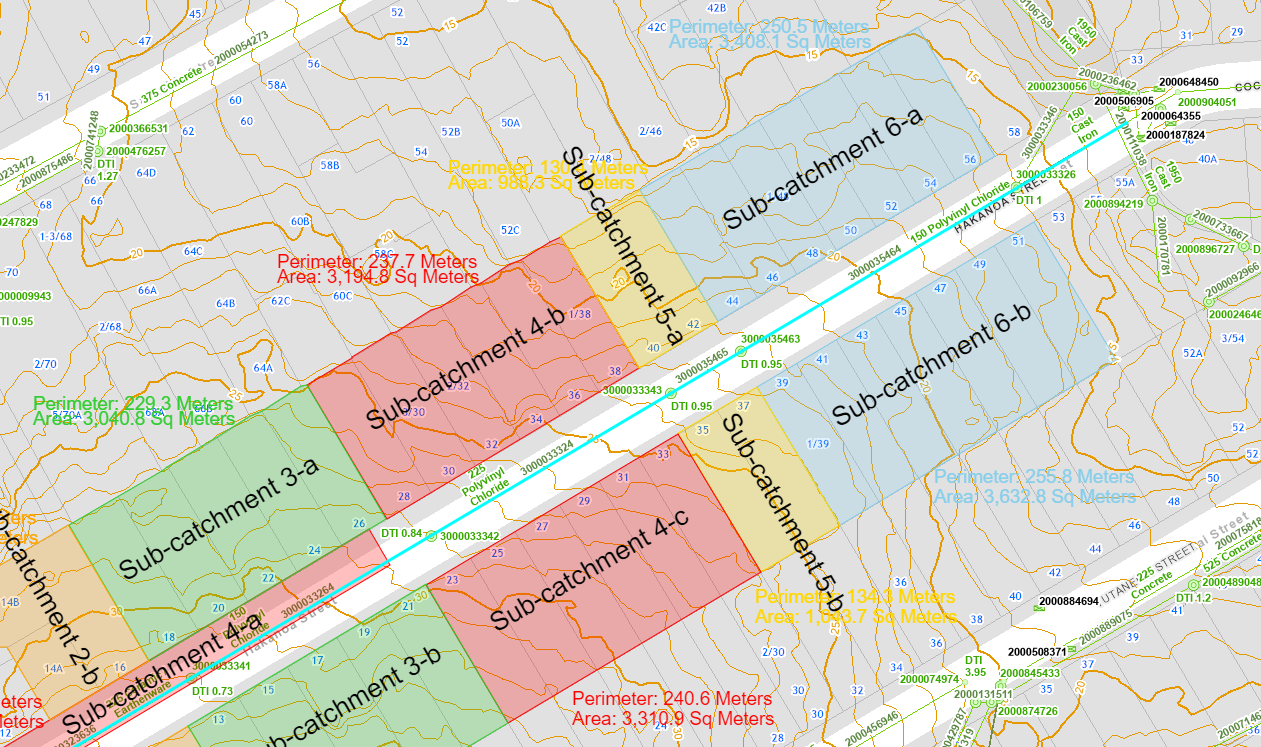
Sub-catchment 3-a (Green)
Perimeter: 229.3m
Area: 3,040.8m2
Zone: Residential – single house zone
Sub-catchment 3-b (Green)
Perimeter: 231.5m
Area: 3,114.5m2
Zone: Residential – single house zone
Sub-catchment 4-a (Red)
Perimeter: 277.5m
Area: 1,405.1m2
Zone: Road
Sub-catchment 4-b (Red)
Perimeter: 237.7m
Area: 3,194.8m2
Zone: Residential – single house zone
Sub-catchment 4-c (Red)
Perimeter: 240.6m
Area: 3,310.9m2
Zone: Residential – single house zone
Sub-catchment 5-a (Yellow)
Perimeter: 130.4m
Area: 988.3m2
Zone: Residential – single house zone
Sub-catchment 5-b (Yellow)
Perimeter: 134.3m
Area: 1,043.7m2
Zone: Residential – single house zone
Sub-catchment 6-a (Blue)
Perimeter: 250.5m
Area: 3,408.1m2
Zone: Residential – single house zone
Sub-catchment 6-b (Blue)
Perimeter: 255.8m
Area: 3,632.8m2
Zone: Residential – single house zone
SW Pipe 3000193428 (SWMH 3000193373 – 2000135041)
• Sub-catchments 1
o 90% impervious area
o Area = 2,004.4m2
o Peak flow rate = 0.0465m3/s
SW Pipe 2000323636 (SWMH 2000135041 – 3000033341)
• Prior cumulative area = 2,004.4m2
• Add sub-catchments 2-a, 2-b
o Roading area (90% impervious) = 1,615.5m2
o Residential area (60% impervious) = 2,029.1m2 + 4,113.4m2 + 1,312.6m2= 7,455.1m2
o Business area (100% impervious) = 1,840.7m2 + 1,231.5m2 = 3,072.2m2
o Sum of catchment areas = 12,142.8m2
o Weighted impervious area = 74.1%
o Peak flow rate = 0.272m3/s
o New cumulative area = 14,147.2m2
o Cumulative peak flow rate = 0.318m3/s
SW Pipe 3000033264 (SWMH 3000033341 – 3000033342)
• Prior cumulative area = 14,147.2m2
• Add sub-catchments 3-a, 3-b
o 60% impervious area
o Area = 3,040.8m2 + 3,114.5m2 = 6,155.3m2
o Peak flow rate = 0.131m3/s
o New cumulative area = 20,302.5m2
o Cumulative peak flow rate = 0.449m3/s
SW Pipe 3000033324 (SWMH 3000033342 - 3000033343)
• Prior cumulative area = 20,302.5m2
• Add sub-catchments 4-a, 4-b, 4-c
o Roading area (90% impervious) = 1,405.1m2
o Residential area (60% impervious) = 3,194.8m2 + 3,310.9m2= 6,505.7m2
o Sum of catchment areas = 7,910.8m2
o Weighted impervious area = 65.3%
o Peak flow rate = 0.172m3/s
o New cumulative area = 28,213.3m2
o Cumulative peak flow rate = 0.621m3/s
SW Pipe 3000035465 (SWMH 3000033343 - 3000035463)
• Prior cumulative area = 28,213.3m2
• Add sub-catchments 5-a, 5-b
o 60% impervious area
o Area = 988.3m2 + 1,043.7m2 = 2,032m2
o Peak flow rate = 0.0432m3/s
o New cumulative area = 30,245.3m2
o Cumulative peak flow rate = 0.664m3/s
SW Pipe 3000035464 (SWMH 3000035463 - 3000033326)
• Prior cumulative area = 30,245.3m2
• Add sub-catchments 6-a, 6-b
o 60% impervious area
o Area = 3,408.1m2 + 3,632.8m2 = 7,040.9m2
o Peak flow rate = 0.150m3/s
o New cumulative area = 37.286.2m2
o Cumulative peak flow rate = 0.814m3/s