 Residential Rates Affordability – the current situation
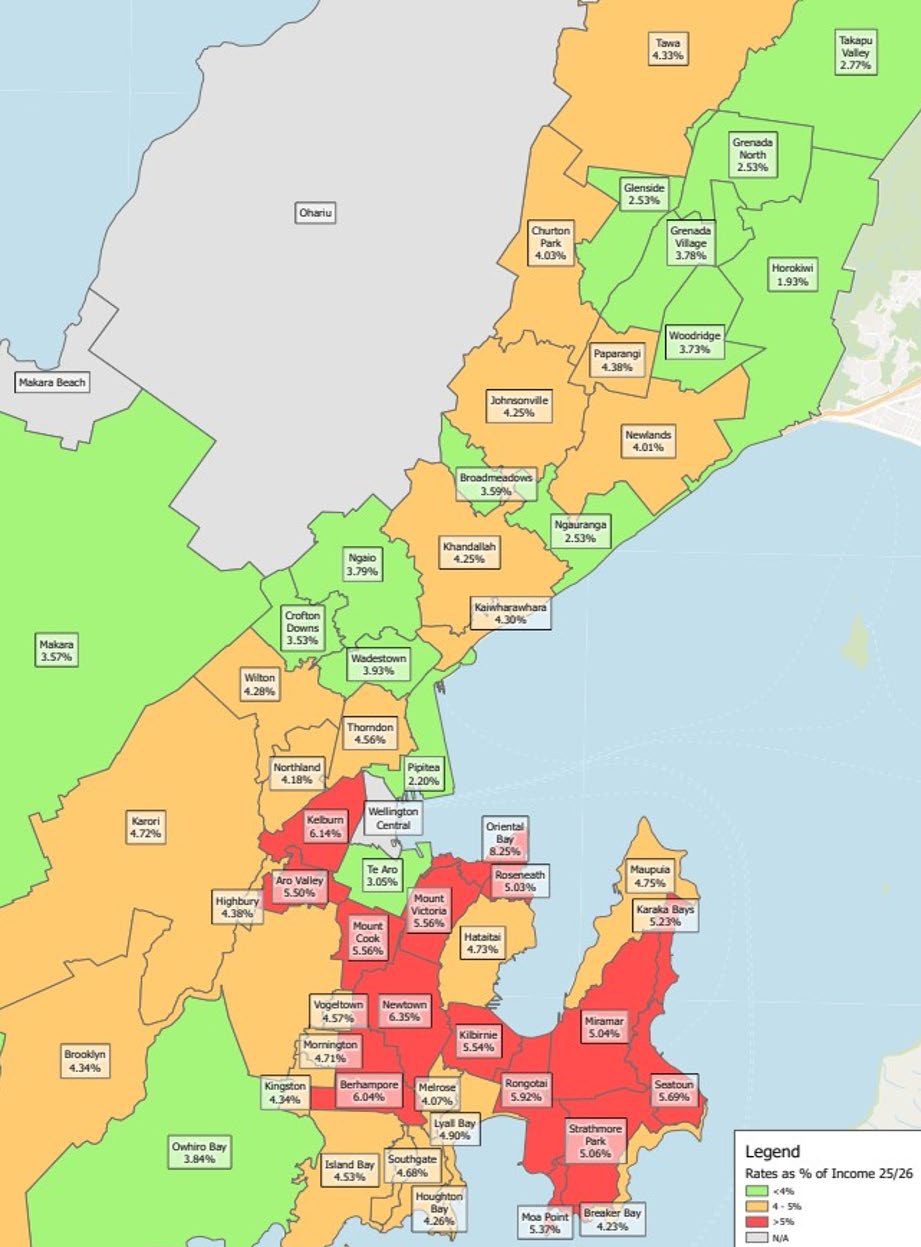
The following map identifies the proportion of household income used for payment of
local authority rates for suburbs in the Wellington City Council region.
Affordability is hard to define. Following The Shand Report (2007), our analysis sets the
rates affordability benchmark as 5% of household income (so red shading is where
rates exceed 5% of household income).
Data used
• Household incomes (by suburbs) were from the 2023 Census. These have been
adjusted by the Labour Cost Index to provide indicative 2025 household
incomes.
• Rates are based on the 25/26 WCC rates – including GWRC rates, the Sludge
Levy and GST.