NZTA Contract No. 2/04-005-601
1982
Waikato Expressway, Tamahere-
Act
Cambridge Section
Traffic Modelling Report
Information
November 2012
Official
the
under
Released
modelling report 311012.docx


NZTA Contract No. 2/04-005-601 1982
Waikato Expressway, Tamahere-
Cambridge Section
Act
Traffic Modelling Report
Quality Assurance Statement
Information
s 9(2)(a)
Prepared by:
s 9(2)(a)
Principal Transportation Engineer
s 9(2)(a)
Official Reviewed by:
s 9(2)(a)
Director
the
s 9(2)(a)
Approved for Issue by:
s 9(2)(a)
Principal Transportation Engineer
under
Status:
Final v3
Date:
23 November 2012
PO Box 1261, Hamilton 3240
New Zealand
P: +64 7 839 5500
www.tdg.co.nz
Released
Modelling Reportv3 231112.docx
link to page 4 link to page 4 link to page 4 link to page 4 link to page 6 link to page 8 link to page 8 link to page 8 link to page 9 link to page 11 link to page 11
Table of Contents
1. Introduction ............................................................................................................................... 1
2. Traffic Volumes ......................................................................................................................... 1
3. Model ing Methodology ............................................................................................................. 1
4. Staged Approach – Victoria Road Intersections ...................................................................... 1
5. Victoria Road Ultimate Solution – Traffic Signals..................................................................... 3
1982
5.1
Expressway Off Ramps .............................................................................................. 5
5.2
Expressway On Ramps .............................................................................................. 5
5.3
Victoria Road Mid-Block Design ................................................................................. 5
Act
6. Victoria Road Interim Solution – Priority Intersections ............................................................. 6
7. Ramp Merges/Diverges ............................................................................................................ 8
8. Conclusions .............................................................................................................................. 8
Appendix A – Performance Results – 10 Year Increments
Information
Official
the
under
Released
NZTA Contract No. 2/04-005-601, Waikato Expressway, Tamahere-Cambridge Section
Traffic Modelling Report
Modelling Reportv3 231112.docx
1
1.
Introduction
This report provides a summary of the traffic modelling that has been undertaken to inform the
development of the design for the Tamahere-Cambridge Section of the Waikato Expressway,
including the Victoria Road interchange and other ramp merge and diverge areas.
2.
Traffic Volumes
1982
Al traffic volumes were specified in the Principal’s requirements for the design year 2041. These
were generally based on outputs of the Waikato Regional Transportation Model (WRTM) Version
7, with minimum flows added to some movements for design purposes.
Act
3.
Modelling Methodology
Analysis of intersections has been undertaken using SIDRA 5.1 model ing software, with all
inputs and parameters set in accordance with the Principal’s Requirements.
Additional model ing was also undertaken using S-Paramics to further inform the development of
the design, and in particular the relationship between the two intersections at the Victoria Road
interchange. This has provided further confidence in the design solutions.
Analysis of merge and diverge areas has been undertaken using the Highway Capacity Manual
Information
(HCM) methodology.
4.
Staged Approach – Victoria Road Intersections
Analysis confirms that the intersections at Victoria Road require signalisation in order to meet the
Official
2041 performance standards set out in the Principal’s Requirements. Signalisation also provides
best for future integration with the railway line that may be reinstated along the eastern side of
Victoria Road.
the
Analysis also shows that signals are not needed from the outset and priority intersections can
meet al performance standards for some time. The traffic volumes that informed this analysis
were sourced from the Principal’s Requirements for the design year 2041 and from the Opus
NOR report for the years 2016, 2021 and 2031. The NOR report indicates that flows are
expected to increase at around 1% per annum from the 2016 value.
under
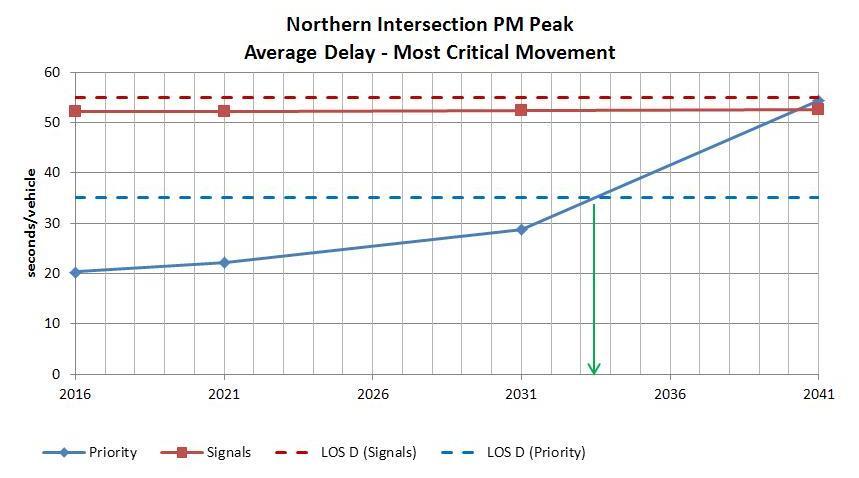
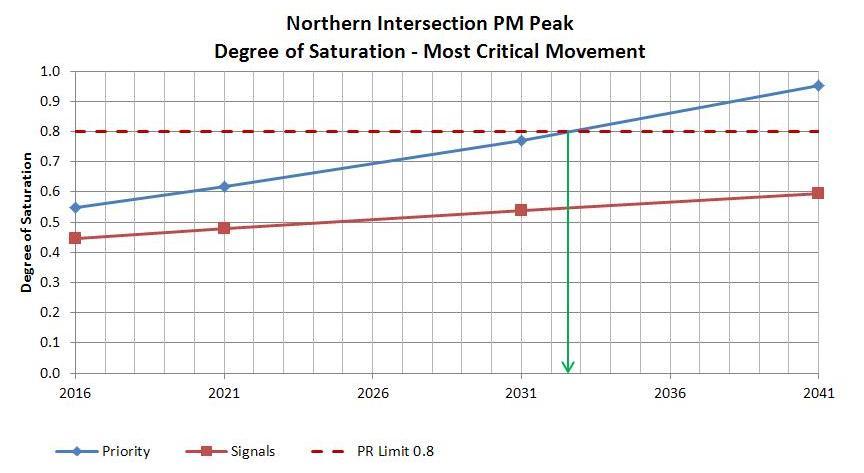
Analysis shows that the most critical case is the northern intersection during the evening peak
hour, and that the most critical indicators are average delay and degree of saturation for the worst
movement. Figure 1 and 2 below show how these indicators change over time for both signal
and priority controlled intersections.
Released
NZTA Contract No. 2/04-005-601, Waikato Expressway, Tamahere-Cambridge Section
Traffic Modelling Report
Modelling Reportv3 231112.docx
2
1982
Act
Figure 1 – Priority and Signal Control Performance (Average Delay)
Information
Official
the
Figure 2 – Priority and Signal Control Performance (Degree of Saturation)
under
The graphs show that priority control can operate acceptably from 2016 to approximately 2033,
giving the priority controlled junctions a life of around 17 years. For this reason, the design
solution involves constructing priority intersections with all necessary infrastructure in place to
allow an easy conversion to traffic signals when they are warranted.
This report presents analysis of the two design solutions for Victoria Road:
Released
The ultimate 2041 traffic signal design; and
The interim priority intersection design.
NZTA Contract No. 2/04-005-601, Waikato Expressway, Tamahere-Cambridge Section
Traffic Modelling Report
Modelling Reportv3 231112.docx
3
5.
Victoria Road Ultimate Solution – Traffic Signals
The design approach was to deliver a design that met all performance requirements, offered high
safety standards, complied with all relevant design standards, and was cost effective and
consistent with Waipa District Council’s long-term vision for Victoria Road.
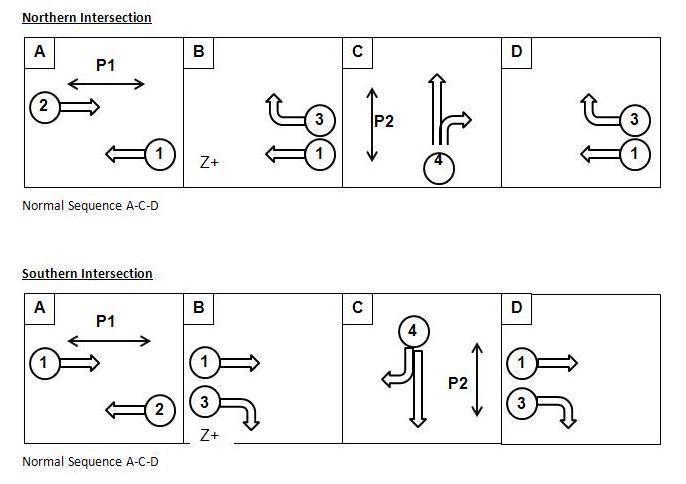
The signal phasing is shown below on Figure 1. It is noted that B phase (a lag right turn) is
included in the diagram to reflect the way the sequence would be coded in SCATS. B phase
does not run as part of normal operation. The “Z+” indicates that special conditions must exist in
SCATS for it to be used.
1982
Act
Information
Official
the
Figure 3 – Signal Phasing
The signals were modelled in accordance with the Principal’s requirements, with a maximum
under
phase time of 80 seconds, no right turn filtering, no pedestrian phases concurrent with right turns
and no staged pedestrian crossings. Phase times were optimised by SIDRA initial y and refined
as necessary to ensure adequate pedestrian crossing times and compliance with Table A11.1 of
the Principal’s Requirements.
Table 1 and 2 below summarise the morning peak hour performance of the northern and
southern intersections. Tables 3 and 4 present the analysis for the evening peak hour.
Released
NZTA Contract No. 2/04-005-601, Waikato Expressway, Tamahere-Cambridge Section
Traffic Modelling Report
Modelling Reportv3 231112.docx
4
Average Delay by
Level of Service (LOS)
Average Delay by
Volumes
Degree of Saturation
95th Percentile Queue Length (m)
Approach
Mvt
Movement (s/veh)
by Movement
Approach (s/veh)
Test
Test
PRs
Test
PRs
Test
PRs
Test
PRs
Test
PRs1
PRs2
PRs3
Victoria Road
T
314
7.2
53
A
D
0.325
0.800
34
90
100
N/A
13
14
(South)
R
50
52.5
53
D
D
0.401
0.800
16
90
100
N/A
Victoria Road
L
51
12.2
19
B
D
0.053
0.800
2
90
N/A
N/A
18
18
(North)
T
304
18.9
19
B
D
0.432
0.800
57
90
N/A
N/A
Off ramp from
L
50
12.6
37
B
D
0.083
0.800
2
100
N/A
500
Expressway
T
5
24.8
37
C
D
32
32
0.446
0.800
69
100
N/A
500
(West)
R
218
36.3
37
D
D
0.446
0.800
69
100
N/A
500
Intersection
-
992
20.1
35
C
C
-
-
-
-
-
-
-
-
1982
Table 1 – Northern Intersection Performance v Principal’s Requirements (AM) Signals Act
Average Delay by
Level of Service (LOS)
Average Delay by
Volumes
Degree of Saturation
95th Percentile Queue Length (m)
Approach
Mvt
Movement (s/veh)
by Movement
Approach (s/veh)
Test
Test
PRs
Test
PRs
Test
PRs
Test
PRs
Test
PRs1
PRs2
PRs3
Victoria Road
L
490
12.5
17
B
D
0.513
0.800
23
70
N/A
N/A
14
15
(South)
T
314
16.6
17
B
D
0.408
0.800
67
70
N/A
N/A
Off ramp from
L
50
12.8
46
B
D
0.102
0.800
3
40
N/A
450
Expressway
T
5
26.3
46
C
D
25
29
0.140
0.800
14
40
N/A
450
(East)
R
50
37.8
46
D
D
0.140
0.800
14
40
N/A
450
Victoria Road
T
472
4.8
50
A
D
0.438
0.800
42
90
100
N/A
9
13
(North)
R
50
49.6
50
D
D
0.301
0.800
15
90
100
N/A
Intersection
-
1,431
13.1
35
B
C
-
-
-
-
-
-
-
-
Table 2 – Southern Intersection Performance v Principal’s Requirements (AM) Signals
Information
Average Delay by
Level of Service (LOS)
Average Delay by
Volumes
Degree of Saturation
95th Percentile Queue Length (m)
Approach
Mvt
Movement (s/veh)
by Movement
Approach (s/veh)
Test
Test
PRs
Test
PRs
Test
PRs
Test
PRs
Test
PRs1
PRs2
PRs3
Victoria Road
T
292
13.1
53
B
D
0.369
0.800
47
90
100
N/A
19
19
(South)
R
50
52.5
53
D
D
0.401
0.800
16
90
100
N/A
Victoria Road
L
50
12.2
27
B
D
0.053
0.800
2
90
N/A
N/A
24
25
(North)
T
307
26.0
27
C
D
0.582
0.800
83
90
N/A
N/A
Official
Off ramp from
L
50
12.8
33
B
D
0.084
0.800
3
100
N/A
500
Expressway
T
5
20.6
33
C
D
30
30
0.596
0.800
99
100
N/A
500
(West)
R
392
32.1
33
C
D
0.596
0.800
99
100
N/A
500
Intersection
-
1,146
24.7
35
C
C
-
-
-
-
-
-
-
-
the
Table 3 – Northern Intersection Performance v Principal’s Requirements (PM) Signals
Average Delay by
Level of Service (LOS)
Average Delay by
Volumes
Degree of Saturation
95th Percentile Queue Length (m)
Approach
Mvt
Movement (s/veh)
by Movement
Approach (s/veh)
Test
Test
PRs
Test
PRs
Test
PRs
Test
PRs
Test
PRs1
PRs2
PRs3
under
Victoria Road
L
282
12.4
13
B
D
0.292
0.800
11
70
N/A
N/A
12
13
(South)
T
245
12.5
13
B
D
0.279
0.800
44
70
N/A
N/A
Off ramp from
L
50
12.6
47
B
D
0.127
0.800
2
40
N/A
450
Expressway
T
5
33.5
47
C
D
34
35
0.380
0.800
30
40
N/A
450
(East)
R
97
45.0
47
D
D
0.380
0.800
30
40
N/A
450
Victoria Road
T
649
2.0
49
A
D
0.537
0.800
33
90
100
N/A
5
5
(North)
R
50
48.3
49
D
D
0.267
0.800
15
90
100
N/A
Intersection
-
1,378
11.2
35
B
C
-
-
-
-
-
-
-
-
Table 4 – Southern Intersection Performance v Principal’s Requirements (PM) Signals
Released
Notes regarding Principal’s requirements for queuing
Note 1 – All lanes must be suf icient to accommodate 95th percentile queue length without blocking adjacent lanes
Note 2 – Queuing between intersections does not exceed 100m in any lane
Note 3 – Queuing from ramp terminals does not block back to Expressway
NZTA Contract No. 2/04-005-601, Waikato Expressway, Tamahere-Cambridge Section
Traffic Modelling Report
Modelling Reportv3 231112.docx
5
The tables demonstrate that the proposed design meets all of the Principal’s Requirements in
terms of average delays, degree of saturation and queue lengths.
Particular features of the design that are different to the specimen design are highlighted below
with further analysis to support the design.
5.1
Expressway Off Ramps
Off ramps from the Expressway are approximately 450-500m long. They are predominantly
single lane, widening as they approach Victoria Road to provide a left turn lane with between
1982
approximately 40m and 100m of storage.
Analysis shows the longest 95th percentile queue length for a left turn from an off ramp is 3m.
Act
The 95th percentile queue for the shared through and right lanes reaches a maximum of 99m. At
this level of queuing, the left turn lane remains accessible. This is well short of the ramp length
and gives a high degree of confidence about avoidance of queue effects on the Expressway.
In future, the reinstatement of the railway line could influence the performance of the off ramp at
the southern intersection. SIDRA has been used to assess potential queue lengths from traffic on
this off ramp being stopped at a level crossing. With ramp flows in the order of 100-150 vehicles
per hour (vph), the 95th percentile queue generated by barrier arms being down for two minutes is
expected to be 51m. On this basis, queuing from the future level crossing is not expected to
extend back to the Expressway.
Information
5.2
Expressway On Ramps
On ramps to the Expressway are approximately 450-500m long and are designed with a single
lane. The Principal’s Requirements specify that right turns are not allowed to filter. Therefore,
the only time right and left turners could enter the ramp at the same time and make use of two
lanes is during the right turn phase. This phase is model ed as typical y 12-15 seconds of the 80
Official
second cycle. The rest of the time the right turners are held. Analysis confirms that having a two
lane on ramp offers no material improvement over a single lane on ramp. Therefore, a single
lane arrangement has been included in the design.
the
5.3
Victoria Road Mid-Block Design
The mid-block between the northern and southern intersections provides for a through lane and a
right turn lane in each direction. There is approximately 90m of queuing space between these
under
intersections. Analysis shows that the 2041 95th percentile queues fit comfortably within this,
reaching a maximum of 16m for the right turns and 47m for the through movements.
In future, the reinstatement of the railway line could influence the performance of the
intersections. Right and left turns from Victoria Road at the northern intersection could be held
while trains use the line. Testing in SIDRA shows that these turning movements, which reach
maximum of 51 vph, generate 95th percentile queues that can be accommodated in their turning
lanes.
Released
Further modelling was undertaken in S-Paramics to more comprehensively understand the
interaction between intersections and to ensure the mid-block design was appropriate. This
analysis confirmed that with coordinated operation of the signals, giving green waves to the
heaviest flows in the morning and evening peak hours, average delays were typically another
NZTA Contract No. 2/04-005-601, Waikato Expressway, Tamahere-Cambridge Section
Traffic Modelling Report
Modelling Reportv3 231112.docx
6
20% better than reflected in SIDRA. This further confirms that the design is able to comfortably
meet the performance requirements of the Principal’s Requirements.
6.
Victoria Road Interim Solution – Priority Intersections
The design of the traffic signals set the base for the priority intersection geometric design in terms
of the footprint and the length of turn lanes. The priority controlled arrangement differs from the
signalised layout only in terms of traffic signal infrastructure, signs and markings and pedestrian
1982
provisions.
It has been determined using SIDRA that the most critical intersection is the northern intersection
during the evening peak hour. This intersection reaches the limit of the Principal’s Requirements
Act
at about the year 2033, when traffic flows reach 88% of the 2041 design level.
Forecasting future traffic patterns is always surrounded with uncertainty and there could be other
factors such as the railway line or land use changes that justify installation of traffic signals
earlier. Hence the “2033” scenario is not necessarily attached to an exact year in time. It has
been analysed as it is the upper limit of traffic loading under which the intersections operate
acceptably. The following tables confirm that priority junctions can operate within the limits set in
Principal’s Requirements, at this level. Full results for the years 2016, 2021, 2031 and 2041 with
both signalised and priority control may be found in Appendix A.
Table 5 and 6 below summarise the morning peak hour performance of the northern and
Information
southern intersections. Tables 7 and 8 present the analysis for the evening peak hour.
Average Delay Level of Service Average Delay
Degree of
Volume (vph)
by Movement
(LOS) by
95th Percentile Queue Length (m)
by Approach
Saturation
Approach
Mvt
(s/veh)
Movement
PRs (2041)
Test
Test
PRs
Test
PRs
Test
PRs
Test
PRs
Test
PRs1
PRs2
PRs3
Official
Victoria Road
T
314
276
0.0
53
A
D
0.159
0.800
0
90
100
N/A
1.7
14
(South)
R
50
44
12.5
53
B
D
0.036
0.800
1
90
100
N/A
Victoria Road
L
51
45
11.7
19
B
D
0.041
0.800
1
90
N/A
N/A
1.7
18
(North)
T
304
268
0.0
19
A
D
0.154
0.800
0
90
N/A
N/A
the
Off ramp from
L
50
44
12.6
37
B
D
0.050
0.800
1
100
N/A
500
Expressway
T
5
4
19.6
37
C
D
18.9
32
0.424
0.800
18
100
N/A
500
(West)
R
218
192
20.4
37
C
D
0.424
0.800
18
100
N/A
500
Table 5 – Northern Intersection Performance v Principal’s Requirements (AM) Priority
under Average Delay Level of Service Average Delay Degree of
Volume (vph)
by Movement
(LOS) by
95th Percentile Queue Length (m)
Approach
Mvt
by Approach
Saturation
(s/veh)
Movement
PRs (2041)
Test
Test
PRs
Test
PRs
Test
PRs
Test
PRs
Test
PRs1
PRs2
PRs3
Victoria Road
L
490
431
11.8
17
B
D
0.336
0.800
12
70
N/A
N/A
7.2
15
(South)
T
314
276
0.0
17
A
D
0.159
0.800
0
70
N/A
N/A
L
50
44
13.4
46
B
D
0.056
0.800
1
40
N/A
450
Off ramp from
T
5
4
19.1
46
C
D
16.7
29
0.130
0.800
4
40
N/A
450
Expressway (East)
R
50
44
19.8
46
C
D
0.130
0.800
4
40
N/A
450
Victoria Road
T
472
415
0.0
50
A
D
0.239
0.800
0
90
100
N/A
1.2
13
(North)
R
50
44
12.5
50
B
D
0.337
0.800
1
90
100
N/A
Released
Table 6 – Southern Intersection Performance v Principal’s Requirements (AM) Priority
NZTA Contract No. 2/04-005-601, Waikato Expressway, Tamahere-Cambridge Section
Traffic Modelling Report
Modelling Reportv3 231112.docx
7
Average Delay Level of Service Average Delay
Degree of
Volume (vph)
by Movement
(LOS) by
95th Percentile Queue Length (m)
Approach
Mvt
by Approach
Saturation
(s/veh)
Movement
PRs (2041)
Test
Test
PRs
Test
PRs
Test
PRs
Test
PRs
Test
PRs1
PRs2
PRs3
Victoria Road
T
292
257
0.0
53
A
D
0.148
0.800
0
90
100
N/A
1.8
19
(South)
R
50
44
12.5
53
B
D
0.036
0.800
1
90
100
N/A
Victoria Road
L
50
44
11.7
27
B
D
0.040
0.800
1
90
N/A
N/A
1.6
25
(North)
T
307
270
0.0
27
A
D
0.155
0.800
0
90
N/A
N/A
Off ramp from
L
50
44
12.5
33
B
D
0.052
0.800
1
100
N/A
500
Expressway
T
5
4
26.1
33
D
D
25.2
30
0.736
0.800
53
100
N/A
500
(West)
R
392
345
26.8
33
D
D
0.736
0.800
53
100
N/A
500
1982
Table 7 – Northern Intersection Performance v Principal’s Requirements (PM) Priority Act
Average Delay Level of Service Average Delay
Degree of
Volume (vph)
by Movement
(LOS) by
95th Percentile Queue Length (m)
by Approach
Saturation
Approach
Mvt
(s/veh)
Movement
PRs (2041)
Test
Test
PRs
Test
PRs
Test
PRs
Test
PRs
Test
PRs1
PRs2
PRs3
Victoria Road
L
282
248
11.6
13
B
D
0.166
0.800
2
70
N/A
N/A
6.2
13
(South)
T
245
216
0.0
13
A
D
0.124
0.800
0
70
N/A
N/A
L
50
44
14.7
47
B
D
0.060
0.800
2
40
N/A
450
Off ramp from
T
5
4
23.2
47
C
D
20.8
35
0.289
0.800
9
40
N/A
450
Expressway (East)
R
97
85
23.9
47
C
D
0.289
0.800
9
40
N/A
450
Victoria Road
T
649
571
0.0
49
A
D
0.328
0.800
0
90
100
N/A
0.9
5
(North)
R
50
44
12.2
49
B
D
0.034
0.800
1
90
100
N/A
Information
Table 8 – Southern Intersection Performance v Principal’s Requirements (PM) Priority
Notes regarding Principal’s requirements for queuing
Note 1 – All lanes must be suf icient to accommodate 95th percentile queue length without blocking adjacent lanes
Note 2 – Queuing between intersections does not exceed 100m in any lane
Note 3 – Queuing from ramp terminals does not block back to Expressway
The tables demonstrate that the proposed design meets all the Principal’s requirements in terms
Official
of average delays, degree of saturation and queue lengths. Key points to note include:
Al turning and crossing movements operate at LOS D or better.
the
The through movements on Victoria Road are unopposed and operate at LOS A. This
generates a significant user benefit in terms of reduced vehicle operating costs.
Queue lengths on Expressway off ramps are well within specified limits and do not extend
back to interact with the Expressway.
under
Ultimately signalised pedestrian crossings wil be provided at the northern intersection, across
Victoria Road (North) and the on ramp, and at the southern intersection across Victoria Road
(South) and the off ramp.
With priority control, crossings are provided as uncontrolled crossing using kerb cut downs and
refuge islands. Crossings across Victoria Road are moved safely away from the ramp
intersections and provided through the central median island. Model ing in SIDRA confirms that
pedestrian delays are acceptable as all pedestrian crossings require crossing of a single lane
only, with safe visibility, and traffic flows are such that adequate gaps are available.
Released
NZTA Contract No. 2/04-005-601, Waikato Expressway, Tamahere-Cambridge Section
Traffic Modelling Report
Modelling Reportv3 231112.docx
8
7.
Ramp Merges/Diverges
Level of service at ramp merges and diverges for 2041 flows has been assessed using the HCM
methodology. A summary of this analysis is presented in Table 9.
Density
Level of Service (LOS)
Location
Period
(pc/miles/ln)
1982
Test
PRs
AM
19
B
C
Northern Interchange On Ramp
PM
14.2
B
CAct
AM
5.4
A
C
Victoria Road Southbound On Ramp
PM
8.2
A
C
AM
13.8
B
C
Victoria Road Northbound On Ramp
PM
8.8
A
C
AM
9.4
A
C
Southern Interchange On Ramp
PM
11.2
B
C
AM
5.8
A
C
Victoria Road Southbound Off Ramp
PM
10.7
B
C
AM
3.9
A
C
Victoria Road Northbound On Ramp
PM
6.3
A
C
Information
Table 9 – Ramp Merge and Diverge Performance v Principal’s Requirements (2041)Conclusions
Official
the
under
Released
NZTA Contract No. 2/04-005-601, Waikato Expressway, Tamahere-Cambridge Section
Traffic Modelling Report
Modelling Reportv3 231112.docx
9
8.
Conclusion
Intersection designs for Victoria Road have been developed using traffic volumes from the
Principal’s Requirements and both SIDRA and S-Paramics as traffic modelling tools. It has been
demonstrated using SIDRA that the signalised layout can achieve all performance requirements.
This has been further reinforced by the results from S-Paramics modelling.
A staged approach is recommended whereby priority intersections would be constructed initial y.
SIDRA has been used to confirm that this arrangement can also meet the Principal’s
1982
Requirements with up to around 88% of the 2041 design traffic loading.
Al interchange merge and diverges have been checked using HCM methodology and confirmed
to operate at the required LOS C or better.
Act
Traffic Design Group Ltd
23 November 2012
Information
Official
the
under
Released
NZTA Contract No. 2/04-005-601, Waikato Expressway, Tamahere-Cambridge Section
Traffic Modelling Report
Modelling Reportv3 231112.docx
1982
Appendix A
Act
Performance Results – 10 Year
Increments
Information
Official
the
under
Released
NZTA Contract No. 2/04-005-601, Waikato Expressway, Tamahere to Cambridge Section
Performance Assessment of Priority Intersection Layouts at 2016 at Victoria Road interchange, using SIDRA
Test
Priority Control @ 2016
Morning Peak Hour
Northern Intersection
Average Delay by
Level of Service (LOS) by
Average Delay by
Volumes
Degree of Saturation
95th Percentile Queue Length (m)
Approach
Mvt
Movement (s/veh)
Movement
Approach (s/veh)
Test
Test
PRs
Test
PRs
Test
PRs
Test
PRs
Test
PRs1
PRs2
PRs3
Victoria Road
T
236
0.0
53
A
D
0.136
0.800
0
90
100
N/A1982
2
14
(South)
R
38
12.3
53
B
D
0.030
0.800
1
90
100
N/A
Victoria Road
L
38
11.7
19
B
D
0.034
0.800
1
90
N/A
N/A
2
18
(North)
T
228
0.0
19
A
D
0.131
0.800
0
90
N/A
N/A
Off ramp from
L
38
12.4
37
B
D
0.043
0.800
1
100
N/A
500
Expressway
T
4
16.8
37
C
D
17
32
0.316
0.800
12
100
N/A
500
Act
(West)
R
164
17.5
37
C
D
0.316
0.800
12
100
N/A
500
Intersection
-
-
-
746
5.8
35
-
C
-
-
-
-
-
-
Southern Intersection
Average Delay by
Level of Service (LOS) by
Average Delay by
Volumes
Degree of Saturation
95th Percentile Queue Length (m)
Approach
Mvt
Movement (s/veh)
Movement
Approach (s/veh)
Test
Test
PRs
Test
PRs
Test
PRs
Test
PRs
Test
PRs1
PRs2
PRs3
Victoria Road
L
368
11.8
17
B
D
0.287
0.800
10
70
N/A
N/A
7
15
(South)
T
236
0.0
17
A
D
0.136
0.800
0
70
N/A
N/A
Off ramp from
L
38
13.0
46
B
D
0.047
0.800
1
40
N/A
450
Expressway
T
4
17.7
46
C
D
16
29
0.095
0.800
3
40
N/A
450
(East)
R
38
17.8
46
C
D
0.095
0.800
3
40
N/A
450
Victoria Road
T
354
0.0
50
A
D
0.204
0.800
0
90
100
N/A
1
13
(North)
R
38
12.3
50
B
D
0.030
0.800
1
90
100
N/A
Information
Intersection
-
1,076
5.6
35
-
C
-
-
-
-
-
-
-
-
Evening Peak Hour
Northern Intersection
Average Delay by
Level of Service (LOS) by
Average Delay by
Volumes
Degree of Saturation
95th Percentile Queue Length (m)
Approach
Mvt
Movement (s/veh)
Movement
Approach (s/veh)
Test
Test
PRs
Test
PRs
Test
PRs
Test
PRs
Test
PRs1
PRs2
PRs3
Victoria Road
T
219
0.0
53
A
D
0.126
0.800
0
90
100
N/A
2
19
Official
(South)
R
38
12.3
53
B
D
0.030
0.800
1
90
100
N/A
Victoria Road
L
38
11.7
27
B
D
0.034
0.800
1
90
N/A
N/A
2
25
(North)
T
230
0.0
27
A
D
0.132
0.800
0
90
N/A
N/A
Off ramp from
L
38
12.4
33
B
D
0.044
0.800
1
100
N/A
500
Expressway
T
4
19.5
33
C
D
19
30
0.549
0.800
30
100
N/A
500
the
(West)
R
294
20.3
33
C
D
0.549
0.800
30
100
N/A
500
Intersection
-
861
8.6
35
-
C
-
-
-
-
-
-
-
-
Southern Intersection
Average Delay by
Level of Service (LOS) by
Average Delay by
Volumes
Degree of Saturation
95th Percentile Queue Length (m)
Approach
Mvt
Movement (s/veh)
Movement
Approach (s/veh)
Test
Test
PRs
Test
PRs
Test
PRs
Test
PRs
Test
PRs1
PRs2
PRs3
Victoria Road
L
212
11.6
13
B
D
0.142
0.800
2
70
N/A
N/A
6
13
under
(South)
T
184
0.0
13
A
D
0.106
0.800
0
70
N/A
N/A
Off ramp from
L
38
13.9
47
B
D
0.051
0.800
1
40
N/A
450
Expressway
T
4
19.1
47
C
D
18
35
0.202
0.800
6
40
N/A
450
(East)
R
73
19.8
47
C
D
0.202
0.800
6
40
N/A
450
Victoria Road
T
487
0.0
49
A
D
0.280
0.800
0
90
100
N/A
1
5
(North)
R
38
12.1
49
B
D
0.028
0.800
1
90
100
N/A
Intersection
-
1,036
4.8
35
-
C
-
-
-
-
-
-
-
-
Queuing Criteria
Note 1
All lanes sufficient to accommodate 95th percentile queue without block adjacent
Note 2
Queuing between the two intersections does not exceed 100m in any lane
Note 3
Queuing from ramp terminals does not block back to the expressway (ramps provide approx 500m btw E/way and northern int, 450m btw E/way and southern)
Released
NZTA Contract No. 2/04-005-601, Waikato Expressway, Tamahere to Cambridge Section
Performance Assessment of Signal Intersection Layouts at 2016 at Victoria Road interchange, using SIDRA
Test
Signal Control @ 2016
Morning Peak Hour
Northern Intersection
Average Delay by
Level of Service (LOS) by
Average Delay by
Volumes
Degree of Saturation
95th Percentile Queue Length (m)
Approach
Mvt
Movement (s/veh)
Movement
Approach (s/veh)
Test
Test
PRs
Test
PRs
Test
PRs
Test
PRs
Test
PRs1
PRs2
PRs3
Victoria Road
T
236
7.5
53
A
D
0.250
0.800
25
90
100
N/A1982
14
14
(South)
R
38
52.1
53
D
D
0.305
0.800
12
90
100
N/A
Victoria Road
L
38
12.1
19
B
D
0.038
0.800
1
90
N/A
N/A
18
18
(North)
T
228
18.7
19
B
D
0.335
0.800
50
90
N/A
N/A
Off ramp from
L
38
12.3
37
B
D
0.055
0.800
1
100
N/A
500
Expressway
T
4
22.9
37
C
D
30
32
0.323
0.800
41
100
N/A
500
Act
(West)
R
164
34.4
37
C
D
0.323
0.800
41
100
N/A
500
Intersection
-
746
19.6
35
B
C
-
-
-
-
-
-
-
-
Southern Intersection
Average Delay by
Level of Service (LOS) by
Average Delay by
Volumes
Degree of Saturation
95th Percentile Queue Length (m)
Approach
Mvt
Movement (s/veh)
Movement
Approach (s/veh)
Test
Test
PRs
Test
PRs
Test
PRs
Test
PRs
Test
PRs1
PRs2
PRs3
Victoria Road
L
368
12.3
17
B
D
0.371
0.800
14
70
N/A
N/A
14
15
(South)
T
236
15.7
17
B
D
0.307
0.800
48
70
N/A
N/A
Off ramp from
L
38
12.5
46
B
D
0.064
0.800
2
40
N/A
450
Expressway
T
4
26.0
46
C
D
25
29
0.107
0.800
10
40
N/A
450
(East)
R
38
37.5
46
D
D
0.107
0.800
10
40
N/A
450
Victoria Road
T
354
4.4
50
A
D
0.329
0.800
28
90
100
N/A
9
13
(North)
R
38
49.2
50
D
D
0.329
0.800
11
90
100
N/A
Intersection
-
1,076
12.7
35
B
C
-
-
-
-
-
-
-
-
Information
Evening Peak Hour
Northern Intersection
Average Delay by
Level of Service (LOS) by
Average Delay by
Volumes
Degree of Saturation
95th Percentile Queue Length (m)
Approach
Mvt
Movement (s/veh)
Movement
Approach (s/veh)
Test
Test
PRs
Test
PRs
Test
PRs
Test
PRs
Test
PRs1
PRs2
PRs3
Victoria Road
T
219
12.4
53
B
D
0.277
0.800
33
90
100
N/A
18
19
(South)
R
38
52.1
53
D
D
0.305
0.800
12
90
100
N/A
Official
Victoria Road
L
38
12.1
27
B
D
0.039
0.800
1
90
N/A
N/A
23
25
(North)
T
230
24.6
27
C
D
0.436
0.800
59
90
N/A
N/A
Off ramp from
L
38
12.5
33
B
D
0.056
0.800
2
100
N/A
500
Expressway
T
4
19.0
33
B
D
28
30
0.447
0.800
69
100
N/A
500
(West)
R
294
30.5
33
C
D
0.447
0.800
69
100
N/A
500
the
Intersection
-
861
23.6
35
C
C
-
-
-
-
-
-
-
-
Southern Intersection
Average Delay by
Level of Service (LOS) by
Average Delay by
Volumes
Degree of Saturation
95th Percentile Queue Length (m)
Approach
Mvt
Movement (s/veh)
Movement
Approach (s/veh)
Test
Test
PRs
Test
PRs
Test
PRs
Test
PRs
Test
PRs1
PRs2
PRs3
Victoria Road
L
212
12.2
13
B
D
0.211
0.800
7
70
N/A
N/A
12
13
(South)
T
184
12.0
13
B
D
0.209
0.800
32
70
N/A
N/A
under
Off ramp from
L
38
12.2
47
B
D
0.072
0.800
1
40
N/A
450
Expressway
T
4
32.9
47
C
D
33
35
0.287
0.800
22
40
N/A
450
(East)
R
73
44.4
47
D
D
0.287
0.800
22
40
N/A
450
Victoria Road
T
487
1.8
49
A
D
0.403
0.800
20
90
100
N/A
5
5
(North)
R
38
47.9
49
D
D
0.403
0.800
11
90
100
N/A
Intersection
-
1,036
10.9
35
B
C
-
-
-
-
-
-
-
-
Queuing Criteria
Note 1
All lanes sufficient to accommodate 95th percentile queue without block adjacent
Note 2
Queuing between the two intersections does not exceed 100m in any lane
Note 3
Queuing from ramp terminals does not block back to the expressway (ramps provide approx 500m btw E/way and northern int, 450m btw E/way and southern)
Released
NZTA Contract No. 2/04-005-601, Waikato Expressway, Tamahere to Cambridge Section
Performance Assessment of Priority Intersection Layouts at 2021 at Victoria Road interchange, using SIDRA
Test
Priority Control @ 2021
Morning Peak Hour
Northern Intersection
Average Delay by
Level of Service (LOS) by
Average Delay by
Volumes
Degree of Saturation
95th Percentile Queue Length (m)
Approach
Mvt
Movement (s/veh)
Movement
Approach (s/veh)
Test
Test
PRs
Test
PRs
Test
PRs
Test
PRs
Test
PRs1
PRs2
PRs3
Victoria Road
T
251
0.0
53
A
D
0.144
0.800
0
90
100
N/A1982
2
14
(South)
R
40
12.4
53
B
D
0.032
0.800
1
90
100
N/A
Victoria Road
L
41
11.7
19
B
D
0.037
0.800
1
90
N/A
N/A
2
18
(North)
T
243
0.0
19
A
D
0.140
0.800
0
90
N/A
N/A
Off ramp from
L
40
12.5
37
B
D
0.045
0.800
1
100
N/A
500
Expressway
T
4
17.8
37
C
D
17
32
0.353
0.800
14
100
N/A
500
Act
(West)
R
174
18.5
37
C
D
0.353
0.800
14
100
N/A
500
Intersection
-
793
6.0
35
-
C
-
-
-
-
-
-
-
-
Southern Intersection
Average Delay by
Level of Service (LOS) by
Average Delay by
Volumes
Degree of Saturation
95th Percentile Queue Length (m)
Approach
Mvt
Movement (s/veh)
Movement
Approach (s/veh)
Test
Test
PRs
Test
PRs
Test
PRs
Test
PRs
Test
PRs1
PRs2
PRs3
Victoria Road
L
392
11.8
17
B
D
0.306
0.800
11
70
N/A
N/A
7
15
(South)
T
251
0.0
17
A
D
0.144
0.800
0
70
N/A
N/A
Off ramp from
L
40
13.2
46
B
D
0.050
0.800
1
40
N/A
450
Expressway
T
4
17.8
46
C
D
16
29
0.107
0.800
3
40
N/A
450
(East)
R
40
18.5
46
C
D
0.107
0.800
3
40
N/A
450
Victoria Road
T
378
0.0
50
A
D
0.217
0.800
0
90
100
N/A
1
13
(North)
R
40
12.4
50
B
D
0.032
0.800
1
90
100
N/A
Intersection
-
1,145
5.6
35
-
C
-
-
-
-
-
-
-
-
Information
Evening Peak Hour
Northern Intersection
Average Delay by
Level of Service (LOS) by
Average Delay by
Volumes
Degree of Saturation
95th Percentile Queue Length (m)
Approach
Mvt
Movement (s/veh)
Movement
Approach (s/veh)
Test
Test
PRs
Test
PRs
Test
PRs
Test
PRs
Test
PRs1
PRs2
PRs3
Victoria Road
T
40
12.4
53
A
D
0.135
0.800
0
90
100
N/A
2
19
(South)
R
234
0.0
53
B
D
0.032
0.800
1
90
100
N/A
Official
Victoria Road
L
40
12.4
27
B
D
0.036
0.800
1
90
N/A
N/A
2
25
(North)
T
246
21.5
27
A
D
0.141
0.800
0
90
N/A
N/A
Off ramp from
L
40
22.2
33
B
D
0.047
0.800
1
100
N/A
500
Expressway
T
4
0.0
33
C
D
21
30
0.618
0.800
37
100
N/A
500
(West)
R
314
11.7
33
C
D
0.618
0.800
37
100
N/A
500
the
Intersection
-
918
9.3
35
-
C
-
-
-
-
-
-
-
-
Southern Intersection
Average Delay by
Level of Service (LOS) by
Average Delay by
Volumes
Degree of Saturation
95th Percentile Queue Length (m)
Approach
Mvt
Movement (s/veh)
Movement
Approach (s/veh)
Test
Test
PRs
Test
PRs
Test
PRs
Test
PRs
Test
PRs1
PRs2
PRs3
Victoria Road
L
226
11.6
13
B
D
0.151
0.800
2
70
N/A
N/A
6
13
(South)
T
196
0.0
13
A
D
0.113
0.800
0
70
N/A
N/A
under
Off ramp from
L
40
14.2
47
B
D
0.050
0.800
1
40
N/A
450
Expressway
T
4
20.5
47
C
D
19
35
0.233
0.800
7
40
N/A
450
(East)
R
78
21.2
47
C
D
0.233
0.800
7
40
N/A
450
Victoria Road
T
519
0.0
49
A
D
0.296
0.800
0
90
100
N/A
1
5
(North)
R
40
12.1
49
B
D
0.030
0.800
1
90
100
N/A
Intersection
-
1,103
4.9
35
-
C
-
-
-
-
-
-
-
-
Queuing Criteria
Note 1
All lanes sufficient to accommodate 95th percentile queue without block adjacent
Note 2
Queuing between the two intersections does not exceed 100m in any lane
Note 3
Queuing from ramp terminals does not block back to the expressway (ramps provide approx 500m btw E/way and northern int, 450m btw E/way and southern)
Released
NZTA Contract No. 2/04-005-601, Waikato Expressway, Tamahere to Cambridge Section
Performance Assessment of Signal Intersection Layouts at 2021 at Victoria Road interchange, using SIDRA
Test
Signal Control @ 2021
Morning Peak Hour
Northern Intersection
Average Delay by
Level of Service (LOS) by
Average Delay by
Volumes
Degree of Saturation
95th Percentile Queue Length (m)
Approach
Mvt
Movement (s/veh)
Movement
Approach (s/veh)
Test
Test
PRs
Test
PRs
Test
PRs
Test
PRs
Test
PRs1
PRs2
PRs31982
Victoria Road
T
251
6.9
53
A
D
0.260
0.800
26
90
100
N/A
13
14
(South)
R
40
52.1
53
D
D
0.321
0.800
13
90
100
N/A
Victoria Road
L
41
12.1
19
B
D
0.041
0.800
1
90
N/A
N/A
17
18
(North)
T
243
18.1
19
B
D
0.346
0.800
53
90
N/A
N/A
Off ramp from
L
40
12.3
37
B
D
0.059
0.800
1
100
N/A
500
Act
Expressway
T
4
24.0
37
C
D
31
32
0.356
0.800
44
100
N/A
500
(West)
R
174
35.5
37
D
D
0.356
0.800
44
100
N/A
500
Intersection
-
793
19.5
35
B
C
-
-
-
-
-
-
-
-
Southern Intersection
Average Delay by
Level of Service (LOS) by
Average Delay by
Volumes
Degree of Saturation
95th Percentile Queue Length (m)
Approach
Mvt
Movement (s/veh)
Movement
Approach (s/veh)
Test
Test
PRs
Test
PRs
Test
PRs
Test
PRs
Test
PRs1
PRs2
PRs3
Victoria Road
L
392
12.3
17
B
D
0.396
0.800
15
70
N/A
N/A
14
15
(South)
T
251
15.9
17
B
D
0.326
0.800
51
70
N/A
N/A
Off ramp from
L
40
12.5
46
B
D
0.070
0.800
2
40
N/A
450
Expressway
T
4
26.1
46
C
D
25
29
0.112
0.800
11
40
N/A
450
(East)
R
40
37.6
46
D
D
0.112
0.800
11
40
N/A
450
Victoria Road
T
378
4.5
50
A
D
0.351
0.800
30
90
100
N/A
9
13
(North)
R
40
49.3
50
D
D
0.240
0.800
12
90
100
N/A
Information
Intersection
-
1,145
12.7
35
B
C
-
-
-
-
-
-
-
-
Evening Peak Hour
Northern Intersection
Average Delay by
Level of Service (LOS) by
Average Delay by
Volumes
Degree of Saturation
95th Percentile Queue Length (m)
Approach
Mvt
Movement (s/veh)
Movement
Approach (s/veh)
Test
Test
PRs
Test
PRs
Test
PRs
Test
PRs
Test
PRs1
PRs2
PRs3
Victoria Road
T
40
12.6
53
B
D
0.296
0.800
36
90
100
N/A
18
19
Official
(South)
R
234
52.1
53
D
D
0.321
0.800
13
90
100
N/A
Victoria Road
L
40
12.1
27
B
D
0.041
0.800
1
90
N/A
N/A
23
25
(North)
T
246
24.9
27
C
D
0.467
0.800
64
90
N/A
N/A
Off ramp from
L
40
12.6
33
B
D
0.062
0.800
2
100
N/A
500
Expressway
T
4
19.3
33
B
D
29
30
0.478
0.800
74
100
N/A
500
the
(West)
R
314
30.8
33
C
D
0.478
0.800
74
100
N/A
500
Intersection
-
918
23.9
35
C
C
-
-
-
-
-
-
-
-
Southern Intersection
Average Delay by
Level of Service (LOS) by
Average Delay by
Volumes
Degree of Saturation
95th Percentile Queue Length (m)
Approach
Mvt
Movement (s/veh)
Movement
Approach (s/veh)
Test
Test
PRs
Test
PRs
Test
PRs
Test
PRs
Test
PRs1
PRs2
PRs3
Victoria Road
L
226
12.2
13
B
D
0.226
0.800
7
70
N/A
N/A
12
13
under
(South)
T
196
12.1
13
B
D
0.223
0.800
34
70
N/A
N/A
Off ramp from
L
40
12.4
47
B
D
0.081
0.800
2
40
N/A
450
Expressway
T
4
33.0
47
C
D
34
35
0.306
0.800
23
40
N/A
450
(East)
R
78
44.5
47
D
D
0.306
0.800
23
40
N/A
450
Victoria Road
T
519
1.8
49
A
D
0.430
0.800
22
90
100
N/A
5
5
(North)
R
40
48.0
49
D
D
0.214
0.800
12
90
100
N/A
Intersection
-
1,103
11.0
35
B
C
-
-
-
-
-
-
-
-
Queuing Criteria
Note 1
All lanes sufficient to accommodate 95th percentile queue without block adjacent
Note 2
Queuing between the two intersections does not exceed 100m in any lane
Note 3
Queuing from ramp terminals does not block back to the expressway (ramps provide approx 500m btw E/way and northern int, 450m btw E/way and southern)
Released
NZTA Contract No. 2/04-005-601, Waikato Expressway, Tamahere to Cambridge Section
Performance Assessment of Priority Intersection Layouts at 2031 at Victoria Road interchange, using SIDRA
Test
Priority Control @ 2031
Morning Peak Hour
Northern Intersection
Average Delay by
Level of Service (LOS) by
Average Delay by
Volumes
Degree of Saturation
95th Percentile Queue Length (m)
Approach
Mvt
Movement (s/veh)
Movement
Approach (s/veh)
Test
Test
PRs
Test
PRs
Test
PRs
Test
PRs
Test
PRs1
PRs2
PRs3
Victoria Road
T
283
0.0
53
A
D
0.163
0.800
0
90
100
N/A1982
2
14
(South)
R
45
12.5
53
B
D
0.037
0.800
1
90
100
N/A
Victoria Road
L
46
11.7
19
B
D
0.042
0.800
1
90
N/A
N/A
2
18
(North)
T
274
0.0
19
A
D
0.158
0.800
0
90
N/A
N/A
Off ramp from
L
45
12.7
37
B
D
0.052
0.800
1
100
N/A
500
Expressway
T
5
20.2
37
C
D
19
32
0.444
0.800
19
100
N/A
500
Act
(West)
R
196
20.9
37
C
D
0.444
0.800
19
100
N/A
500
Intersection
-
894
6.6
35
-
C
-
-
-
-
-
-
-
-
Southern Intersection
Average Delay by
Level of Service (LOS) by
Average Delay by
Volumes
Degree of Saturation
95th Percentile Queue Length (m)
Approach
Mvt
Movement (s/veh)
Movement
Approach (s/veh)
Test
Test
PRs
Test
PRs
Test
PRs
Test
PRs
Test
PRs1
PRs2
PRs3
Victoria Road
L
441
11.8
17
B
D
0.344
0.800
12
70
N/A
N/A
7
15
(South)
T
283
0.0
17
A
D
0.163
0.800
0
70
N/A
N/A
Off ramp from
L
45
13.5
46
B
D
0.058
0.800
1
40
N/A
450
Expressway
T
5
19.4
46
C
D
17
29
0.139
0.800
4
40
N/A
450
(East)
R
45
20.1
46
C
D
0.139
0.800
4
40
N/A
450
Victoria Road
T
425
0.0
50
A
D
0.244
0.800
0
90
100
N/A
1
13
(North)
R
45
12.6
50
B
D
0.038
0.800
1
90
100
N/A
Intersection
-
1,289
5.7
35
-
C
-
-
-
-
-
-
-
-
Information
Evening Peak Hour
Northern Intersection
Average Delay by
Level of Service (LOS) by
Average Delay by
Volumes
Degree of Saturation
95th Percentile Queue Length (m)
Approach
Mvt
Movement (s/veh)
Movement
Approach (s/veh)
Test
Test
PRs
Test
PRs
Test
PRs
Test
PRs
Test
PRs1
PRs2
PRs3
Victoria Road
T
263
0.0
53
A
D
0.151
0.800
0
90
100
N/A
2
19
(South)
R
45
12.5
53
B
D
0.037
0.800
1
90
100
N/A
Official
Victoria Road
L
45
11.7
27
B
D
0.041
0.800
1
90
N/A
N/A
2
25
(North)
T
276
0.0
27
A
D
0.159
0.800
0
90
N/A
N/A
Off ramp from
L
45
12.6
33
B
D
0.053
0.800
1
100
N/A
500
Expressway
T
5
27.9
33
D
D
27
30
0.770
0.800
59
100
N/A
500
(West)
R
353
28.7
33
D
D
0.770
0.800
59
100
N/A
500
the
Intersection
-
1,032
11.6
35
-
C
-
-
-
-
-
-
-
-
Southern Intersection
Average Delay by
Level of Service (LOS) by
Average Delay by
Volumes
Degree of Saturation
95th Percentile Queue Length (m)
Approach
Mvt
Movement (s/veh)
Movement
Approach (s/veh)
Test
Test
PRs
Test
PRs
Test
PRs
Test
PRs
Test
PRs1
PRs2
PRs3
Victoria Road
L
254
11.6
13
B
D
0.170
0.800
2
70
N/A
N/A
6
13
(South)
T
221
0.0
13
A
D
0.127
0.800
0
70
N/A
N/A
under
Off ramp from
L
45
14.8
47
B
D
0.063
0.800
2
40
N/A
450
Expressway
T
5
23.9
47
C
D
21
35
0.308
0.800
10
40
N/A
450
(East)
R
87
24.7
47
C
D
0.308
0.800
10
40
N/A
450
Victoria Road
T
584
0.0
49
A
D
0.336
0.800
0
90
100
N/A
1
5
(North)
R
45
12.3
49
B
D
0.035
0.800
1
90
100
N/A
Intersection
-
1,241
5.2
35
-
C
-
-
-
-
-
-
-
-
Queuing Criteria
Note 1
All lanes sufficient to accommodate 95th percentile queue without block adjacent
Note 2
Queuing between the two intersections does not exceed 100m in any lane
Note 3
Queuing from ramp terminals does not block back to the expressway (ramps provide approx 500m btw E/way and northern int, 450m btw E/way and southern)
Released
NZTA Contract No. 2/04-005-601, Waikato Expressway, Tamahere to Cambridge Section
Performance Assessment of Signal Intersection Layouts at 2031 at Victoria Road interchange, using SIDRA
Test
Signal Control @ 2031
Morning Peak Hour
Northern Intersection
Average Delay by
Level of Service (LOS) by
Average Delay by
Volumes
Degree of Saturation
95th Percentile Queue Length (m)
Approach
Mvt
Movement (s/veh)
Movement
Approach (s/veh)
Test
Test
PRs
Test
PRs
Test
PRs
Test
PRs
Test
PRs1
PRs2
PRs3
Victoria Road
T
283
7.0
53
A
D
0.293
0.800
30
90
100
N/A 1982
13
14
(South)
R
45
52.3
53
D
D
0.361
0.800
14
90
100
N/A
Victoria Road
L
46
12.2
19
B
D
0.048
0.800
1
90
N/A
N/A
18
18
(North)
T
274
18.5
19
B
D
0.390
0.800
61
90
N/A
N/A
L
45
12.5
37
B
D
0.071
0.800
2
100
N/A
500
Off ramp from
T
5
24.4
37
C
D
31
32
0.402
0.800
51
100
N/A
500
Expressway (West)
Act
R
196
35.9
37
D
D
0.402
0.800
51
100
N/A
500
Intersection
-
894
19.8
35
B
C
-
-
-
-
-
-
-
-
Southern Intersection
Average Delay by
Level of Service (LOS) by
Average Delay by
Volumes
Degree of Saturation
95th Percentile Queue Length (m)
Approach
Mvt
Movement (s/veh)
Movement
Approach (s/veh)
Test
Test
PRs
Test
PRs
Test
PRs
Test
PRs
Test
PRs1
PRs2
PRs3
Victoria Road
L
441
12.3
17
B
D
0.448
0.800
17
70
N/A
N/A
14
15
(South)
T
283
16.3
17
B
D
0.368
0.800
59
70
N/A
N/A
L
45
12.7
46
B
D
0.085
0.800
2
40
N/A
450
Off ramp from
T
5
26.2
46
C
D
25
29
0.127
0.800
12
40
N/A
450
Expressway (East)
R
45
37.7
46
D
D
0.127
0.800
12
40
N/A
450
Victoria Road
T
425
4.6
50
A
D
0.395
0.800
36
90
100
N/A
9
13
(North)
R
45
49.4
50
D
D
0.270
0.800
13
90
100
N/A
Intersection
-
1,289
12.9
35
B
C
-
-
-
-
-
-
-
-
Information
Evening Peak Hour
Northern Intersection
Average Delay by
Level of Service (LOS) by
Average Delay by
Volumes
Degree of Saturation
95th Percentile Queue Length (m)
Approach
Mvt
Movement (s/veh)
Movement
Approach (s/veh)
Test
Test
PRs
Test
PRs
Test
PRs
Test
PRs
Test
PRs1
PRs2
PRs3
Victoria Road
T
263
12.8
53
B
D
0.333
0.800
41
90
100
N/A
19
19
(South)
R
45
52.3
53
D
D
0.361
0.800
14
90
100
N/A
Victoria Road
L
45
12.2
27
B
D
0.047
0.800
1
90
N/A
N/A
24
25
Official
(North)
T
276
25.5
27
C
D
0.523
0.800
73
90
N/A
N/A
L
45
12.6
33
B
D
0.072
0.800
2
100
N/A
500
Off ramp from
T
5
19.9
33
B
D
29
30
0.538
0.800
86
100
N/A
500
Expressway (West)
R
353
31.4
33
C
D
0.538
0.800
86
100
N/A
500
Intersection
-
1,032
24.3
35
C
C
-
-
-
-
-
-
-
-
the
Southern Intersection
Average Delay by
Level of Service (LOS) by
Average Delay by
Volumes
Degree of Saturation
95th Percentile Queue Length (m)
Approach
Mvt
Movement (s/veh)
Movement
Approach (s/veh)
Test
Test
PRs
Test
PRs
Test
PRs
Test
PRs
Test
PRs1
PRs2
PRs3
Victoria Road
L
254
12.2
13
B
D
0.255
0.800
9
70
N/A
N/A
12
13
(South)
T
221
12.3
13
B
D
0.251
0.800
39
70
N/A
N/A
L
45
12.4
47
B
D
0.101
0.800
2
40
N/A
450
Off ramp from
under
T
5
33.3
47
C
D
34
35
0.343
0.800
27
40
N/A
450
Expressway (East)
R
87
44.7
47
D
D
0.343
0.800
27
40
N/A
450
Victoria Road
T
584
1.9
49
A
D
0.483
0.800
27
90
100
N/A
5
5
(North)
R
45
48.1
49
D
D
0.240
0.800
13
90
100
N/A
Intersection
-
1,241
11.1
35
B
C
-
-
-
-
-
-
-
-
Queuing Criteria
Note 1
All lanes sufficient to accommodate 95th percentile queue without block adjacent
Note 2
Queuing between the two intersections does not exceed 100m in any lane
Note 3
Queuing from ramp terminals does not block back to the expressway (ramps provide approx 500m btw E/way and northern int, 450m btw E/way and southern)
Released
NZTA Contract No. 2/04-005-601, Waikato Expressway, Tamahere to Cambridge Section
Performance Assessment of Priority Intersection Layouts at 2041 at Victoria Road interchange, using SIDRA
Test
Priority Control @ 2041
Morning Peak Hour
Northern Intersection
Average Delay by
Level of Service (LOS) by
Average Delay by
Volumes
Degree of Saturation
95th Percentile Queue Length (m)
Approach
Mvt
Movement (s/veh)
Movement
Approach (s/veh)
Test
Test
PRs
Test
PRs
Test
PRs
Test
PRs
Test
PRs1
PRs2
PRs3 1982
Victoria Road
T
314
0.0
53
A
D
0.181
0.800
0
90
100
N/A
2
14
(South)
R
50
12.7
53
B
D
0.043
0.800
1
90
100
N/A
Victoria Road
L
51
11.7
19
B
D
0.046
0.800
1
90
N/A
N/A
2
18
(North)
T
304
0.0
19
A
D
0.175
0.800
0
90
N/A
N/A
Off ramp from
L
50
12.8
37
B
D
0.058
0.800
1
100
N/A
500
Act
Expressway
T
5
23.5
37
C
D
22
32
0.550
0.800
26
100
N/A
500
(West)
R
218
24.2
37
C
D
0.550
0.800
26
100
N/A
500
Intersection
-
992
7.3
35
-
C
-
-
-
-
-
-
-
-
Southern Intersection
Average Delay by
Level of Service (LOS) by
Average Delay by
Volumes
Degree of Saturation
95th Percentile Queue Length (m)
Approach
Mvt
Movement (s/veh)
Movement
Approach (s/veh)
Test
Test
PRs
Test
PRs
Test
PRs
Test
PRs
Test
PRs1
PRs2
PRs3
Victoria Road
L
490
11.9
17
B
D
0.382
0.800
14
70
N/A
N/A
7
15
(South)
T
314
0.0
17
A
D
0.181
0.800
0
70
N/A
N/A
L
50
13.9
46
B
D
0.066
0.800
2
40
N/A
450
Off ramp from
T
5
21.4
46
C
D
18
29
0.178
0.800
5
40
N/A
450
Expressway (East)
R
50
22.1
46
C
D
0.178
0.800
5
40
N/A
450
Victoria Road
T
472
0.0
50
A
D
0.271
0.800
0
90
100
N/A
1
13
Information
(North)
R
50
12.7
50
B
D
0.044
0.800
1
90
100
N/A
Intersection
-
1,431
5.8
35
-
C
-
-
-
-
-
-
-
-
Evening Peak Hour
Northern Intersection
Average Delay by
Level of Service (LOS) by
Average Delay by
Volumes
Degree of Saturation
95th Percentile Queue Length (m)
Approach
Mvt
Movement (s/veh)
Movement
Approach (s/veh)
Test
Test
PRs
Test
PRs
Test
PRs
Test
PRs
Test
PRs1
PRs2
PRs3
Victoria Road
T
292
0.0
53
A
D
0.168
0.800
0
90
100
N/A
2
19
Official
(South)
R
50
12.7
53
B
D
0.043
0.800
1
90
100
N/A
Victoria Road
L
50
11.7
27
B
D
0.045
0.800
1
90
N/A
N/A
2
25
(North)
T
307
0.0
27
A
D
0.176
0.800
0
90
N/A
N/A
Off ramp from
L
50
12.7
33
B
D
0.060
0.800
1
100
N/A
500
Expressway
T
5
53.6
33
F
D
50
30
0.951
0.800
134
100
N/A
500
the
(West)
R
392
54.4
33
F
D
0.951
0.800
134
100
N/A
500
Intersection
-
1,146
20.4
35
-
C
-
-
-
-
-
-
-
-
Southern Intersection
Average Delay by
Level of Service (LOS) by
Average Delay by
Volumes
Degree of Saturation
95th Percentile Queue Length (m)
Approach
Mvt
Movement (s/veh)
Movement
Approach (s/veh)
Test
Test
PRs
Test
PRs
Test
PRs
Test
PRs
Test
PRs1
PRs2
PRs3
Victoria Road
L
282
11.6
13
B
D
0.189
0.800
2
70
N/A
N/A
6
13
(South)
under
T
245
0.0
13
A
D
0.141
0.800
0
70
N/A
N/A
L
50
15.5
47
C
D
0.078
0.800
2
40
N/A
450
Off ramp from
T
5
28.7
47
D
D
25
35
0.407
0.800
13
40
N/A
450
Expressway (East)
R
97
29.5
47
D
D
0.407
0.800
13
40
N/A
450
Victoria Road
T
649
0.0
49
A
D
0.373
0.800
0
90
100
N/A
1
5
(North)
R
50
12.4
49
B
D
0.040
0.800
1
90
100
N/A
Intersection
-
1,378
5.6
35
-
C
-
-
-
-
-
-
-
-
Queuing Criteria
Note 1
All lanes sufficient to accommodate 95th percentile queue without block adjacent
Note 2
Queuing between the two intersections does not exceed 100m in any lane
Note 3
Queuing from ramp terminals does not block back to the expressway (ramps provide approx 500m btw E/way and northern int, 450m btw E/way and southern)
Released
NZTA Contract No. 2/04-005-601, Waikato Expressway, Tamahere to Cambridge Section
Performance Assessment of Signal Intersection Layouts at Victoria Road interchange, using SIDRA
Test
Signal Control @ 2041
Morning Peak Hour
Northern Intersection
Average Delay by
Level of Service (LOS) by
Average Delay by
Volumes
Degree of Saturation
95th Percentile Queue Length (m)
Approach
Mvt
Movement (s/veh)
Movement
Approach (s/veh)
Test
Test
PRs
Test
PRs
Test
PRs
Test
PRs
Test
PRs1
PRs2
PRs3 1982
Victoria Road
T
314
7.2
53
A
D
0.325
0.800
34
90
100
N/A
13
14
(South)
R
50
52.5
53
D
D
0.401
0.800
16
90
100
N/A
Victoria Road
L
51
12.2
19
B
D
0.053
0.800
2
90
N/A
N/A
18
18
(North)
T
304
18.9
19
B
D
0.432
0.800
57
90
N/A
N/A
Off ramp from
L
50
12.6
37
B
D
0.083
0.800
2
100
N/A
500
Act
Expressway
T
5
24.8
37
C
D
32
32
0.446
0.800
69
100
N/A
500
(West)
R
218
36.3
37
D
D
0.446
0.800
69
100
N/A
500
Intersection
-
992
20.1
35
C
C
-
-
-
-
-
-
-
-
Southern Intersection
Average Delay by
Level of Service (LOS) by
Average Delay by
Volumes
Degree of Saturation
95th Percentile Queue Length (m)
Approach
Mvt
Movement (s/veh)
Movement
Approach (s/veh)
Test
Test
PRs
Test
PRs
Test
PRs
Test
PRs
Test
PRs1
PRs2
PRs3
Victoria Road
L
490
12.5
17
B
D
0.513
0.800
23
70
N/A
N/A
14
15
(South)
T
314
16.6
17
B
D
0.408
0.800
67
70
N/A
N/A
L
50
12.8
46
B
D
0.102
0.800
3
40
N/A
450
Off ramp from
T
5
26.3
46
C
D
25
29
0.140
0.800
14
40
N/A
450
Expressway (East)
R
50
37.8
46
D
D
0.140
0.800
14
40
N/A
450
Victoria Road
T
472
4.8
50
A
D
0.438
0.800
42
90
100
N/A
9
13
Information
(North)
R
50
49.6
50
D
D
0.301
0.800
15
90
100
N/A
Intersection
-
1,431
13.1
35
B
C
-
-
-
-
-
-
-
-
Evening Peak Hour
Northern Intersection
Average Delay by
Level of Service (LOS) by
Average Delay by
Volumes
Degree of Saturation
95th Percentile Queue Length (m)
Approach
Mvt
Movement (s/veh)
Movement
Approach (s/veh)
Test
Test
PRs
Test
PRs
Test
PRs
Test
PRs
Test
PRs1
PRs2
PRs3
Victoria Road
T
292
13.1
53
B
D
0.369
0.800
47
90
100
N/A
19
19
Official
(South)
R
50
52.5
53
D
D
0.401
0.800
16
90
100
N/A
Victoria Road
L
50
12.2
27
B
D
0.053
0.800
2
90
N/A
N/A
24
25
(North)
T
307
26.0
27
C
D
0.582
0.800
83
90
N/A
N/A
Off ramp from
L
50
12.8
33
B
D
0.084
0.800
3
100
N/A
500
Expressway
T
5
20.6
33
C
D
30
30
0.596
0.800
99
100
N/A
500
the
(West)
R
392
32.1
33
C
D
0.596
0.800
99
100
N/A
500
Intersection
-
1,146
24.7
35
C
C
-
-
-
-
-
-
-
-
Southern Intersection
Average Delay by
Level of Service (LOS) by
Average Delay by
Volumes
Degree of Saturation
95th Percentile Queue Length (m)
Approach
Mvt
Movement (s/veh)
Movement
Approach (s/veh)
Test
Test
PRs
Test
PRs
Test
PRs
Test
PRs
Test
PRs1
PRs2
PRs3
Victoria Road
L
282
12.4
13
B
D
0.292
0.800
11
70
N/A
N/A
12
13
(South)
under
T
245
12.5
13
B
D
0.279
0.800
44
70
N/A
N/A
L
50
12.6
47
B
D
0.127
0.800
2
40
N/A
450
Off ramp from
T
5
33.5
47
C
D
34
35
0.380
0.800
30
40
N/A
450
Expressway (East)
R
97
45.0
47
D
D
0.380
0.800
30
40
N/A
450
Victoria Road
T
649
2.0
49
A
D
0.537
0.800
33
90
100
N/A
5
5
(North)
R
50
48.3
49
D
D
0.267
0.800
15
90
100
N/A
Intersection
-
1,378
11.2
35
B
C
-
-
-
-
-
-
-
-
Queuing Criteria
Note 1
All lanes sufficient to accommodate 95th percentile queue without block adjacent
Note 2
Queuing between the two intersections does not exceed 100m in any lane
Note 3
Queuing from ramp terminals does not block back to the expressway (ramps provide approx 500m btw E/way and northern int, 450m btw E/way and southern)
Released