link to page 1

Document 1
Aide Memoire: ACC FTE numbers 2017-2023
To
Andy Milne, DCE, Strategy Engagement and
Priority
Medium
Planning
From [Out of Scope]
Head of Government Engagement
Reference
GOV-024942
Date 28 July 2023
Security rating In confidence
Purpose
1. This aide memoire provides a high-level overview of changes in ACC’s full-time
equivalen
t1 (FTE) numbers since 2017.
Changes in FTE numbers over time
2. Since June 2017, ACC’s total FTE has increased by 658 (19%), with growth of 437
in customer facing roles and 222 in corporate roles. This growth has occurred over
time and is due to a range of factors, some of which are outlined below.
3.
A need to ensure clients continue to receive quality service. Over the last five
years, ACC has seen growth in the number of claims that require active case
management, including claims receiving weekly compensation and other
entitlements. These claims require more staff time to process, creating pressure at
the frontline requiring more staff to maintain our service delivery.
4.
Customer facing roles have experienced very high attrition rates. Due to the
time it takes to train a person to full capability and the impact this has on
experienced staff who assist in training, attrition has required additional FTE to
maintain an adequate level of service to clients.
5.
Changes in ACC’s case management approach. In 2019, ACC introduced the
Next Generation Case Management Model to make ACC more ‘client-centric’. The
model was also designed to create efficiencies by targeting the right level of support
to each client. Customer facing FTE increased to implement and maintain this new
approach. The 2020 ‘One Front Door’ initiative also led to further FTE growth in the
contact centre to support workflow in the assisted recovery stream and improve
customer experience.
6.
Investment in modern technology. Over the last five years, ACC has made
significant investment in modern and reliable technology to ensure we have a
resilient system that delivers a consistent service for our clients. While these
systems provide additional features and functionality, they also require additional
1 FTE includes permanent, temporary, and casual staff and makes up 97% of ACC’s total workforce.
Page 1 of 2
link to page 2
Document 1
corporate FTE to implement and maintai
n2. ACC has also added several technology
roles, which had previously been done by contractors.
7.
An expansion in ACC’s service offerings. In response to changes in the social
landscape overtime, there has been a greater emphasis on making ACC an
equitable scheme that supports improved access, experience, and outcomes for
different groups, including Māori. This focus has led to an expansion of our service
offerings, including through the delivery of Kaupapa Māori services, initiatives such
as Rongoā, and cover for maternal birth injuries, resulting in an associated increase
in FTE.
8.
Organisational changes to ensure ACC can effectively support our clients.
Since 2017, ACC has made changes to organisational structure that resulted in
increased FTE across corporate areas. In addition, corporate FTE roles have been
added to support workload growth and the delivery of new projects. Some examples
are outlined below however it is likely that smal changes within business groups
have incremental y contributed to overall growth.
• The Pae Ora group was established in 2020. This group has been
fundamental to embedding ACC's cultural capability and has supported the
development, roll-out and implementation of cultural capability strategies. In
September 2023, ACC will shift to a new model that embeds our cultural
capability across the organisation.
• To further enhance ACC's customer centric goals, there was a 2021
restructure of the Customer Group to create a function that supports and
influences ACC in the areas of strategic planning, design, digital solutions,
and customer engagement.
• In 2022, ACC strengthened its focus on privacy following recommendations
from the independent review. Additional FTE was added to the Privacy team.
9. While ACC’s FTE has increased, its FTC decreased from 184 in June 2017 to 138 in
March 2023. This is primarily because of the completion of key projects, increased
internal capability and the conversion of FTC into FTE roles to increase long-term
value to the public.
Next steps
10. ACC is placing a renewed focus on managing its headcount moving forward. The
Executive Team recognises the need for greater control over its FTE headcount,
including through a whole of organisation stock-take and defining operating
principles to inform future decisions.
2 Historical systems were largely unsupported and had change restrictions due to their level of complexity. They therefore required few
FTE to maintain.
Page 2 of 2
 Document 2
se
Document 2
se
FOR DECISION
Board Paper – ACC’s 2024/25 Strategic Priorities
Purpose
To update the Board on Management’s strategic priorities and 2024/25 work plan, including
immediate and longer-term work to improve rehabilitation performance, and seek Board
approval to increase ACC’s 2024/25 operating budget for additional Service Delivery full time
equivalent (FTE) staff.
Key Points
•
ACC’s operating context has changed significantly over the last twelve months, with
ongoing deterioration in rehabilitation performance, increased fiscal constraint, and new
expectations from government. In response, we have identified four strategic priorities to
drive a whole-of-organisation focus through improved prioritisation and targeting of
effort.
•
Management has developed an Enterprise Workplan for 2024/25, aligned to these
priorities. This plan focuses on maintaining and enhancing key technology enablers,
setting ACC up for longer-term system change, and delivering immediate service
improvements targeting rehabilitation performance.
•
We have developed a three-year Investment Plan to deliver our strategic priority to
improve rehabilitation performance. Initiatives identified in year one of this plan are
included in the Enterprise Workplan 2024/25. As signaled to the Board in April, year one
initiatives include a proposal to increase the number of FTE in Service Delivery, to
support stabilising ACC’s case management system.
•
This capacity uplift requires an increase in ACC’s 2024/25 operating budget of
$23.2 million, reducing the level of savings we can deliver to 4% compared to our
HYEFU baseline. However, this increase will deliver longer-term benefits for the
scheme, including improvements in key Service Agreement measures (Average Weekly
Compensation Days Paid and the growth rate of the Long-Term Claims Pool) and
reductions in contracted spend for health services and OCL strain.
Recommendations
1.
Note that
Management have developed four strategic priorities for the next one-three
years, which are aligned to our Letter of Expectations and wil support progress
towards the goals of Huakina Te Rā.
2.
Discuss the proposed work programme for improving ACC’s rehabilitation
performance and Service Delivery capacity uplift.
3.
Approve a
$23.2 million increase in ACC’s 2024/25 operating budget to
$913.1 million (with forecast 2025/26 impact of
$30.2 million and s9(2)(f)(iv)
to enable an increase in Service Delivery FTE, which wil be reflected in
September 2024 HYEFU forecasts submitted to The Treasury.
Prepared by
out of scope
Amanda Malu, DCE Service Delivery and Andy Milne, DCE Strategy
Approved by
Engagement and Planning
Date
25 June 2024
Page 1
IN CONFIDENCE
Report
1. Strategic priorities and workplan
ACC has delivered key foundational work throughout the first year of Huakina Te Rā
2023/24 was the first year of Huakina Te Rā, ACC’s strategy for 2023-2033. Guided by our
Enterprise Plan 2023/24, over the last year, ACC has delivered a range of foundational work
to progress the goals of Huakina Te Rā. This includes investing in key technology enablers,
developing and enabling the capability of our people, and delivering new services.
Throughout 2023, ACC also progressed substantive exploratory work to better understand
our current rehabilitation system and identify opportunities for improvement, including the
Rehabilitation Improvement Group and Health Commissioning Review. Work delivered
throughout 2023/24 was underpinned by eight strategic waypoints, intended to guide our
focus on delivering Huakina Te Rā over the medium-term.
Our operating context changed significantly throughout 2023/24, with ongoing
deterioration in ACC’s rehabilitation performance and new expectations from
government
ACC’s operating context has changed significantly since the launch of Huakina Te Rā.
Deterioration in rehabilitation performance has continued, driven by historically high demand,
capability and capacity constraints, challenges with the efficiency and effectiveness of ACC’s
case management model, and external factors like health sector pressure and economic
influences. Declining rehabilitation performance translates into worse outcomes for injured
people and financial pressure on the scheme.
ACC is now operating in a constrained fiscal environment, with clear direction from
government on the need for expenditure restraint and fiscal discipline. ACC is expected to
operate efficiently, effectively and in a financially responsible manner. As part of their fiscal
sustainability programme, government has also signalled an intention to return to surplus
overtime. ACC directly contributes to the Crown’s overall financial position (OBEGAL)
through our Outstanding Claims Liability, which partly reflects performance trends.
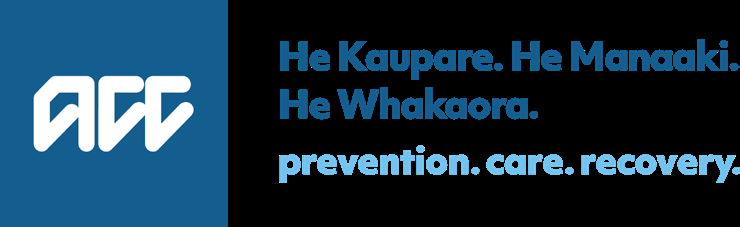
Management has identified four strategic priorities to drive a whole-of-organisation
focus on improvement
In response to these contextual factors, and the pressing need to improve our rehabilitation
performance, Management has identified four strategic priorities for ACC over the next one-
three years:
•
Improve rehabilitation performance: Drive better client outcomes across the
rehabilitation system using data, evidence, and insights to deliver excellent case
management, agreed pathways of care and effective commissioning for outcomes.
•
Improve scheme access and experience for Māori and identified population
groups: Understand and remove access barriers as a foundation to achieving Mana
Taurite | Equity and improve experience of the rehabilitation system in a way that
works for our communities.
•
Drive an injury prevention culture across Aotearoa New Zealand: Leverage our
insights and influence to reduce the incidence and impact of injury, including how we
contract with providers, deliver for our clients, and partner with other agencies and
communities.
•
Deliver an efficient, capable, and resilient ACC: Activate and enable our people to
achieve an efficient, effective, and resilient ACC, and protect the long-term
sustainability of the scheme, including by strengthening our controls environment.
Page 2
IN CONFIDENCE
These strategic priorities are aligned to ACC’s Letter of Expectations and will support
prioritisation and targeting of effort in the context of increased organisational restraint. To
monitor progress, each priority includes one- and three-year outcome statements.
Organisational success wil be measured against key Service Agreement measures,
supplemented by several ‘leading’ operational indicators.
These priorities have informed development of ACC’s Enterprise Plan 2024/25
The Enterprise Plan outlines the initiatives ACC intends to deliver throughout 2024/25 to
progress our strategic priorities and year-one success measures. Building on work delivered
throughout 2023/24, the Enterprise Plan focuses on investing in key technology enablers to
ensure short-term resilience, while setting ACC up for longer-term system change, and
delivering immediate service improvements targeting rehabilitation performance.
This Plan is funded through ACC’s operating budget, primarily the Change Portfolio.
This portfolio has a FY2024/25 budget of
$80 million, which was reduced from
$105 million
(
$95+
$10 million contingency) in the current financial year, as part of ACC’s fiscal savings
exercise. An overview of our strategic priorities and Enterprise Plan is outlined in
Figure 1.
Page 3
IN CONFIDENCE
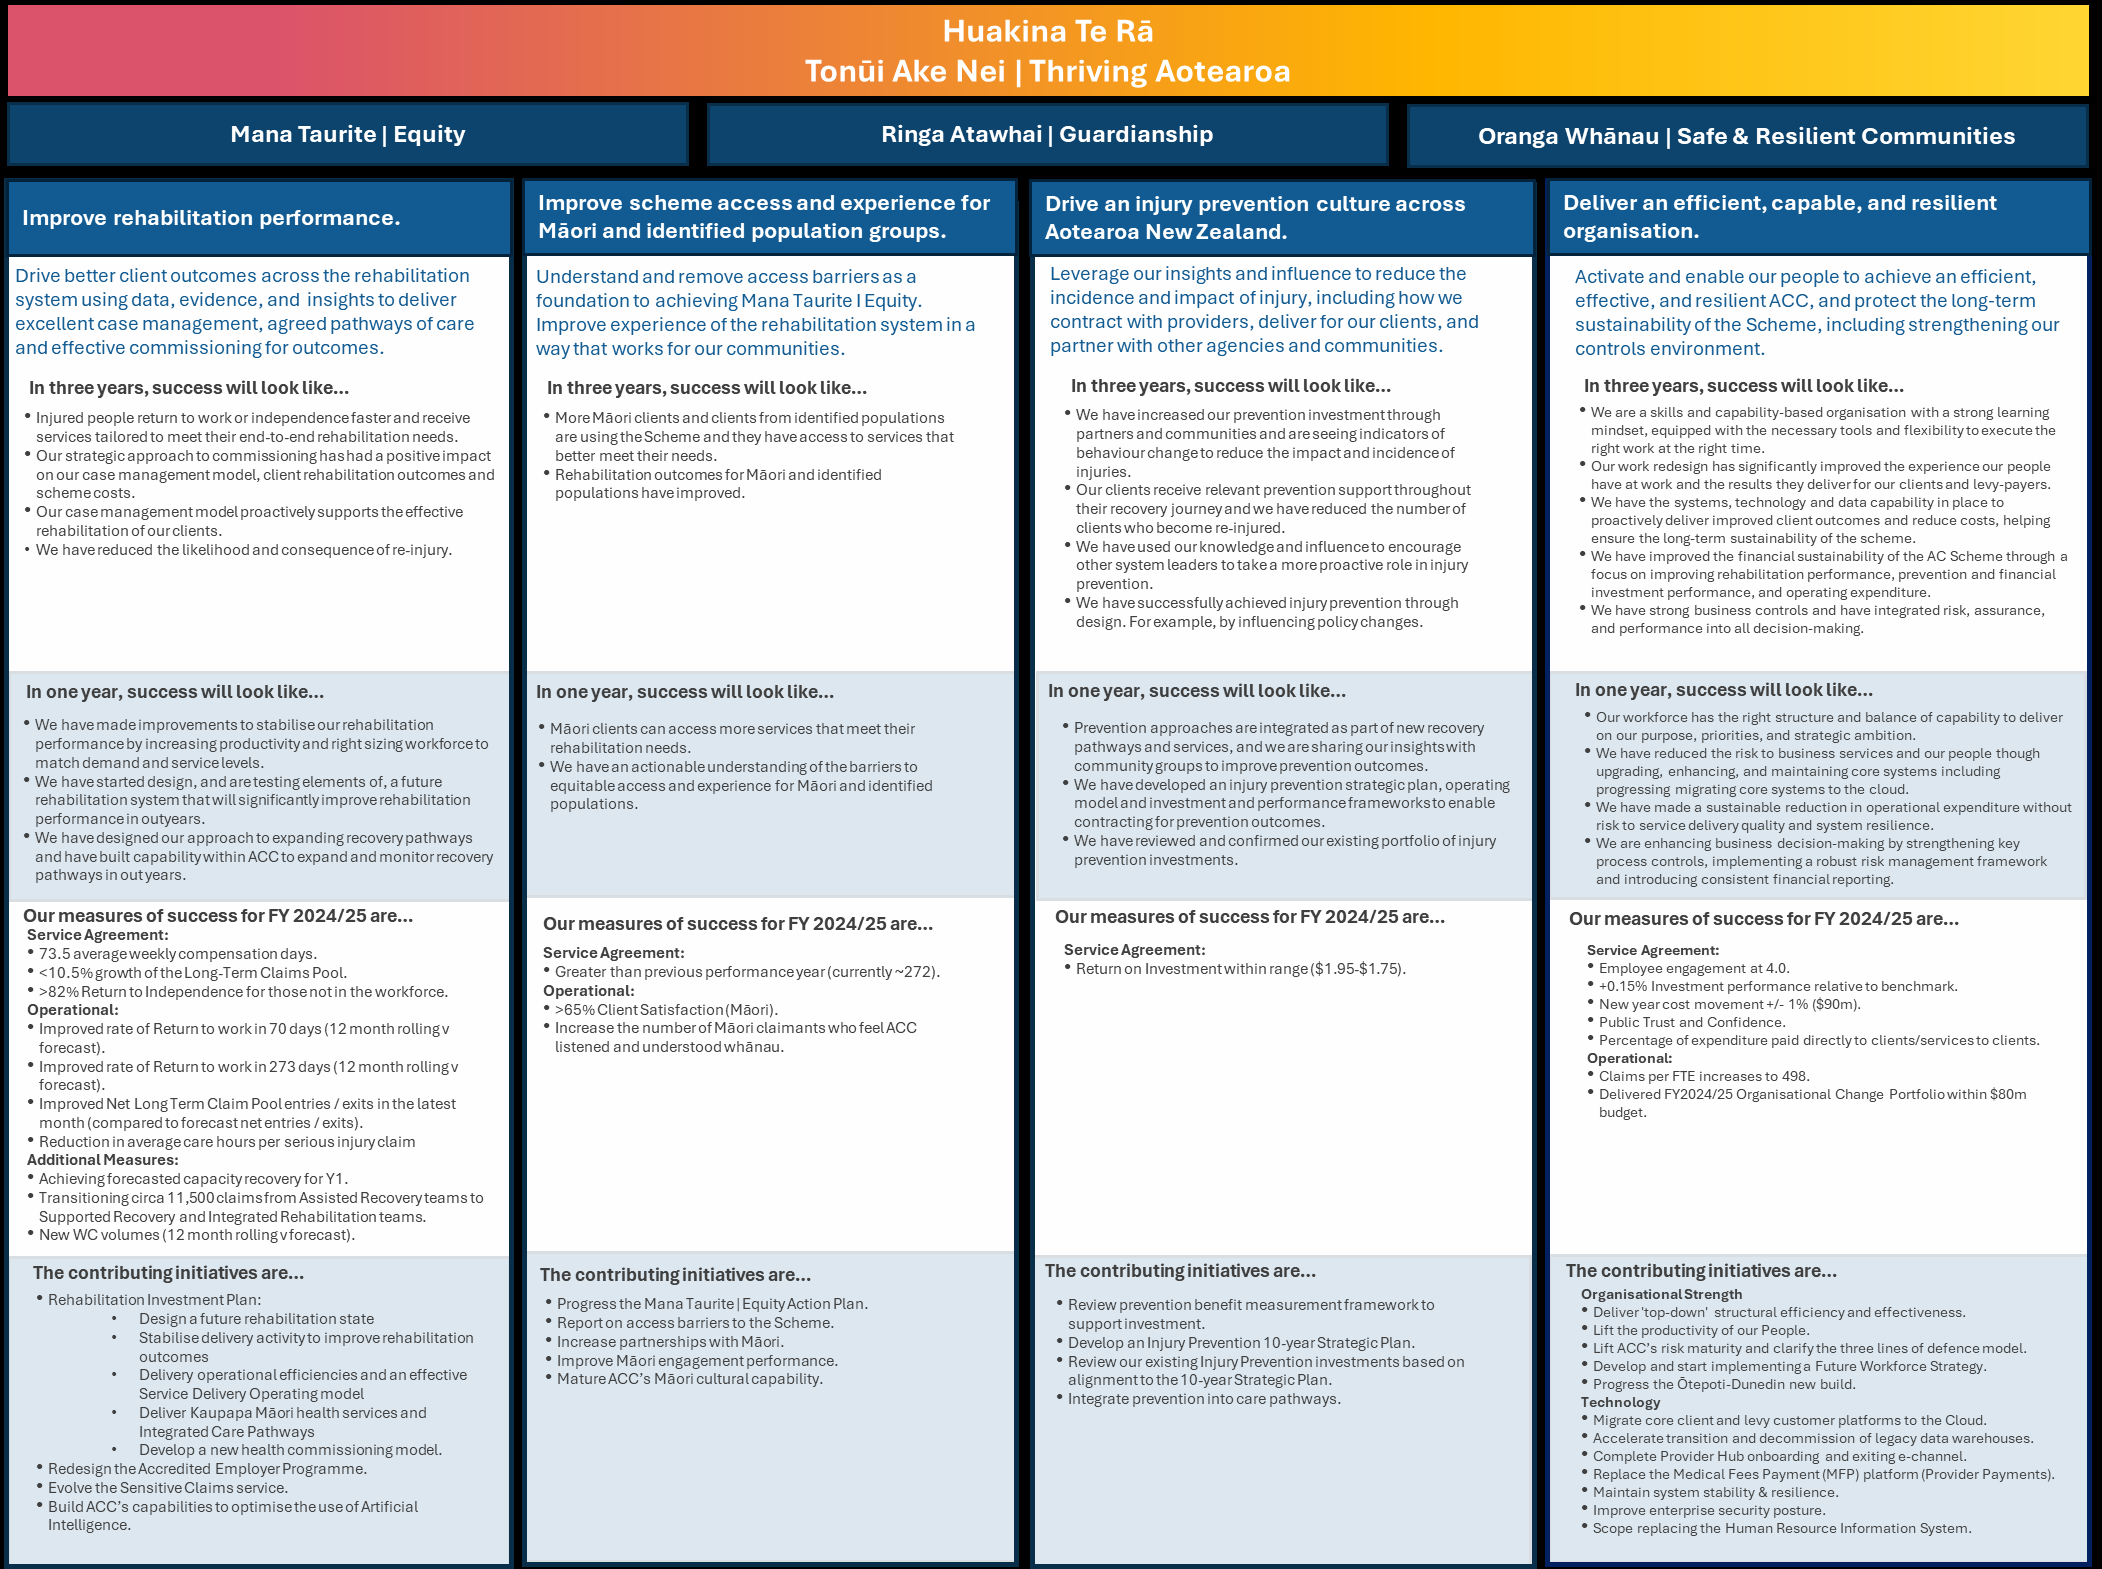 Figure 1: ACC Strategic Priorities and Enterprise Plan 2024/25
Page 4
IN CONFIDENCE
2. ACC’s work programme for improving rehabilitation performance
Management has developed a detailed Investment Plan to deliver our strategic priority
to improve rehabilitation performance
As signalled to the Board in March, Management has developed a three-year Investment
Plan, outlining a work programme to improve the sustainability and effectiveness of ACC’s
rehabilitation performance. Initiatives identified in year one of this plan are included in the
Enterprise Workplan 2024/25, specifically initiatives aligned to the ‘improve rehabilitation
performance’ strategic priority, with additional detail available in the full plan.
As the scale of change required is significant, the Investment Plan is phased over the
three-year period. To balance short-term improvements with advancing systemic longer-term
changes, it focuses on three areas:
•
Stabilise: Ensuring our current rehabilitation system is stable, efficient, and effective
through immediate, tactical activities to alleviate pressure, streamline processes
where appropriate, improve productivity, and create the system conditions required to
enable broader change.
•
Enhance: Building on existing areas of strength and opportunity, which respond to
the challenges identified and are aligned to our future rehabilitation and case
management approach - for example, the expansion of current care pathways.
•
Change: Fundamentally changing ACC’s rehabilitation system to deliver an
integrated, end-to-end approach, including through our case management approach,
enabling processes and systems, and how we commission and deliver rehabilitation
services.
The detailed
plan is available, and a summary outlined in
Appendix 1, including the work
programme and anticipated benefits.
More detail is provided for work planned over the next 12-18 months than in out years.
Five focus areas are prioritised within the plan: onboarding and rehabilitation activation,
seamless financial support, care pathways, health commissioning and using injury
prevention as a lever to reduce the incidence and impact of injuries.
The Investment Plan includes a proposal to increase the number of Service Delivery
FTE, to support stabilising ACC’s case management system
As outlined to the Board previously, sustained high demand for ACC services, coupled with
workforce challenges and systemic capacity shortages, has resulted in our case
management system becoming overloaded. This impacts our ability to proactively support
clients, leading to poor rehabilitation outcomes and financial pressure on the scheme.
The Investment Plan will alleviate some drivers of short-term performance decline and
release capacity back into the system longer-term. However, initiatives wil take time to
implement and won’t meaningfully shift Service Agreement measures in the short-term.
Urgent action is needed to stabilise the system and ensure deteriorating rehabilitation
performance does not continue.
In
April, the Board approved in-principle a 250 FTE increase to essential areas of
Service Delivery, to address insufficient case management staffing and support stabilising
the rehabilitation system. Since April, Management has progressed design and planning
work to determine how this FTE can be best utilised. We propose targeting the following
areas:
Page 5
IN CONFIDENCE
• Expanding the pool of Assisted Recovery
1 clients who receive proactive 1:1 case
management support, with a focus on preventing clients from entering the long-term
claims pool (LTCP) and supporting LTCP clients who have the potential to achieve a
positive rehabilitation outcome. This is in addition to the cohort of new weekly
compensation clients who are currently transitioning to this form of case
management.
• Improving management of Serious Injury claims by increasing the capacity and
capability of Partnered Recovery
2.
We have progressed detailed costings to determine funding requirements to deliver
our rehabilitation strategic priority
Detailed costings indicate approximately
$15 million is required to deliver year-one
Investment Plan initiatives, funded through ACC’s Change Portfolio. A breakdown of these
costs is outlined
on page 6 of the full plan. Ongoing investment wil be required in years two
and three of the plan; specific figures will be refined through future design and planning work
and funded through outyear operating budgets.
In March, the Board approved ACC’s 2024/25 operating budget of
$844 million ($890m
including depreciation and amortisation), representing a 6.5% reduction from our HYEFU
baseline. Funding additional Service Delivery FTE requires increasing the 2024/25 budget
by
$23.2 millon to
$866.7 million baseline (
$913.1 million including depreciation and
amortisation) and reduces the level of savings we can deliver to 4%. These costs also flow
through to out years.
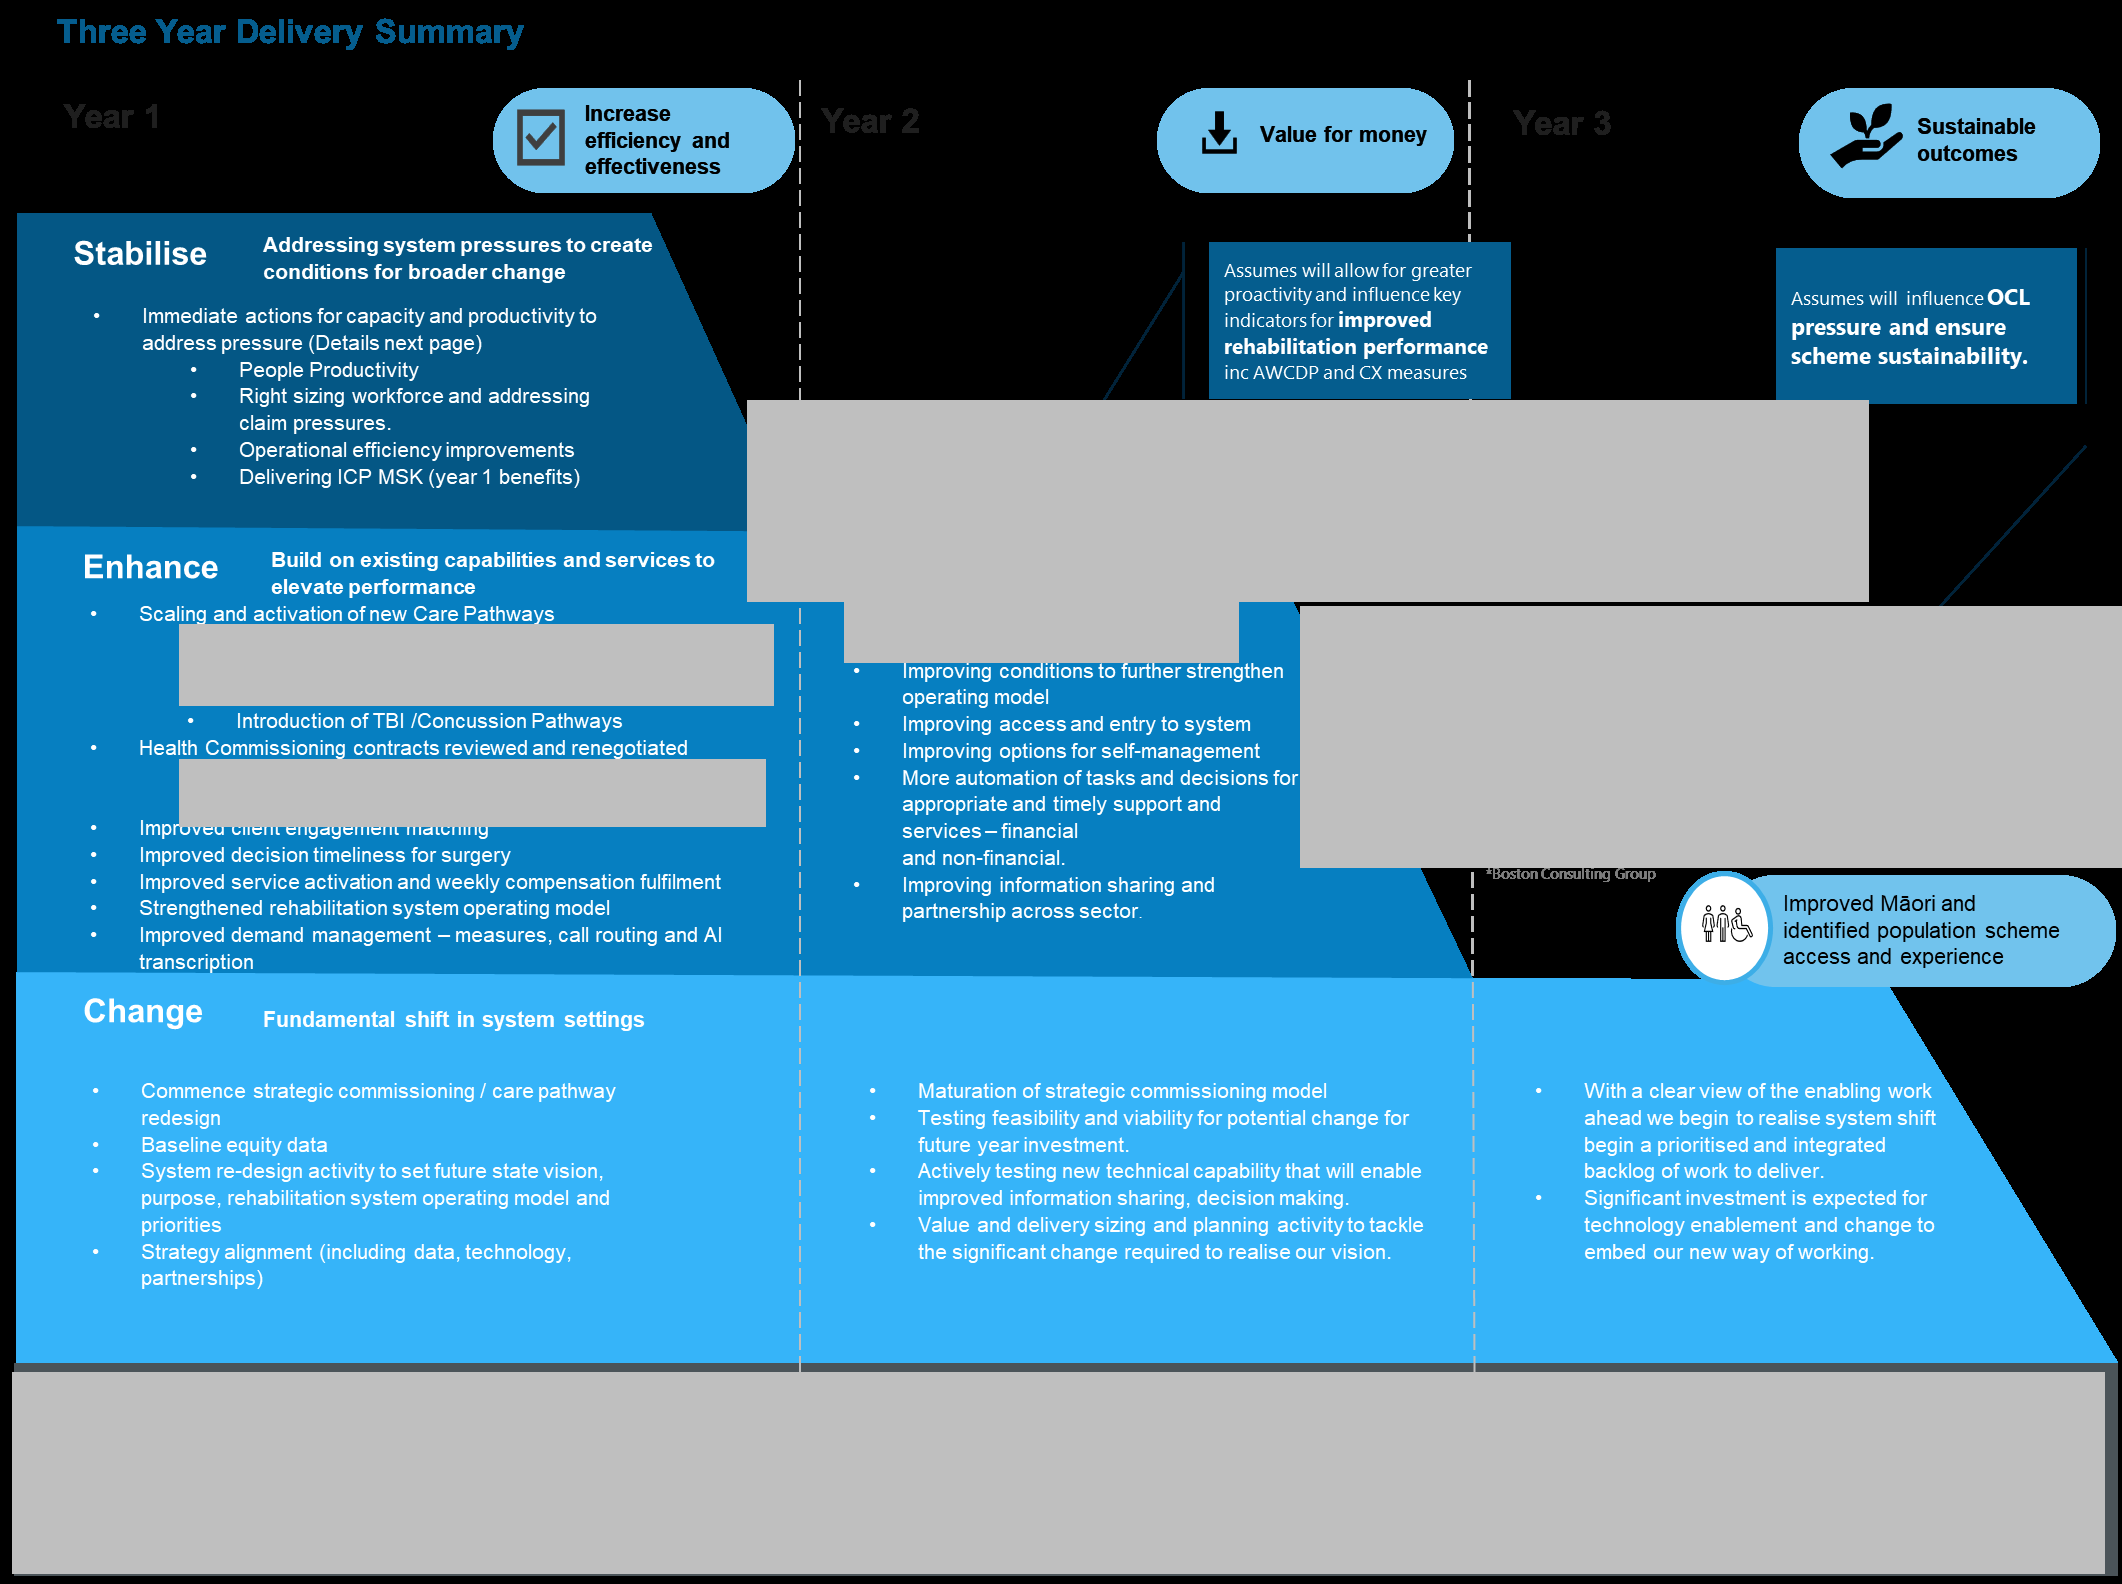
The Investment Plan is expected to deliver multiple benefits over the next three years
While additional FTE requires a trade-off in the level of savings ACC can deliver in 2024/25,
this wil deliver a significant return-on-investment longer-term. We expect benefits to be
realised cumulatively over time, with an initial focus on efficiency and effectiveness
translating into improved value-for-money and rehabilitation outcomes over three years.
An overview of expected year-one benefits is outlined below. Additional information is
available in the full
Investment Plan and
Appendix 1:
• s9(2)(j)
• s9(2)(ba)(ii)
• Stabilisation of performance at Service Agreement target levels through a reduction
in Average Weekly Compensation Days Paid (AWCDP) and the growth rate of the
Long-Term Claims Pool (LTCP). Additional information on these benefits is provided
below.
1 Assisted Recovery is primarily for clients where one to many relationship would suffice between the
recovery team member and clients. Periodic engagement where a personal and consistent
relationship is not required.
2 Partnered Recovery is for claims that are likely to require specialist rehabilitation support. Clients
build a relationship with a dedicated Recovery Partner who supports them to manage their injury or
recovery. Specialist engagement with intensive and extensive needs, with an understanding of the
level of vulnerability and complexity being required.
3 s9(2)(j)
Page 6
IN CONFIDENCE
Analysis indicates increased Service Delivery FTE has the potential to improve our
Service Agreement measures
s9(2)(j)
Internal recruitment for additional Service Delivery FTE is underway
Management is working at pace to progress recruitment of Service Delivery FTE, with
internal recruitment already underway. FTE wil be onboarded in tranches and will begin
supporting clients within a two-month period, building up to a full case load over time.
The first tranche is expected to be onboard from July 2024 and all new FTE fully transitioned
by April 2025.
These roles also provide additional redeployment opportunities for staff potentially impacted
by the wider organisational change process. The timing and approach for sourcing
leadership and specialist roles wil need to be carefully managed to enable internal staff to
express preference for new roles prior to any external hiring, while not unreasonably
delaying the impact of the uplift.
Management will closely monitor progress to ensure this work is delivering expected
benefits
Management will monitor delivery against the Enterprise Plan, including progress of key
activities and performance against Service Agreement and other measures. There is a risk
additional FTE wil not be sufficient to sustainably improve rehabilitation performance. While
modelling indicates 359 total FTE are required to fully right-size our workforce under current
operational settings, we have sought 250 FTE on the basis other Investment Plan initiatives
will, all other things being equal, release capacity throughout 2024/25.
Management wil closely monitor the progress of recruitment, onboarding, and capability
development throughout 2024/25 to understand whether expected benefits are being
realised. We wil also conduct six-monthly modelling to assess workforce requirements
across our case management system and inform budget planning. As broader changes to
fundamentally improve ACC’s rehabilitation system are delivered through the Investment
Plan, we expect ACC’s need to use FTE uplift as a performance lever to reduce.
Page 7
IN CONFIDENCE
3. Next Steps
Subject to Board approval, ACC wil recognise the $23.2m increase to our 2024/25 operating
budget, and changes in out years, in the September 2024 HYEFU forecasts submitted to
The Treasury. We wil also continue to progress recruitment of additional Service Delivery
FTE, including by offering this as a deployment opportunity for staff impacted through ACC’s
current organisational change proposal.
We wil report to the Board on the progress of key rehabilitation performance measures and
initiatives monthly, in addition to the regular Service Agreement Quarterly Reporting.
Page 8
IN CONFIDENCE
 Appendix 1 – Rehabilitation Performance Improvement Work Programme and Benefits Summary
s9(2)(ba)(ii)
s9(2)(j)
s9(2)(j)
s9(2)(j)
s9(2)(j)
s9(2)(j)
Page 9
IN CONFIDENCE
s9(2)(j)
s9(2)(j)
[ s 9(2)(ba)(ii) ]
Page 10
IN CONFIDENCE
Appendix 2 – Performance Impact Across Different Scenarios
s9(2)(j)
Page 11
IN CONFIDENCE
Page 12
IN CONFIDENCE


Document 3
Case Management Resourcing Plan
DATE: June 2024


Document 3
Table of Contents
TOPIC
SLIDES
Executive Summary
3 – 5
Solution Details
6 – 8
Implementation Plan
9 – 13
Expected Outcomes
14 – 19
Financial Impact
20 – 21
Performance Monitoring
22 – 23
Appendix
24 – 25
2

Document 3
Executive Summary
3

Document 3
ACC rehabilitation system is under significant pressure
Growth in demand
Sustained claims
An under resourced
More managed
growth
staffing model
claims in the system
New claim registration (12 months to April)
5.5%
Claims requiring a
Weekly Compensation commencements
Inefficiencies in the
6.1%
higher level of
Consistently high
way work is
support than we
workloads
managed
have capacity for
More managed claims than April 2023
~12K
Challenges to fulfil
Record numbers of
Claims currently in Assisted more effectively
~12K
request in a timely
clients moving into /
manner causing
staying in the long
managed in Supported
preventable demand
terms claim pool
Declining rehabilitation performance translates into worse outcomes for injured people and financial pressure on the scheme.
Urgent action is
needed to stabilise the system and lay the groundwork for future improvements.
4

Document 3
Expansion of workforce will partly restore the rehabilitation system
The proposed solution, comprising the following two components, will help increase capacity, allow for active management of clients who require our
support, deliver improved outcomes and reduce ACC’s overall contribution to the OBEGAL deficit, while maintaining sustainable caseload levels.
#1 – Enabling proactive 1:1 case management
#2 – Optimizing the management of
support for an additional c.12,000 claims
215 FTE
Serious Injury claims
35 FTE
Caseload – 1:55
Caseload – 1:28
Expected Performance Impact1
Expected Performance Impact2
Performance
Actual
Target
Performance Indicator
Performance
Indicator
30 April 2024 30 June 2025 30 June 2026
(to FY26/27)
AWCDP (Days)
72.3
73.5
73.0
OCL (via reduction in care hours)
$450 million
LTCP Volume
22,060
24,539
26,455
OCL (via reduction in residential care spend)
$260 million
LTCP Growth Rate
10.7%
10.5%
7.8%
Total OCL reduction
$710 million
This would increase the 24/25 budget by $23.2m (2.7%) and reduce savings from ACC’s budget reduction initiatives from 6.5% to 4%
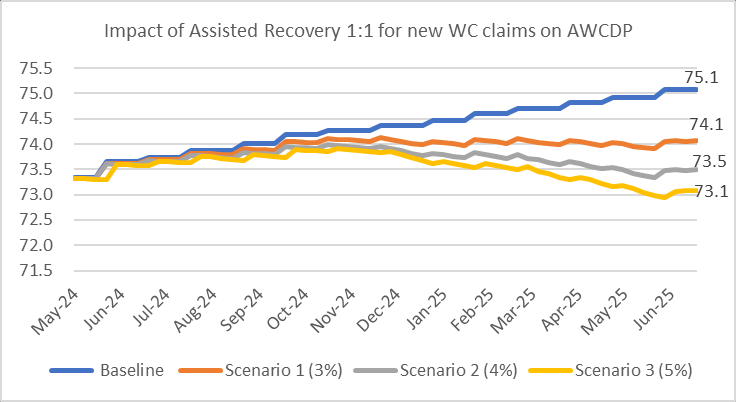
1Assumes scenario 2 in Stage 1 and “No change” scenario in Stage 2 modelling (see slide 17). If rehabilitation performance continued on its current trajectory, the AWCDP measure would reach 75.1 days at
June 2025 and 76.2 days at June 2026, resulting in a LTCP growth rate of 11.7% and 9.5% for the same periods
2Assumes ‘Realistic’ scenario in scenario modelling (see slide 18)
5

Document 3
Solution Details
6


Document 3
A two-pronged approach is proposed to enable proactive 1:1 case
management support for an additional c.12,000 claims
By establishing a ringfenced “Integrated Recovery” team
Ringfencing enables a deliberate focus on LTCP
Having two functions
Reduce the LTCP
clients3 and allows for tailored onboarding to achieve
(Integrated and
speed to competency, testing and learning from new
Supported) with specific
1
approaches, carefully managing the success/
focus areas and goals,
performance reporting, and running effective trials.
helps initially set these
functions up as quickly
By reshaping the core focus of current “Supported
as possible, and manage
2
Recovery” team
them in the longer-term
Prevent claims from
towards their
This allows for actively supporting new and existing
entering the LTCP
performance goals.
clients who are “at risk of delayed recovery”, requiring
consideration of new rehabilitation pathways.
3This cohort is a significant one. See Appendix for the LTCP profiles and research focussing on this cohort.
7


Document 3
Increasing the capacity and capability of Partnered Recovery is proposed
in order to allow for optimizing the management of Serious Injury claims
Enable optimum
Expand the expert
A two-fold strategy
1
caseloads
advisory support
2
Optimizing the
management of serious
injury claims would
impact positively on
This supports improving client
This enables an increase in the
OCL strain related to
outcomes, by enabling the
scope of coverage of the high
capacity of our recovery partners
serious injury attendant
value work of this team.
to work to the level of intensity
care and residential
needed to ensure clients receive
support services
optimum support.
8

Document 3
Implementation Plan
9


Document 3
The plan considers internal recruitment, upskilling opportunities, and
improved learning solutions
➢ Recruitment for the 250 FTEs commenced 27 May 2024.
➢ Beyond the initial 250 frontline roles, Service Delivery is estimating a need to replace c.400 additional positions to
compensate for natural attrition. This will present numerous opportunities for our current staff, particularly those affected
by the changes.
Recruitment
➢ Employees impacted by the change process will be given due consideration for these roles in accordance with their
affected status.
“Fit for purpose” induction, enabling a foundational understanding and confidence within the induction period.
➢ Integrates classroom learning with planned & incremental on-the-job training. Increases face-to-face learning.
➢ System of expert support in the form of practice mentors and leaders with domain knowledge.
Onboarding /
➢ Evidence-based ratio of practice mentors (support) post induction.
Training
This plan reflects an achievable yet aggressive onboarding timeline
(see slide 12 for further details).
10

Document 3
The required FTE will be transitioned in three tranches4
Tranche 1
Tranche 2
Tranche 3
Transition 200 existing FTEs to manage new claims < 365 WC days
Transition 42 existing FTEs to manage claims < 365 WC days
Assisted
Supported
Recovery
Recovery
82 FTEs to manage claims < 365 WC days
RTW2
Transition 124
Partnered
existing FTEs
250 New
Recovery5
currently
FTEs
managing Long
35 FTEs to
Term claims
manage/support
Assisted
Serious Injury
84 FTEs to manage Long Term claims
Integrated
Recovery
claims
Recovery
RTW1
49 FTEs to support Long Term claims
Transition 42 existing FTEs to manage Long Term claims
4Prior to executing these tranches, other onboarding activities would be undertaken and the timelines for these vary. For example, gradual recruitment of new FTEs would have started prior to Tranche 1 and
the duration from advertisement to training completion is expected to be ~19 weeks.
5This may begin in Tranche 1 or 2, depending on recruitment capacity and availability of FTE.
11

Document 3
FTE will begin supporting clients within a two-month period post training,
building up to a full case load over time6
The first tranche of new recruits are expected to be onboarded from July 2024 and all FTE fully transitioned into new ways of working by April 2025.
Jul
Aug
Sep
Oct
Nov
Dec
Jan
Feb
Mar
Apr
2024
2024
2024
2024
2024
2024
2025
2025
2025
2025
First additional FTEs trained
Identify FTE to
All FTEs trained in
in new ways of working
transition from
new ways of working
Assisted RTW1 to
Commence Training –
Supported / Integrated
Commence
Training
External Candidates
Training –
complete
Assisted RTW1
Transition of existing FTEs from Supported
candidates
Transition of existing FTEs from
to Integrated Recovery complete
Assisted RTW2 to Supported complete
Commence transition of existing FTEs from
Commence transition of existing FTEs
Supported to Integrated Recovery
from Assisted RTW2 to Supported
Commence recruitment of new FTEs (including Partnered and Support FTEs)
Recruitment of new FTEs complete
Assumed start date
Expected completion date
6In the current state, timeline for speed to competence is 12 – 18 months. “Fit for purpose” induction is expected to reduce this time.
12

Document 3
The plan is based on some key assumptions
•
The onboarding of new staff will require a high level of support from existing staff.
•
Recovery coordinators from Supported will be advised if they are moving to Integrated Recovery.
•
Opportunity will be provided for staff currently in Assisted RTW1 to express interest to be in either Assisted, Supported or Integrated
Recovery. Timing for this, as noted on the previous slide, is December 2024.
•
Integrated and Supported Recovery will have an equal mix of experienced and new staff.
•
Leadership roles will be from existing teams. However, opportunities will be advertised externally once internal options are exhausted.
•
Integrated Recovery teams will be across 12 sites, for practical reasons (e.g., Property and Capacity).
•
Timelines noted on the previous slide are subject to change based on the market conditions (being able to find the right capability and quantity
of candidates in the dedicated locations for these new teams), training capacity and / or any impact of the current Change proposal on the roll
out of this plan.
13

Document 3
Expected Outcomes
14

Document 3
Staff will be placed into the right roles (managing sustainable caseloads)
and claims will be actively managed in the right place
The table below summarises the makeup of FTE and Claims, post transition. The capacity in each function is made up of existing experienced staff
and newly trained staff to ensure there is sufficient support for the new staff and productivity levels are maintained.
Integrated Recovery
Supported Recovery
Partnered Recovery
Team
(Ringfenced)
Assisted Recovery RTW1
42
84
(WC > 365 days)
c.3,000
Assisted Recovery RTW1
42
82
(WC < 365 days)
c.9,000
200
Assisted Recovery RTW2
c.14,000
Supported Recovery
124
(WC > 365 days)
c.9,000
Supported Recovery
233
(WC < 365 days)
c.8,000
Partnered Recovery
137
34
(Serious Injury Claims)
c.4,500
Support7
49
1
299
557
172
Total FTE (including the new 250 FTE)
c.12,000
c.31,000
c.4,500
7This includes Clinical Advisors, Technical Specialists, Resolution Specialists, Practice Mentors, Admin, Workforce Planner.
Existing FTE New FTE
15

Document 3
Scenario modelling has been undertaken to show the potential impact on
rehabilitation performance
To show the potential impact of enabling the pool of c.12,000 clients held in Assisted Recovery RTW1 to receive proactive 1:1 case management
(CM) support, scenario modelling has been completed in two stages8, with the performance impact based on the workforce assumptions used to
determine when new teams will go live.
Scenario modelling to consider the impact of providing 1:1 CM support for new weekly compensation claims in Assisted Recovery.
Stage 1
•
Note this is a separate initiative that is already underway, however the impact it has on rehabilitation performance forms the
basis for modelling the impact of providing 1:1 CM for claims in RTW1.
•
This initiative is expected to impact short-term rehabilitation performance, so scenarios are presented using the average
weekly compensation days paid measure.
Scenario modelling to consider the
impact of providing 1:1 CM support of RTW1 claims and actively managing LTCP clients.
Stage 2
•
Note this builds on the scenarios used for modelling the impact of 1:1 CM support for new weekly claims in Assisted Recovery.
•
This initiative is expected to impact short- and long-term rehabilitation performance, so scenarios are presented using the
average weekly compensation days paid measure, long term claims pool growth rate, and long-term claims pool volumes.
8The modelled changes in performance for both stages assume that all other variables are held constant.
16

Document 3
Modelling indicates improvement beyond the targeted Service Agreement
levels for rehabilitation performance is possible (1/2)
Stage 1
Stage 2
[1] Three scenarios9 are modelled:
[2A] Three scenarios10 are modelled for Assisted Recovery RTW1 1:1
1.
3 percentage point increase in rehabilitation rates under 183 days
weekly compensation claims < 365 days:
2.
4 percentage point increase in rehabilitation rates under 183 days
1.
3 percentage point increase in 273 day & 365 day rehabilitation rates
3.
5 percentage point increase in rehabilitation rates under 183 days
2.
4 percentage point increase in 273 day & 365 day rehabilitation rates
3.
5 percentage point increase in 273 day & 365 day rehabilitation rates
[1] Assisted Recovery 1:1 for new WC claims
No Change
Scenario 1
Scenario 2
Scenario 3
No Change
75.1
74.1
73.5
73.1
[2A]
Scenario 1
75.2
74.2
73.6
73.2
RTW1 1:1
Scenario 2
75.2
74.2
73.6
73.2
Scenario 3
75.2
74.2
73.6
73.2
Highlights the scenarios used to show performance impact in the executive summary slide 5 (i.e., scenario 2 in Stage 1 and “No change” scenario in Stage 2)
9The percentage point increase is based on April 2024 performance in Assisted Recovery only
10The percentage point increase is based on April 2024 performance in Supported Recovery only
17

Document 3
Modelling indicates improvement beyond the targeted Service Agreement
levels for rehabilitation performance is possible (2/2)
Stage 2 Continued
[2B] Building off 2A, three
[2B] LTCP Exit Focus (Size)
[2B] LTCP Exit Focus (Growth Rate)
For June 2025
For June 2025
No Change Scenario 1
Scenario 2
Scenario 3
No Change Scenario 1
Scenario 2
Scenario 3
scenarios are modelled for weekly
No Change
24,539
24,422
24,306
24,192
No Change
10.5%
9.9%
9.4%
8.9%
[2A]
[2A]
compensation claims > 365 days:
Scenario 1
24,389
24,272
24,156
24,042
Scenario 1
9.8%
9.3%
8.8%
8.2%
RTW1
RTW1
Scenario 2
24,339
24,222
24,106
23,992
Scenario 2
9.6%
9.0%
8.5%
8.0%
1.
5 percent improvement in
1:1
1:1
Scenario 3
24,539
24,172
24,056
23,942
Scenario 3
9.4%
8.8%
8.3%
7.8%
LTCP exit rates
[2B] LTCP Exit Focus (Size)
[2B] LTCP Exit Focus (Growth Rate)
2.
10 percent improvement in
For June 2026
For June 2026
No Change Scenario 1
Scenario 2
Scenario 3
No Change Scenario 1
Scenario 2
Scenario 3
LTCP exit rates
No Change
26,455
26,198
25,950
25,710
No Change
7.8%
7.3%
6.8%
6.3%
[2A]
[2A]
Scenario 1
25,993
25,736
25,488
25,248
Scenario 1
6.6%
6.0%
5.5%
5.0%
3.
15 percent improvement in
RTW1
RTW1
Scenario 2
25,839
25,582
25,334
25,094
Scenario 2
6.2%
5.6%
5.1%
4.6%
1:1
1:1
LTCP exit rates
Scenario 3
25,685
25,428
25,180
24,940
Scenario 3
5.7%
5.2%
4.7%
4.2%
For June 2027
LTCP growth rate
OCL strain/increase
To quantify the effect the LTCP growth rate has on the OCL, three scenarios have been
Scenario 1
~6.5%
~$1.0 billion
modelled. This shows that reducing the LTCP growth rate from 9.5% to 6.5% by June
Scenario 2
~8.0%
~$1.5 billion
2027 could reduce the level of expected OCL strain by $1b.
Scenario 3
~9.5%
~$2.0 billion
Highlights the scenarios used to show performance impact in the executive summary slide 5 (i.e., “No change” scenario in Stage 2)
18
Document 3
A shift in the drivers of OCL strain for serious injury clients is expected
A review of 273 Support Needs Assessments (SNAs) for serious injury
Scenario
Reduction in care
Reduction in
OCL Reduction
hours12
annual spend13
clients identified 102 SNAs (~37%) where a reduction in care hours was
Aggressive
33% (815 hours)
12%
$1,500 million
recommended11. This allows for two scenarios.
Realistic
10% (247 hours)
4%
$450 million
Two other opportunities are considered, for clients in residential care facilities:
Opportunity
Details
OCL Reduction
Ensure correct funding
• Initial work has identified 10 clients where co-funding of 20-60% can be achieved and, in one example, significantly more.
$110 million
is received for those
• If 10% (~55) of clients in residential care could be identified as being eligible for co-funding at an average rate of 30% this
clients with pre-existing
could reduce total spend in residential care by around 3% per year.
medical conditions
Transition applicable
• Residential care is not the best place for some clients to achieve their rehabilitation outcomes. Work to date has
$150 million
clients back into the
identified 12 clients who can be, or have been, transitioned back into the community.
community with the
• If 10% (~55) clients could be transitioned into the community this could reduce the total spend in residential care by
appropriate level of
around 10% per year.
care around them
• However, we would expect to see an increase in the amount of attendant care to offset this, with this annual spend being
about 60% of residential care i.e. a 40% reduction in spend could be achieved. This could result in a net reduction across
the two categories by around 4% per year.
Highlights the scenario used to show performance impact in the executive summary slide 5
11This quantification is based on the Partnered Recovery (Serious Injury) pilot that has been undertaken over the past 6-9 months and the initial, positive, changes this has made.
12Based on the average number of care hours per client per year
13If average reduction in care hours could be achieved across the entire portfolio of serious injury clients receiving care
19

Document 3
Financial Impact
20

Document 3
An increase in ACC’s operating budget is required to enable investment in
additional FTE
This implementation would
increase the 2024/25 baseline budget by $23.2m and
reduce ACC’s budget reduction initiatives to 4% as shown in
below tables14 based on current projections and indicated intake profile of FTE. While this investment requires a trade-off in the level of savings ACC
can deliver in 2024/25, our analysis indicates
this will deliver a significant return-on-investment longer-term.
HYEFU
Current
Proposed
ACC Costs $000's
FY25
FY26
FY27
ACC Costs $m
Baseline
Budget
Solution
Operating Cost Budget
$889,916
$911,022
$917,795
Operating Costs
$903m
$844m
$867m
(ex-Depreciation)
SD Resourcing
$19,434
$25,543
$26,437
Savings on
Clinical Advisors
$1,469
$2,147
$2,222
-6.5%
-4.0%
HYEFU baseline
P&C Costs
$441
$
$
P&C Costs
ECD Overheads
$1,348
$1,800
$1,800
Develop recruitment campaign
$66,000
Depreciation
$518
$700
$700
Fixed term (9 months) HR Support role
$56,500
Proposed Impact
$23,210
$30,190
$31,159
2 short term instructional designers
$171,600
Operating Expenses
$913,126
$941,212
$948,954
Support for delivery of Induction
$157,000
Less Depreciation
-$46,218
-$35,717
-$20,880
Total
$451,10015
Opex ex-Depn
$866,908
$905,495
$928,074
14There may be a one-off capital expenditure (laptop, licenses, desks) spend of ~$2m that would need to be funded by the change portfolio. Depending on the site / location of the staff and the impacts of the
ACC change proposals, the capital expenditure requirements are likely to change or be absorbed. The headcount increase will also impact the claim handling expenses (CHE), which will further have an
impact on the OCL held for CHE. The multiplier is around 5. So, an annual headcount cost of around $23m could result in OCL increase of about $115m.
15There is a small variance between costs here (451k) and those in the Financial table (441k) due to overheads, which are included in the ECD portion of the financial table
21

Document 3
Performance Monitoring
22

Document 3
Progress will be closely monitored to understand whether benefits
associated with this additional investment are being realised
Management will closely monitor the progress of recruitment, onboarding, and expected capability gains throughout 2024/25. We will also conduct
modelling six-monthly to assess workforce requirements across our case management system.
Measures
Component 1
Component 2
Monthly
Tracking the shift and scaling of people and clients into the 1:1
•
Monitoring the
claims per FTE is closer to 25-30.
reporting of
approach will be the primary focus, to get caseloads/work volumes
caseloads
settled at the appropriate level –
Claims per FTE is closer to 55.
Monthly
When the 1:1 teams are in place, a
suite of best practice claims
•
Monitoring
number of SNA reviews completed for
reporting of
management activities will serve as lead indicators, focusing on
those receiving attendant care, the outcomes, and
claims
effective onboarding, conversations with employers, goal setting
implementation of the recommendations.
management and utilising appropriate supports at the right time.
•
Monitoring the
number of reviews of those in residential
activity
•
Feedback loops will be established. This is the same monitoring
care by the expert advisory panel, the outcomes and
framework used for the current Assisted Recovery 1:1 approach
implementation for either co-funding or transitioning to
for new weekly compensation claims.
community.
Monthly
Claim closures and then outcomes from the cohort will be
•
Serious injury care hour KPI will be monitored, which
reporting of
monitored to ensure the expected improvements are materialising.
will provide a high-level indicator for the success of any
claim
•
The
volume of exits should increase when 1:1 teams are in
care hour changes.
outcomes
place and proactively supporting clients.
•
The KPI is based on the entire serious injury portfolio,
•
This will flow through to the
active and exit distribution
including new claims and exits, so it may not necessarily
profiles, and feed into outcome measures.
reflect progress that has been made.
23

Document 3
Appendix
24

Document 3
LTCP Profiles and Research
LTCP Profiles
Sub profiles
c.4500 with a serious injury profile
c.10,000 are expected to require ACC entitlements on an ongoing basis
c.4200 accepted as ‘long-term maintenance’ with no potential to become independent
c.12,000 could be amenable to proactive interventions
c.9382 receiving 1:1 case management in Supported Recovery
(case management, assessment, treatment and rehabilitation services)
c.3028 held in the cohort served by RTW1 in Assisted Recovery
Taylor Fry actuaries’ report
25
Document Outline