 F2015 Annual Thematic Review of Grievances in Youth Justice Residences
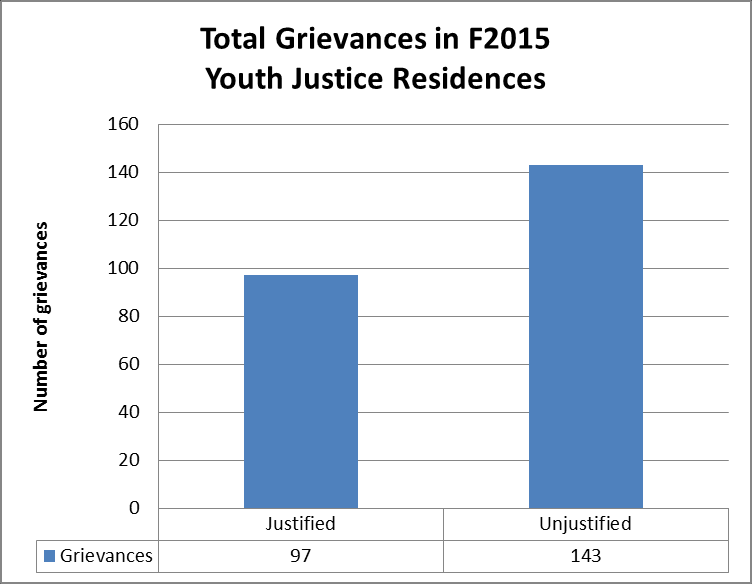
Total Grievances in F2015
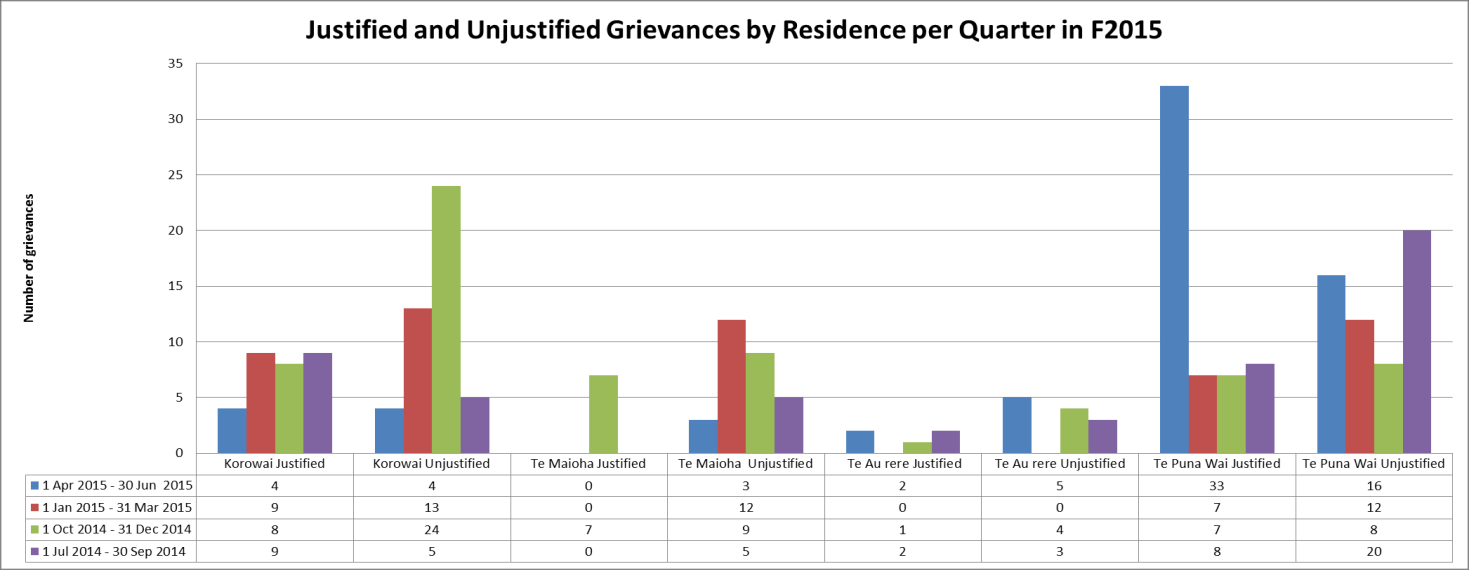
Grievances per Quarter by Residence in F2015
Analysis
s
F2015 Annual Thematic Review of Grievances in Youth Justice Residences
Total Grievances in F2015
Grievances per Quarter by Residence in F2015
Analysis
s
d
ren
T
al
u
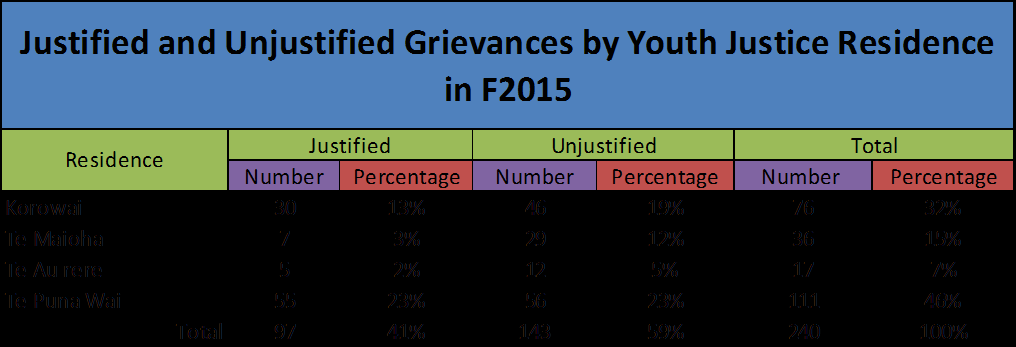
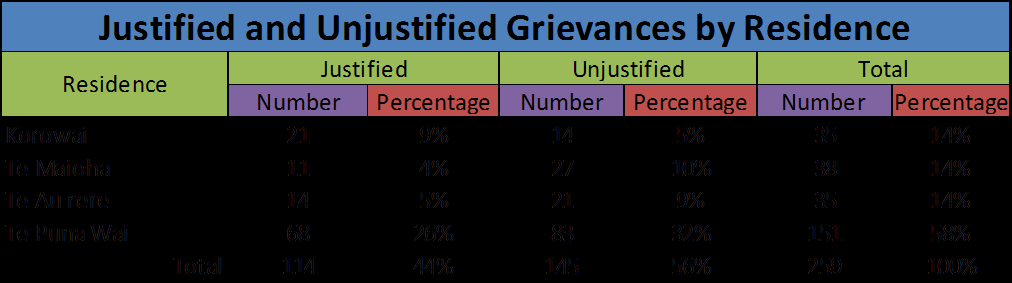
Te Puna Wai O Tuhinapo had the highest proportion (55) of justified grievances . Te Au rere a
n
te Tonga has the lowest proportion (5) of justified grievances.
n
A
Te Puna Wai O Tuhinapo had had the highest proportion (56) of unjustified grievances and Te
Au rere a te Tonga had the lowest proportion (12) of unjustified grievances.
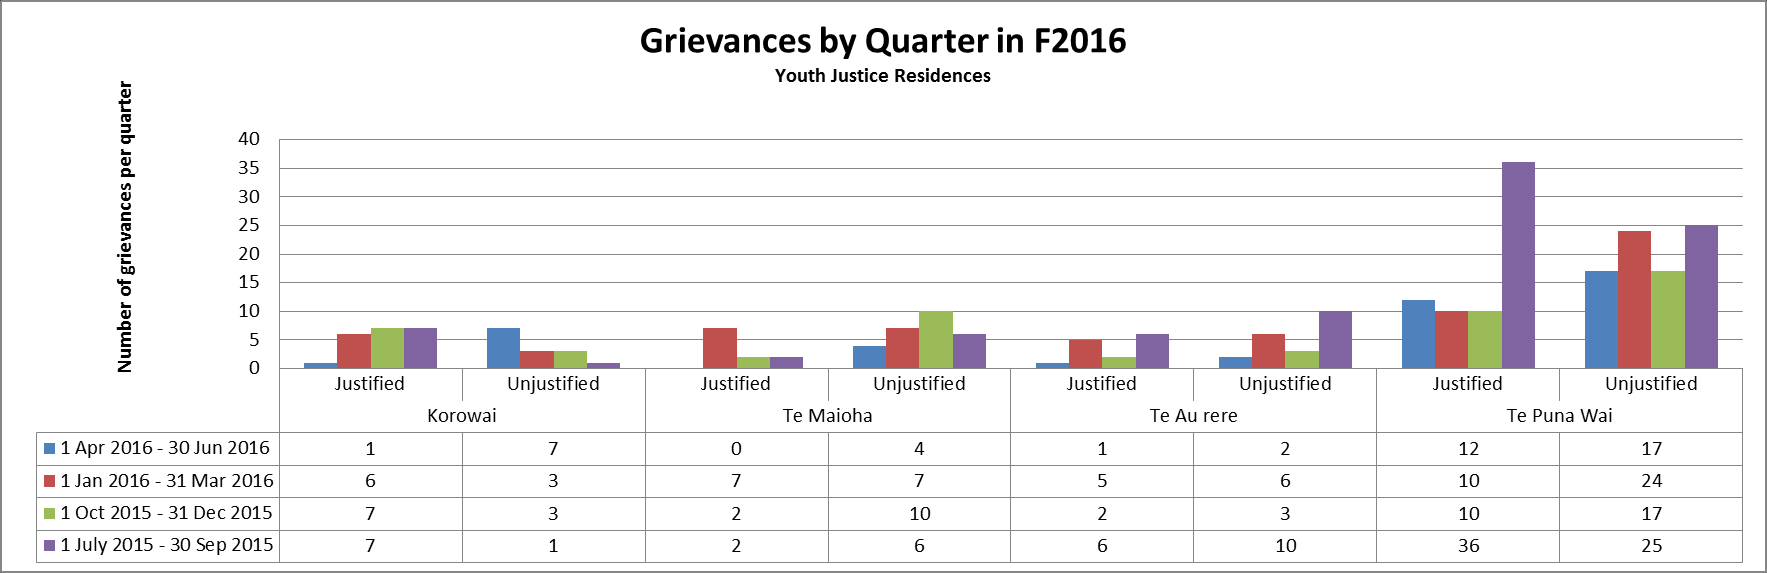
Te Puna Wai O Tuhinapo had the highest number of justified grievances for an individual
quarter, with 33 during 2015 quarter two (1 Apr – 30 Jun 2015)
Korowai had the highest number of unjustified grievance for an individual quarter, with 24
grievances found unjustified during 2014 quarter four (1 Oct – 31 Dec 2014).
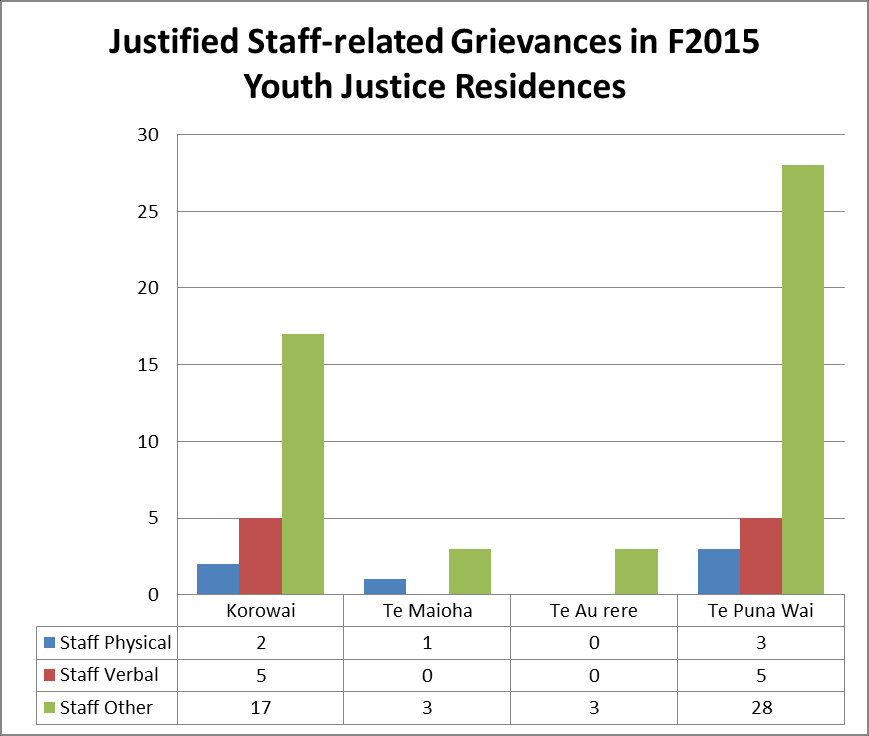
Staff-related Grievances
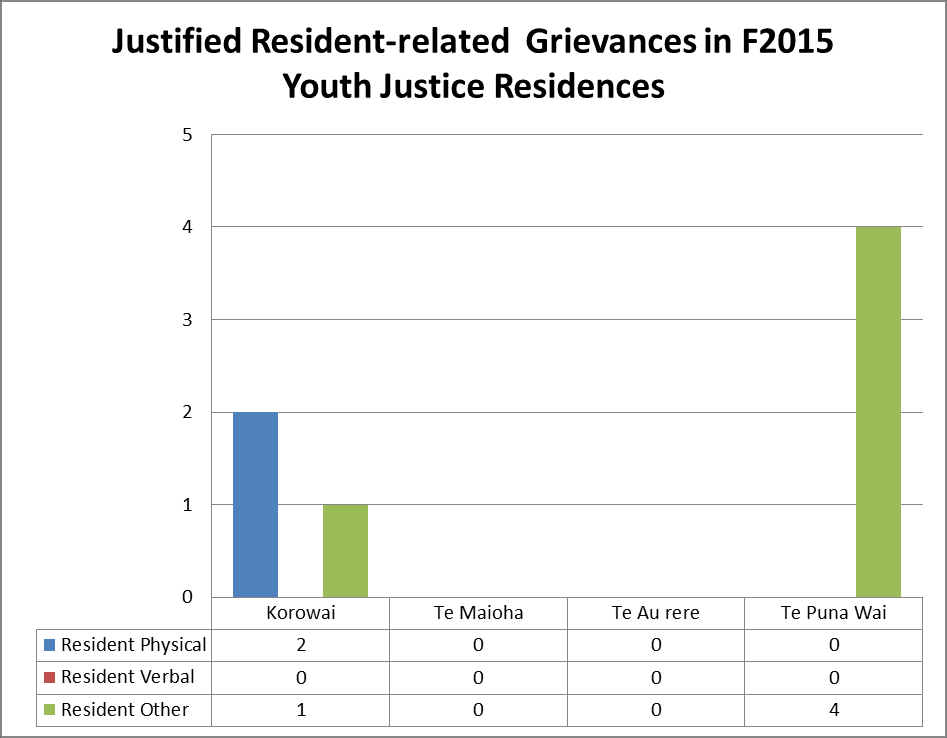
Resident-related Greivances
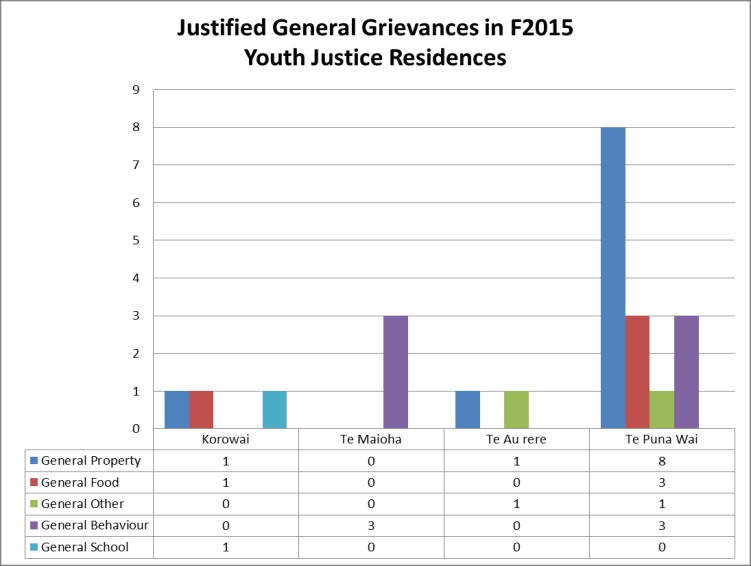
General Grievances
Analysis
es
c
an
iev
Gr
d
e
fi
sti
Ju
Grievance Compliance
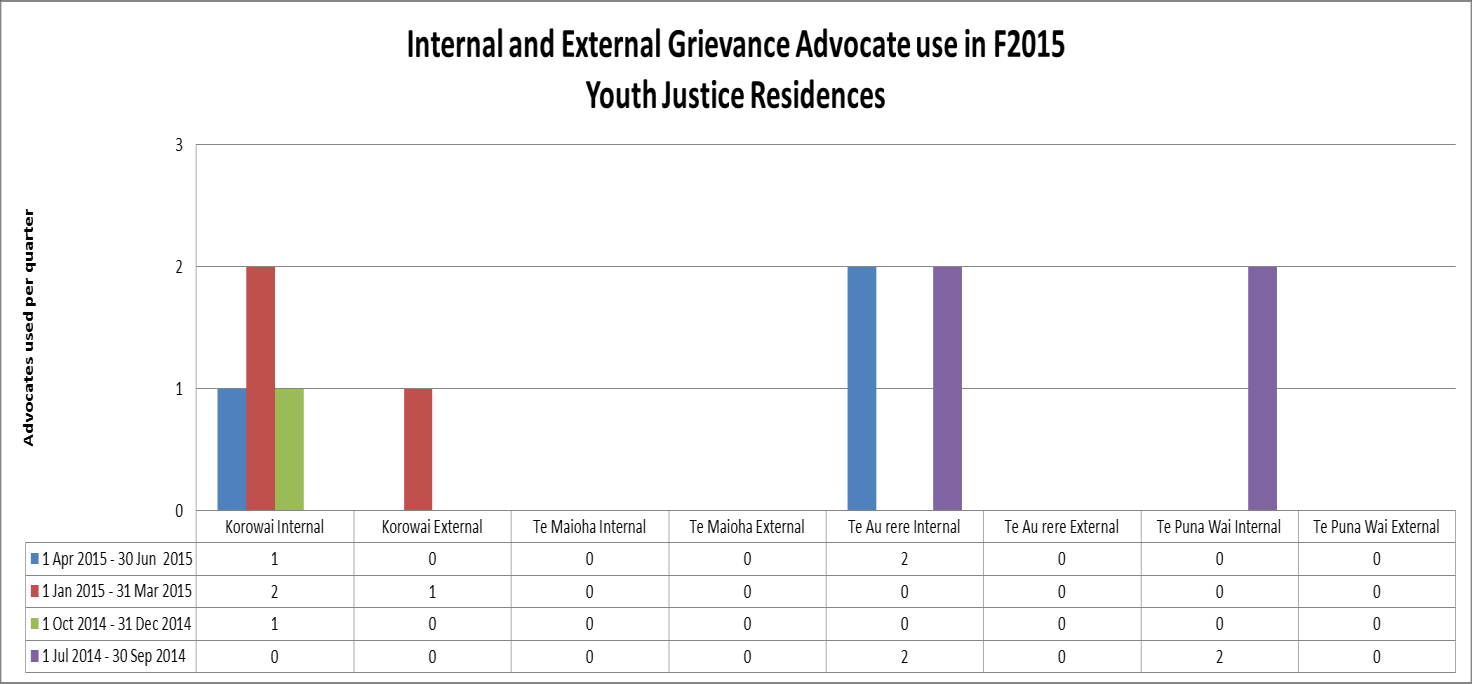
Internal and External Grievance Advocacy
Analysis
Under Official Information Act 1982
An external advocate was used once at Korowai Maanaki during 2015 quarter one (1 Jan – 31 Mar
2015). The other youth justice residences had no recorded external advocate use.
Internal advocates were used 10 times in youth justice residences. Internal advocate use
was highest (4 each) at Korowai Maanaki and Te Au rere a te Tonga. Te Puna Wai O Tuhinapo
have each used internal advocates twice. Te Maioha O Parekarangi has not used internal
advocates.
N/A
N/A
Released
Out of Scope
Under Official Information Act 1982
Released
 F2016 Annual Thematic Review of Grievances in Youth Justice Residences
Total Grievances in F2016
Grievances per Quarter by Residence in F2016
Analysis
s
F2016 Annual Thematic Review of Grievances in Youth Justice Residences
Total Grievances in F2016
Grievances per Quarter by Residence in F2016
Analysis
s
d
ren
T
al
u
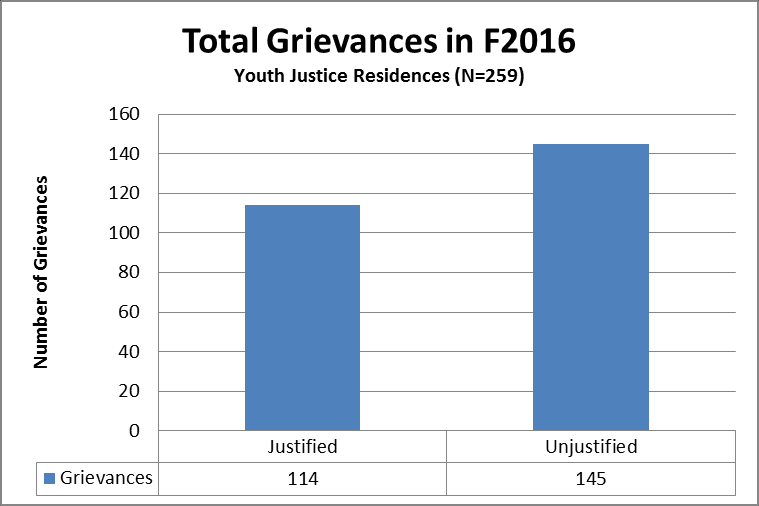
Te Puna Wai had the highest proportion (56) of justified grievances and unjustified grievances. Te Maioha
n
had the lowest proportion (11) of justified grievances.
n
Te Puna Wai had the highest proportion (83) of unjustified grievances and Korowai had the lowest
A
proportion of unjustified grievances (14)
Te Puna Wai had the highest proportion of justified grievances for an individual quarter, with 36 found
justified during 2015 quarter three (1 Jul – 31 Sep 2015).
Te Puna Wai had the highest proportion of unjustified grievances for an individual quarter, with 25
grievances found unjustified in 2015 quarter three (1 Jul – 31 Sep 2015).
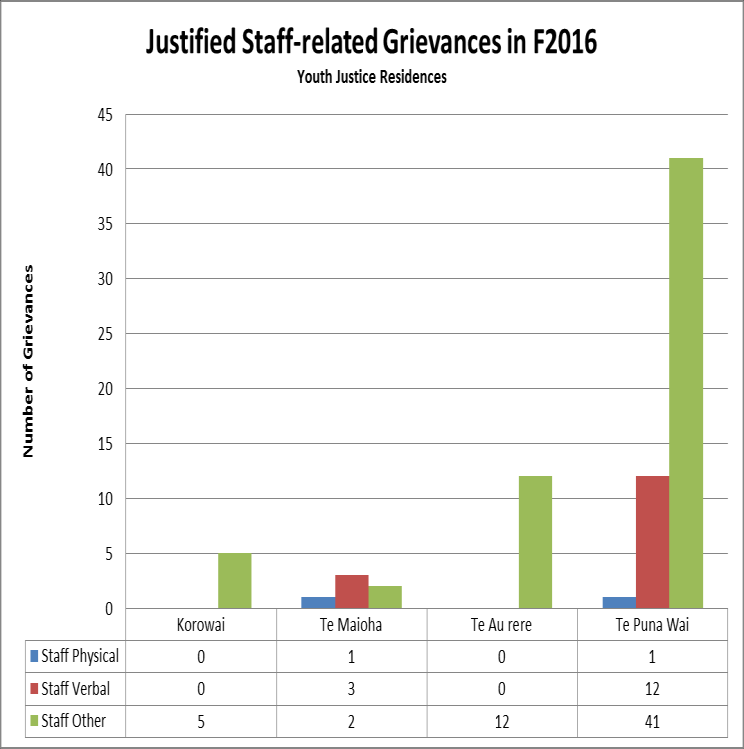
Staff-related Grievances
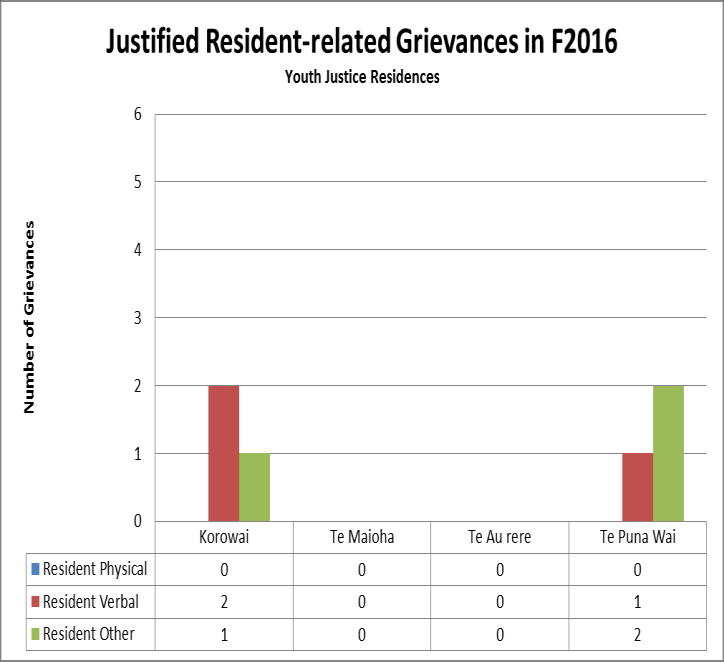
Resident-related Greivances
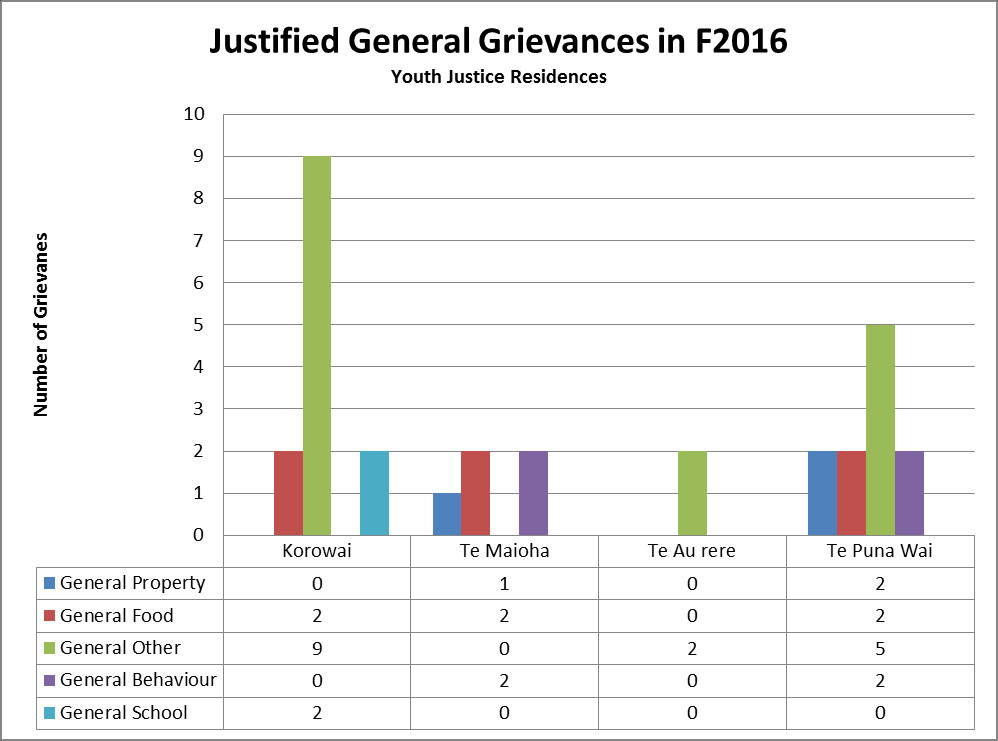
General Grievances
Analysis
es
c
an
iev
Gr
d
e
fi
sti
Ju
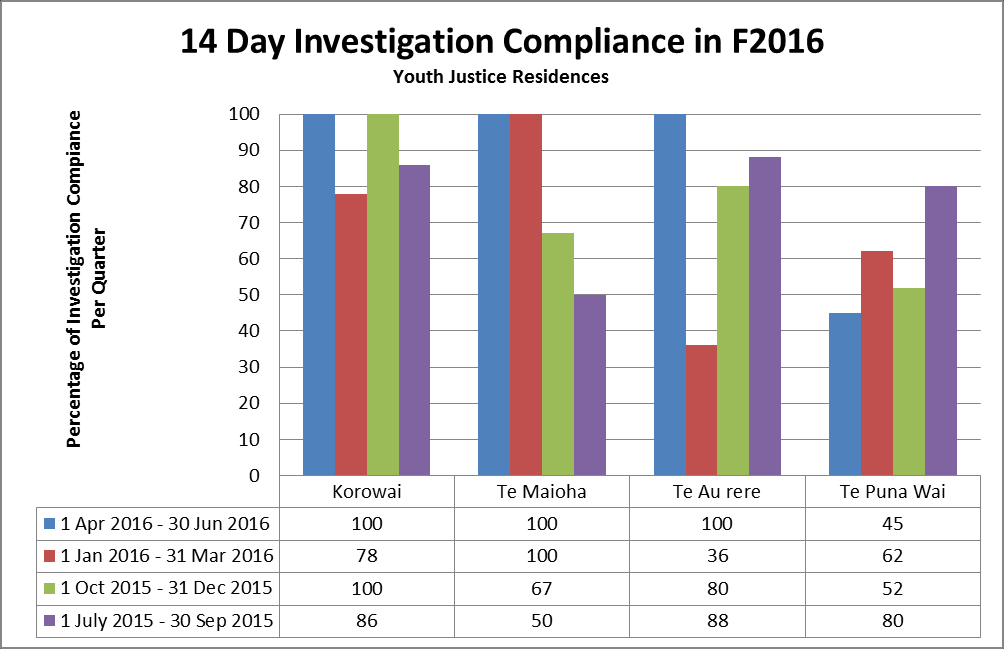
Grievance Compliance
Internal and External Grievance Advocacy
Analysis
Under Official Information Act 1982
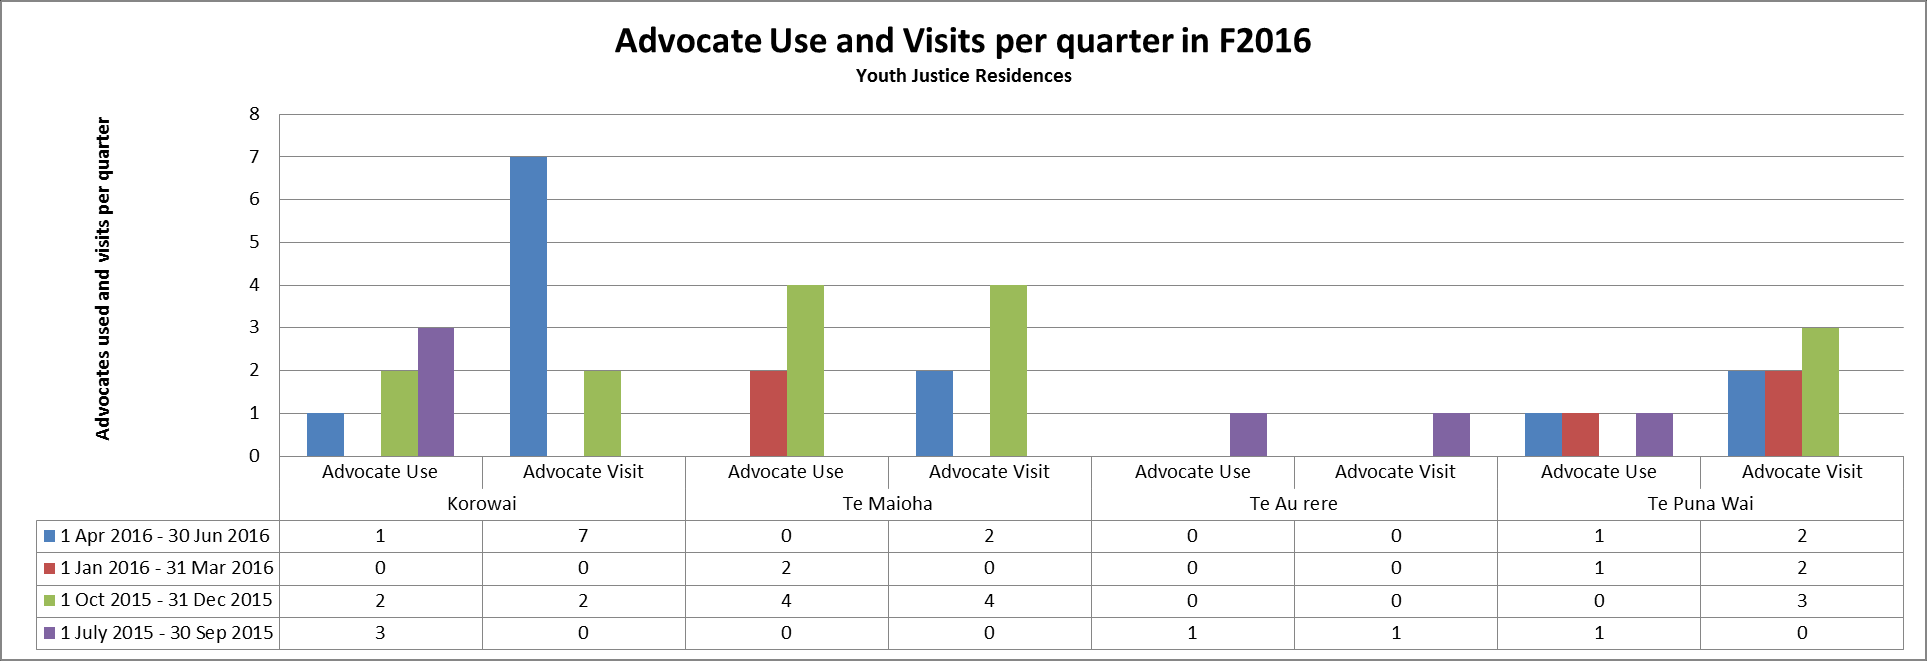
Advocates were used 16 times in Youth Justice residences in F2016. The highest (6) grievance
advocate use occurred in 2015 quarter four (1 Oct – 31 Dec 2015). Korowai and Te Maioha had
the highest proportion of advocate use (6 respectively), and Te Au rere had the lowest (1).
Advocates visited 23 times in Youth Justice residences during F2016; the highest number of visits
(11) occurred in 2016 quarter two (1 Apr – 30 Jun 2016). Korowai had the highest number of
advocate visits (9), and Te Au rere had the lowest (1).
N/A
Released
Out of Scope
Under Official Information Act 1982
Released
Out of Scope
Under Official Information Act 1982
Released
 F2017 Annual Thematic Review of Grievances in Youth Justice Residences
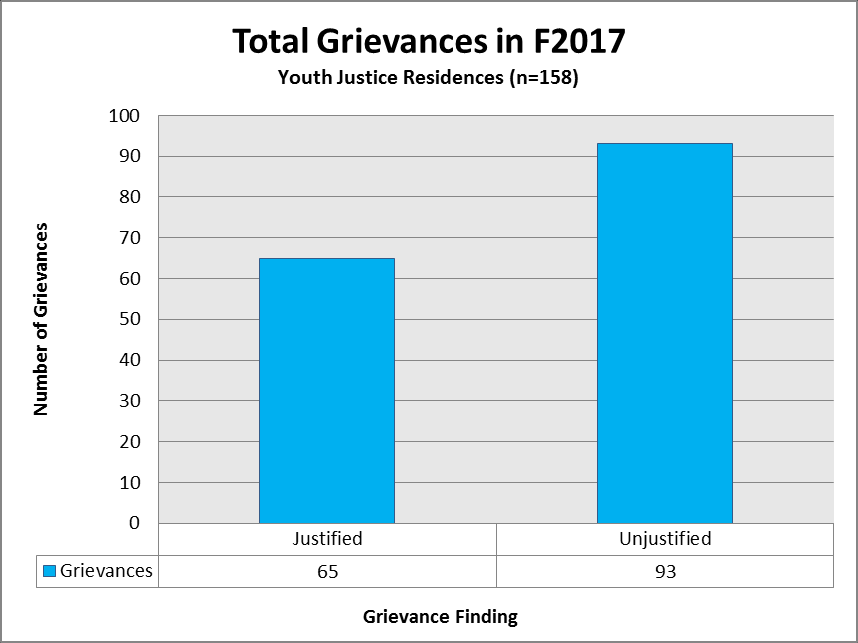
F2017 Total Grievance
F2017 Grievances per Quarter by Residence
Analysis
s
F2017 Annual Thematic Review of Grievances in Youth Justice Residences
F2017 Total Grievance
F2017 Grievances per Quarter by Residence
Analysis
s
d
ren
T
al
u
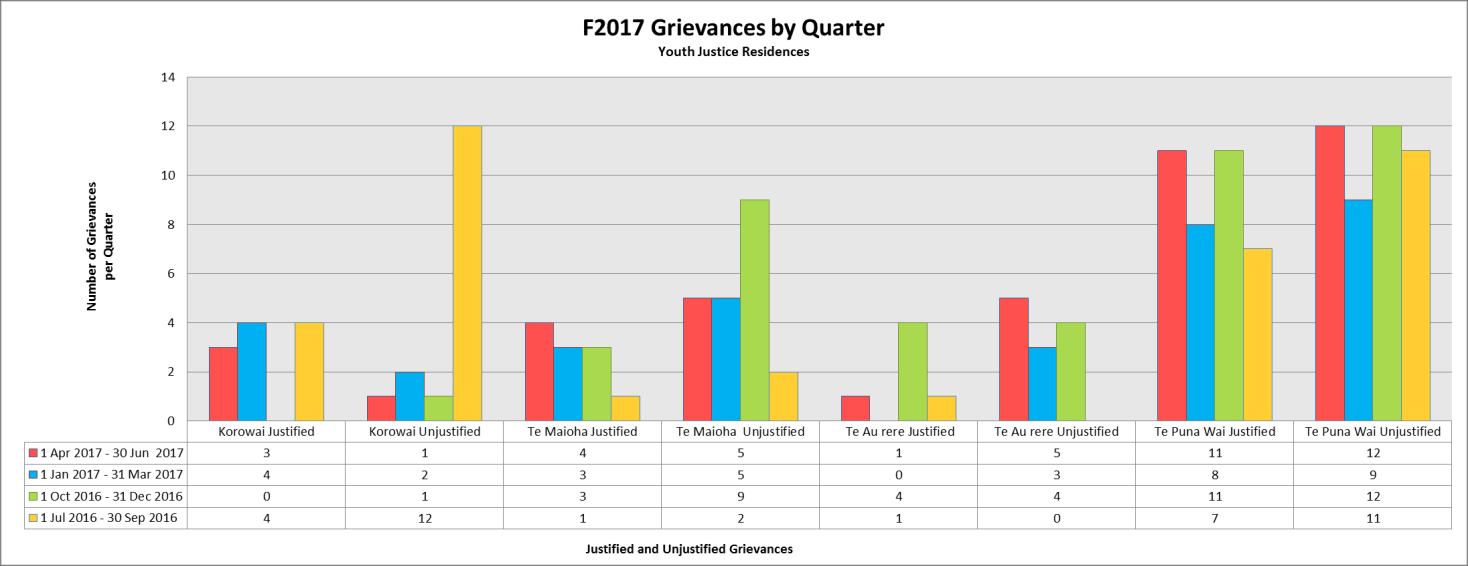
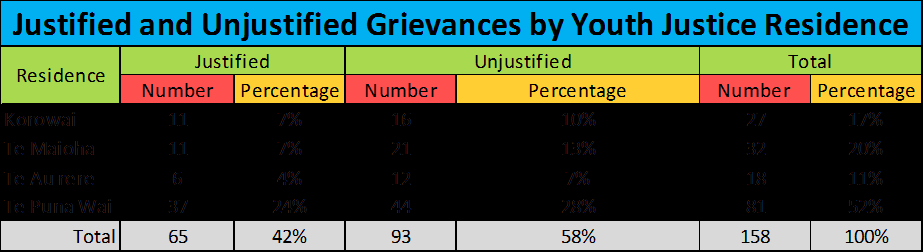
Te Puna Wai had the highest proportion (37) of justified grievances. Te Au rere had the lowest proportion
n
(6) of justified grievances.
n
Te Puna Wai had the highest proportion (44) of unjustified grievances and Te Au rere had the lowest
A
proportion of unjustified grievances (12).
Te Puna Wai had the highest proportion of justified grievances for an individual quarter, with 11 found
justified during 2016 quarter four (1 Oct – 31 Dec 2016) and 2017 quarter two (1 Apr – 30 Jun 2017).
Te Puna Wai had the highest proportion of unjustified grievances for an individual quarter, with 12 found
unjustified during 2016 quarter four (1 Oct – 31 Dec 2016) and 2017 quarter two (1 Apr – 30 Jun 2017).
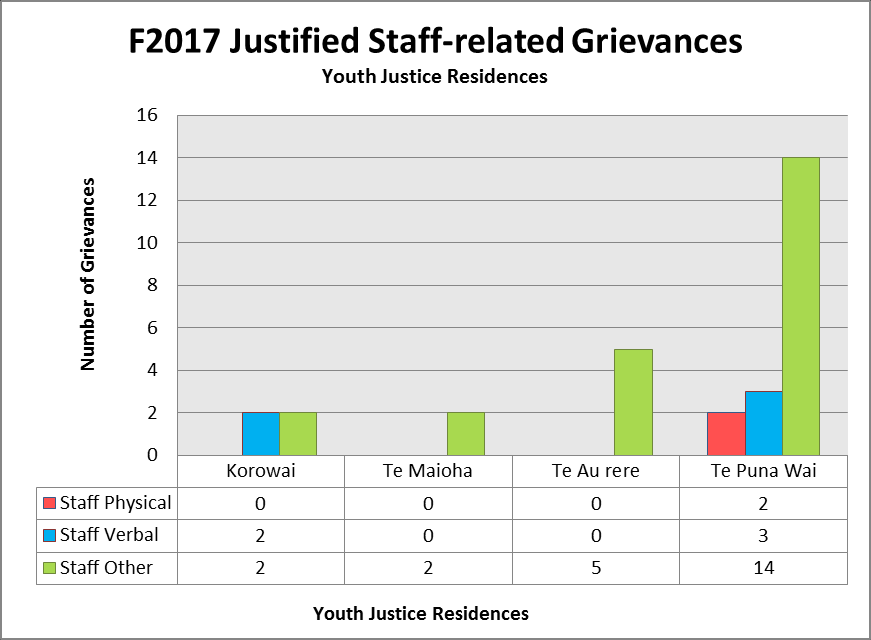
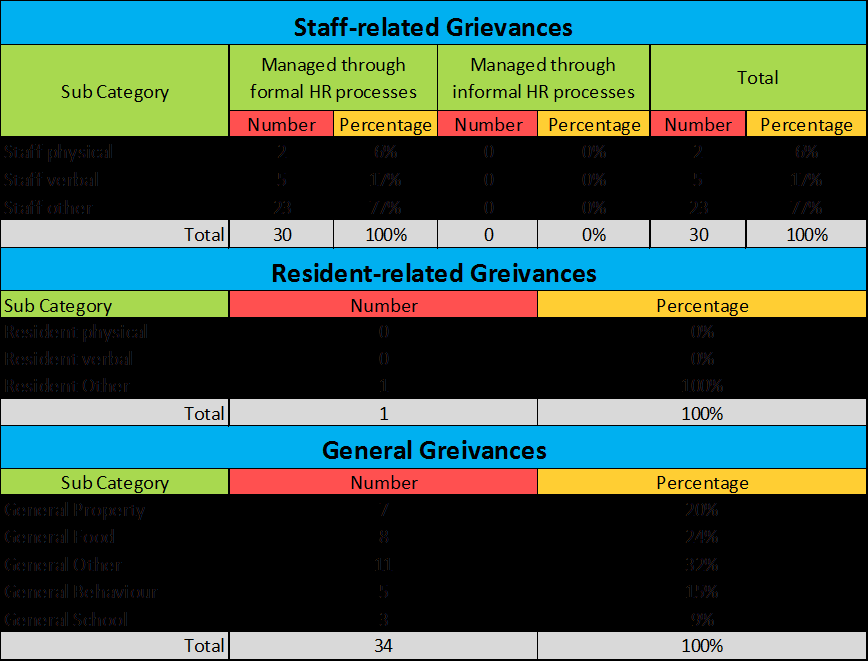
Staff-related Grievances
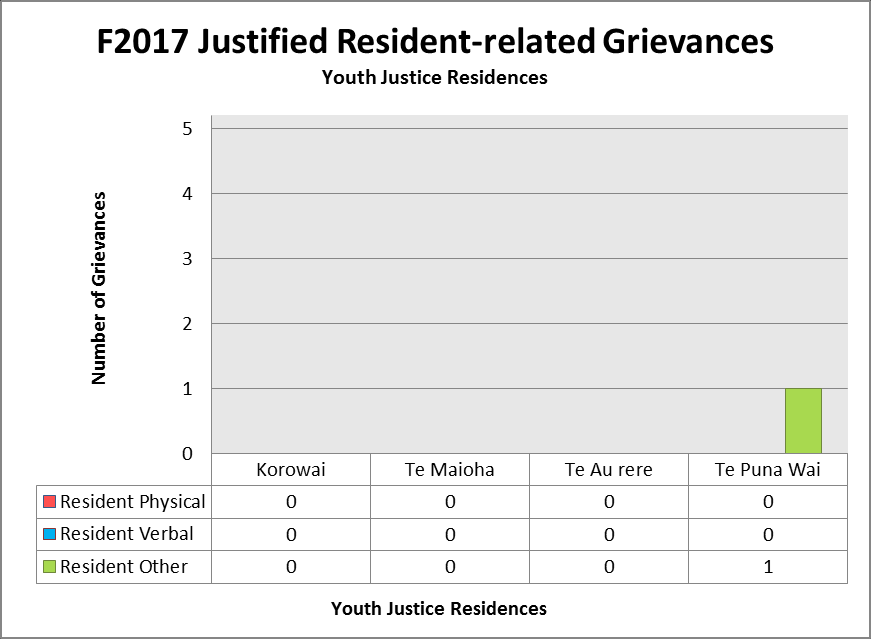
Resident-related Greivances
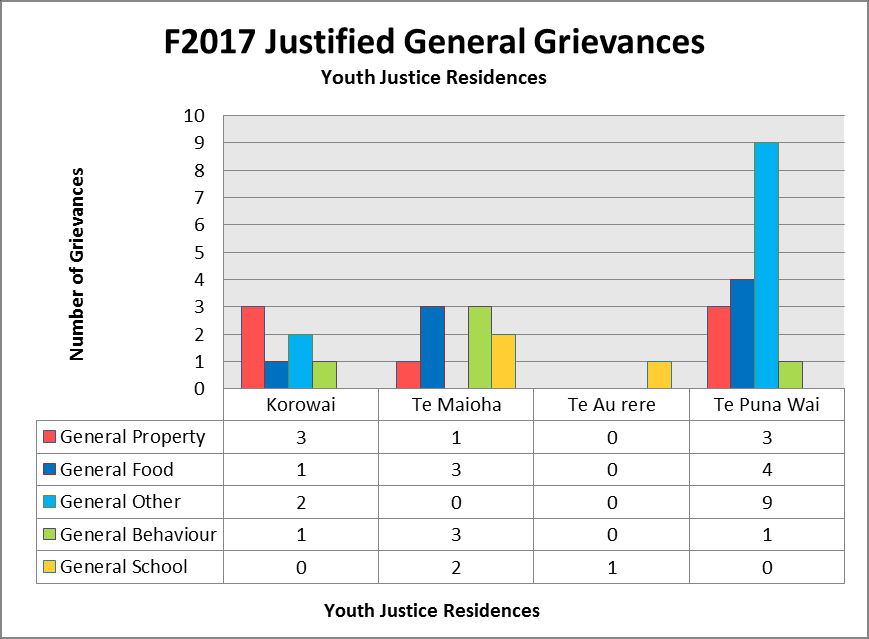
General Grievances
Analysis
es
c
an
iev
Gr
d
e
fi
sti
Ju
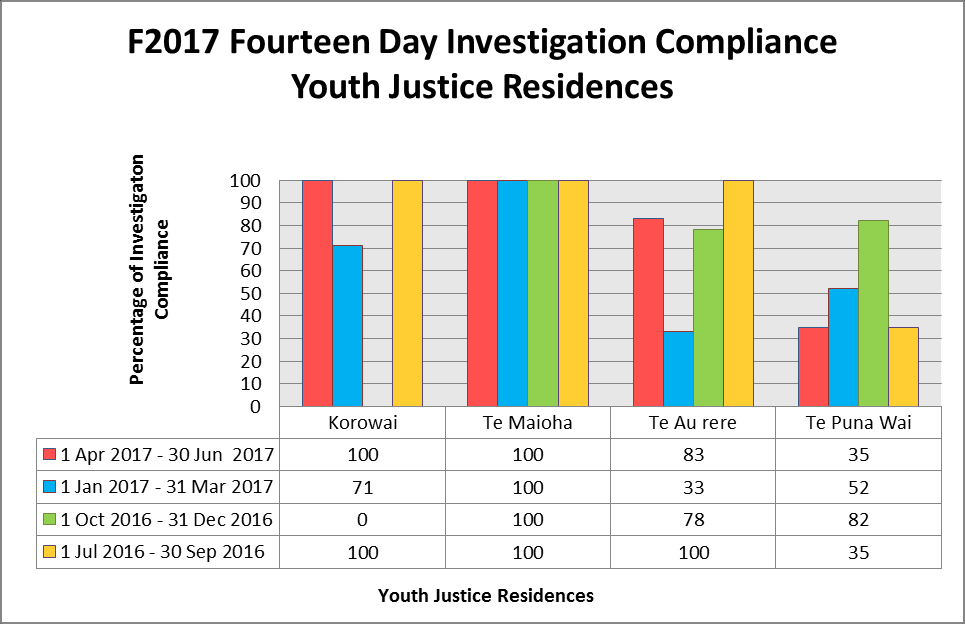
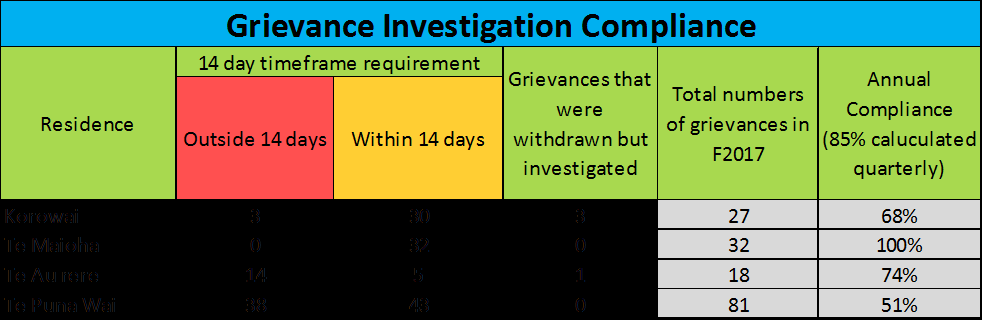
Grievance Compliance
Internal and External Grievance Advocacy
Analysis
Under Official Information Act 1982
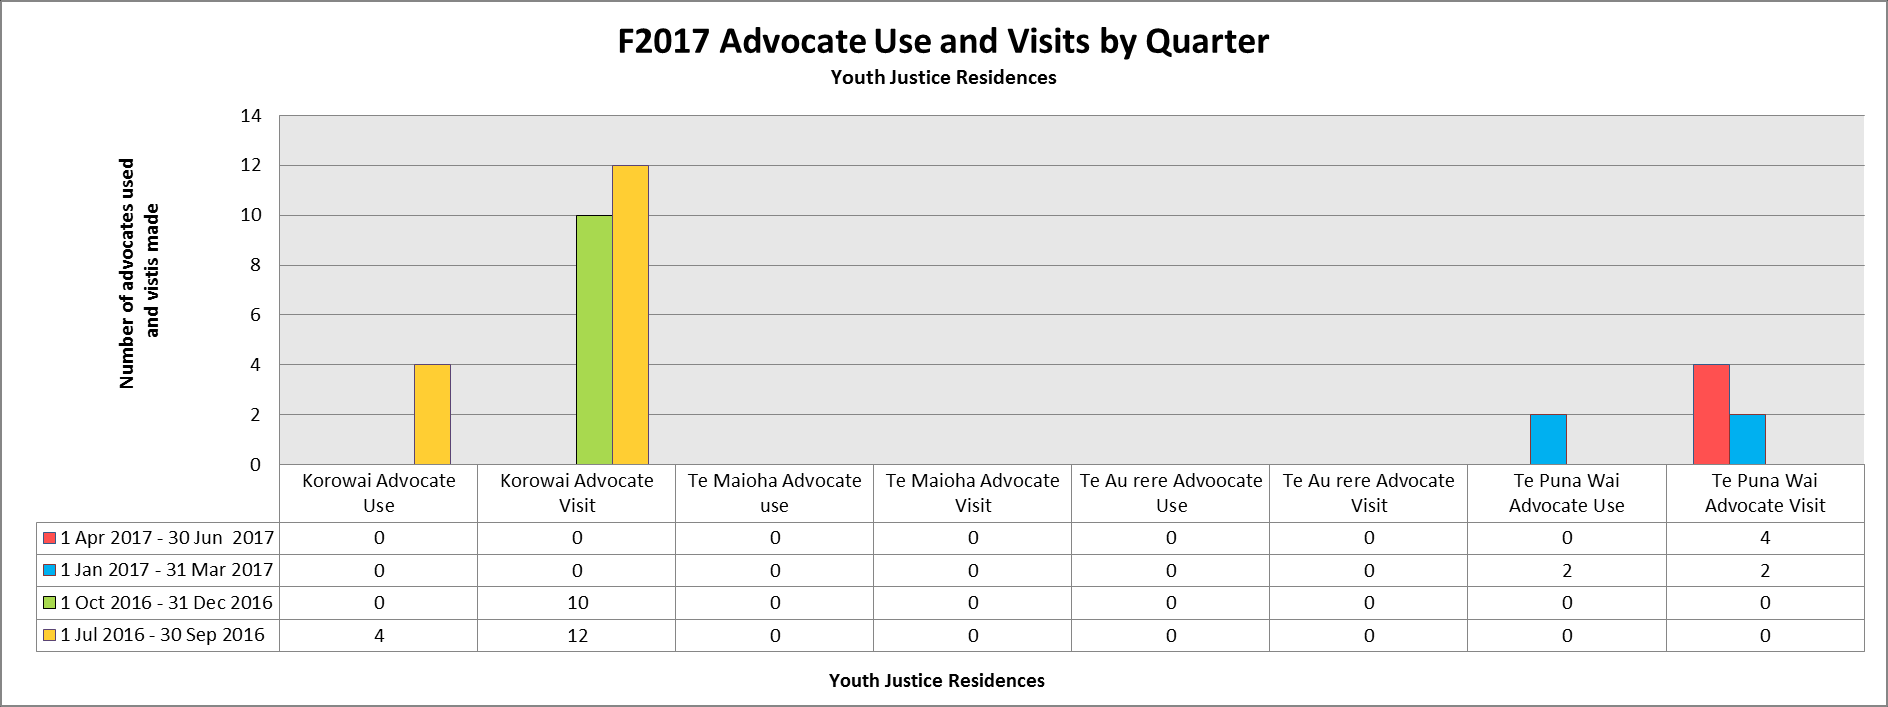
Advocates were used six times in Youth Justice residences in F2017. Overall advocate use was
low, with this only occurring at Korowai and Te Puna Wai during distinct quarters (Quarters 1 Jul –
30 Sep 2016 and 1 Jan – 31 Mar 2017 respectively). Te Maioha and Te Au rere did not use any
advocates.
Advocates visited 30 times in Youth Justice residences during F2017; the highest number of visits
(12) occurred at Korowai in 2016 quarter three (1 Jul – 30 Sep 2016). Korowai also had the
highest total number of advocate visits (22). Te Au rere and Te Maioha did not have any advocate
visits.
N/A
Released
Out of Scope
Under Official Information Act 1982
Released
 F2018 Annual Thematic Review of Grievances in Youth Justice Residences
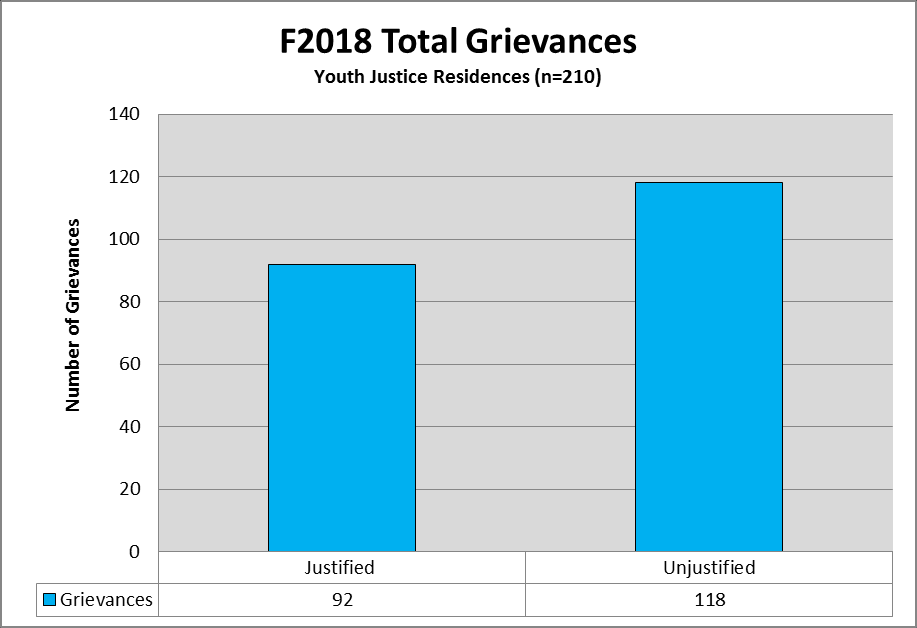
F2018 Total Grievance
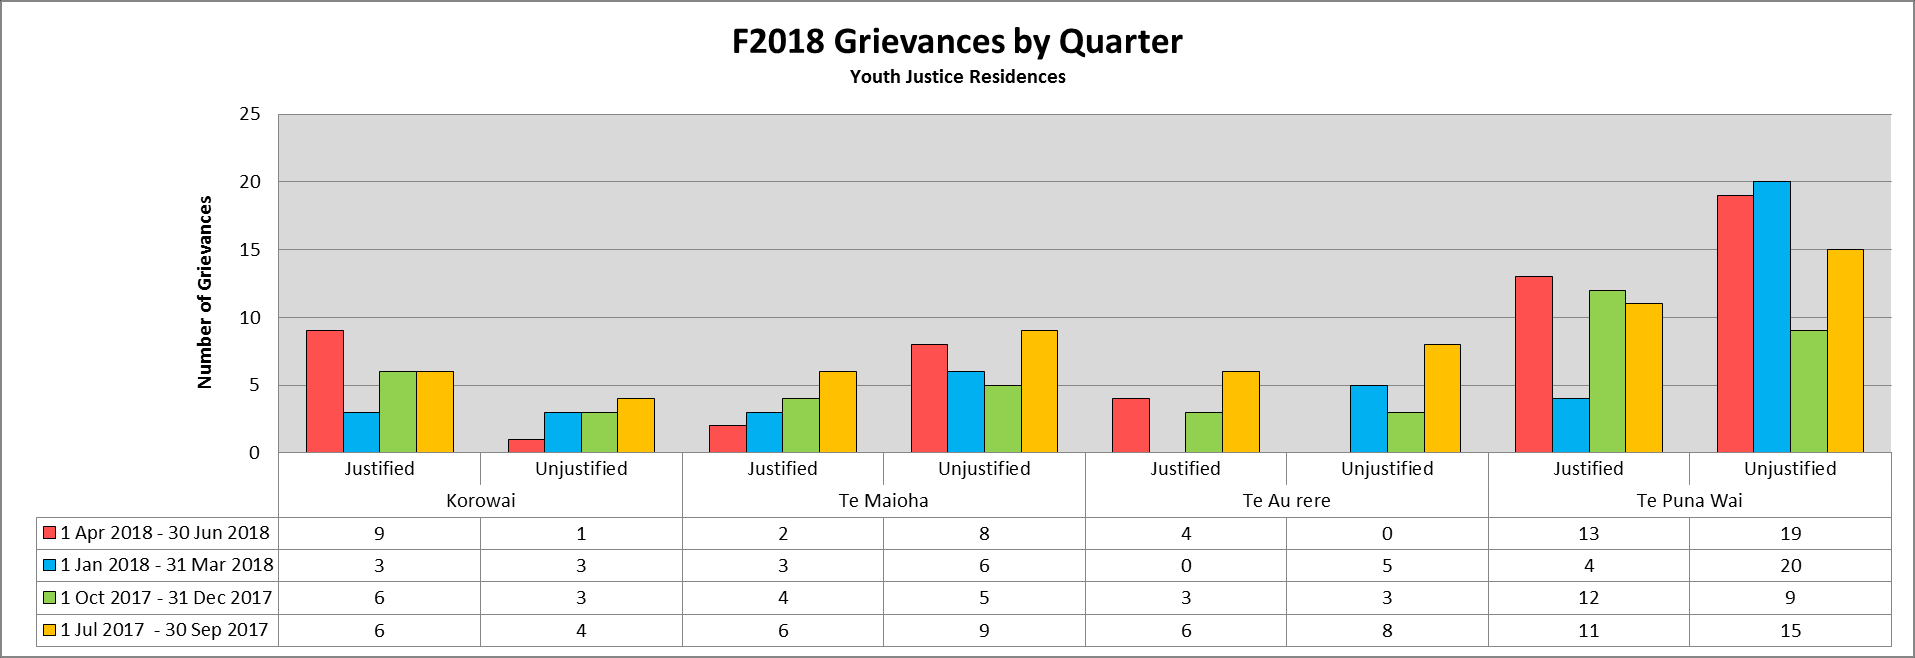
F2018 Grievances per Quarter by Residence
Analysis
s
F2018 Annual Thematic Review of Grievances in Youth Justice Residences
F2018 Total Grievance
F2018 Grievances per Quarter by Residence
Analysis
s
d
ren
T
al
u
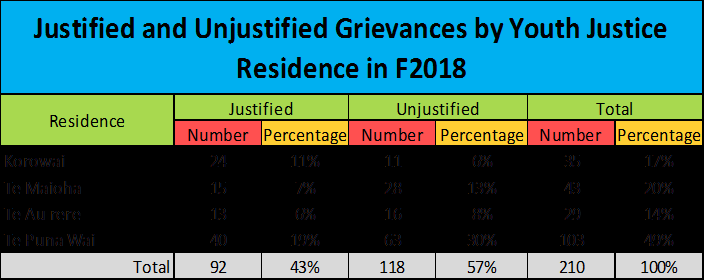
Te Puna Wai had the highest proportion (40) of justified grievances in F2018. Te Au rere had the lowest
n
proportion (13) of justified grievances in F2018.
n
A
Te Puna Wai had the highest proportion (63) of unjustified grievances and Te Au rere had the lowest
proportion of unjustified grievances (16) in F2018.
Te Puna Wai had the highest proportion of justified grievances for an individual quarter, with 13 found
justified during F2018 quarter four (1 Apr – 30 Jun 2018).
Te Puna Wai had the highest proportion of unjustified grievances for an individual quarter, with 20 found
unjustified during F2018 quarter three (1 Jan – 31 Mar 2018).
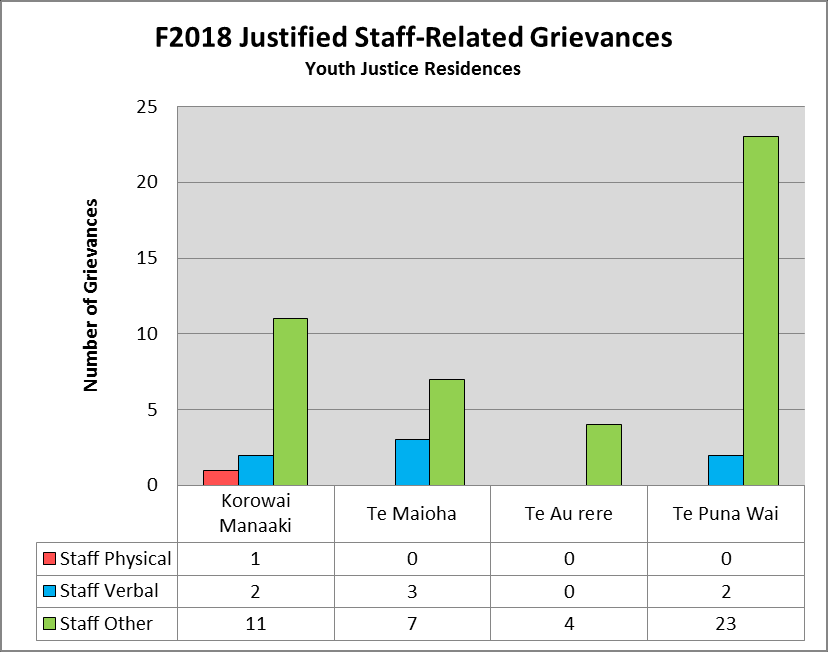
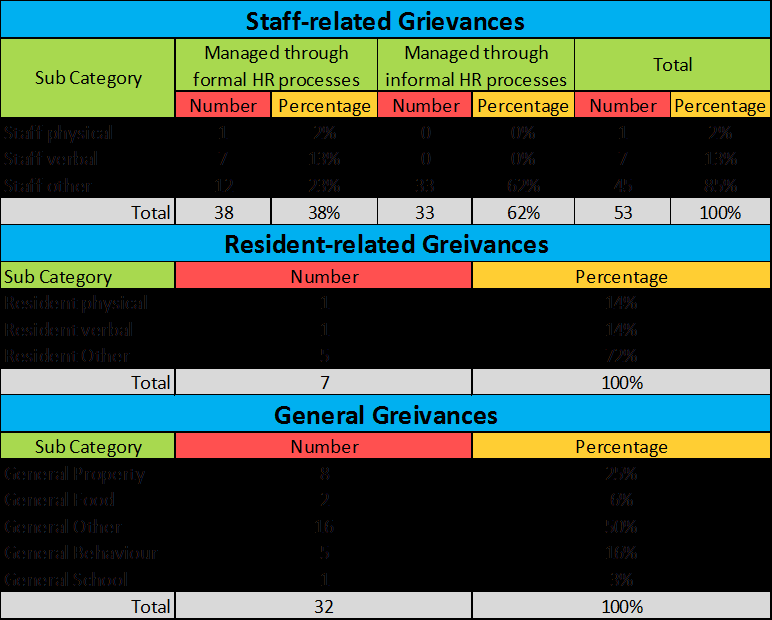
Staff-related Grievances
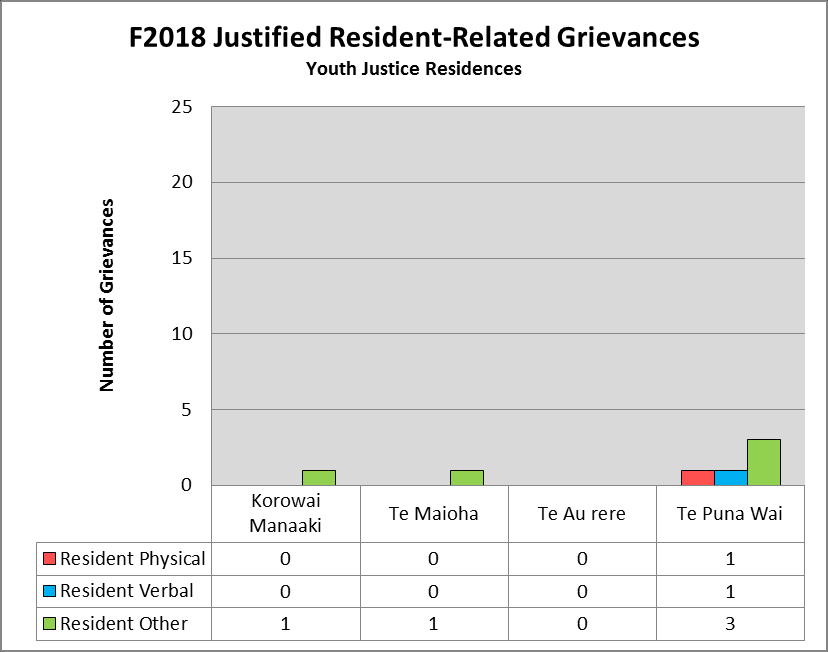
Resident-related Greivances
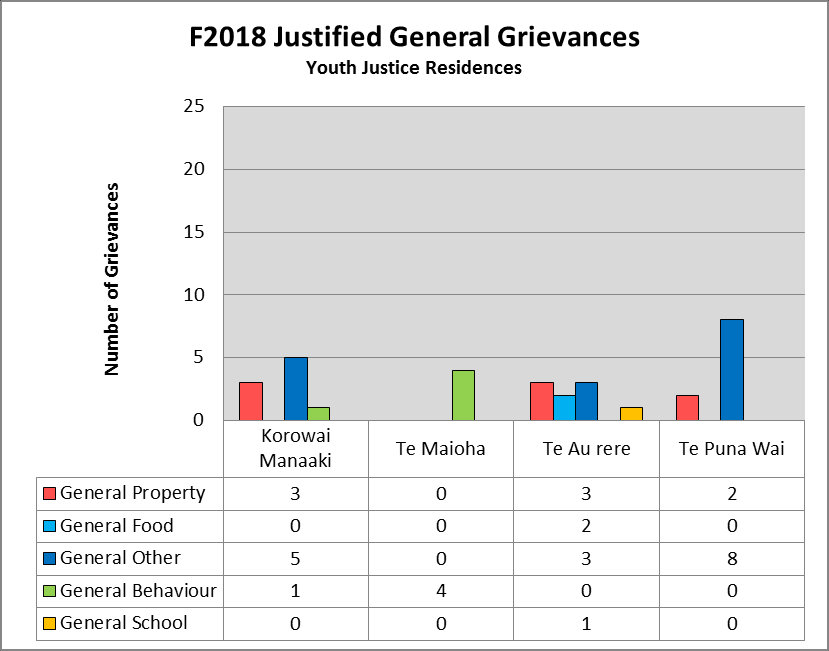
General Grievances
Analysis
es
c
an
iev
Gr
d
e
fi
sti
Ju
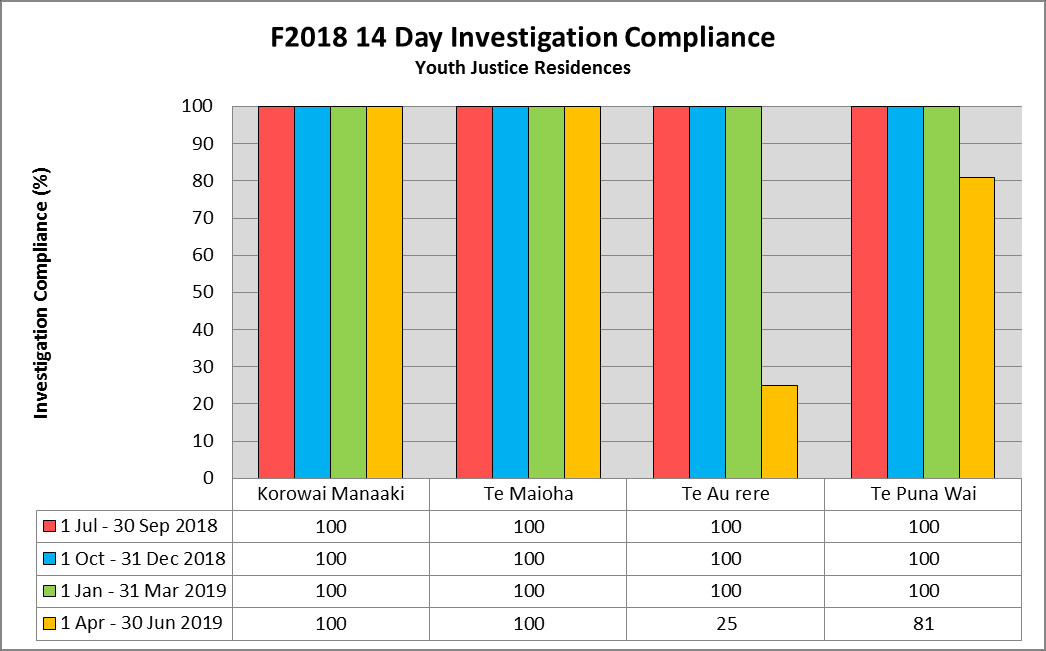
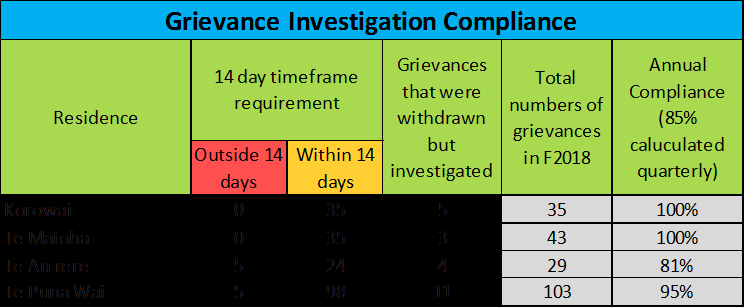
Grievance Compliance
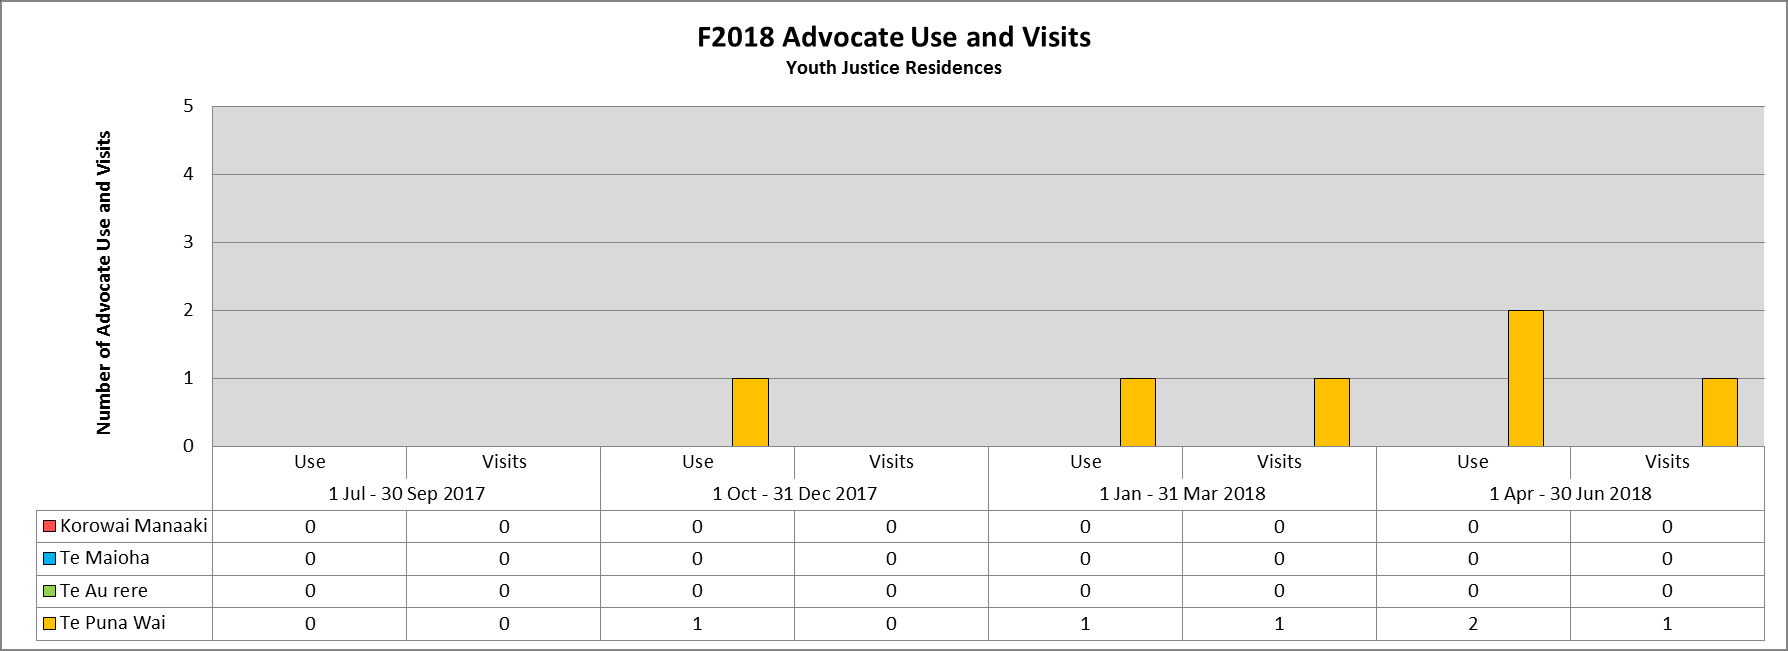
Grievance Advocacy
Analysis
e
in
e
d
rawn
ces
%T
1
Under Official Information Act 1982
efram
d
late
98
ith
cu
n
tim
w
grievan
4
42
re
f
1
o
calu
24
tio
in
5
4 day
we
ers
5%
ith
at
b
(8
e
rere
h
m
ence1
s t
u
ce
0%T
n
n
aysW
Au
d
10
5%
vestiga
sid
ce
lia
Te
tal
p
%
Re
an
14
35
5
39
0
Advocate use and visits was low across youth justice residences during F2018. Advocates were
In
m
e
5
00
not used, nor did they visit, at Korowai Manaaki, Te Maioha O Parekarangi and Te Au rere a te
3
1
11
Tonga during F2018. A small number of advocates were used (4) and visited (2) at Te Puna Wa
ce
edTo
tGriev
O Tuhinapo during F2018.
at
al Co
tsid
u
43
ai 0
81
9
liance
u
en
ig
n
O
w
53
3
van
p m
ly)
ro
a0
N/A
m ire vest
Wai5
in
8 An
Ko
h
o
a
t
1
arter
aio
n
Grie
C
u
u
ays
u
requ
b
F20
q
d
M
P
Released
Out of Scope
Under Official Information Act 1982
Released
 F2019 Annual Thematic Review of Grievances in Youth Justice Residences
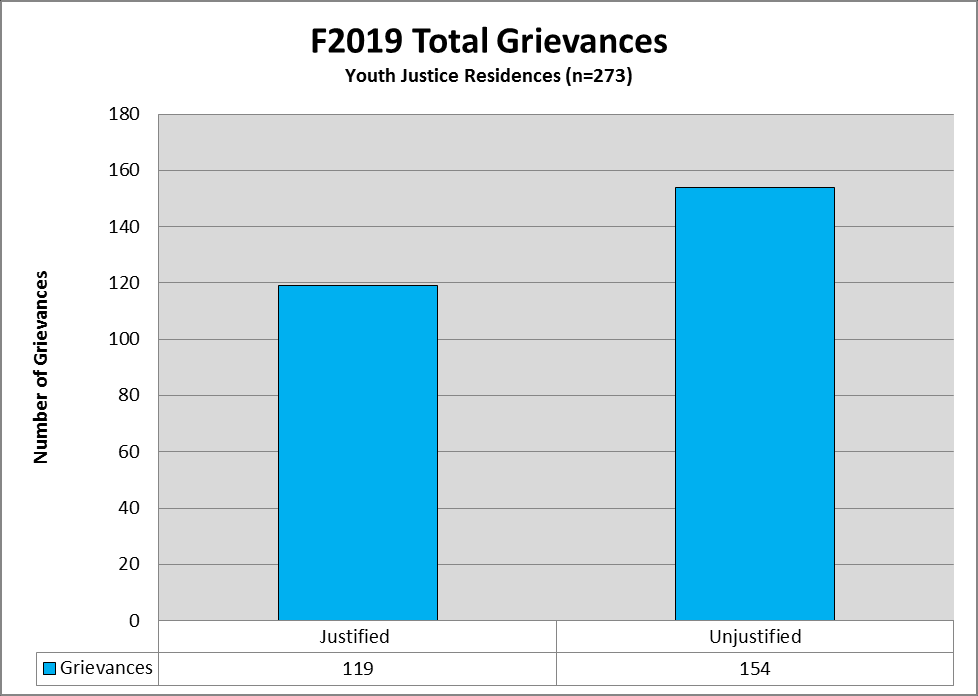
F2019 Total Grievance
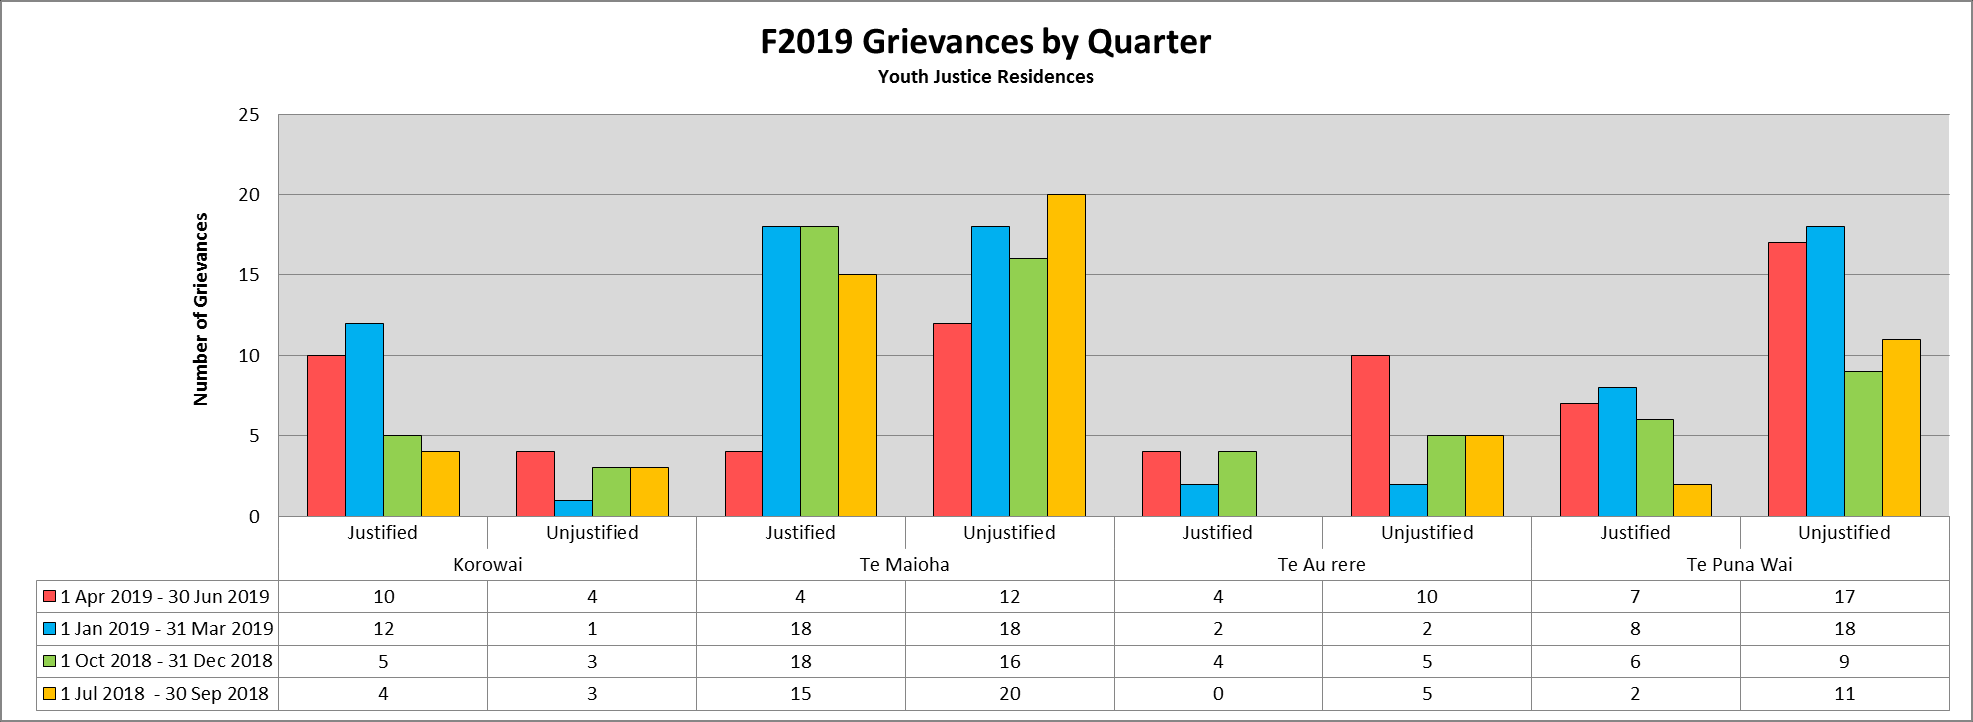
F2019 Grievances per Quarter by Residence
Analysis
ds
F2019 Annual Thematic Review of Grievances in Youth Justice Residences
F2019 Total Grievance
F2019 Grievances per Quarter by Residence
Analysis
ds
en
Tr
al
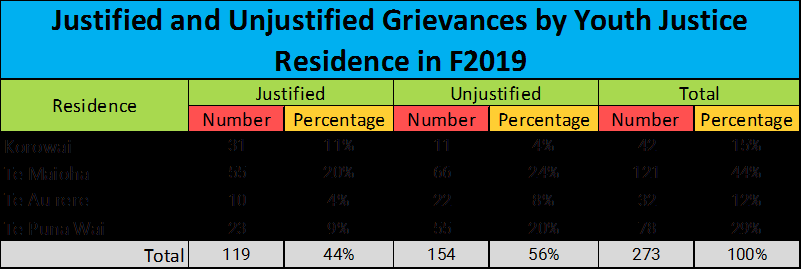
Te Maioha had the highest proportion (55) of justified grievances in F2019. Te Au rere had the lowest
nu
proportion (10) of justified grievances in F2019.
An
Te Maioha had the highest proportion (66) of unjustified grievances and Korowai had the lowest proportion
of unjustified grievances (11) in F2019.
Te Maioha had the highest proportion of justified grievances for an individual quarter, with 18 found
justified during F2019 quarter two and three (1 Apr – 30 Jun 2018 and 1 Jan – 31 Mar 2019).
Te Maioha had the highest proportion of unjustified grievances for an individual quarter, with 20 found
unjustified during F2019 quarter one (1 Jul – 30 Sep 2018).
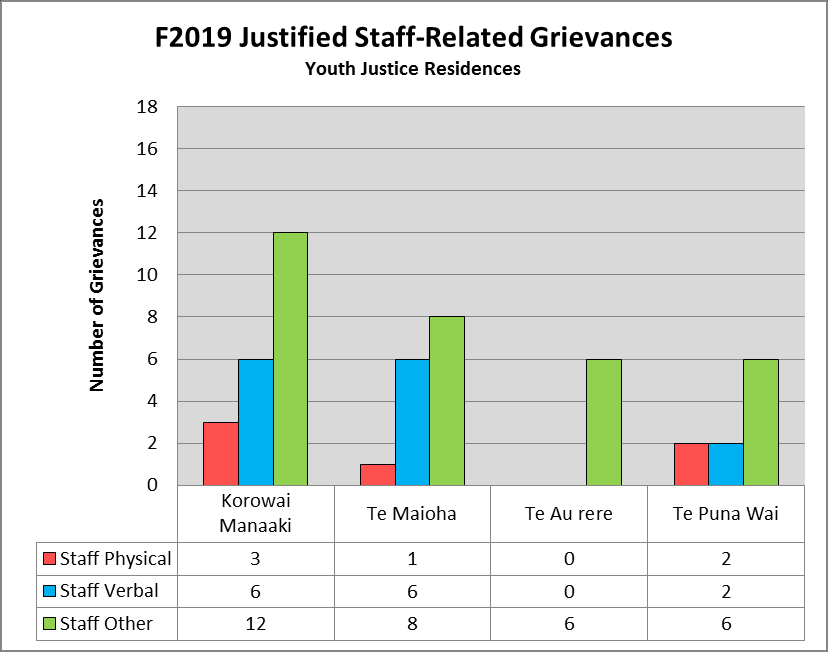
Staff-related Grievances
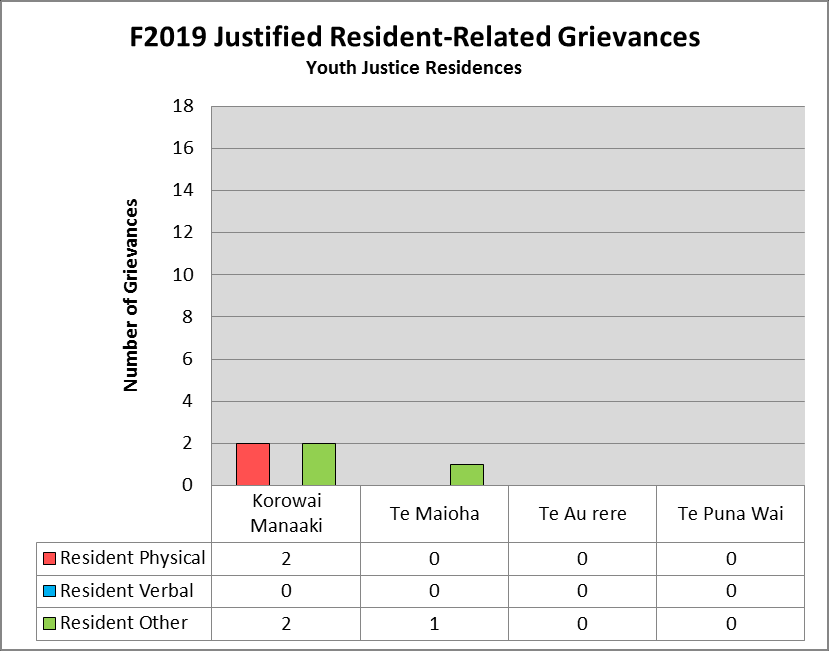
Resident-related Greivances
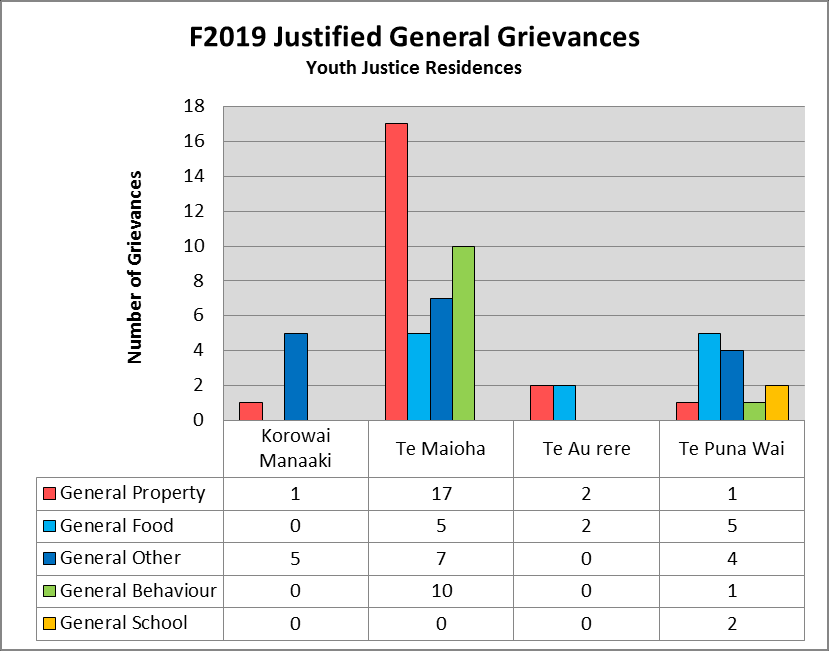
General Grievances
Analysis
Staff-related Grievances
Managed through
Managed through
Sub Category
es
formal HR processes
informal HR processes
Total
c
Number
Percentage
Number
Percentage
Number
Percentage
Staff physical
6
12%
0
0%
6
12%
an
Staff verbal
0
0%
14
27%
14
27%
Staff other
0
0%
32
62%
32
62%
Total
6
12%
46
88%
52
100%
iev
Resident-related Greivances
Gr
Sub Category
Number
Percentage
d
Resident Physical
2
40%
e
Resident Verbal
0
0%
fi
Resident Other
3
60%
Total
5
100%
sti
Resident-related Greivances
Sub Category
Number
Percentage
Ju
General Property
21
34%
General Food
12
19%
General Other
16
26%
General Behaviour
11
18%
General School
2
3%
Total
62
100%
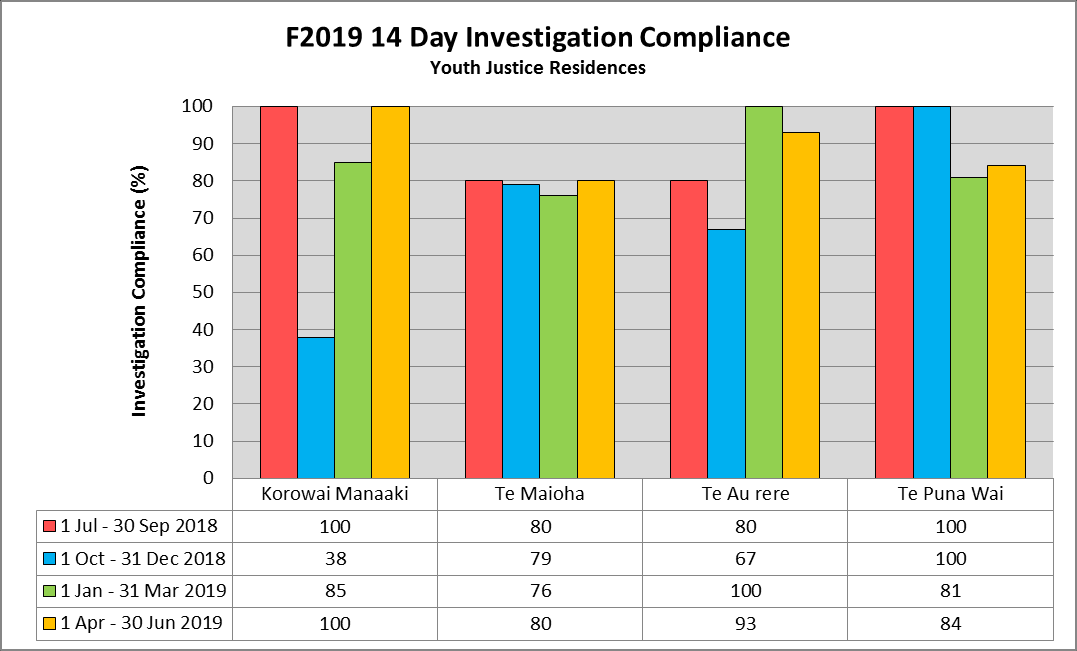
Grievance Compliance
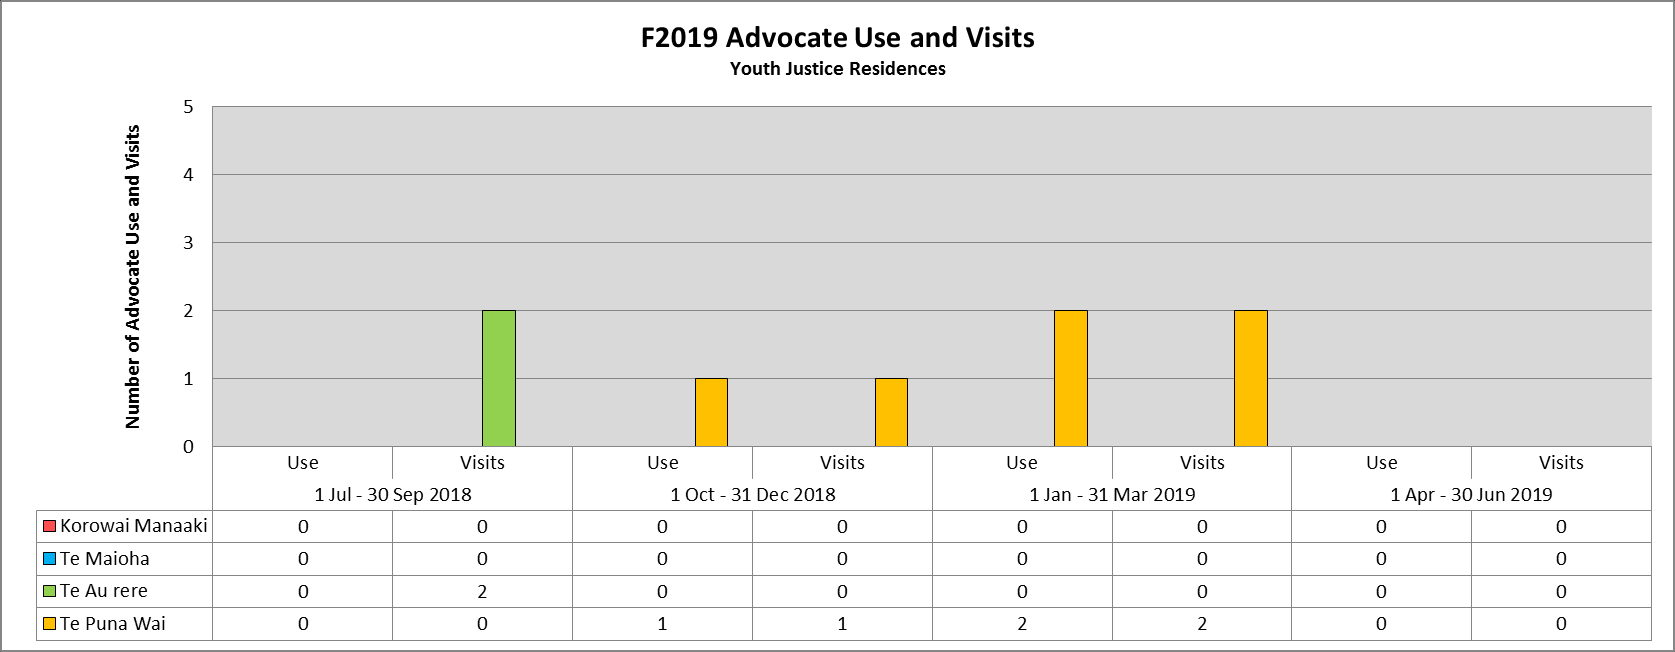
Grievance Advocacy
Analysis
Under Official Information Act 1982
Advocate use and visits was low across youth justice residences during F2019. Advocates were
not used, nor did they visit, at Korowai Manaaki and Te Maioha O Parekarangi. Te Au rere a te
Tonga had two advocate visits during F2019, and Te Puna Wa O Tuhinapo used three advocates
and had three advocate visits during the same
N/A
Released
Out of Scope
Under Official Information Act 1982
Released
F2020 Annual Thematic Review of Grievances in Youth Justice Residences
F2020 Total Grievance
F2020 Grievances per Quarter by Residence
Analysis
F2020 Total Grievances
F2020 Grievances by Quarter
Justified and Unjustified Grievances by
Youth Justice Residences
Youth Justice Residences (n=301)
Youth Justice Residence in F2020
40
Justified
Unjustified
Total
152
35
Residence
Number
Percentage
Number
Percentage
Number
Percentage
30
s
s
Korowai Maanaki
43
14%
22
7%
65
22%
e
ec
c
25
n
anv r
Te Maioha
46
15%
59
20%
105
35%
ei te
151
20
ar
Te Au rere
17
6%
24
8%
41
14%
ieva
u
r
f Gr
o
Q
15
Te Puna Wai
45
15%
45
15%
90
30%
G
re
f
b
Per
Total
151
50%
150
50%
301
100%
o
10
m
r
u
e
N
5
Te Maioha had the highest proportion (46) of justified grievances. Te Au rere had the lowest
b
150
proportion (17) of justified grievances.
m
Annual Trends
u
0
Justified
Unjustified
Justified
Unjustified
Justified
Unjustified
Justified
Unjustified
Te Maioha had the highest proportion (59) of unjustified grievances and Korowai Maanaki had the
N
lowest proportion of unjustified grievances (22).
Korowai
Te Maioha
Te Au rere
Te Puna Wai
1 Jul 2019 - 30 Sep 2019
13
1
14
3
0
2
13
8
Te Puna Wai had the highest proportion of justified grievances for an individual quarter, with (19)
149
found justified during 2020 quarter one (1 Jan – 31 Mar 2020).
Justified
Unjustified
1 Oct 2019 - 31 Dec 2019
10
10
10
10
3
8
8
15
Te Maioha had the highest proportion of unjustified grievances for an individual quarter, with (37)
1 Jan 2020 - 31 Mar 2020
12
10
14
37
7
4
18
15
Grievances
found unjustified during 2020 quarter one (1 Jan – 31 Mar 2020).
151
150
1 Apr 2020 - 30 Jun 2020
8
1
8
9
7
10
6
7
Staff-related Grievances
Resident-related Grievances
General Grievances
Analysis
F2020 Justified Staff-Related Grievances
F2020 Justified Resident-Related Grievances
F2020 Justified General Grievances
Staff-related Grievances
Youth Justice Residences
Youth Justice Residences
Youth Justice Residences
Managed through
Managed through
Sub Category
formal HR processes
informal HR processes
Total
22
22
22
Number
Percentage
Number
Percentage
Number
Percentage
20
20
20
Staff physical
5
8%
4
6%
9
14%
Staff verbal
1
2%
9
14%
10
16%
s
18
18
s
18
s
e
e
c
c
e
c
Staff other
2
3%
42
67%
44
70%
16
16
16
an
an
an
Total
8
13%
55
87%
63
100%
v
v
v
ei
e
14
14
i
14
ie
Resident-related Grievances
f Gr
f Gr
12
12
f Gr
o
12
o
Sub Category
Number
Percentage
r
r
r o
e
e
10
10
e
Resident Physical
0
0%
b
10
b
b
m
m
m
8
Resident Verbal
0
0%
u
8
8
u
u
N
N
N
Resident Other
2
100%
6
6
6
Total
2
100%
4
4
4
Resident-related Grievances
2
2
2
Sub Category
Number
Percentage
0
Justified Grievances
0
General Property
General Food
General Other
General Behaviour
General School
General Property
43
50%
0
Korowai
Te Maioha
Te Au rere
Te Puna Wai
Under Official Information Act 1982
Korowai Manaaki
Te Maioha
Te Au rere
Te Puna Wai
Manaaki
Korowai Manaaki
10
1
7
0
1
General Food
6
7%
Staff Physical
2
1
0
6
Resident Physical
0
0
0
0
Te Maioha
18
2
3
12
0
General Other
21
24%
General Behaviour
15
17%
Staff Verbal
1
5
0
4
Resident Verbal
0
0
0
0
Te Au rere
8
0
2
0
0
General School
1
1%
Staff Other
21
4
7
12
Resident Other
0
1
0
1
Te Puna Wai
7
3
9
3
0
Total
86
100%
Grievance Compliance
Internal and External Grievance Advocacy
Analysis
Released
F2020 14 Day Investigation Compliance
Grievance Investigation Compliance
F2020 Advocate Use and Visits by Quarter
Youth Justice Residences
14 day timeframe requirement
Youth Justice Residences
Annual
100
Grievances that Total numbers
Compliance
25
Residence
were withdrawn of grievances in
(85%
90
Outside 14 days Within 14 days but investigated
F2020
caluculated
80
20
)
quarterly)
70
ateco tsi
Korowai Maanaki
13
57
5
65
78%
v
ce (%
60
d
15
Vis
Te Maioha
17
90
0
107
87%
f A
d
50
plian
o
Te Au rere
1
38
1
39
98%
r
an
m
e
40
b
e
Te Puna Wai
22
63
7
90
70%
10
Co
m
Us
30
u
Advocates were used (19) times in Youth Justice residences in F2020. Advocate use was
N
highest at Te Puna Wai (11) while on the other hand Te Au rere used (1) and Te Maioha did
20
gation
5
not use any advocates.
10
vesti
0
In
Advocates visited (61) times in Youth Justice residences during F2020; the highest number of
Korowai
0
Te Maioha
Te Au rere
Te Puna Wai
Use
Visits
Use
Visits
Use
Visits
Use
Visits
visits (20) occurred at Te Puna Wai in 2020 quarter one (1 Jan – 31 Mar 2020). Te Puna Wai
Manaaki
1 Jul - 30 Sep 2019
1 Oct - 31 Dec 2019
1 Jan - 31 Mar 2020
1 Apr - 30 Jun 2020
also had the highest total number of advocate visits (42). Te Au rere did not receive any
1 Jul - 30 Sep 2019
78
88
100
95
Korowai Manaaki
0
12
4
0
2
0
1
1
advocate visits during F2020.
1 Oct - 31 Dec 2019
74
89
90
65
Te Maioha
0
0
0
0
0
3
0
0
1 Jan - 31 Mar 2020
77
77
100
76
2020 quarter two (1 Apr – 30 Jun 2020) was an exceptional time with COVID-19 restrictions in
N/A
Te Au rere
0
0
0
0
1
0
0
0
place. VOYCE Whakaranga Mai made daily phone calls to residences to offer advocacy
1 Apr - 30 Jun 2020
83
95
100
45
Te Puna Wai
3
0
2
12
5
20
1
10
while visits could not occur in person.
Out of Scope
Under Official Information Act 1982
Released
F2021 Annual Thematic Review of Grievances in Youth Justice Residences
F2021 Total Grievance
F2021 Grievances per Quarter by Residence
Analysis
F2021 Grievances by Quarter
Justified and Unjustified Grievances by
F2021 Total Grievances
Youth Justice Residences
Youth Justice Residence in F2021
Youth Justice Residence (n-232)
55
Justified
Unjustified
Total
50
Residence
180
Number
Percentage
Number
Percentage Number Percentage
s
45
ec
s
160
40
Korowai Maanaki
30
13%
26
11%
56
24%
e
an
r
c
35
v
Te Maioha
17
7%
91
39%
108
47%
140
e
n
i
te
30
ar
Te Au rere
6
3%
9
4%
15
6%
120
f Gr
25
ieva
o
Qu
r
r
r
20
Te Puna Wai
21
9%
32
14%
53
23%
100
e
e
G
b
p
15
f
m
Total
74
32%
158
68%
232
100%
o
80
10
u
r
N
5
Korowai Maanaki had the highest proportion (30) of justified grievances. Te Au rere had the lowest
e
60
b
0
proportion (6) of justified grievances.
Justified
Unjustified
Justified
Unjustified
Justified
Unjustified
Justified
Unjustified
m
40
Annual Trends
Te Maioha had the highest proportion (91) of unjustified grievances. Te Au rere had the lowest
u
Korowai
Te Maioha
Te Au rere
Te Puna Wai
proportion of unjustified grievances (9).
N
20
1 Jul 2020 - 30 Sep 2020
14
8
5
19
0
2
4
5
Korowai Maanaki had the highest proportion of justified grievances for an individual quarter, with (14)
0
1 Oct 2020 - 31 Dec 2020
11
6
5
48
1
0
3
8
found justified during quarter three 2020 (1 Jul – 30 Sep 2020).
Justified
Unjustified
1 Jan 2021 - 31 Mar 2021
2
6
5
12
2
1
5
10
Te Maioha had the highest proportion of unjustified grievances for an individual quarter, with (48)
Grievances
74
158
1 Apr 2021 - 30 Jun 2021
3
6
2
12
3
6
9
9
found unjustified during quarter four 2020 (1 Oct – 31 Dec 2020).
Staff-related Grievances
Resident-related Grievances
General Grievances
Analysis
F2021 Justified Staff-Related Grievances
F2021 Justified Resident-Related Grievances
F2021 Justified General Grievances
Staff-related Grievances
Youth Justice Residences
Youth Justice Residences
Youth Justice Residences
Managed through
Managed through
Sub Category
formal HR processes
informal HR processes
Total
20
20
20
Number
Percentage
Number
Percentage
Number
Percentage
Staff physical
4
9%
0
0%
4
9%
Staff verbal
3
7%
2
5%
5
11%
s
15
s
s
15
Staff other
2
5%
33
75%
35
80%
e
15
c
ec
e
c
n
Total
9
20%
35
80%
44
100%
van
an
v
ieva
e
Resident-related Grievances
r
i
ie
10
G
10
Gr
f
10
f
f Gr
Sub Category
Number
Percentage
o
o
r
r
r o
Resident Physical
1
20%
e
e
e
b
b
b
Resident Verbal
0
0%
m
m
m
5
u
u
5
u
Resident Other
4
80%
N
5
N
N
Total
5
100%
0
Resident-related Grievances
General
0
0
General Property
General Food
General Other
General School
Sub Category
Number
Percentage
Korowai
Korowai
Behaviour
Te Maioha
Te Au rere
Te Puna Wai
Te Maioha
Te Au rere
Te Puna Wai
General Property
8
32%
Manaaki
Manaaki
Korowai Manaaki
3
1
5
0
0
Justified Grievances
General Food
2
8%
Under Official Information Act 1982
Staff Physical
1
2
0
1
Resident Physical
1
0
0
0
Te Maioha
2
1
4
1
0
General Other
13
52%
Staff Verbal
1
3
0
1
Resident Verbal
0
0
0
0
Te Au rere
1
0
1
0
0
General Behaviour
2
8%
General School
0
0%
Staff Other
17
3
4
11
Resident Other
1
1
0
2
Te Puna Wai
2
0
3
1
0
Total
25
100%
Grievance Compliance
Internal and External Grievance Advocacy
Analysis
Grievance Investigation Compliance
F2021 14 Day Investigation Compliance
F2021 Advocate Use and Visits
Released
14 day timeframe requirement
Youth Justice Residences
Youth Justice Residences
Annual
Grievances that Total numbers of
120
15
Compliance (85%
Residence
were withdrawn
grievances in
Outside 14 days
Within 14 days
caluculated
but investigated
F2021
100
quarterly)
)
de
ce (%
Korowai Maanaki
12
52
5
56
78%
80
Us
10
e
Te Maioha
14
94
3
108
87%
ate
plian
c
ad
o
m
Te Au rere
2
14
0
15
89%
60
v
d
ts
si
Te Puna Wai
11
43
2
53
81%
n Com
f A
io
o
Vi
40
5
r
d
at
e
Advocates were used (41) times in Youth Justice residences in F2021. Advocate use was
ig
b
an
st
m
highest at Te Puna Wai (24), while on the other hand Te Au rere and Te Maioha had the
20
u
ve
N
lowest use (1).
In
0
0
Advocates visited (139) times in Youth Justice residences during F2021; the highest number
Use
Visits
Use
Visits
Use
Visits
Use
Visits
Korowai
Te Maioha
Te Au rere
Te Puna Wai
of visits (47) occurred at Te Maioha in 2021. Korowai Maanaki had the lowest number of visits
Manaaki
1 Jul - 30 Sep 2020
1 Oct - 31 Dec 2020
1 Jan - 31 Mar 2021
1 Apr - 30 Jun 2021
(18) during F2021.
1 Jul - 30 Sep 2020
77
100
100
89
Korowai Manaaki
3
4
3
3
3
5
6
6
1 Oct - 31 Dec 2020
94
84
100
73
Te Maioha
0
12
0
11
1
12
0
12
F2021 was an unprecedented time with COVID-19 restrictions in place limiting in-person visits
N/A
1 Jan - 31 Mar 2021
80
76
66
73
Te Au rere
0
3
0
6
0
12
1
13
at residences. Throughout this difficult period, VOYCE Whakaranga Mai made daily phone
1 Apr - 30 Jun 2021
78
88
89
89
Te Puna Wai
2
6
4
12
9
10
9
12
calls to residences to offer advocacy when visits could not occur in person.
Out of Scope
Under Official Information Act 1982
Released
F2022 Annual Thematic Review of Grievances in Youth Justice Residences
F2022 Total Grievance
F2022 Grievances per Quarter by Residence
Analysis
Justified and Unjustified Grievances by
F2022 Total Grievances
F2022 Grievances by Quarter
Youth Justice Residences
Youth Justice Residence in F2022
Youth Justice Residence (n-359)
Justified
Unjustified
Total
30
Residence
Number
Percentage
Number
Percentage
Number
Percentage
260
25
Korowai Maanaki
30
8%
34
9%
64
18%
240
s
s
ce
220
n
Whakatakapokai
2
1%
8
2%
10
3%
20
ce
r
n
200
evai te
Te Maioha
29
8%
101
28%
130
36%
180
ar
15
u
Te Au rere
23
6%
24
7%
47
13%
evai
160
of Gr
Q r
Te Puna Wai
41
11%
67
19%
108
30%
140
e
10
er
b
p
Total
125
35%
234
65%
359
100%
120
m
of Gr
5
100
Nu
Te Puna Wai had the highest proportion (41) of justified grievances. Whakatakapokai had the lowest
er
b
80
0
proportion (2) of justified grievances.
Justified
Unjustified
Justified
Unjustified
Justified
Unjustified
Justified
Unjustified
m
60
Annual Trends
Te Maioha had the highest proportion (101) of unjustified grievances. Whakatakapokai had the
40
Korowai
Te Maioha
Te Au rere
Te Puna Wai
Nu
lowest proportion of unjustified grievances (8).
20
1 Jul 2020 - 30 Sep 2021
11
9
3
24
7
12
6
15
Te Puna Wai had the highest proportion of justified grievances for an individual quarter, with (16)
0
1 Oct 2020 - 31 Dec 2021
7
12
14
25
11
7
7
13
found justified during quarter one 2022 (1 Jan – 31 Mar 2022).
Justified
Unjustified
1 Jan 2021 - 31 Mar 2022
7
7
5
26
4
2
16
27
Te Puna Wai had the highest proportion of unjustified grievances for an individual quarter, with (27)
Grievances
125
234
1 Apr 2021 - 30 Jun 2022
5
6
7
26
1
3
12
12
found unjustified during quarter one 2022 (1 Jan – 31 Mar 2022).
Staff-related Grievances
Resident-related Grievances
General Grievances
Analysis
Staff-related Grievances
F2022 Justified Staff-Related Grievances
F2022 Justified Resident-Related Grievances
F2022 Justified General Grievances
Managed through
Managed through
Youth Justice Residences
Youth Justice Residences
Youth Justice Residences
Sub Category
formal HR processes
informal HR processes
Total
20
20
20
Number
Percentage
Number
Percentage
Number
Percentage
Staff physical
2
6%
1
3%
3
10%
Staff verbal
0
0%
6
19%
6
19%
s
15
s
s15
e
15
e
Staff other
1
3%
21
68%
22
71%
c
ec
c
n
Total
3
10%
28
90%
31
100%
an
an
v
v
ei
ei
ieva
Resident-related Greivances
r
10
G10
f Gr
10
f Gr
f
Number
Percentage
o
Sub Category
o
o
r
r
r
e
e
e
Resident Physical
0
0%
b
b
b
m
m
m
Resident Verbal
4
44%
u
5
u
u 5
N
5
N
N
Resident Other
5
56%
Total
9
100%
Resident-related Greivances
0
0
0
Number
Percentage
Korowai
Whakatakapo
Korowai
Whakatakapo
General Property
General Food
General Other
General Behaviour
General School
Sub Category
Te Maioha
Te Au rere
Te Puna Wai
Te Maioha
Te Au rere
Te Puna Wai
Manaaki
kai
Manaaki
kai
Korowai Manaaki
10
2
6
7
0
General Property
24
28%
Justified Grievances
Under Official Information Act 1982
General Food
12
14%
Staff Physical
0
0
0
0
3
Resident Physical
0
0
0
0
0
Te Maioha
9
4
8
3
0
General Other
31
36%
Staff Verbal
3
0
0
1
2
Resident Verbal
0
0
0
2
2
Te Au rere
2
2
7
0
1
General Behaviour
17
20%
Staff Other
1
0
5
8
8
Resident Other
1
0
0
0
4
Te Puna Wai
3
4
10
5
0
General School
1
1%
Total
85
100%
Grievance Compliance
Internal and External Grievance Advocacy
Analysis
F2022 14 Day Investigation Compliance
F2022 Advocate Use and Visits
Grievance Investigation Compliance
Released
Annual
Youth Justice Residences
Youth Justice Residences
Grievances that Total numbers of
14 day timeframe requirement
Compliance
100
15
Residence
were withdrawn
grievances in (85% caluculated
but investigated
F2022
Outside 14 days
Within 14 days
quarterly)
)
80
d
Korowai Manaaki
16
48
0
64
73%
e
ce (%
Us
10
Whakatakapokai
6
4
2
10
19%
e
60
Te Maioha
48
82
2
130
60%
plian
atec ad
m
o
m
v
Te au rere a te Tonga
3
44
1
47
88%
ts
Co
d
40
si
Te Puna wai
15
93
4
108
92%
f A
o
Vi
5
r
d
gation
e
b
an
Advocates were used (70) times in Youth Justice residences in F2022. Advocate use was
20
m
highest at Te Puna Wai (34), while on the other hand Whakatakapokai had the lowest use (0).
vesti
u
N
In
0
Advocates visited (109) times in Youth Justice residences during F2022; the highest number
0
Korowai
Whakataka
Te Puna
Use
Visits
Use
Visits
Use
Visits
Use
Visits
of visits (40) occurred at Te Maioha and Te Au rerea te Tonga in 2022. Korowai Maanaki had
Te Maioha
Te Au rere
Manaaki
pokai
Wai
1 Jul - 30 Sep 2021
1 Oct - 31 Dec 2021
1 Jan - 31 Mar 2022
1 Apr - 30 Jun 2022
the lowest number of visits (8) during F2022.
1 Jul - 30 Sep 2021
95
25
74
95
71
Korowai Manaaki
10
5
1
0
0
3
1
0
Te Maioha
3
12
5
11
6
7
3
10
Steps are underway to improve how we communicate the role of advocacy, while also
1 Oct - 31 Dec 2021
74
50
67
94
95
working with our stakeholders to increase the visibility of advocacy in all residential
N/A
1 Jan - 31 Mar 2022
50
0
55
100
86
Te Au rere
5
13
1
0
0
13
1
14
environments.
1 Apr - 30 Jun 2022
73
0
58
75
92
Te Puna Wai
8
0
10
0
8
0
8
10
Out of Scope
Under Official Information Act 1982
Released
F2023 Annual Thematic Review of Grievances in Youth Justice Residences
F2023 Total Grievance
F2023 Grievances per Quarter by Residence
Analysis
Justified and Unjustified Grievances by
F2023 Total Grievances
F2023 Grievances by Quarter
Youth Justice Residences
Youth Justice Residence in F2023
Youth Justice Residence (n-239)
Justified
Unjustified
Total
20
Residence
Number
Percentage
Number
Percentage
Number
Percentage
160
se
Korowai Maanaki
16
7%
5
2%
21
9%
s
c
15
140
e
an
Whakatakapokai
14
6%
0
0%
14
6%
c
v
r
120
ei te
Te Maioha
16
7%
57
24%
73
31%
an
ar
10
v
f Gr
Te Au rere
21
9%
34
14%
55
23%
e
Qu
i
100
o
r
r
e
e
Te Puna Wai
31
13%
45
19%
76
32%
80
b
p
f Gr
5
m
Total
98
41%
141
59%
239
100%
o
u
r
60
N
Te Puna Wai had the highest proportion (31) of justified grievances. Whakatakapokai had the lowest
e
0
proportion (14) of justified grievances.
b
40
Justified
Unjustified
Justified
Unjustified
Justified
Unjustified
Justified
Unjustified
Justified
Unjustified
m
Annual Trends
Te Maioha had the highest proportion (57) of unjustified grievances. Whakatakapokai had the lowest
u
Korowai
Whakatakapokai
Te Maioha
Te Au rere
Te Puna Wai
N
20
proportion of unjustified grievances (0).
1 Jul 2022 - 30 Sep 2022
3
2
3
0
0
15
2
6
6
9
Te Au rere a te Tonga had the highest proportion of justified grievances for an individual quarter, with
0
1 Oct 2022 - 31 Dec 2022
0
0
7
0
4
12
13
9
7
16
(13) found justified during quarter four 2022 (1 Oct – 31 Dec 2022).
Justified
Unjustified
1 Jan 2023 - 31 Mar 2023
8
2
2
0
9
17
3
17
8
15
Te Maioha and Te Au rere a te Tonga had the highest proportion of unjustified grievances (17) during
Grievances
98
141
1 Apr 2023 - 30 Jun 2023
5
1
2
0
3
13
3
2
10
5
quarter one 2023 (Jan – 31 Mar 2023).
Staff-related Grievances
Resident-related Grievances
General Grievances
Analysis
F2023 Justified Staff-Related Grievances
F2023 Justified Resident-Related Grievances
F2023 Justified General Grievances
Staff-related Grievances
Youth Justice Residences
Youth Justice Residences
Youth Justice Residences
Managed through formal
Managed through
Sub Category
HR processes
informal HR processes
Total
20
20
20
Number
Percentage
Number
Percentage
Number
Percentage
Staff physical
2
5%
4
9%
6
14%
Staff verbal
4
9%
10
23%
14
33%
s
s
s
e
15
e
15
15
Staff other
2
5%
21
49%
23
53%
c
e
c
c
Total
8
19%
35
81%
43
100%
an
an
an
v
v
v
ei
ei
ei
Resident-related Greivances
10
f Gr
10
f Gr
10
f Gr
o
Sub Category
Number
Percentage
o
o
r
r
r
e
e
e
Resident Physical
0
0%
b
b
b
m
m
m
Resident Verbal
2
17%
u
5
u
u 5
N
5
N
Resident Other
10
83%
N
Total
12
100%
Resident-related Greivances
0
0
0
Korowai
Whakatakapok
Korowai
Whakatakapok
General Property
General Food
General Other
General Behaviour
General School
Sub Category
Number
Percentage
Te Maioha
Te Au rere
Te Puna Wai
Te Maioha
Te Au rere
Te Puna Wai
Manaaki
ai
Manaaki
ai
Korowai Manaaki
0
0
7
0
0
General Property
10
23%
Under Official Information Act 1982
Justified Grievances
General Food
6
14%
Staff Physical
2
1
1
0
2
Resident Physical
0
0
0
0
0
Te Maioha
5
1
3
2
0
General Other
25
58%
Staff Verbal
1
2
2
6
3
Resident Verbal
0
0
0
0
2
Te Au rere
0
0
6
0
0
General Behaviour
2
5%
Staff Other
4
0
2
6
11
Resident Other
2
5
0
3
0
Te Puna Wai
4
1
8
0
0
General School
0
0%
Total
43
100%
Grievance Compliance
Internal and External Grievance Advocacy
Analysis
Grievance Investigation Compliance
Released
F2023 14 Day Investigation Compliance
F2023 Advocate Use and Visits
Annual
Youth Justice Residences
Youth Justice Residences
14 day timeframe requirement
Grievances that Total numbers of Compliance (85%
100
35
Residence
were withdrawn
grievances in
caluculated
but investigated
F2023
Outside 14 days
Within 14 days
quarterly)
)
30
80
d
Korowai Manaaki
7
13
0
21
48%
e
ce (%
25
Us
Whakatakapokai
6
5
0
14
27%
e
60
ate
ad
20
c
Te Maioha
40
33
2
73
42%
plian
m
o
m
v
d
ts
Te au rere a te Tonga
8
41
2
55
64%
Co
si
15
40
f A
Vi
Te Puna wai
44
32
1
76
60%
o
r
d
e
10
Advocates were used (54) times in Youth Justice residences in F2023. Advocate use was
gation
b
an
m
highest at Te Maioha (8) during in quarter one 2023 (1 Jan – 31 Mar 2023), while on the other
20
vesti
u
5
N
hand all residences had at least one quarter where (0) advocates were used.
In
0
0
Advocates visited (198) times in Youth Justice residences during F2023; the highest number
Korowai
Whakatakap
Use
Visits
Use
Visits
Use
Visits
Use
Visits
Te Maioha
Te Au rere
Te Puna Wai
of visits (32) occurred at Te Puna Wai during quarter one 2023 (1 Jan – 31 Mar 2023).
Manaaki
okai
1 Jul - 30 Sep 2022
1 Oct - 31 Dec 2022
1 Jan - 31 Mar 2023
1 Apr - 30 Jun 2023
Korowai Manaaki had the lowest number of visits (0) during quarter three (1Jun – 30 Sep
1 Jul - 30 Sep 2022
100
0
71
100
60
Korowai Manaaki
2
0
0
3
3
0
0
2
2023) and quarter one 2023 (1 Jan – 31 Mar 2023).
1 Oct - 31 Dec 2022
0
57
63
90
38
Te Maioha
8
12
2
8
0
12
5
16
N/A
1 Jan - 31 Mar 2023
60
50
23
48
22
Te Au rere
0
13
2
13
7
12
1
14
Pleased to announce that new posters, comics, and updated forms have recently been
1 Apr - 30 Jun 2023
33
0
41
80
60
Te Puna Wai
10
12
5
0
3
32
2
12
provided to residences to help communicate to tamariki the benefits of using an advocate.
Document Outline