
HRC
Te Otu Mātua
Principal’s Report to the Board of Trustees
24 June 2024
1
HRC Principal’s Report to the Board of Trustees
Contents Page
1.
General Comment
3
2.
Strategic Report
4
3.
Ākonga Curriculum, Achievement, and Wel being
5
4.
Personnel
6
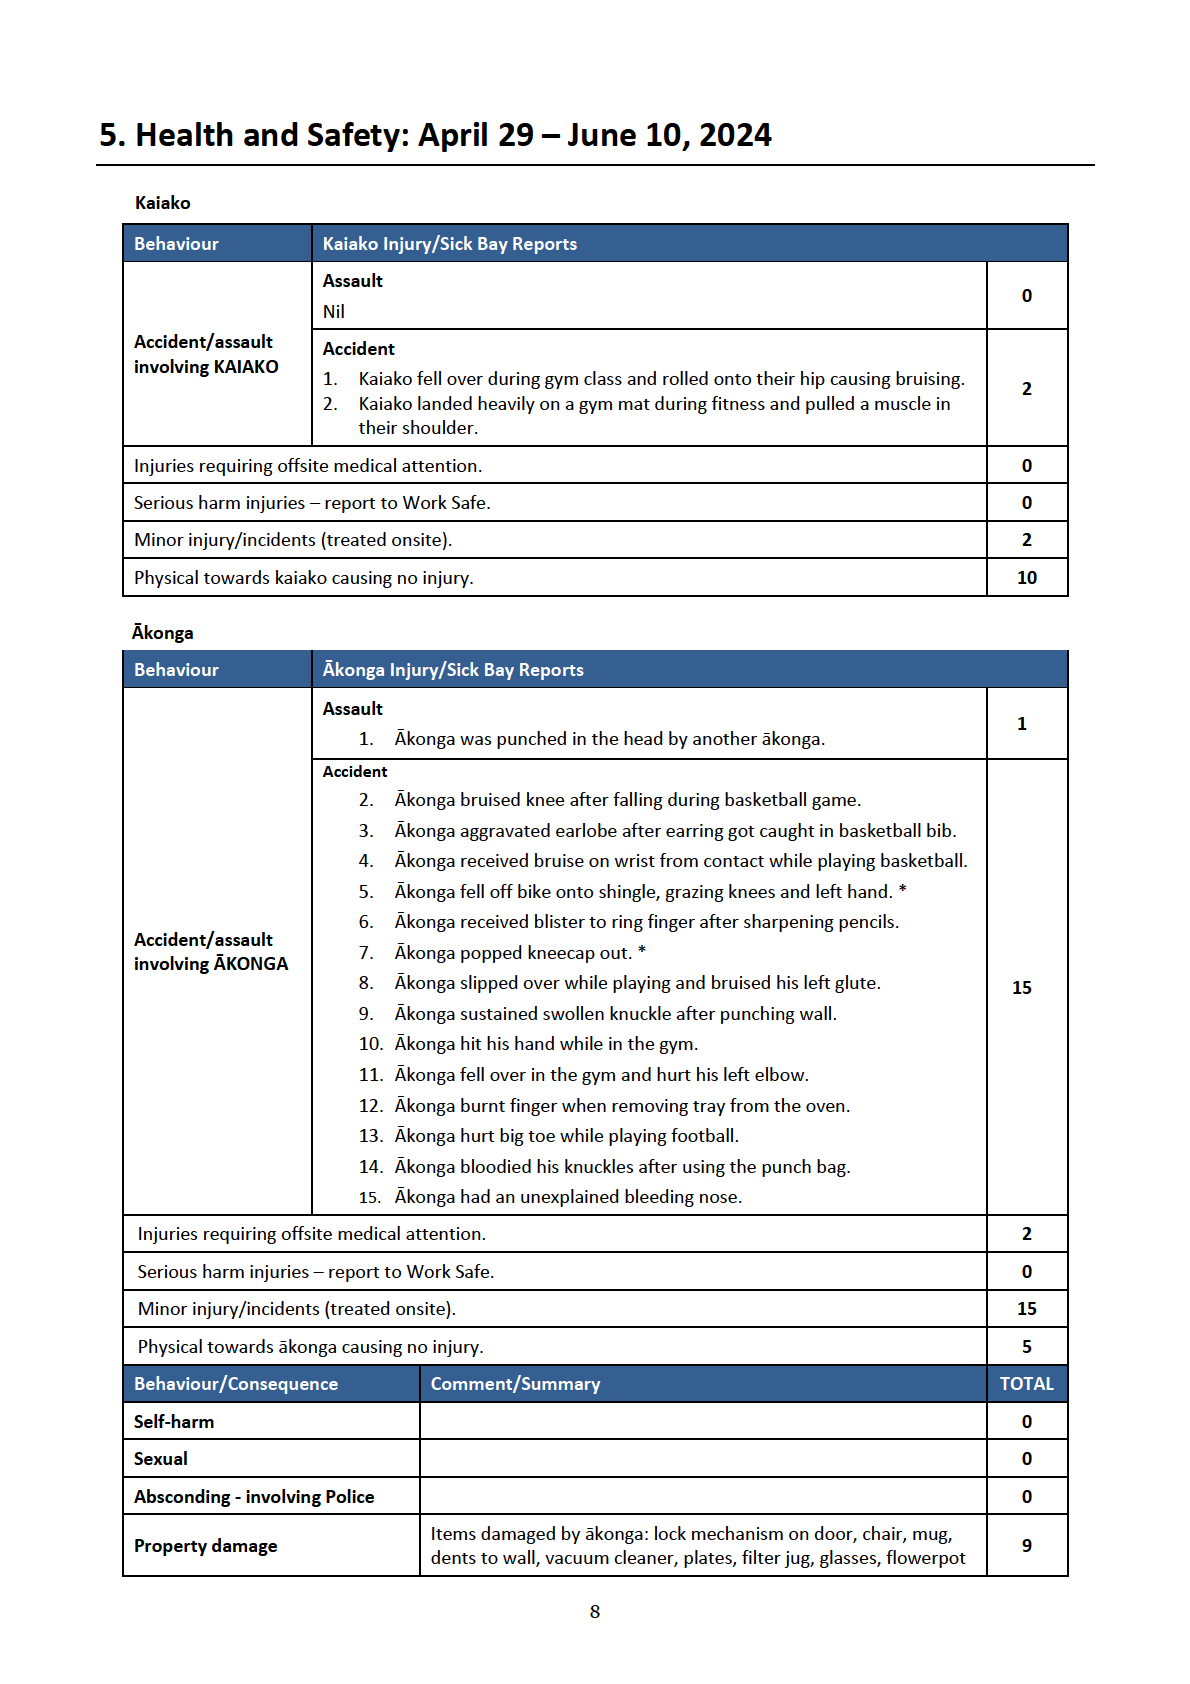
5.
Health and Safety
7
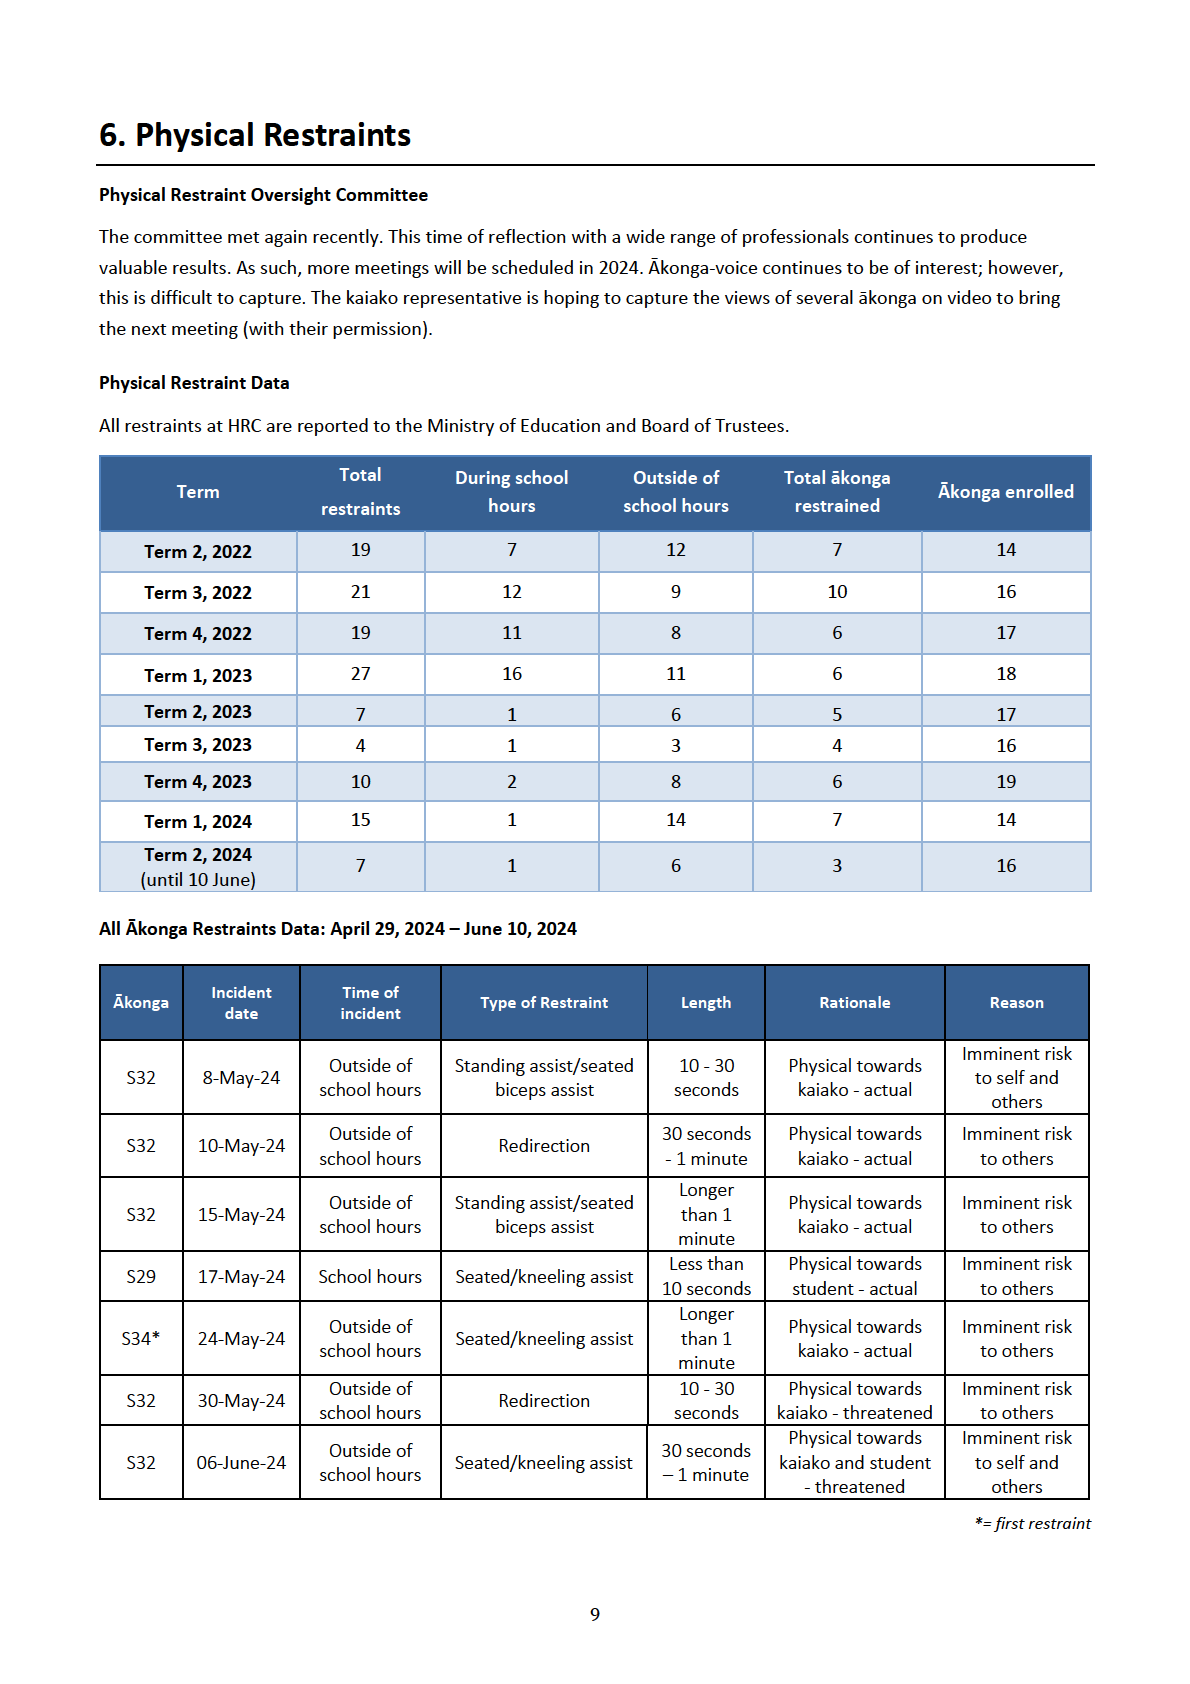
6.
Physical Restraints
8
7.
Stand Downs and Suspensions
11
8.
Financials
11
9.
Property and Grounds
12
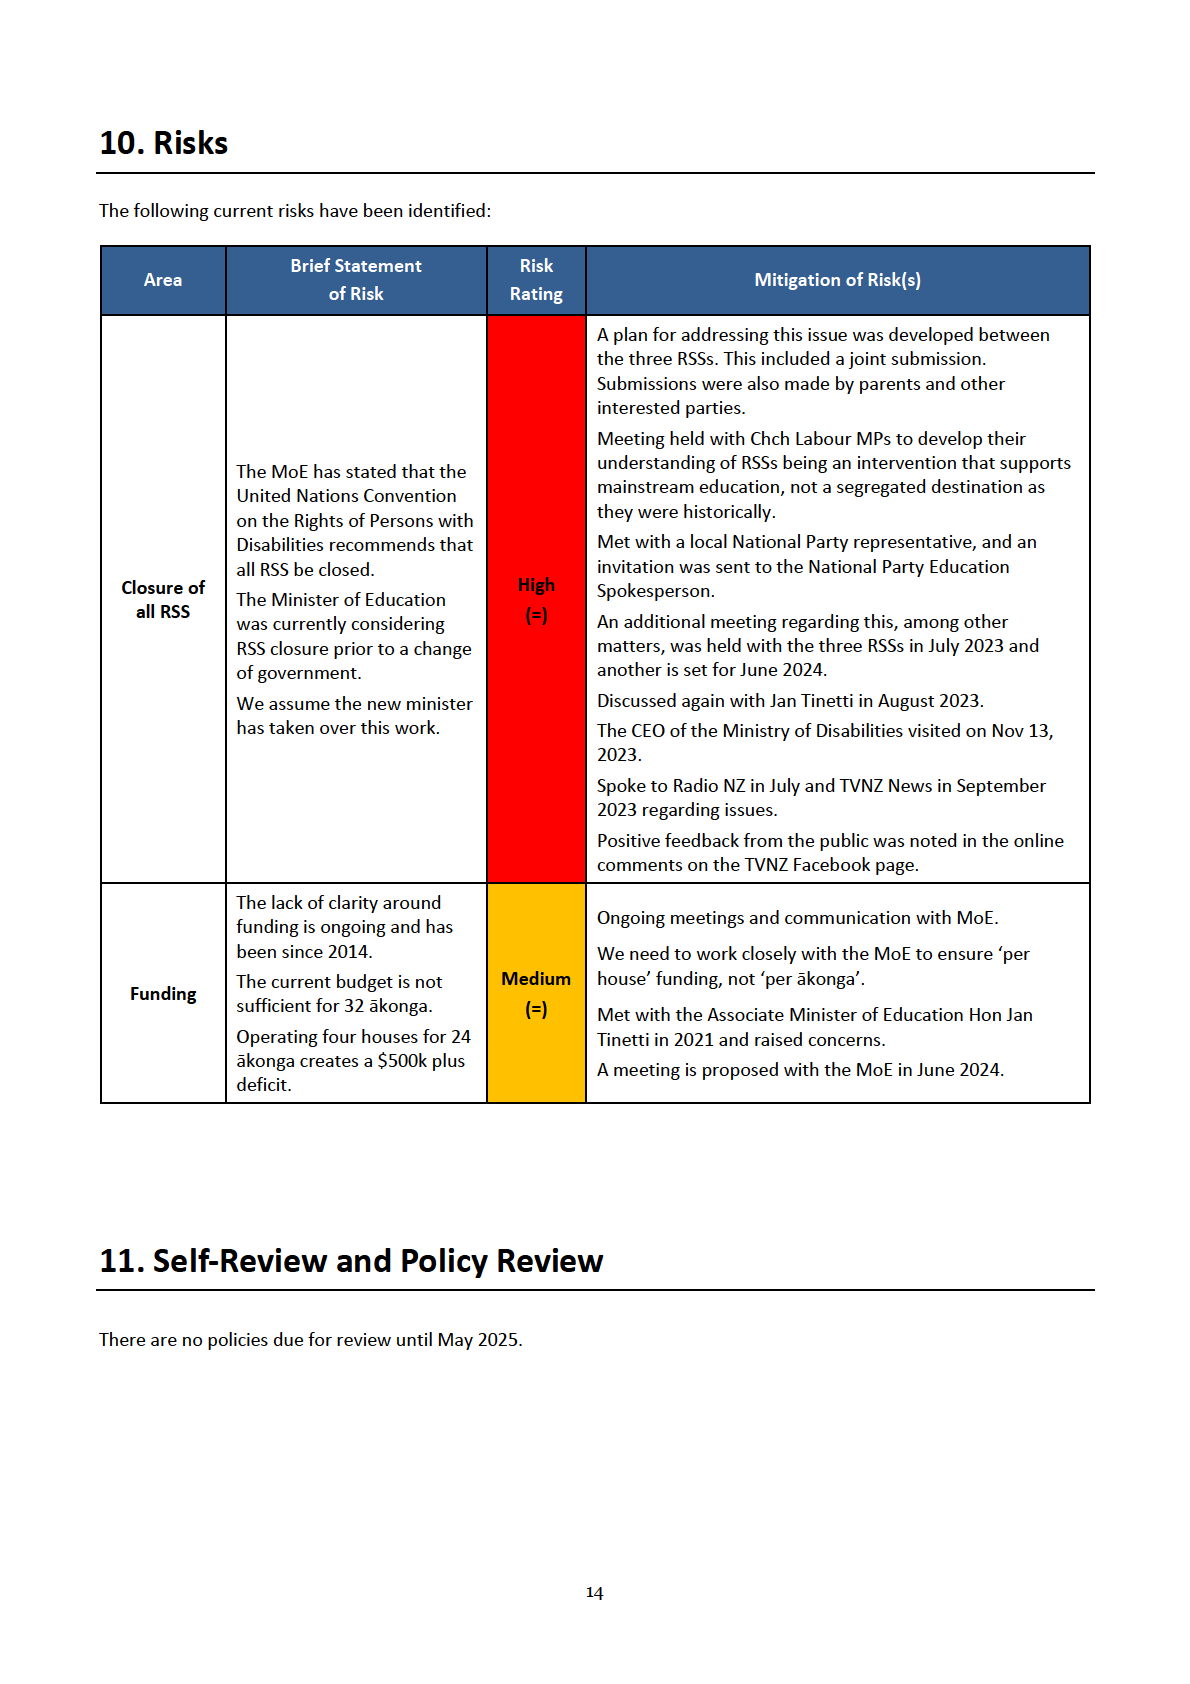
10.
Risks
13
11.
Self-Review and Policy Review
13
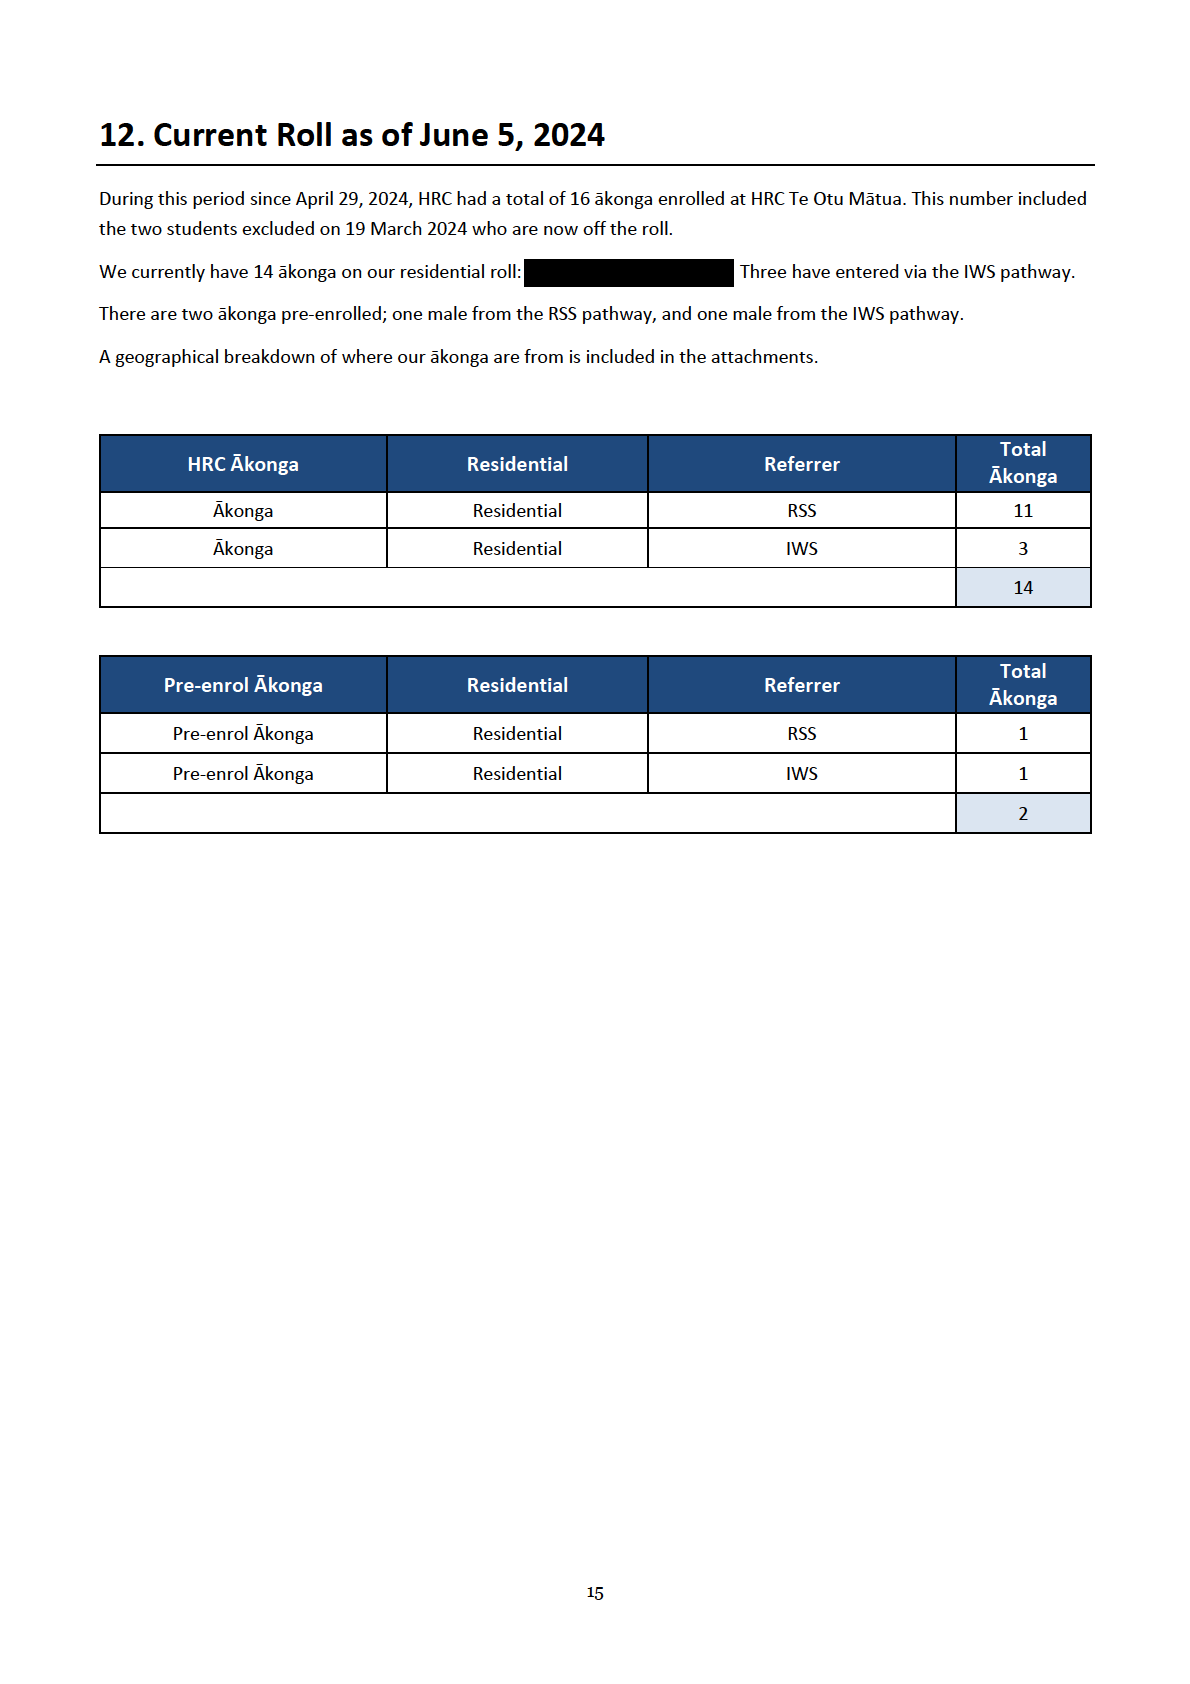
12.
Current Rol
13
Attachments
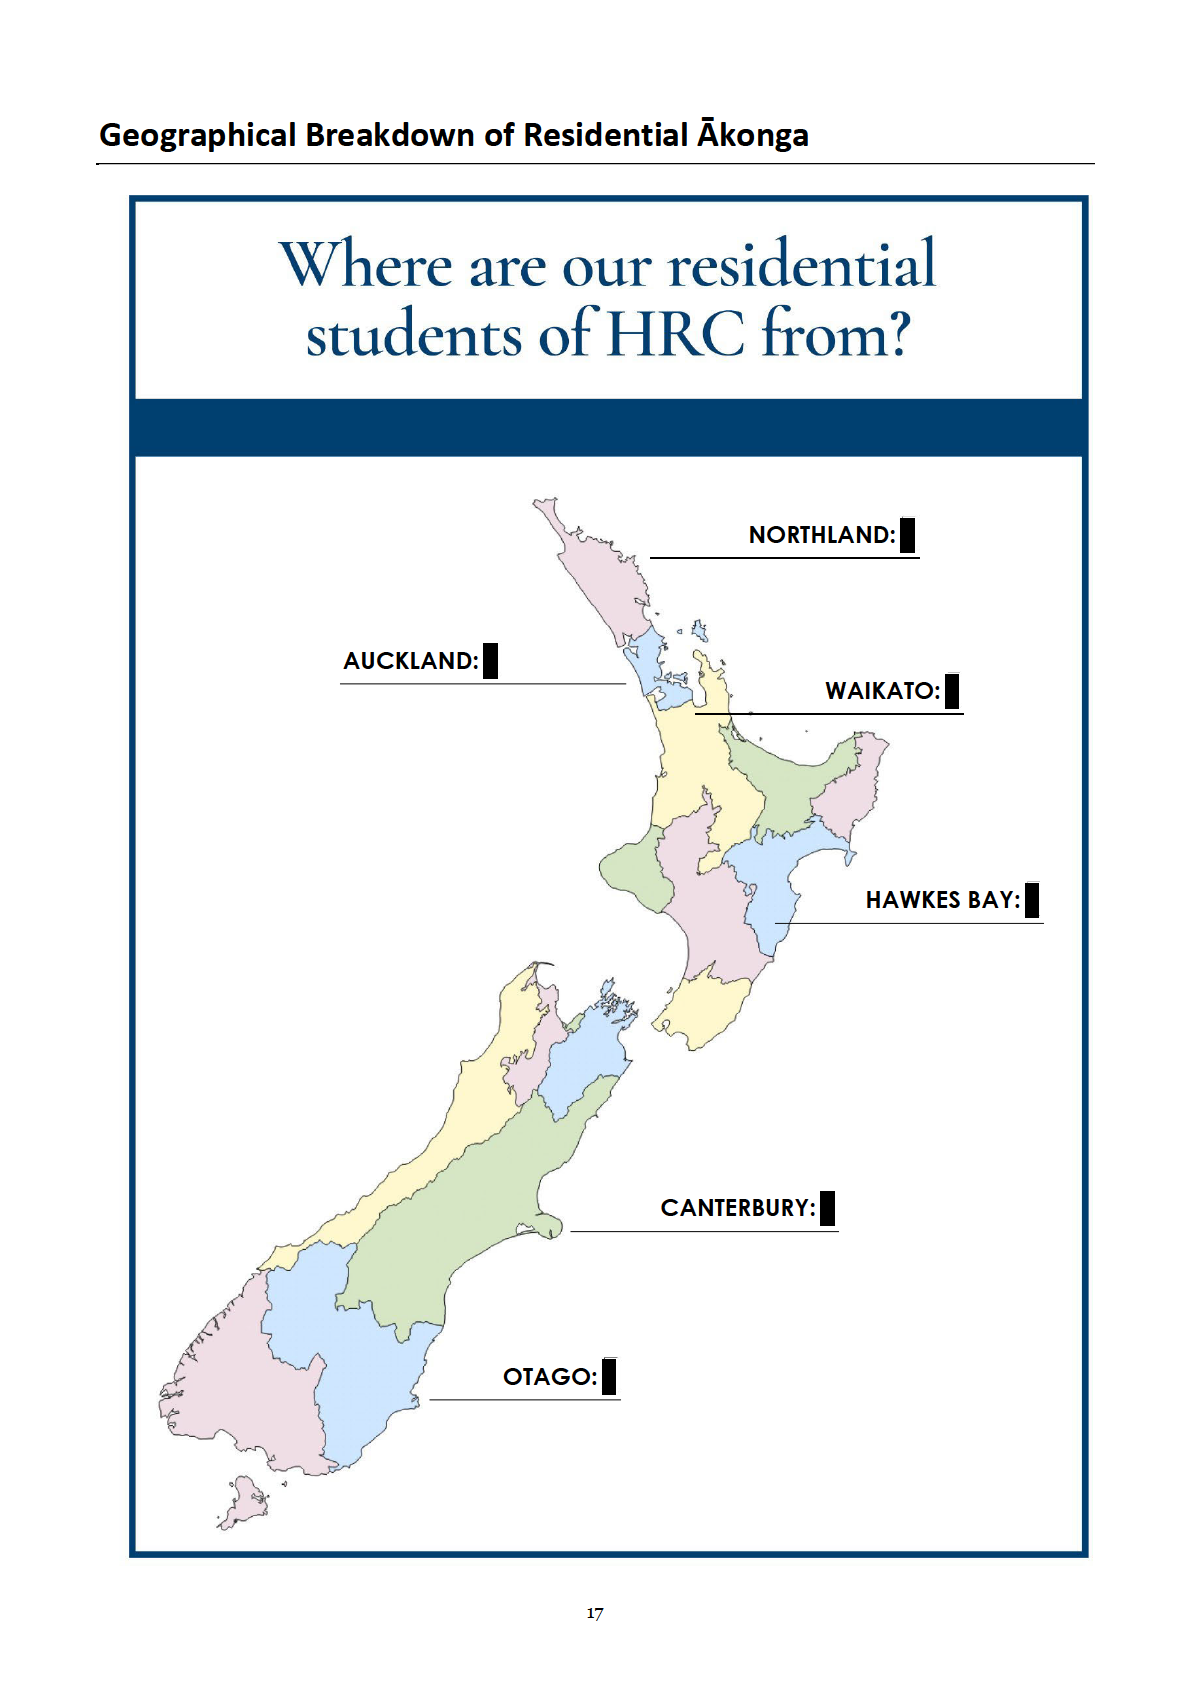
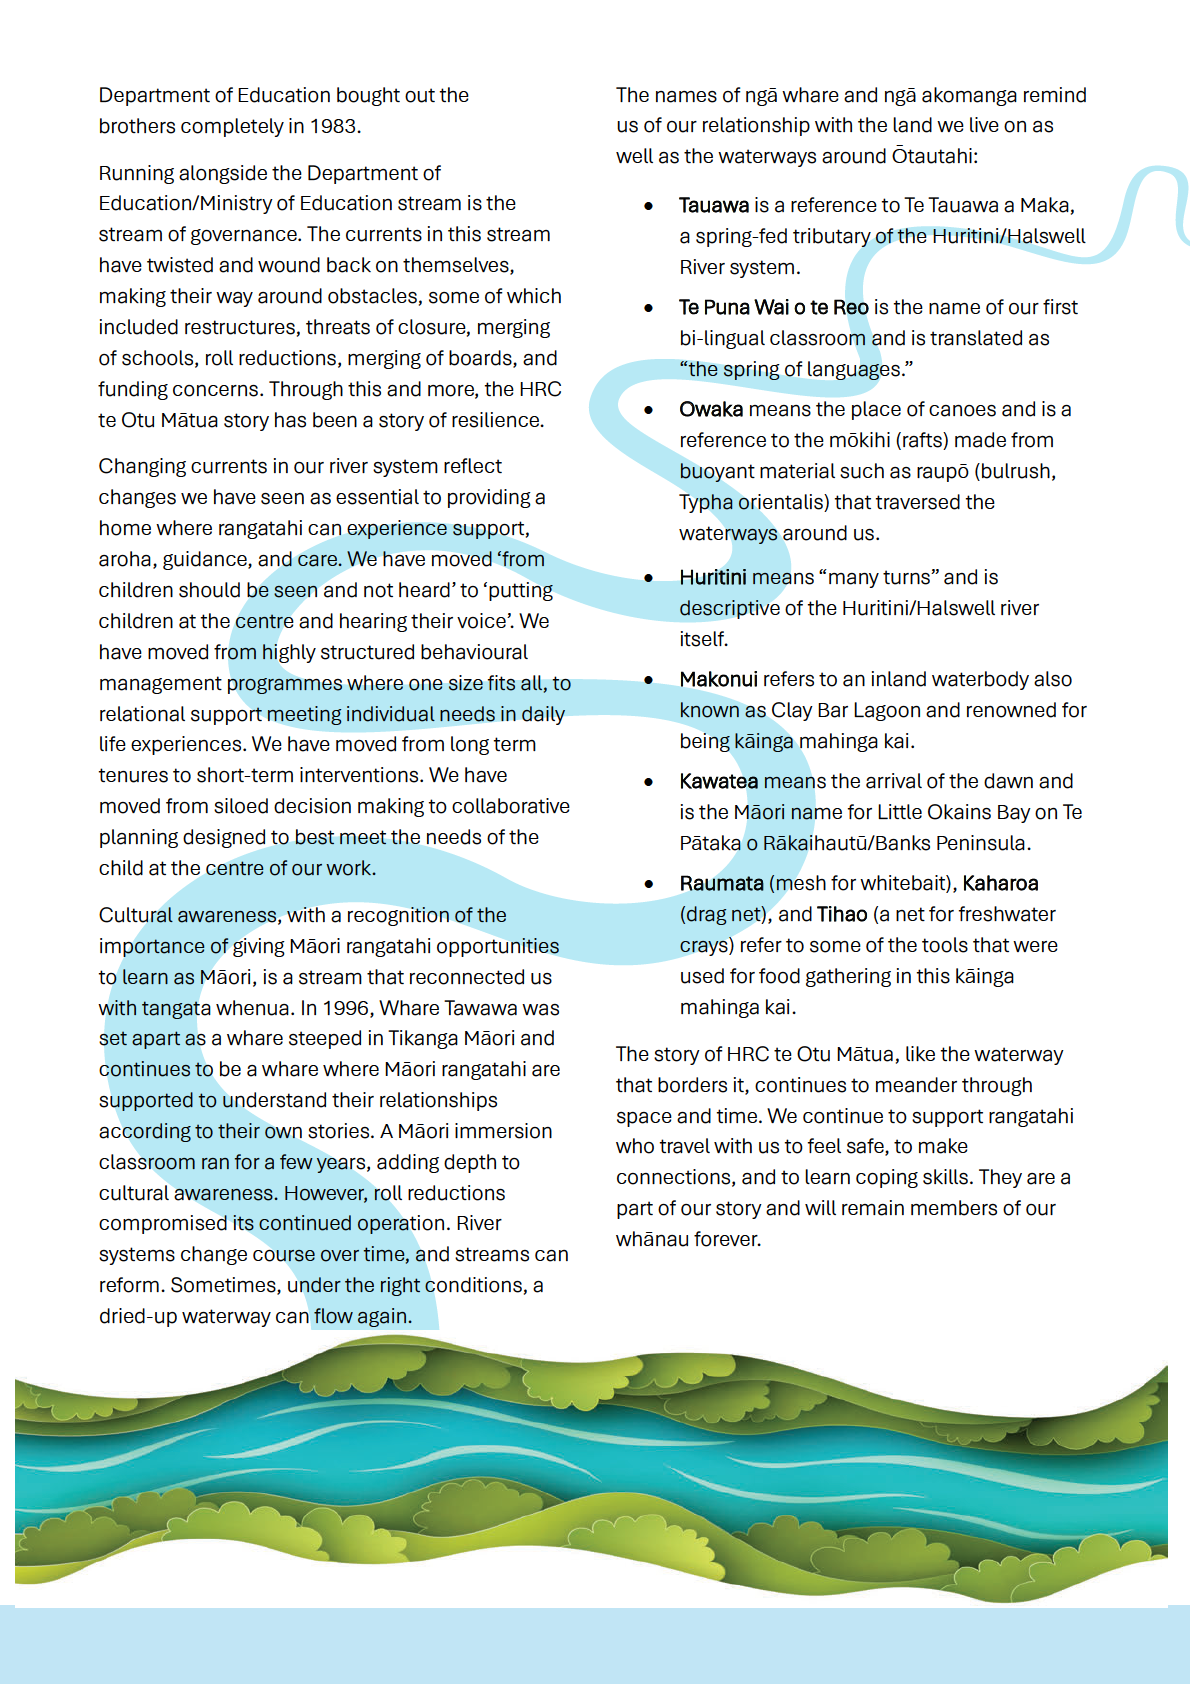
• Geographical Breakdown of Residential Akonga
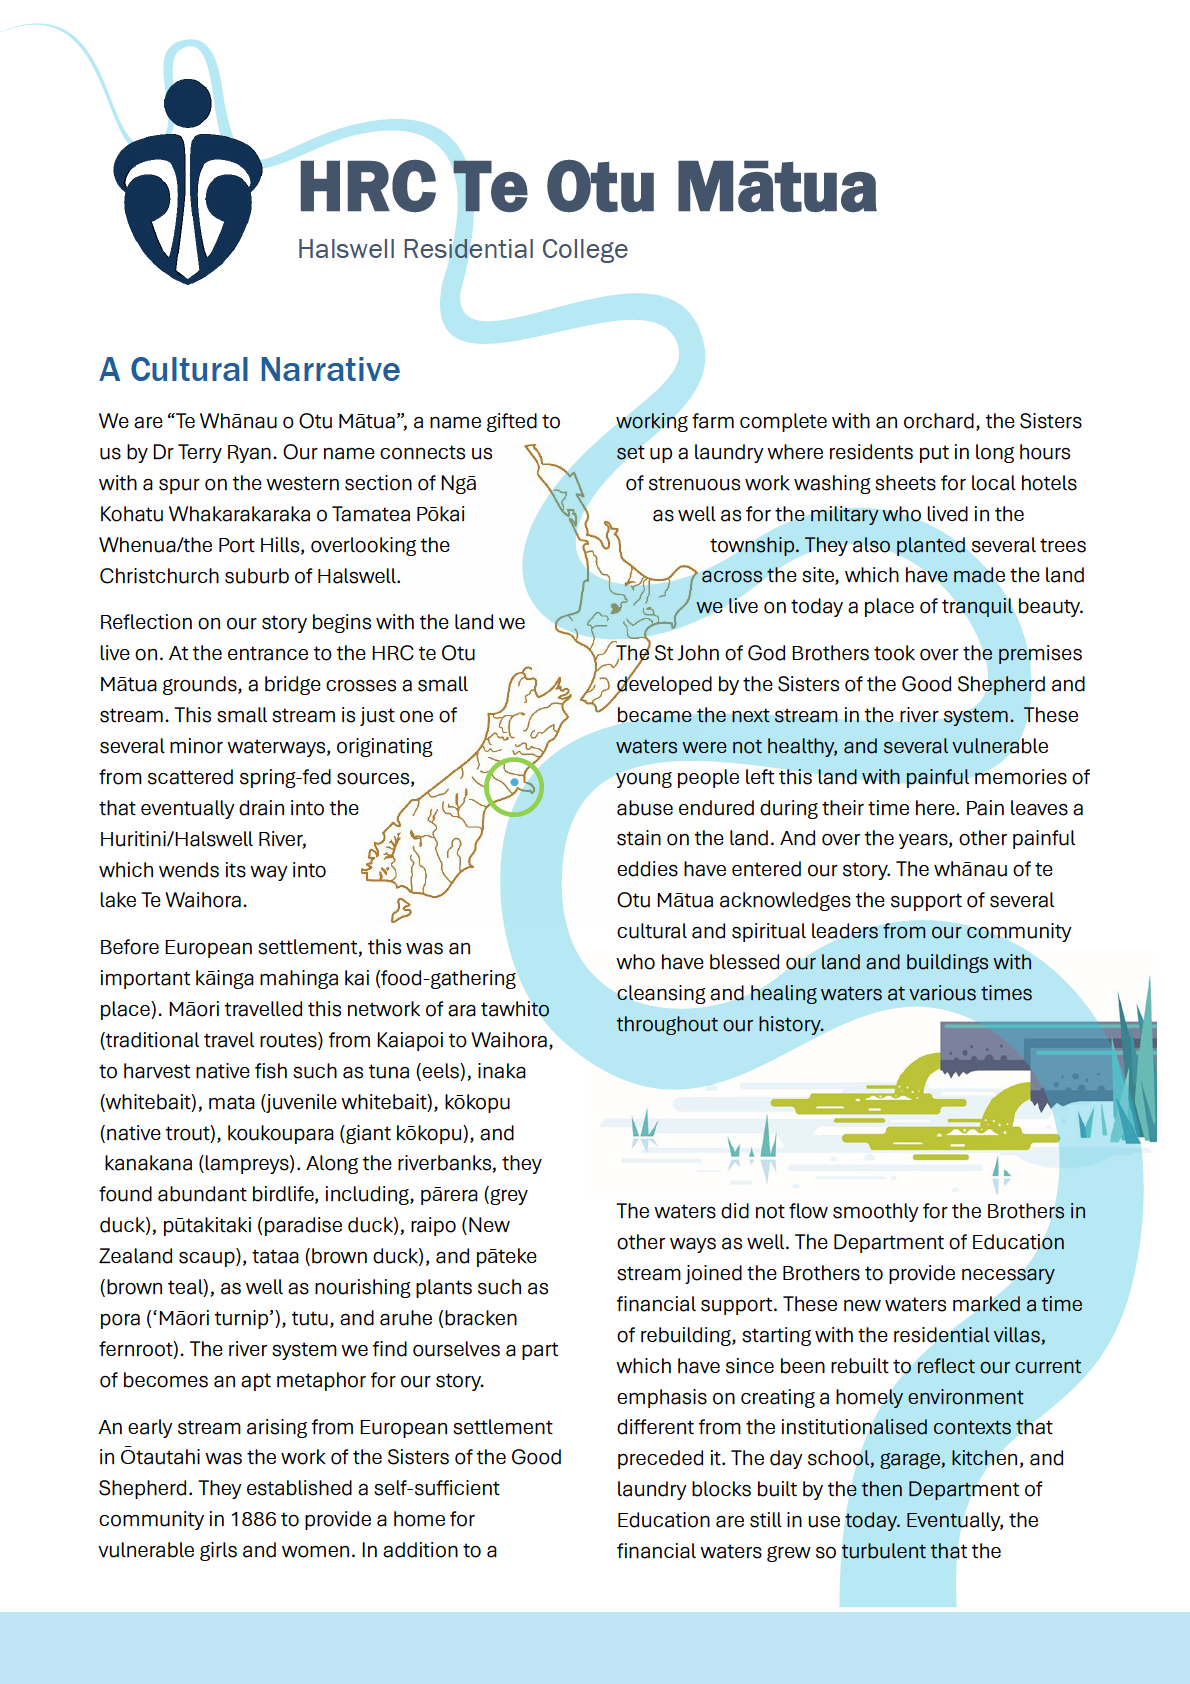
• HRC Te Otu Mātua: A Cultural Narrative
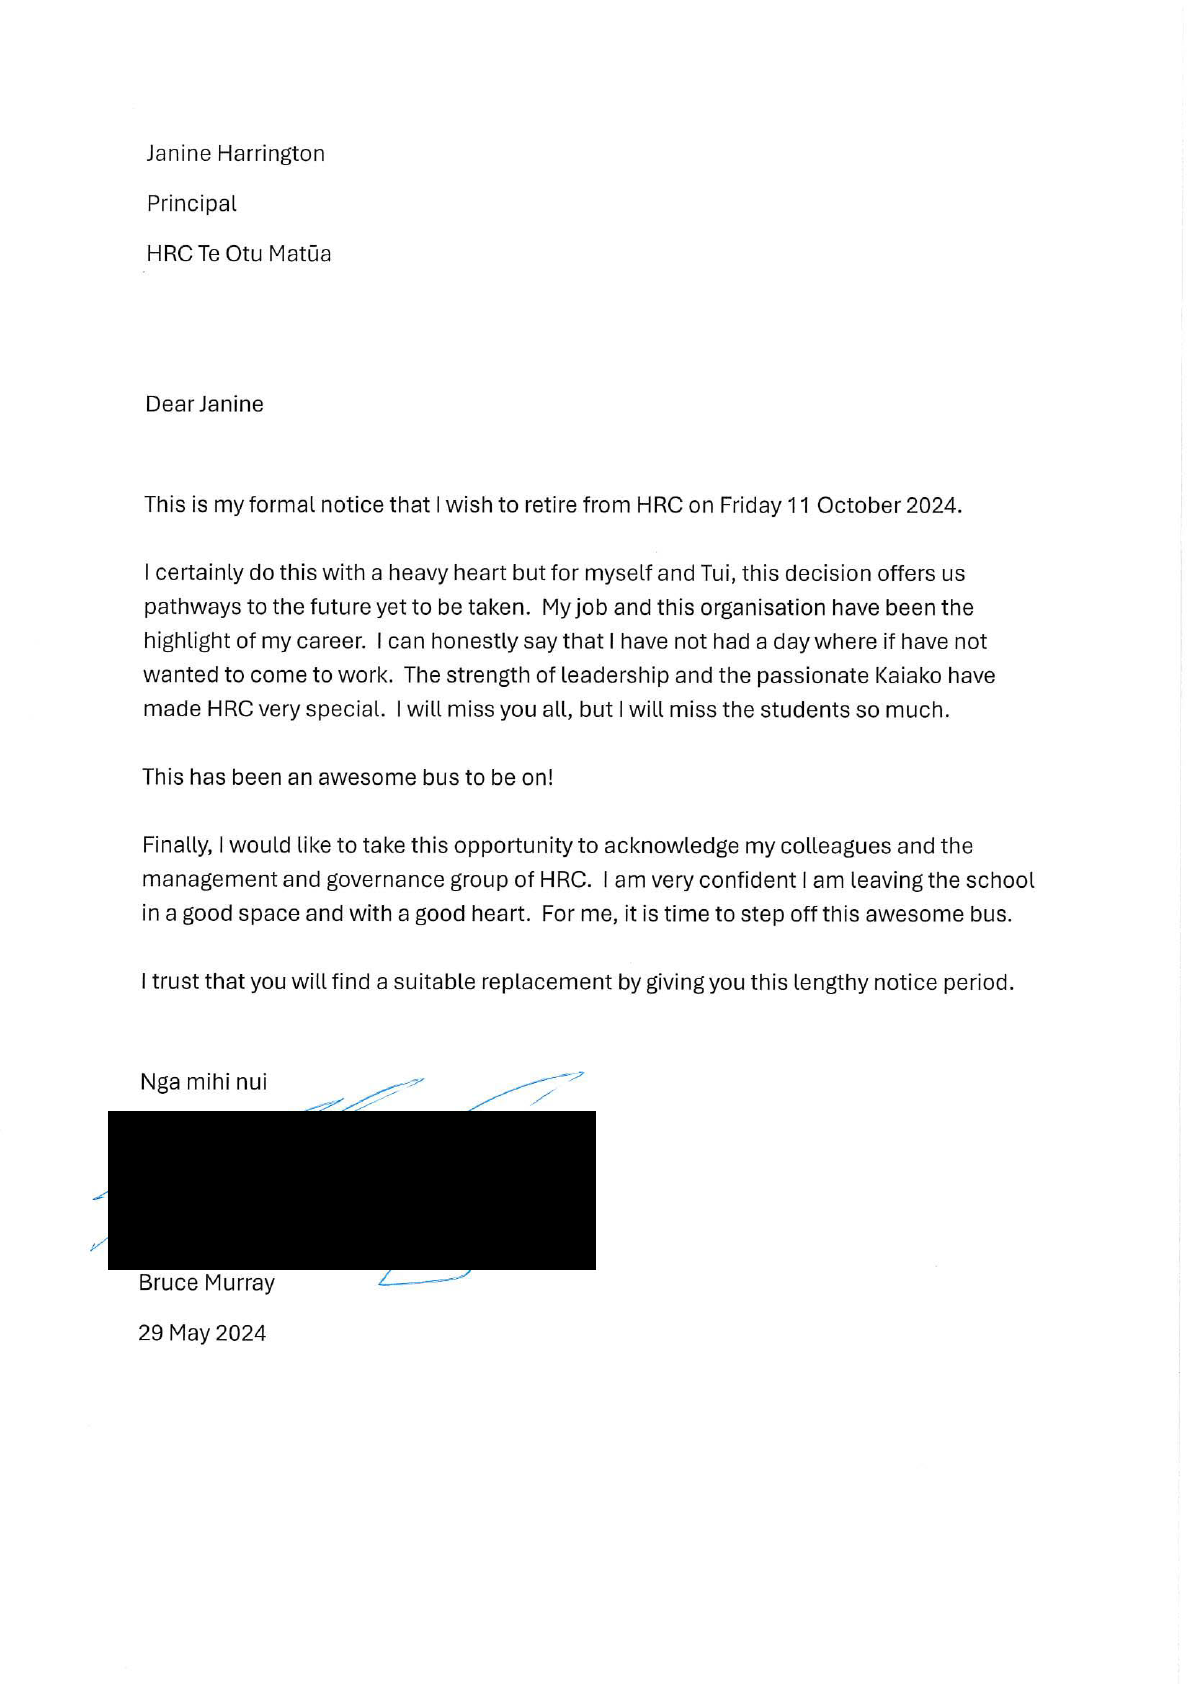
• Correspondence: Notice of retirement
• Financials
Mā te huruhuru ka rere te manu
Adorn the bird with feathers so that it may soar.
2
Noho Marae
As part of our strategic goal to work closely with tangata whenua, a group of ākonga and kaiako are planning a trip to the
Taumutu Marae in June, with some of the group to stay two nights. While at the marae, ākonga wil learn:
1.
Cultural Immersion: Ākonga wil be immersed in Māori culture, traditions, and language, helping them develop a
deeper understanding and appreciation of the culture.
2.
Respect and Protocol: Ākonga wil learn the importance of respect, tikanga, and the significance of various
ceremonies, such as the pōwhiri.
3.
Community and Whanaungatanga: Living in a communal setting wil foster a sense of whanaungatanga. Ākonga
wil learn to work together, support each other, and build strong relationships.
4.
History and Storytelling: Ākonga wil have the opportunity to learn about local iwi, their ancestors, and historical
events through storytel ing and interaction with kaumātua.
5.
Language Learning: Being on a marae wil involve the use of te reo Māori, allowing ākonga to practice and
improve their language skil s in an immersive environment.
6.
Respect for the Environment: Ākonga wil learn about the importance of caring for the whenua and natural
resources, as Māori culture places a strong emphasis on the environment and sustainability. Activities they
undertake wil include going eeling. floundering, removing weed from the stream and undertaking plantings.
7.
Rituals and Ceremonies: Participating in traditional rituals and ceremonies wil help ākonga understand their
meanings and significance, fostering a deeper connection to the culture.
8.
Holistic Learning: The experience on a marae wil be holistic, integrating physical, emotional, and spiritual
aspects of learning, which can be beneficial for personal growth and wel being.
These experiences wil contribute to a rich, transformative learning journey for ākonga, extending beyond the traditional
classroom setting.
Professional Development Science of Learning Delivered by MoE
MoE Curriculum Lead, Melaine Crase, recently delivered PD of teachings on the science of learning. The Science of
Learning and Development attempts to synthesise a huge body of knowledge accumulated over many years from the
learning sciences, psychology, anthropology, and brain science.
A core principle is the unique ability of the brain to change in response to relationships and experience. It is relationships
and experiences that drive the development of the brain. If children have experienced adversity, they wil have an uneven
development of foundational skil s, like self-regulation and relationship skil s that are prerequisites for more complex
skil s like perseverance and self-direction. These are the children who are at risk of fal ing further and further behind. But
what’s most interesting is that a child can become a productive and engaged learner from any developmental starting
point if we intentionally build those skil s. Working relational y and giving opportunities for multiple experiences affirms
the therapeutic milieu we create at HRC using DLE, Three Pil ars, etc.
Understanding the cognitive processes that occur as learners move from being novices to being experts is another core
principle that necessarily impacts pedagogy and curriculum. The team was reminded that relationships without effective
pedagogy are not enough, and looked at nine teaching strategies that are essential to the concept of ‘teaching to the
north east’ (Dr Russel Bishop, high relationships/high teaching skil s).
5
Type of restraint - Term 2 2024
3
2
1
0
Redirection
Seated/kneeling
Standing
Side floor assist
Supine floor
assist
assist/seated
assist
biceps assist
Rationale of restraint - Term 2 2024
4
3
2
1
0
Physical
Physical
Physical
Physical
Physical
Physical
Other
towards
towards
towards
towards
towards
towards
student -
student - student and student and kaiako -
kaiako -
actual
threatened
kaiako -
kaiako -
actual
threatened
actual
threatened
7. Stand Downs and Suspensions
There have been no stand-downs or suspensions during this period.
11
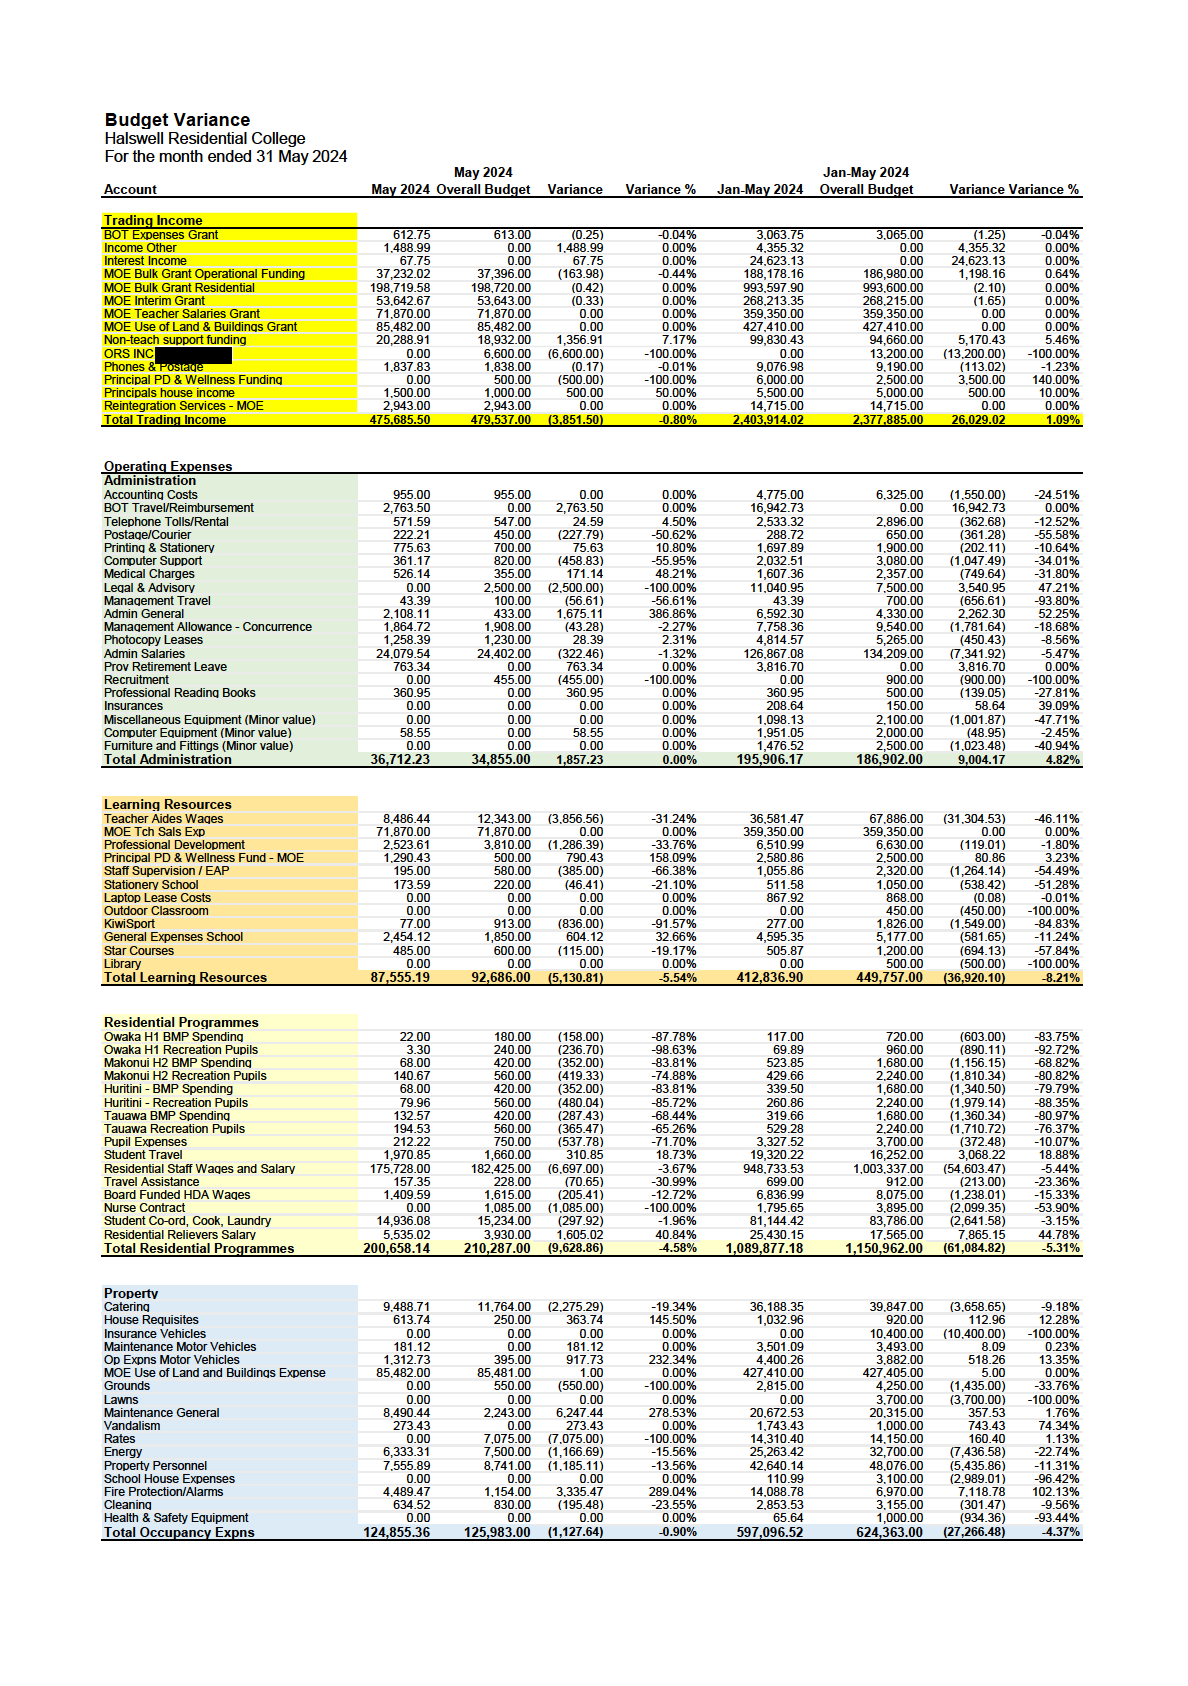
8. Financials as on May 31, 2024
The college bank balances on May 31, 2024, were:
Savings on cal $28,489.85
Education Admin $702,724.71
Term Deposit 72 $500,000.00
Term Deposit 73 $700,000.00
The figures in this report are very raw and wil be subject to change fol owing advice from our accountants and the
Auditor.
Revenue (Income)
Actual YTD $2,403,914 vs. Budget $2,377,885
The ledgers reflect operational funding drops, money received for government grants, and board investments. The
income is slightly ahead of budget with interest received from investments and small adjustments in MoE grants.
Expenditure
Variances: Actual vs. Budget
Administration: Actual YTD $195,906 vs. Budget $186,902. Over budget by 4.82%.
Expenditure is ahead of budget by $9,004. The two ledgers responsible are board expenses and legal costs. It is hoped
that these areas wil return to budget when Westbridge Residential School is invoiced for their share of the costs and an
invoice is raised with the Ministry of Education for legal costs not covered by insurance.
Learning & Curriculum Resources: Actual YTD $412,837 vs. Budget $449,757. Under budget by 8.21%.
Expenditure is under budget, which reflects the high number of sick days of teaching assistant staff which house staff
have been used to backfil . Al other ledgers for this part of the budget are showing under expenditure, reflecting the
smal er-than-anticipated student numbers.
Residential Programmes: Actual YTD $1,089,877 vs. Budget $1,150,962. Under budget by 5.31%.
This area of the budget is underspent by $61,085. The salary ledger shows the greatest savings and offsets are greater
than expected expenditure in the ledgers for residential relievers and student travel ledgers. The overspending in these
ledgers reflects the high level of sick leave and the high cost of airfares. Al other ledgers show savings that reflect the
smal er than-anticipated student numbers.
Property: Actual YTD $597,096 vs. Budget $624,363. Under budget by 4.37%.
Expenditure in this area of the budget is underspent by $21,266. The main areas of underspending are maintenance,
lawns, and salary. The recent purchase of a lawn mower has stopped the need for contractors. Most other budget areas
show savings and reflect careful consideration of expenditure priorities.
Reintegration: Actual YTD $1,368 vs. Budget $11,010. Under budget by 5.05%.
This area of the budget is underspent by $9,642. It is also reflective of the smal student population.
Overall
Overal , the actual expenditure YTD is $2,366,085 and is offset by YTD income of $2,403,914, an underspend of -$37,830.
This is significantly better than the approved budget figure.
12
 9. Property and Grounds
Winter has wel and truly arrived in Christchurch. The major focus for this period has been clearing leaves (not a small
task!) and making sure gutters and down pipes are clear of obstructions.
Preventative maintenance has been undertaken on the heat pumps, and a programme of testing and tagging electrical
equipment has been finalised.
The caretaker is maintaining the compliance checks required for our Building Warrant of Fitness (BWOF) which is due in
July.
As of the end of May, HRC has no outstanding work-required notices.
13
Attachments
16
Monthly
2023 Budget v Actual Monthly Costs
Jan 2023
Jan 2023
Feb 2023
Feb 2023
Mar 2023
Mar 2023
Apr 2023
Apr 2023
May 2023
May 2023
Budget v
Jun 2023
Jun 2023
Jul 2023
Jul 2023
Aug 2023
Aug 2023
Sep 2023
Sep 2023
Oct 2023
Oct 2023
Nov 2023
Nov 2023
Dec 2023
Dec 2023
Forecast 2023
Approved
Budget
Actual
Budget
Actual
Budget
Actual
Budget
Actual
Budget
Actual
Actual
Budget
Actual
Budget
Actual
Budget
Actual
Budget
Actual
Budget
Actual
Budget
Actual
Budget
Actual
Position
2023 Budget
Revenue
Bulk Grant Operational Funding
-$37,395.59
-$37,835.16
-$37,395.59
-$37,835
-$37,396 -$ 37,
939
-$37,395.59 -$ 37,
336.34
-$37,395.59 -$ 37,
232.02
-$164
-$37,395.59
-$37,395.59
-$37,395.59
-$37,395.59
-$37,395.59
-$37,395.59
-$37,395.59
-$ 449,
947
-$448,747
Bulk Grant Residential
-$198,720 -$198,719.58
-$198,720
-$198,720
-$198,720 -$ 198,
720
-$198,720 -$ 198,
719.58
-$198,720 -$ 198,
719.58
$0
-$198,720
-$198,720
-$198,720
-$198,720
-$198,720
-$198,720
-$198,720
-$ 2,
384,635
-$2,384,635
Non-teach Support for CA funding
-$18,932
-$18,930.39
-$18,932
-$24,181
-$18,932 -$ 18,
930
-$18,932 -$ 20,
288.91
-$18,932 -$ 20,
288.91
$1,357
-$18,932
-$18,932
-$18,932
-$18,932
-$18,932
-$18,932
-$18,932
-$ 235,
145
-$227,188
Phones & Postage
-$1,838
-$1,837.83
-$1,838
-$1,838
-$1,838 -$ 1,
838
-$1,838 -$ 1,
725.66
-$1,838 -$ 1,
837.83
$0
-$1,838
-$1,838
-$1,838
-$1,838
-$1,838
-$1,838
-$1,838
-$ 21,
942
-$22,054
BOT Expenses Grant
-$613
-$612.75
-$613
-$613
-$613 -$ 613
-$613 -$ 612.
75
-$613 -$ 612.
75
$0
-$613
-$613
-$613
-$613
-$613
-$613
-$613
-$ 7,
353
-$7,353
Teacher Salaries Grant
-$71,870
-$71,870.00
-$71,870
-$71,870
-$71,870 -$ 71,
870
-$71,870 -$ 71,
870.00
-$71,870 -$ 71,
870.00
$1
-$71,870
-$71,870
-$71,870
-$71,870
-$71,870
-$71,870
-$71,870
-$ 862,
437
-$862,434
Use of Land & Buildings Grant
-$85,482
-$85,482.00
-$85,482
-$85,482
-$85,482 -$ 85,
482
-$85,482 -$ 85,
482.00
-$85,482 -$ 85,
482.00
$0
-$85,482
-$85,482
-$85,482
-$85,482
-$85,482
-$85,482
-$85,482
-$ 1,
025,781
-$1,025,779
Principal Professional Development and Wellness Fund
-$500
-$500
-$500
-$500 -$ 6,
000.00
-$500
-$500
-$500
-$500
-$500
-$500
-$500
-$500
-$500
-$ 9,
500
-$6,000
Interim Residential Grant
-$53,643
-$53,642.67
-$53,643
-$53,643
-$53,643 -$ 53,
643
-$53,643 -$ 53,
642.67
-$53,643 -$ 53,
642.67
$0
-$53,643
-$53,643
-$53,643
-$53,643
-$53,643
-$53,643
-$53,643
-$ 643,
712
-$643,712
MOE other income
$0
-
$
$0
BOT Interest
-$4,491.46
-$2,125
-$ 1,
543
-$ 16,
396.39
-$ 67.
75
$68
-$ 24,
623
$0
Reintegration Services
-$2,943
-$2,943.00
-$2,943
-$2,943
-$2,943 -$ 2,
943
-$2,943 -$ 2,
943.00
-$2,943 -$ 2,
943.00
$0
-$2,943
-$2,943
-$2,943
-$2,943
-$2,943
-$2,943
-$2,943
-$ 35,
316
-$35,316
O.R.S.Income
-$6,600
-$6,600
-$6,600
-
$
-$13,200
Principals house income
-$1,000
-$1,000.00
-$1,000
-$1,000
-$1,000 -$ 1,
000
-$1,000 -$ 1,
000.00
-$1,000 -$ 1,
500.00
$500
-$1,000
-$1,000
-$1,000
-$1,000
-$1,000
-$1,000
-$1,000
-$ 12,
500
-$12,000
Income Other
-$2,123.54
-$444
-$ 178
-$ 100.
00
-$ 1,
488.99
$1,489
-$ 4,
334
$0
Total Revenue
-$472,935 -$479,488.38
-$479,535 -$480,692.21
-$472,935 -$ 474,
698
-$472,935 -$ 496,
117.30
-$479,535 -$ 475,
685.50
-$3,849
-$472,935
$0
-$472,935
$0
-$472,935
$0
-$472,935
$0
-$472,935
$0
-$472,935
$0
-$472,935
$0.00 -$ 5,
717,225
-$5,688,417
Expenditure
Administration
ACC
ACC Levies
$0
$10,115
$ 10,
115
$10,115
Total ACC Levy
$0
$0
$0
$0
$0 $ -
$0 $ -
$0 $ -
$0
$0
$0
$0
$0
$0
$0
$10,115
$0
$0
$0
$0
$0
$0
$0 $ 10,
115
$10,115
Accounting Costs
Accounting Costs
$2,505
$955
$955
$955
$955 $ 955
$955 $ 955.
00
$955 $ 955.
00
$0
$955
$955
$955
$955
$955
$955
$955
$ 11,
460
$13,010
Total Accounting Costs
$2,505
$955
$955
$955
$955 $ 955
$955 $ 955.
00
$955 $ 955.
00
$0
$955
$0
$955
$0
$955
$0
$955
$0
$955
$0
$955
$0
$955
$0 $ 11,
460
$13,010
Audit Fees
Audit Fees
$6,785
$0
$6,875
$ 13,
660
$6,875
Total Audit Fees
$0
$0
$0
$6,785
$0 $ -
$0 $ -
$0 $ -
$0
$6,875
$0
$0
$0
$0
$0
$0
$0
$0
$0
$0
$0
$0
$0 $ 13,
660
$6,875
Board of Trustee Expenses
BOT Attendance Fees
$0
-
$
BOT Travel/Reimbursement
-$10,411
$4,530
$ 7,
426
$ 2,
222.90
$ 2,
763.50
-$2,764
$10,465
$19,535
$ 36,
532
$30,000
Total Board of Trustee Expenses
$0
-$10,411
$0
$4,530
$0 $ 7,
426
$0 $ 2,
222.90
$0 $ 2,
763.50
-$2,764
$0
$0
$0
$0
$0
$0
$0
$0
$10,465
$0
$0
$0
$19,535
$0 $ 36,
532
$30,000
Communication Costs
Telephone Tol s/Rental
$547
$470
$627
$488
$547 $ 562
$627 $ 441.
38
$547 $ 571.
59
-$24
$627
$547
$627
$547
$627
$547
$627
$ 6,
684
$7,048
Internet
$0
-
$
$0
Postage/Courier
$200
$5
$ 5
$ 56.
95
$450 $ 222.
21
$228
$450
$ 739
$1,100
Total Communication Costs
$547
$470
$827
$493
$547 $ 566
$627 $ 498.
33
$997 $ 793.
80
$204
$627
$0
$547
$0
$627
$0
$547
$0
$1,077
$0
$547
$0
$627
$0 $ 7,
423
$8,148
Comsumables Costs
Printing & Stationery
$210
$270
$457
$220 $ 256
$500 $ 209.
79
$700 $ 775.
63
-$76
$150
$285
$500
$265
$500
$220
$150
$ 3,
768
$3,970
Computer Support
$285
$559
$1,135
$509
$515 $ 441
$325 $ 360.
78
$820 $ 361.
17
$459
$905
$935
$485
$935
$785
$335
$485
$ 7,
097
$7,945
Total Consumables Costs
$495
$559
$1,405
$966
$735 $ 697
$825 $ 570.
57
$1,520 $ 1,
136.80
$383
$1,055
$0
$1,220
$0
$985
$0
$1,200
$0
$1,285
$0
$555
$0
$635
$0 $ 10,
865
$11,915
General
Medical Charges
$300
$72
$877
$509
$341 $ 373
$484 $ 199.
22
$355 $ 526.
14
-$171
$848
$719
$623
$598
$313
$300
$300
$ 5,
381
$6,058
Legal & Advisory
-$20,866
$5,000
$2,061
$ 8,
980
$2,500
$2,500
$2,500
$2,500
$2,500
$2,500
$5,000
$2,500
$ 7,
675
$25,000
Management Travel
$600
$100 $ 43.
39
$57
$600
$600
$100
$ 1,
343
$2,000
Admin General
$378
$2,840
$435
$602
$2,633 $ 729
$453 $ 313.
73
$434 $ 2,
108.11
-$1,675
$438
$438
$428
$453
$478
$453
$453
$ 9,
731
$7,469
Management Al owance
$1,908
$1,865
$1,908
$1,865
$1,908 $ 1,
865
$1,908 $ 2,
797.08
$1,908 $ 1,
864.72
$43
$1,908
$1,908
$1,908
$1,908
$1,908
$1,908
$1,908
$ 23,
613
$22,898
Total General
$2,586
-$16,090
$8,820
$5,036
$4,882 $ 11,
947
$2,845 $ 3,
310.03
$5,297 $ 4,
542.36
$754
$5,694
$0
$6,165
$0
$5,459
$0
$6,059
$0
$2,699
$0
$7,761
$0
$5,161
$0 $ 47,
742
$63,425.12
Operational Leases
Photocopy Leases
$1,170
$971
$880
$1,221
$1,030 $ 440
$955 $ 1,
455.91
$1,230 $ 1,
258.39
-$28
$450
$970
$1,540
$720
$1,600
$450
$750
$ 11,
826
$11,745
Total Operational Leases
$1,170
$971
$880
$1,221
$1,030 $ 440
$955 $ 1,
455.91
$1,230 $ 1,
258.39
-$28
$450
$0
$970
$0
$1,540
$0
$720
$0
$1,600
$0
$450
$0
$750
$0 $ 11,
826
$11,745
Monthly
2023 Budget v Actual Monthly Costs
Jan 2023
Jan 2023
Feb 2023
Feb 2023
Mar 2023
Mar 2023
Apr 2023
Apr 2023
May 2023
May 2023
Budget v
Jun 2023
Jun 2023
Jul 2023
Jul 2023
Aug 2023
Aug 2023
Sep 2023
Sep 2023
Oct 2023
Oct 2023
Nov 2023
Nov 2023
Dec 2023
Dec 2023
Forecast 2023
Approved
Budget
Actual
Budget
Actual
Budget
Actual
Budget
Actual
Budget
Actual
Actual
Budget
Actual
Budget
Actual
Budget
Actual
Budget
Actual
Budget
Actual
Budget
Actual
Budget
Actual
Position
2023 Budget
Personnel
General Services Admin Salaries
$24,402
$20,856
$24,402
$23,116
$24,402 $ 23,
985
$36,603 $ 34,
831.29
$24,402 $ 24,
079.54
$322
$24,402
$24,402
$24,402
$24,402
$36,603
$24,402
$24,402
$ 309,
882
$317,225
Prov Retirement Leave
$763
$763
$ 763
$ 763.
34
$ 763.
34
-$763
$ 3,
817
$0
Recruitment
$445
$455
$455
$455
$350
$347
$ 1,
152
$2,052
Professional Reading Books
$500
$ 360.
95
-$361
$500
$500
$ 1,
361
$1,500
Total Personnel
$24,402
$21,619
$24,402
$23,879
$25,347 $ 24,
748
$36,603 $ 35,
594.63
$24,857 $ 25,
203.83
-$347
$24,402
$0
$25,357
$0
$24,402
$0
$24,752
$0
$37,103
$0
$24,749
$0
$24,402
$0 $ 316,
211
$320,777.10
Risk Management
Insurances
$75
$ 104
$75 $ 104.
32
$0
$375
$75
$75
$ 734
$675
Total Risk Management
$75
$0
$0
$0
$0 $ 104
$75 $ 104.
32
$0 $ -
$0
$375
$0
$75
$0
$0
$0
$0
$0
$75
$0
$0
$0
$0
$0 $ 734
$675
Smal Asset Purchases
Miscellaneous Equipment
$100
$ 1,
098
$2,000
$0
$2,000
$2,000
$1,400
$2,000
$500
$ 8,
998
$10,000
Computer Equipment
$37
$1,000
$1,740
$1,000 $ 152.
90
$ 58.
55
-$59
$1,000
$2,200
$1,300
$1,500
$2,000
$500
$ 10,
488
$10,500
Furniture and Fittings
$2,500
$420
$ 1,
057
$0
$2,500
$2,500
$ 6,
477
$7,500
Total Smal Asset Purchases
$0
$37
$3,600
$2,160
$0 $ 2,
155
$3,000 $ 152.
90
$0 $ 58.
55
-$59
$5,500
$0
$2,200
$0
$3,300
$0
$1,400
$0
$6,000
$0
$2,500
$0
$500
$0 $ 25,
963
$28,000
Total Administration
$31,780
-$1,888
$40,889
$46,025
$33,496 $ 49,
039
$45,885 $ 44,
864.59
$34,856 $ 36,
712.23
-$1,856
$45,933
$0
$37,489
$0
$37,268
$0
$45,748
$0
$61,259
$0
$37,517
$0
$52,565
$0 $ 492,
532
$504,684.65
Monthly
2023 Budget v Actual Monthly Costs
Jan 2023
Jan 2023
Feb 2023
Feb 2023
Mar 2023
Mar 2023
Apr 2023
Apr 2023
May 2023
May 2023
Budget v
Jun 2023
Jun 2023
Jul 2023
Jul 2023
Aug 2023
Aug 2023
Sep 2023
Sep 2023
Oct 2023
Oct 2023
Nov 2023
Nov 2023
Dec 2023
Dec 2023
Forecast 2023
Approved
Budget
Actual
Budget
Actual
Budget
Actual
Budget
Actual
Budget
Actual
Actual
Budget
Actual
Budget
Actual
Budget
Actual
Budget
Actual
Budget
Actual
Budget
Actual
Budget
Actual
Position
2023 Budget
Learning Resources
Learning and Curriculum
Personnel
Teacher Aides
$12,343
$12,343
$10,168
$12,343 $ 12,
484
$18,515 $ 10,
692.88
$12,343 $ 8,
486.44
$3,857
$12,343
$12,343
$12,343
$12,343
$18,515
$12,343
$12,343
$ 134,
405
$160,460
MOE Funded Teacher Salaries
$71,870
$71,870
$71,870
$71,870
$71,870 $ 71,
870
$71,870 $ 71,
870.00
$71,870 $ 71,
870.00
-$1
$71,870
$71,870
$71,870
$71,870
$71,870
$71,870
$71,870
$ 862,
437
$862,434
Specialist Therapists - SLT, OT
$0
-
$
$0
Psychologist
$0
-
$
$0
Total Personnel
$84,213
$71,870
$84,213
$82,038
$84,213 $ 84,
354
$90,384 $ 82,
562.88
$84,213 $ 80,
356.44
$3,856
$84,213
$0
$84,213
$0
$84,213
$0
$84,213
$0
$90,384
$0
$84,213
$0
$84,213
$0 $ 996,
841
$1,022,894.30
Professional Development
Professional Development
$210
$2,946
$1,610
$1,000 $ 1,
041.30
$3,810 $ 2,
523.61
$1,286
$1,710
$1,080
$210
$810
$1,580
$210
$160
$ 12,
271
$12,390
Principal Professional Development and Wellness Fund
$500
$500
$1,290
$500
$500
$500 $ 1,
290.43
-$790
$500
$500
$500
$500
$500
$500
$500
$ 6,
081
$6,000
Staff Supervision / EAP
$580
$400
$580 $ 348
$580 $ 113.
04
$580 $ 195.
00
$385
$580
$580
$580
$580
$580
$580
$580
$ 5,
116
$6,380
Total Professional Development
$500
$0
$1,290
$4,637
$2,690 $ 348
$2,080 $ 1,
154.34
$4,890 $ 4,
009.04
$881
$2,790
$0
$2,160
$0
$1,290
$0
$1,890
$0
$2,660
$0
$1,290
$0
$1,240
$0 $ 23,
468
$24,770
General Expenses
Stationery School
$200
$230
$150 $ 21
$250 $ 317.
11
$220 $ 173.
59
$46
$650
$380
$350
$430
$280
$330
$200
$ 3,
132
$3,670
Laptop Lease Costs
$59
$59
$750 $ 750
$59 $ 58.
89
$0
$750
$59
$750
$59
$750
$ 3,
236
$3,236
Total General Expenses
$259
$59
$230
$0
$900 $ 771
$309 $ 376.
00
$220 $ 173.
59
$46
$1,400
$0
$439
$0
$350
$0
$1,180
$0
$339
$0
$330
$0
$950
$0 $ 6,
368
$6,906
Curriculum
Outdoor Classroom
$250
$200
$0
$100
$150
$250
$300
$ 800
$1,250
KiwiSport
$200
$913
$913 $ 77.
00
$836
$913
$913
$ 2,
103
$3,652
General Expenses School
$250
$125
$600
$405
$1,827 $ 1,
201
$650 $ 429.
48
$1,850 $ 2,
454.12
-$604
$1,300
$720
$2,000
$3,600
$1,100
$2,500
$1,136
$ 16,
971
$17,533
Star Courses
$21
$600
$600 $ 485.
00
$115
$600
$600
$200
$ 1,
906
$2,600
Library
$500
$0
$500
$500
$ 1,
000
$1,500
Total Curriculum
$250
$125
$850
$626
$3,840 $ 1,
201
$850 $ 429.
48
$3,363 $ 3,
016.12
$347
$1,900
$0
$2,233
$0
$2,150
$0
$5,113
$0
$1,350
$0
$3,200
$0
$1,436
$0 $ 22,
780
$26,535
Total Learning Resources
$85,221
$72,054
$86,583
$87,301
$91,643 $ 86,
674
$93,623 $ 84,
522.70
$92,686 $ 87,
555.19
$5,130
$90,303
$0
$89,044
$0
$88,003
$0
$92,396
$0
$94,733
$0
$89,033
$0
$87,839
$0 $ 1,
049,457
$1,081,105
Residential Programmes
Ancillary
House Requisites
$100
$160
$145
$210 $ 275
$200
$250 $ 613.
74
-$364
$250
$100
$150
$174
$106
$150
$150
$ 2,
113
$2,000
Catering
$278
$11,006
$10,295
$11,765 $ 8,
045
$5,313 $ 8,
359.56
$11,765 $ 9,
488.71
$2,276
$11,385
$5,693
$11,765
$10,247
$7,211
$11,385
$7,211
$ 101,
361
$104,742
Total Ancillary
$100
$278
$11,166
$10,439
$11,975 $ 8,
320
$5,513 $ 8,
359.56
$12,015 $ 10,
102.45
$1,912
$11,635
$0
$5,793
$0
$11,915
$0
$10,421
$0
$7,317
$0
$11,535
$0
$7,361
$0 $ 103,
474
$106,742
Vehicles
Op Expns Motor Vehicles
$400
$716
$255
$565
$2,002 $ 778
$830 $ 1,
029.21
$395 $ 1,
312.73
-$918
$1,552
$845
$610
$1,277
$1,717
$955
$600
$ 11,
956
$11,438
Maintenance Motor Vehicles
$41
$3,050
$1,836
$ 1,
233
$402 $ 251.
19
$ 181.
12
-$181
$100
$1,100
$1,580
$500
$ 6,
781
$6,773
Insurance/Accident costs
$10,400
$0
$500
$500
$ 1,
000
$11,400
Total Vehicles
$441
$716
$13,705
$2,401
$2,002 $ 2,
011
$1,232 $ 1,
280.40
$395 $ 1,
493.85
-$1,099
$2,152
$0
$845
$0
$1,710
$0
$2,857
$0
$1,717
$0
$1,955
$0
$600
$0 $ 19,
737
$29,611
Residential Costs
Owaka H1 BMP Spending
$45
$50
$180
$29
$180 $ 16
$135 $ 13.
06
$180 $ 22.
00
$158
$180
$135
$180
$180
$135
$180
$90
$ 1,
210
$1,800
Owaka H1 Recreation Pupils
$60
$240
$240 $ 54
$180
$240 $ 3.
30
$237
$240
$180
$240
$240
$180
$240
$120
$ 1,
497
$2,400
Makonui H2 BMP Spending
$105
$150
$420
$98
$420 $ 144
$315 $ 63.
50
$420 $ 68.
00
$352
$420
$315
$420
$420
$315
$420
$210
$ 3,
044
$4,200
Makonui H2 Recreation Pupils
$140
$560
$55
$560 $ 136
$420 $ 98.
24
$560 $ 140.
67
$419
$560
$420
$560
$560
$420
$560
$280
$ 3,
790
$5,600
Huritini H3 BMP Spending
$105
$100
$420
$26
$420 $ 108
$315 $ 37.
50
$420 $ 68.
00
$352
$420
$315
$420
$420
$315
$420
$210
$ 2,
860
$4,200
Huritini H3 Recreation Pupils
$140
$560
$19
$560 $ 106
$420 $ 55.
63
$560 $ 79.
96
$480
$560
$420
$560
$560
$420
$560
$280
$ 3,
621
$5,600
Tauawa H4 BMP Spending
$105
$100
$420
$46
$420 $ 22
$315 $ 19.
00
$420 $ 132.
57
$287
$420
$315
$420
$420
$315
$420
$210
$ 2,
840
$4,200
Tauawa H4 Recreation Pupils
$140
$560
$52
$560 $ 92
$420 $ 191.
04
$560 $ 194.
53
$365
$560
$420
$560
$560
$420
$560
$280
$ 3,
889
$5,600
Student Expenses
$200
$9
$1,450
$282
$750 $ 196
$550 $ 2,
628.49
$750 $ 212.
22
$538
$500
$500
$1,250
$1,250
$750
$1,250
$500
$ 9,
328
$9,700
Student Travel
$460
$1,141
$1,285
$1,401 $ 1,
889
$11,590 $ 14,
175.76
$1,660 $ 1,
970.85
-$311
$5,580
$4,860
$1,630
$12,100
$2,900
$5,088
$1,500
$ 52,
978
$49,910
Residential Wages and Salary
$182,425
$174,430
$182,425
$172,063
$182,425 $ 170,
142
$273,637 $ 256,
370.08
$182,425 $ 175,
728.00
$6,697
$182,425
$182,425
$182,425
$182,425
$273,637
$182,425
$182,425
$ 2,
316,919
$2,371,522
Travel Assistance
$228
$89
$228 $ 200
$228 $ 253.
02
$228 $ 157.
35
$71
$228
$228
$228
$228
$228
$228
$228
$ 2,
296
$2,510
Board Funded HDA
$1,615
$1,208
$1,615
$1,208
$1,615 $ 1,
199
$1,615 $ 1,
812.33
$1,615 $ 1,
409.59
$205
$1,615
$1,615
$1,615
$1,615
$1,615
$1,615
$1,610.00
$ 18,
137
$19,375
Nurse Contract
$100
$810
$1,085
$1,085 $ 974
$540 $ 821.
74
$1,085
$1,085
$1,080
$540
$1,080
$1,080
$540
$1,080
$540
$ 8,
546
$9,835
Student Co-ordinator, Cook, Laundry
$15,234
$14,133
$15,234
$14,735
$15,234 $ 14,
936
$22,851 $ 22,
404.12
$15,234 $ 14,
936.08
$298
$15,234
$15,234
$15,234
$15,234
$22,851
$15,234
$15,234
$ 195,
398
$198,040
Residential Relievers
$773
$3,810
$1,892
$3,930 $ 9,
340
$5,895 $ 7,
890.41
$3,930 $ 5,
535.02
-$1,605
$3,930
$3,930
$3,930
$3,930
$5,895
$3,930
$3,930
$ 54,
905
$47,040
Total Residential Costs
$200,873
$192,757
$210,348
$191,879
$210,028 $ 199,
553
$319,426 $ 306,
833.92
$210,287 $ 200,
658.14
$9,629
$213,952
$0
$211,852
$0
$210,752
$0
$221,222
$0
$310,936
$0
$214,210
$0
$207,647
$0 $ 2,
681,257
$2,741,532
Total Residential Programmes
$201,414
$192,757
$235,218
$204,719
$224,004 $ 209,
884
$326,171 $ 316,
473.88
$222,696 $ 212,
254.44
$10,442
$227,739
$0
$218,489
$0
$224,376
$0
$234,499
$0
$319,970
$0
$227,700
$0
$215,607
$0 $ 2,
804,468
$2,877,885
Monthly
2023 Budget v Actual Monthly Costs
Jan 2023
Jan 2023
Feb 2023
Feb 2023
Mar 2023
Mar 2023
Apr 2023
Apr 2023
May 2023
May 2023
Budget v
Jun 2023
Jun 2023
Jul 2023
Jul 2023
Aug 2023
Aug 2023
Sep 2023
Sep 2023
Oct 2023
Oct 2023
Nov 2023
Nov 2023
Dec 2023
Dec 2023
Forecast 2023
Approved
Budget
Actual
Budget
Actual
Budget
Actual
Budget
Actual
Budget
Actual
Actual
Budget
Actual
Budget
Actual
Budget
Actual
Budget
Actual
Budget
Actual
Budget
Actual
Budget
Actual
Position
2023 Budget
Property
Occupancy Costs
Use of Land and Buildings
$85,482
$85,482
$85,482
$85,482
$85,482 $ 85,
482
$85,482 $ 85,
482.00
$85,482 $ 85,
482.00
-$0
$85,482
$85,482
$85,482
$85,482
$85,482
$85,482
$85,482
$ 1,
025,781
$1,025,779
Grounds
$550
$1,350
$550
$1,250 $ 2,
815.00
$550
$550
$1,150
$550
$550
$1,150
$550
$1,250
$550
$ 8,
565
$10,000
Lawns
$1,850
$1,847
$1,850
$0
$ 1,
847
$3,700
Maintenance General
$4,443
$1,251
$8,243
$4,667
$2,543 $ 4,
216
$2,843 $ 3,
145.87
$2,243 $ 8,
490.44
-$6,247
$2,743
$1,943
$5,843
$2,843
$3,743
$3,493
$4,243
$ 46,
621
$45,166
Maintenance Furniture and Fittings
$0
-
$
$0
Vandalism
$500
$1,285
$ 185
$500
$ 273.
43
-$273
$500
$500
$500
$500
$ 3,
743
$3,000
Rates
$7,075
$7,155
$ 7,
155.21
$7,075
$7,075
$8,141
$8,141
$ 30,
592
$30,432
Energy
$5,800
$4,404
$5,200
$2,796
$6,200 $ 5,
458
$8,000 $ 6,
272.77
$7,500 $ 6,
333.31
$1,167
$11,000
$12,000
$12,500
$12,500
$8,200
$7,500
$5,800
$ 94,
763
$102,200
Caretakers Salaries
$8,741
$7,358
$8,741
$8,764
$8,741 $ 6,
599
$13,112 $ 12,
362.58
$8,741 $ 7,
555.89
$1,186
$8,741
$8,741
$8,741
$8,741
$13,112
$8,741
$8,741
$ 108,
201
$113,639
School House Expenses
$2,600
$ 111
$500
$0
$500
$500
$ 1,
111
$4,100
Fire Protection/Alarms
$854
$55
$2,154
$3,831
$554 $ 1,
934
$2,254 $ 4,
786.84
$1,154 $ 4,
489.47
-$3,335
$454
$2,554
$1,054
$554
$654
$2,454
$454
$ 23,
275
$15,148
Cleaning
$725
$165
$440
$1,207
$785 $ 465
$375 $ 382.
06
$830 $ 634.
52
$195
$800
$1,015
$575
$885
$625
$1,015
$450
$ 8,
219
$8,520
Health & Safety Equipment
$500
-$203
$ 61
$500 $ 207.
50
$0
$500
$500
$500
$ 1,
566
$2,500
Total Occupancy Costs
$108,445
$100,563
$124,135
$114,984
$104,855 $ 104,
510
$114,816 $ 122,
609.83
$113,575 $ 113,
259.06
$316
$111,370
$0
$112,785
$0
$123,386
$0
$112,655
$0
$113,366
$0
$118,076
$0
$106,720
$0
$1,354,284
$1,364,184
Cyclical Maintenance & Depreciation
Asset Replacement/Depn - Prov for Depcreciation
$8,000
$8,000
$8,000
$8,000
$8,000 $ 8,
000
$8,000 $ 8,
000.00
$8,000 $ 8,
000.00
$0
$10,000
$8,000
$8,000
$8,000
$8,000
$8,000
$10,000
$ 100,
000
$100,000
Asset Replacement/Depn - Prov for Painting
$9,000
$10,000 $ 10,
000
$10,000 $ 10,
000.00
$0
$5,000
$10,000
$5,000
$ 40,
000
$49,000
Total Cyclical Maintenance & Depreciation
$8,000
$8,000
$17,000
$8,000
$18,000 $ 18,
000
$8,000 $ 8,
000.00
$18,000 $ 18,
000.00
$0
$10,000
$0
$8,000
$0
$13,000
$0
$8,000
$0
$18,000
$0
$8,000
$0
$15,000
$0 $ 140,
000
$149,000
Total Property
$30,963
$23,081
$55,653
$37,502
$37,373 $ 37,
028
$37,334 $ 45,
127.83
$46,093 $ 45,
777.06
$316
$35,888
$0
$35,303
$0
$50,904
$0
$35,173
$0
$45,884
$0
$40,594
$0
$36,238
$0 $ 468,
503
$487,405
Reintegration Services
Communication
$55
$55
$230
$55
$55
$55
$230
$55
$55
$230
$55
$55
$230
$ 910
$1,361
Travel
$770
$1,540
$770
$1,540
$1,540
$1,540
$770
$149
$1,120
$1,540
$1,540
$770
$ 7,
429
$12,049
Family Costs
$500
$500
$500
$500
$500
$500
$500
$500
$ 2,
000
$3,500
Reintegration Costs
$990
$1,230
$990 $ 10.
00
$1,230 $ 1,
357.73
-$128
$1,230
$990
$750
$1,230
$1,230
$1,230
$990
$ 9,
018
$12,090
Salary costs not picked up elsewhere
$0
-
$
$0
Total Reintegration Services
$55
$0
$2,315
$0
$3,500 $ -
$1,815 $ 10.
00
$3,325 $ 1,
357.73
$1,967
$3,500
$0
$1,815
$0
$1,454
$0
$3,080
$0
$2,825
$0
$3,325
$0
$1,990
$0 $ 19,
357
$29,000
Expenditure
$434,916
$371,486.09
$506,140
$461,029.36
$475,498 $ 468,
106
$590,310 $ 576,
481.00
$485,138 $ 469,
138.65
$15,999
$488,845
$0
$467,623
$0
$487,487
$0
$496,378
$0
$610,152
$0
$483,650
$0
$479,721
$0.00 $ 5,
860,097 $ 6,
005,858
Income
-$472,935 -$479,488.38
-$479,535 -$480,692.21
-$472,935 -$ 474,
698
-$472,935 -$ 496,
117.30
-$479,535 -$ 475,
685.50
-$3,849
-$472,935
$0
-$472,935
$0
-$472,935
$0
-$472,935
$0
-$472,935
$0
-$472,935
$0
-$472,935
$0.00 -$ 5,
717,225
-$5,688,417
-$38,019
-$108,002
$26,605
-$19,662.85
$2,564 -$ 6,
592
$117,375 $ 80,
363.70
$5,603 -$ 6,
546.85
$12,150
$15,910
$0
-$5,312
$0
$14,552
$0
$23,443
$0
$137,218
$0
$10,716
$0
$6,786
$0.00
$142,873
$317,441
2023 Budget v Actual Monthly Costs
Jan Budget
Jan Actual
Feb Budget
Feb Actual
Mar Budget
Mar Actual
Apr Budget
Apr Actual
May Budget
May Actual
June Budget
June Actual
July Budget
July Actual
Aug Budget
Aug Actual
Sept Budget
Sep Actual
Oct Budget
Oct Actual
Nov Budget
Nov Actual
Dec Budget
Dec Actual
Forecast Position
Budget
Administration
$31,780
-$1,888
$40,889
$46,025
$33,496
$49,039
$45,885
$44,865
$34,856
$36,712
$45,933
$0
$37,489
$0
$37,268
$0
$45,748
$0
$61,259
$0
$37,517
$0
$52,565
$0
$492,532
$504,685
Learning and Curriculum
$85,221
$72,054
$86,583
$86,010
$91,643
$86,674
$93,623
$84,523
$92,686
$14,395
$90,303
$0
$89,044
$0
$88,003
$0
$92,396
$0
$94,733
$0
$89,033
$0
$87,839
$0
$975,006
$1,081,105
Residential Programmes
$201,414
$192,757
$235,218
$204,719
$224,004
$209,884
$326,171
$316,474
$222,696
$212,254
$227,739
$0
$218,489
$0
$224,376
$0
$234,499
$0
$319,970
$0
$227,700
$0
$215,607
$0
$2,804,468
$2,877,885
Property
$30,963
$23,081
$141,135
$122,984
$122,855
$122,510
$122,816
$130,610
$131,575
$131,259
$121,370
$0
$120,785
$0
$136,386
$0
$120,655
$0
$131,366
$0
$126,076
$0
$121,720
$0
$1,408,802
$1,427,702
Reintegration Services
$55
$0
$2,315
$0
$3,500
$0
$1,815
$10
$3,325
$1,358
$3,500
$0
$1,815
$0
$1,454
$0
$3,080
$0
$2,825
$0
$3,325
$0
$1,990
$0
$19,357
$29,000
Total
$349,434
$286,004
$506,140
$459,739
$475,498
$468,106
$590,310
$576,481
$485,138
$395,978
$488,845
$0
$467,623
$0
$487,487
$0
$496,378
$0
$610,152
$0
$483,650
$0
$479,721
$0
$5,700,165
$5,920,377
Month
Budget
Actual
Break Even
January
$349,434
$286,004
$472,935
February
$855,574
$745,743
$952,470
March
$1,331,073
$1,213,849
$1,425,405
April
$1,921,382
$1,790,330
$1,898,340
May
$2,406,520
$2,186,308
$2,377,875
June
$2,895,365
$2,850,810
July
$3,362,988
$3,323,745
August
$3,850,475
$3,796,680
September
$4,346,853
$4,269,615
October
$4,957,005
$4,742,550
November
$5,440,655
$5,215,485
December
$5,920,377
$5,688,420
YEAR TO DATE EXPENDITURE 2023 - BUDGET v ACTUAL
$7,000,000
$6,000,000
$5,000,000
$4,000,000
E
TITLS
AXI
$3,000,000
$2,000,000
$1,000,000
$0
January
February
March
April
May
June
July
August
September
October
November
December
Budget
$349,434
$855,574
$1,331,073
$1,921,382
$2,406,520
$2,895,365
$3,362,988
$3,850,475
$4,346,853
$4,957,005
$5,440,655
$5,920,377
Actual
$286,004
$745,743
$1,213,849
$1,790,330
$2,186,308
Break Even
$472,935
$952,470
$1,425,405
$1,898,340
$2,377,875
$2,850,810
$3,323,745
$3,796,680
$4,269,615
$4,742,550
$5,215,485
$5,688,420
Depreciation
Depreciation Expense
8,000.00
8,000.00
0.00
0.00%
40,000.00
40,000.00
0.00
0.00%
Provision for Painting
10,000.00
10,000.00
0.00
0.00%
29,000.00
29,000.00
0.00
0.00%
Total Cyclical Maintenance & Depreciatio 18,000.00
18,000.00
0.00
0.00%
69,000.00
69,000.00
0.00
0.00%
Total Property
142,855.36
143,983.00 (1,127.64)
-0.78%
666,096.52
693,363.00
(27,266.48)
-3.93%
Reintegration Services
Transition Communication
0.00
55.00
(55.00)
-100.00%
0.00
450.00
(450.00)
-100.00%
Transition Family Costs
0.00
500.00
(500.00)
-100.00%
0.00
1,500.00
(1,500.00)
-100.00%
Transition reintegration costs
1,357.73
1,230.00
127.73
10.38%
1,367.73
4,440.00
(3,072.27)
-69.20%
Transition Travel
0.00
1,540.00
(1,540.00)
-100.00%
0.00
4,620.00
(4,620.00)
-100.00%
Total Reintegration Services
1,357.73
3,325.00 (1,967.27)
-59.17%
1,367.73
11,010.00
(9,642.27)
-87.58%
Total Operating Expenses
469,138.65
485,136.00 (15,997.35)
-3.30%
2,366,084.50
2,491,994.00 (125,909.50)
-5.05%
Net Profit
6,546.85
(5,599.00)
12,145.85
216.93%
37,829.52
(114,109.00)
151,938.52
133.15%