
Review of the effectiveness
of the waste disposal levy
Disclaimer
The information in this publication is, according to the Ministry for the Environment’s best
efforts, accurate at the time of publication. The Ministry will make every reasonable effort to
keep it current and accurate. However, users of this publication are advised that:
•
the information does not alter the laws of New Zealand, other official guidelines, or
requirements
•
it does not constitute legal advice, and users should take specific advice from qualified
professionals before taking any action based on information in this publication
•
the Ministry does not accept any responsibility or liability whatsoever whether in contract,
tort, equity, or otherwise for any action taken as a result of reading, or reliance placed on
this publication because of having read any part, or all, of the information in this
publication or for any error, or inadequacy, deficiency, flaw in, or omission from the
information in this publication
•
all references to websites, organisations or people not within the Ministry are for
convenience only and should not be taken as endorsement of those websites or
information contained in those websites nor of organisations or people referred to.
This document may be cited as: Ministry for the Environment. 2024.
Review of the
effectiveness of the waste disposal levy. Wellington: Ministry for the Environment.
Published in x 2024 by the
Ministry for the Environment
Manatū mō te Taiao
PO Box 10362, Wellington 6143, New Zealand
environment.govt.nz
ISBN: ISBN online version (online)
Publication number: ME xxxx
© Crown copyright New Zealand 2024
link to page 6 link to page 6 link to page 7 link to page 7 link to page 8 link to page 10 link to page 14 link to page 15 link to page 17 link to page 23 link to page 29 link to page 29 link to page 29 link to page 37 link to page 37 link to page 38
Contents
Executive summary and recommendations
4
Recommendations
4
Background
5
The waste disposal levy is a tool to minimise waste
5
Key improvements to the levy were made in 2020
6
The Ministry has improved how it collects, administers and invests the levy
8
Findings
12
Trends in waste disposal
13
Trends in reuse, recycling and recovery
15
Achieving waste minimisation through investment of the levy
21
Discussion
27
Domestic policies can support waste reduction and recycling – but it remains
strongly influenced by global conditions
27
Conclusions and recommendations
35
Recommendations
35
References
36
Review of the effectiveness of the waste disposal levy
1
link to page 8 link to page 10 link to page 11 link to page 11 link to page 15 link to page 15 link to page 15 link to page 15 link to page 18 link to page 18 link to page 20 link to page 20 link to page 20 link to page 21 link to page 21 link to page 24 link to page 24 link to page 25 link to page 25 link to page 28 link to page 30 link to page 30 link to page 33 link to page 33
Tables
Table 1:
Levy rates and coverage
6
Table 2:
Levy funds administered by the Ministry for the Environment
8
Table 3:
Changes to how the Ministry for the Environment administers waste
minimisation funds
9
Table 4:
Total gross, diverted and net tonnages of waste at levied waste disposal
facilities (class 1 facilities) for the 2020 and 2023 review periods
13
Table 5:
Net kilograms of waste per capita disposed of at municipal landfills (class 1)
for the 2020 and 2023 review periods
13
Table 6:
Annual tonnage of recycled commodities for Aotearoa New Zealand, from
2018 and 2021 reports
16
Table 7:
Reported quantities of waste material received by transfer stations and the
activity that generated the waste (where stated) (for the 2022 calendar
year)
18
Table 8:
Reported quantities sent by transfer stations to recycling or disposal
(tonnes) (where specified) (for the 2022 calendar year
19
Table 9:
Summary of WMF and PIF funding (2020 to 2022)
22
Table 10: Spread of investments by funding amount (PIF and WMF, 2020 to 2022)
22
Table 11: Examples of how funded projects have supported strategic priorities and
work programmes
23
Table 12: Reported spending areas for territorial authorities’ share of levy funds
26
Table 13: Factors influencing Aotearoa New Zealand recycling between 2020 and
2023
28
Table 14: Status of topics identified in previous levy reviews and Cabinet decisions
related to the waste disposal levy
31
2
Review of the effectiveness of the waste disposal levy
link to page 16 link to page 19 link to page 19
Figures
Figure 1:
Expansion of the waste disposal levy and associated reporting requirements
from 2017 to 2022 and the number of classes per region (as at December
2022)
12
Figure 2:
Total tonnage of waste disposed of at levied landfills (2009/10 to 2022/23)
14
Figure 3:
Estimated tonnes of material recovered and disposed of in Aotearoa in
2020
17
Review of the effectiveness of the waste disposal levy
3
Executive summary and
recommendations
This review was carried out to meet the obligation in the Waste Minimisation Act 2008 (WMA)
for the Minister to review the effectiveness of the waste disposal levy (levy) every three years.
The levy is established under the WMA. It is a tool to reduce waste being disposed of in
landfills, and to encourage alternative approaches to producing, using and managing products
and materials at their end of life.
This review covers the period of the 2019/20 financial year to the 2021/22 financial year (ie,
1 July 2019 to 30 June 2022). In reviewing the levy, the Minister must consider whether the
amount of waste disposed of in Aotearoa New Zealand has decreased and whether the
amount of waste reused, recycled or recovered in Aotearoa has increased since the last
review.
A levy has been in place at municipal landfills (those that accept waste from households) since
2009. In 2020, a range of improvements to the effectiveness of the levy were made, drawing
on the results of previous reviews of the levy. These changes include expanding the coverage
and increasing the rate of the levy, as well as introducing associated reporting requirements.
Implementation of these changes was not complete by the end of this review period (the final
increases to the levy for municipal and construction and demolition landfills will take effect
from 1 July 2024). However, this review draws some preliminary conclusions and offers further
recommendations.
Available data show a slight decrease (2.25 per cent) in quantities of waste disposed of in
municipal (class 1) landfills since the last review period. Available data also show a possible
increase in material reused, recycled or recovered over the period, although data limitations
do not allow for a comprehensive analysis.
This report also considers changes made to Ministry for the Environment systems and
processes for investment of the levy and for compliance, monitoring and enforcement
associated with collecting and administering the levy.
Recommendations
In order to support continued effective management of the levy, the recommendations are as
follows.
•
Continue ongoing efforts to ensure strategic investment of levy revenue by both central
and local government.
•
Ensure waste legislation better supports administration, collection and investment of the
levy.
•
Clarify the intended scope of the levy and reporting obligations (through regulatory
change proposals, or as part of the legislative change process in the previous
recommendation).
•
Consider options for better understanding and management of rural wastes.
4
Review of the effectiveness of the waste disposal levy
link to page 15 link to page 17 link to page 23 link to page 23 link to page 29
Background
The waste disposal levy is a tool to minimise
waste
The waste disposal levy (levy) is established under the Waste Minimisation Act 2008 (WMA). It
is a tool to reduce waste being disposed of in landfills, and to encourage alternative
approaches to producing, using and managing products and materials at their end of life.
A levy has been in place at municipal landfills (those that accept waste from households) since
2009. More recently, levies have also been established for other landfill types.
Half the levy money goes to territorial authorities (city and district councils) to spend on
promoting or achieving the waste minimisation activities set out in their waste management
and minimisation plans. The remaining levy money (minus administration costs) is invested in
projects to promote or achieve waste minimisation. These projects are generally funded
through the Waste Minimisation Fund (WMF) and the Plastics Innovation Fund (PIF).
The Minister is required to assess the effectiveness of the levy every three years. This review
covers the period of the 2019/20 financial year to the 2021/22 financial year (ie, 1 July 2019 to
30 June 2022). In reviewing the levy, the Minister must consider:
•
whether the amount of waste disposed of in Aotearoa New Zealand has decreased since
the last review (se
e Trends in waste disposal section)
•
whether the amount of waste reused, recycled or recovered in Aotearoa has increased
since the last review (se
e Trends in reuse, recycling and recovery section).
The Minister may also consider any other matters they think relevant (see
Achieving waste
minimisation through investment of the levy and
Discussion sections).
Information sources include the Online Waste Levy System (OWLS), which includes tonnage
reporting and other information from landfills and other sites; published reports; and internal
information, such as investment information.
[In preparing this review, the Minister has also obtained and considered the advice of the
Waste Advisory Board, as required under the WMA.]
Review of the effectiveness of the waste disposal levy
5
link to page 8
Reuse, recycling and recovery
The WMA defines these terms as follows:
Reuse means the further use of waste or diverted material in its existing form for the original
purpose of the materials or products that constitute the waste or diverted material, or for a
similar purpose.
Recycling means the reprocessing of waste or diverted material to produce new materials.
Recovery means extraction of materials or energy from waste or diverted material for further
use or processing, and includes making waste or diverted material into compost.
Key changes to the levy were made in 2020
Following a preliminary review of the effectiveness of the levy in 2019 (Ministry for the
Environment, 2019), a range of changes were made to improve its effectiveness in 2020,
including:
•
progressively increasing the levy rate for municipal landfills from $10 per tonne to $60 per
tonne (as of 1 July 2024)
•
expanding the levy to cover additional landfill types, including construction and demolition
fills
•
collecting data from a wider range of waste sites, including cleanfills and transfer stations
•
investing the additional revenue from the levy in initiatives that support waste reduction.
These changes are summarised in
table 1. Additional information on facility types is outlined in
the subsequent text boxes.
Table 1:
Levy rates and coverage
Date levy applies from
Landfill class
1 July 2009
1 July 2021
1 July 2022
1 July 2023
1 July 2024
Municipal landfill
$10
$20
$30
$50
$60
(class 1)
Construction and
-
-
$20
$20
$30
demolition fill
(class 2)
Managed or
-
-
-
$10
$10
controlled fill facility
(class 3 and 4)
6
Review of the effectiveness of the waste disposal levy
Types of landfill subject to the waste disposal levy
Municipal disposal facility (class 1) means a facility, including a landfill, that accepts for disposal
waste that is or includes household, commercial, industrial or institutional waste, green waste,
or waste that is not accepted at other classes of facilities.
Construction and demolition fill disposal facility (class 2) means a facility, including a landfill,
that accepts waste that is or includes solid waste from construction and demolition activity.
This could include materials such as wood products, asphalt, plasterboard, insulation, and other
construction and demolition materials.
Managed or controlled fill disposal facility (class 3 or 4) means a facility that accepts any one or
more of the following for disposal:
•
inert waste material from construction and demolition activities
•
inert waste material from earthworks or site remediation.
Other facilities (not subject to waste disposal levy)
These facilities are subject to record-keeping and reporting obligations but do not have to pay a
levy. This provides the Ministry for the Environment with further information about waste
quantities and movements.
Cleanfill facility (class 5) means a facility that accepts for disposal only virgin excavated natural
material.
Cleanfill material is material that, when buried, will have no adverse effect on people
or the environment. It includes virgin natural materials such as clay, soil and rock, and other inert
materials such as concrete or brick that are free of:
•
combustible, putrescible, degradable or leachable components
•
hazardous substances
•
products or materials derived from hazardous waste treatment, hazardous waste
stabilisation or hazardous waste disposal practices
•
materials that may present a risk to human or animal health, such as medical and
veterinary waste, asbestos or radioactive substances
•
liquid waste.
Industrial monofill facility means a facility that accepts for disposal waste that discharges or
could discharge contaminants or emissions and is generated from a single industrial process (for
example, steel or aluminium making, or pulp and paper making).
Transfer stations are facilities that contain a designated receiving area where waste is received,
and from which waste (or any material derived from that waste) is transferred to a final disposal
site or elsewhere for further processing. Transfer stations do not provide long-term storage for
waste or material derived from that waste.
Further changes to record-keeping and reporting regulations were made in September 2023 to
support these improvements, including requirements for:
•
territorial authorities to report annually on what they spent their levy funds on, and what
waste minimisation services, facilities and activities they have provided (from 1 July 2024)
Review of the effectiveness of the waste disposal levy
7
link to page 10
•
waste sites to report the type of activity that generated the waste they are
handling/disposing of (eg, waste from households, construction and demolition) (from
1 July 2024)
•
improvements to the conversion factors used to convert volume-based measures of waste
to tonnages (for sites that do not have access to a weighbridge).
The Ministry has improved how it collects,
administers and invests the levy
Alongside the changes to the rate and coverage of the levy, supporting changes have been
made to Ministry for the Environment (Ministry) processes for collecting and administering the
levy, and for its investment.
Investment
As noted above, some of the levy is distributed to territorial authorities to spend on waste
minimisation, and some is invested by central government for that purpose. The Ministry
currently administers two related waste minimisation funds using levy money, as outlined in
table 2.
Table 2:
Levy funds administered by the Ministry for the Environment
Fund
Purpose
Process for applications
Plastics Innovation
The PIF was launched in
The PIF has been designed to be applicant-centric
Fund (PIF)
November 2021 and supports projects
and strategically aligned. Key features of the PIF
that will minimise plastic waste and its
process are that it:
harm on the environment. It aims to
• provides applicants with interactive pre-
invest $50 million of levy revenue over
application support, including webinars, videos
four years in innovative projects to find
and one-on-one meetings to discuss potential
ways to:
projects and their alignment to PIF criteria
• use less plastic
• allows applicants to respond to feedback in
• introduce circular solutions
their final submissions
• reduce imported virgin plastics
• offers agile decision-making, aligned to clear
• improve end-user behaviour.
objectives
• provides review, assessment and moderation,
combined with access to a pool of internal and
external subject-matter experts
• runs eight-month funding rounds, each with a
specific focus
• is a contestable and competitive process.
After introduction of this approach for the PIF, a
similar approach was made standard for the WMF
as well, although the WMF operates year round.
Waste Minimisation
The WMF supports projects that
The WMF follows the same approach as the PIF,
Fund (WMF)
increase reuse, recovery, and recycling;
namely to:
decrease waste to landfill; or tackle
• shift from short funding rounds to an ‘always
single-use items or litter. The goal is to:
open’ model
•
accelerate system level change –
• focus on initiatives that make the greatest
supporting initiatives that change
impact (including increased minimum grant
sizes ($50,000 for research and development,
8
Review of the effectiveness of the waste disposal levy
link to page 11
the way we create and manage
business cases or innovation projects, and
waste
$150,000 for all other project types)
•
shift attitudes and behaviours
• clear investment signals and eligibility criteria
higher up the waste hierarchy –
so applicants know if they are likely to be
changing the behaviours of
successful.
individuals and organisations is
essential to achieve waste
minimisation goals
•
protect the environment from
harm, including greenhouse gas
emissions – to reduce emissions
from waste, without causing
environmental harm in other ways
•
increase reuse, recycling and
recovery of resources – providing
support for resource recovery
facilities and investment in capital
infrastructure, to support reuse
and recycling.
Recent improvements to how the funds are administered are outlin
ed in table 3.
Implementation of these changes started during the review period, although some are
ongoing.
Table 3:
Changes to how the Ministry for the Environment administers waste minimisation funds
Change from:
To:
Benefits
Ad hoc projects
Strategic programmes
• Stronger focus on high impact and scale and
stronger alignment to key outcomes
• Ability to strategically fund an integrated portfolio
across projects funded by the levy and the
Climate Emergency Response Fund
High ratio of small-scale
Greater focus on larger,
• Resources are focused on the biggest ‘bang for
projects
high-impact projects
buck’
• Improved efficiency
• Lower risk of under-delivery and mismanagement
of funds
Reactive application
Proactive pipeline building
• Greater ability to partner
process
• Greater ability to influence the mix of applications
Low participation of some
Wider pool of investors,
• Greater ability to leverage private sector capital,
sectors
including Māori
including Māori businesses
• Higher participation of high-impact investors
• Wider community reach
Minimal interaction with
Strong focus on pre-
• Improved stakeholder experience
applicants
application support
• Higher quality applications
Generic processes
Tailored models
• Improved stakeholder experience
• Greater ability to use mechanisms that are most
likely to result in the best outcome
Annual funding round
On-demand model
• Improved stakeholder experience
• Flexibility to adjust signals over the year
• Eliminates bottlenecks
Review of the effectiveness of the waste disposal levy
9
link to page 13
An additional change is the introduction of an online funds-management system across all
waste funds. The software is designed to streamline data collection and reporting. It allows
applicants to apply through an online portal and report directly on active projects.
A waste investment panel was established in 2022/23 to provide strategic assessment for large
applications to both the WMF and PIF and make recommendations to the Ministry (Ministry
for the Environment, 2023a). Typically, the panel considers applications requesting funding of
$1 million or more. It may also be asked to consider complex or higher-risk applications below
that threshold.
Compliance, monitoring and enforcement
The Ministry has adopted a range of policies and procedures for its role in collecting and
administering the levy, including:
•
a compliance, monitoring and enforcement strategy (Ministry for the Environment,
2021a), which sets out the Ministry’s approach to compliance monitoring and
enforcement under the WMA and explains how the Ministry achieves compliance and
interacts with regulated communities
•
an enforcement decision-making policy (Ministry for the Environment, 2021b), which sets
out the scope and procedure for making enforcement decisions under the WMA and
related regulations
•
a prosecutions policy (Ministry for the Environment, 2021c), which sets a framework for
making decisions about the use of prosecutions under the WMA.
These documents are supported by additional internal guidance, including a WMA
Investigations Manual and a WMA Communications and Engagement Strategy 2020.
The Ministry has also begun reporting annually on its compliance monitoring and enforcement
responsibilities under the WMA. Its inaugural report was published in December 2021
(Ministry for the Environment, 2021d), and a second report (covering the period 2021/2022)
was published in December 2022 (Ministry for the Environment, 2022a). Highlights of the
2021/22 report are outlined in the bo
x Case study: compliance monitoring and enforcement.
10
Review of the effectiveness of the waste disposal levy
link to page 14
Case study: Compliance monitoring and enforcement
During the 2021/22 reporting period (1 July 2021 to 30 June 2022), the Ministry conducted 51
formal audits spanning 3 distinct auditing programmes (disposal facilities, territorial
authorities, and funding recipients), responded to more than 1,000 enquiries, and launched
three new investigations across disposal facilities and territorial authorities.
Enquiries increased significantly, with the team responding to hundreds of calls and emails.
Most enquiries were from operators wanting to understand more about how the levy
expansion affected them. The sector has generally welcomed the Ministry’s refreshed
approach to compliance, and the Ministry continued building effective relationships with
operators, councils and the wider public.
Significant outcomes for the 2021/22 reporting year include:
•
expansion of the levy to more facilities, increasing the rates for facilities already paying
the levy and expanding the suite of regulatory obligations to monitor and enforce (see
figure 1 below for a map of landfill sites and other regulated parties)
•
upgrade of the OWLS to better support the administration of the waste levy
•
launch of an Alleged Breach Notification System, which makes it easier for the public to
let the Ministry know about behaviour of concern
•
release of the Territorial Authority Waste Levy Expenditure System (TAWLES) to provide a
user-friendly online portal for councils, replacing a previous manual process
•
building on a baseline of compliance data established in 2020/21, enabling the Ministry to
shift to a more intelligence-led, risk-based model, deploying available resources to areas
of greatest risk or concern
•
improvement to guidance material, building improved channels for public engagement,
and supporting new members to the regime via the waste levy expansion.
Review of the effectiveness of the waste disposal levy
11
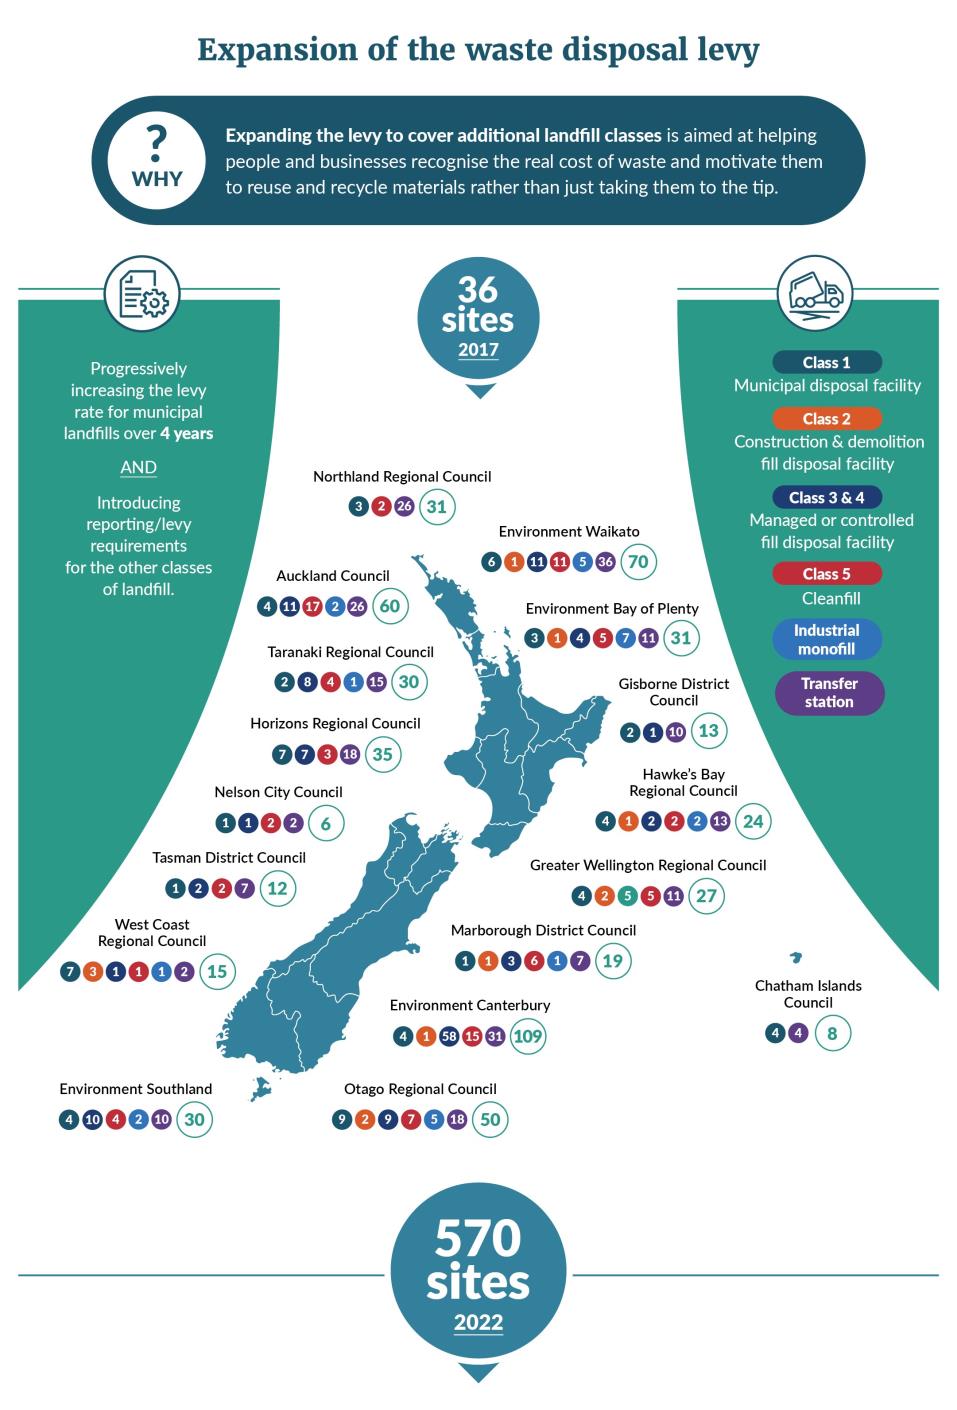 Figure 1:
Expansion of the waste disposal levy and associated reporting requirements from
Figure 1:
Expansion of the waste disposal levy and associated reporting requirements from
2017 to 2022 and the number of classes per region (as at December 2022)
Findings
The changes to the levy and associated data provisions are being progressively implemented,
which means it is difficult to ascertain their full impact in reducing waste disposal and
increasing reuse, recycling and recovery since the last review of the levy. This report will look
at the available information on trends and provide some commentary and preliminary
findings.
12
Review of the effectiveness of the waste disposal levy
link to page 15 link to page 15 link to page 16
Trends in waste disposal
There have been small reductions in both total net tonnage
(table 4) and per capita waste
disposal to class 1 facilities
(table 5) since the last review period.
Table 4:
Total gross, diverted and net tonnages of waste at levied waste disposal facilities (class 1
facilities) for the 2020 and 2023 review periods
2016/17 to 2018/19
2019/20 to 2021/22
Difference
% change
Total gross tonnage
11,439,902
11,349,537
(90,365)
(0.80%)
Total diverted
784,252
928,846
144,594
+15.57%
tonnage
Total net tonnage
10,655,650
10,420,691
-234,959
(2.25%)
Source: Reported returns from the OWLS.
Note: Years reported are financial years (ie, the period 2016/17 is from 1 July 2016 to 30 June 2017). Note that
disposal facility operators may amend their reports up to two years after submitting them, so figures may be
subject to slight change.
Table 5:
Net kilograms of waste per capita disposed of at municipal landfills (class 1) for the 2020
and 2023 review periods
By time period
Average for time period
% change
between
periods
Per capita waste
2016/17 – 731.1
730.8 kg/capita
disposal
2017/18 – 716.7
2016/17 to 2018/19
2018/19 – 744.5
-6.6%
Per capita waste
2019/20 – 664.4
682.6 kg/capita
disposal
2020/21 – 699.9
2019/20 to 2021/22
2021/22 – 683.4
Source: Reported returns from the OWLS.
Note: Years reported are financial years (ie, the period 2016/17 is from 1 July 2016 to 30 June 2017). Note that
disposal facility operators may amend their reports up to two years after submitting them, so figures may be
subject to slight change. Per capita figures are based on the quarterly estimated resident population data from
Stats NZ.
Since 1 July 2022, construction and demolition landfills (class 2) have also been subject to a
levy; from 1 July 2023, controlled and managed fills (class 3) were also included. Future reports
will include trends for those landfill typ
es. Figure 2 includes a longer time series of both class 1
and 2 disposals. Looking over a longer time period, there has been substantial growth in waste
disposal to municipal landfills between 2009 and 2018, and a levelling off with no strong trend
since then (although a slight reduction since the last review period). A slowdown of economic
activity associated with the response to the COVID-19 pandemic may have contributed to the
decrease in waste disposal in 2019/20.
Review of the effectiveness of the waste disposal levy
13
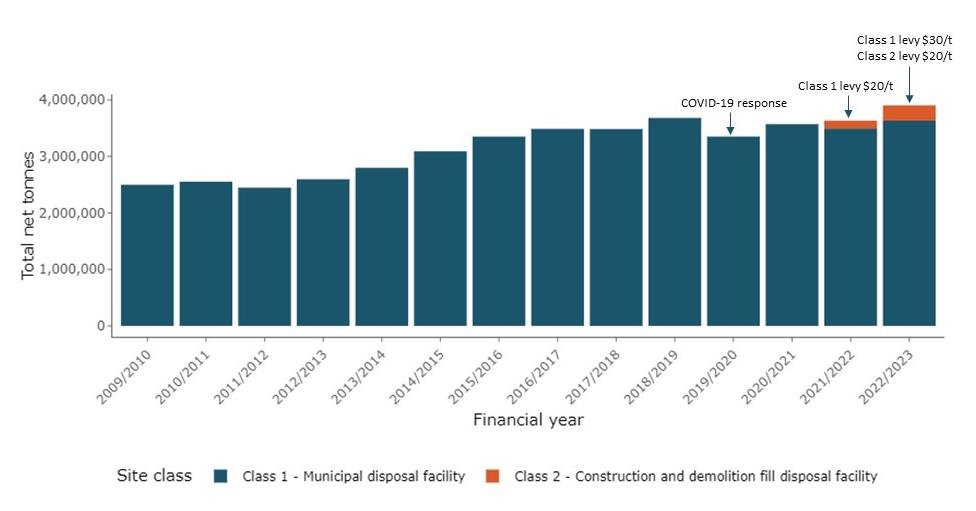 Figure 2:
Total tonnage of waste disposed of at levied landfills (2009/10 to 2022/23)
Figure 2:
Total tonnage of waste disposed of at levied landfills (2009/10 to 2022/23)
Note: Class 1 landfills have been subject to a landfill since 1 July 2009. Class 2 facilities have been subject to
reporting obligations since 1 January 2022, and to a levy since 1 July 2022. The 2021/2022 year therefore includes
only 6 months of data for class 2 facilities (January to June 2022).
14
Review of the effectiveness of the waste disposal levy
link to page 18
How tonnages are measured and recorded
Gross and diverted tonnage
Gross tonnage is the total tonnage of waste and diverted material (eg, recyclables) that enters
the facility.
Diverted tonnage is the tonnage of material that enters the facility as gross tonnage but is
either reused or recycled or removed from the facility within six months.
The six-month timeframe for diverted materials does not apply for transfer stations, industrial
monofills, or cleanfills. All diverted tonnage must be measured, even if it is stockpiled on site.
For transfer stations, diverted tonnage means material that is sent to be reused or recycled.
Net tonnage is the gross tonnage minus the diverted tonnage.
Tonnages can be measured using:
•
a compliant weighbridge
•
an offsite weighbridge
•
conversion of the volume of waste into tonnage using approved conversion factors
•
an average tonnage system (in some cases), in which facility operators may weigh a
sample of the vehicles delivering waste to the disposal facility and calculate an average
weight of waste carried for specific types of vehicles.
The WMA requires disposal facility operators to keep the original records of the tonnages of
waste and diverted material. These records are used when the Ministry audits a disposal
facility. It is an offence under the WMA for a disposal facility to fail to keep accurate records.
The measurements are also included in the monthly or annual returns a disposal facility
operator provides to the Ministry. The Ministry uses these returns to calculate the levy owed
by a disposal facility operator.
More information is available on the Ministry’s factsheet
Waste levy – Measuring waste
tonnages.
Trends in reuse, recycling and recovery
No comprehensive data are available to assess whether the amount of waste reused, recycled,
or recovered in Aotearoa has increased since the last review. This report considers available
information sources, which provide a snapshot rather than a time series. Over the review
period, the Ministry commissioned three reports considering national-level recycling volumes
(se
e table 6), as described below.
•
Eunomia (2018)
National Resource Recovery Project – Situational Analysis Report. The
Ministry commissioned this report from Eunomia Research & Consulting to consider the
impact of initiatives to restrict imports, made by a key importing country for Aotearoa
New Zealand’s recycling (known as China National Sword/Blue Sky initiatives).
The report provided an overview of the recycling sector in Aotearoa, a summary of the
international impact of the import restrictions, and a review of the impact within
Aotearoa. The report considered commercial and domestic sources of materials, and
compiled information supplied in confidence during interviews with sector participants.
The report compiled data from 2017 and was released in September 2018.
Review of the effectiveness of the waste disposal levy
15
link to page 18 link to page 18 link to page 19
•
Eunomia (2021)
Waste and Resource Recovery Infrastructure and Services Stocktake –
Summary Report and Eunomia (2023)
Waste and Resource Recovery Infrastructure and
Services Stocktake and Gap Analysis – Full Project Summary Report. These reports were
prepared for the Ministry in 2020 and 2021 to collate information on the waste and
resource recovery infrastructure and services provided in Aotearoa, and to make
recommendations for their future development. They include a summary of waste and
resource recovery infrastructure in Aotearoa (as of 2020), broken down by primary
material streams.
These reports considered a wider range of material streams, not all of which were covered
in the 2018 report. They also featured more in-depth interviews across a wider range of
participants, so could potentially have identified additional resource recovery activity
(however, it is hard to determine whether the increase in recovery between the 2018 and
2021 report relates to an increase in real terms, an increase in reporting, or both).
Table 6:
Annual tonnage of recycled commodities for Aotearoa New Zealand, from 2018 and
2021 reports
Recycling commodity
Eunomia (2018)
Eunomia (2021)
(tonnes)
(tonnes)
Paper and cardboard
480,000
550,000
Plastics
45,000
55,006
Ferrous metals (iron and steel)
560,000
605,000
Non-ferrous metals (aluminium,
copper, lead, alloys, and other less
50,000
67,183
common metals)
Glass
160,000
156,9171,2
TOTAL
1,295,000
1,434,106
Note: tonnages include both commercial and household sources of recycling, and materials processed onshore, as
well as those exported for recycling offshore.
The 2021 and 2023 reports also contained information on a wider range of recovered
materials. Overall, the stocktake work was able to identify approximately 12 million tonnes of
material that reaches end of life in Aotearoa annually. A breakdown of this material is shown
in
figure 3.
1 This figure includes glass recycled (into bottles, etc – 120,452 tonnes), as well as that used in aggregate
(17,142 tonnes) and other uses (such as filter media, sand – 21,012 tonnes). It is unclear if this wider range
of uses is included in the figure reported in the 2018 report, which does not provide a detailed
breakdown. This figure does not include flat glass (eg, from windows), for which the 2021 report
estimates an additional 35,000 tonnes is collected annually.
2 The Eunomia (2021, 2023) reports note there are some discrepancies between data commissioned during
investigations into a potential container return scheme for Aotearoa (which show total glass of 278,613
tonnes for 2019 – including 250,113 tonnes of beverage container glass and a further estimated 28,500
tonnes of non-container glass) and data from the Glass Packaging Forum, a voluntary product stewardship
organisation for the glass packaging sector (which estimated the 2019/20 figure to be 256,923 tonnes of
glass to market).
16
Review of the effectiveness of the waste disposal levy
link to page 19 link to page 20 link to page 21
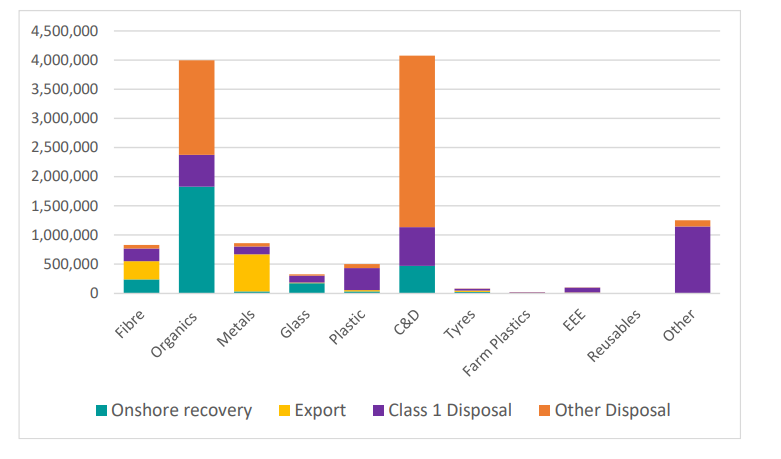 Figure 3:
Estimated tonnes of material recovered and disposed of in Aotearoa in 2020
Figure 3:
Estimated tonnes of material recovered and disposed of in Aotearoa in 2020
Source: Eunomia (2023).
Note: ‘Other’ includes textiles, sanitary paper, and special wastes which were not included in the stocktake. Overall
onshore recovery accounts for 23 per cent (2.8 million tonnes) of all material managed. Other disposal includes
class 2 to 5 landfill disposal, on-farm disposal, and system losses.
Since 1 January 2022, transfer stations have been required to report on tonnages of materials
they receive and send on (either for disposal or to reuse, recycling or recovery). These
preliminary data provide some additional information on materials being sent for recycling
.3
Table 7 shows material received into transfer stations (either of unspecified origin, or broken
down by the type of activity that generated the material). Where specified, residential is the
most common origin (ie, material generated by domestic use and dropped off directly to the
transfer station). This may reflect the role of transfer stations as an alternative to kerbside
collection in smaller or more remote areas.
Table 8 shows the quantities of material leaving transfer stations, by type of material where
this is specified. These tonnages are lower than the figures Eunomia (2018, 2023) gave for
recycling. This reflects that, for many recycling commodities, the majority is collected from
businesses rather than households, or by kerbside collections from households (and so is less
likely to be reflected in transfer station statistics).
3 Note, however, that not all material goes via a transfer station – for example, materials picked up from
households in a kerbside collection would typically go to a materials recovery facility rather than a
transfer station. Similarly, recycling collected from businesses would not generally go via a transfer
station.
Review of the effectiveness of the waste disposal levy
17
Table 7:
Reported quantities of waste material received by transfer stations and the activity that
generated the waste (where stated) (for the 2022 calendar year)
Return
Residential
Construction
Kerbside
Commercial
Landscape
Special
Unspecified
period
and demolition
collection
and industrial
waste
waste
Jan-Mar
260,514
73,694
67,060
38,004
29,869
101
820,981
April-Jun
457,420
68,194
70,256
40,105
24,280
120
1,015,807
Jul-Sep
213,346
69,179
56,914
49,059
29,688
136
796,039
Oct-Dec
41,552
73,708
58,168
40,916
25,817
144
626,673
TOTAL
972,832
284,775
252,398
168,084
109,654
501
3,259,500
Source: Reported returns from the OWLS.
Note: Reporting by activity source (ie, the activity that generated the waste) is currently optional. It will become
mandatory from 1 July 2024.
18
Review of the effectiveness of the waste disposal levy
Table 8:
Reported quantities sent by transfer stations to recycling or disposal (tonnes) (where specified) (for the 2022 calendar year)
Return period
Organic
Ferrous
Glass
Non-ferrous
Paper
Plastic
Potentially
Rubber
Rubble
Textiles
Timber
metal
metal
hazardous
Jan–Mar
70,127
50,286
14,551
763
9,586
3,532
117
571
17,545
39
14,104
April–Jun
80,210
26,654
12,891
1,166
11,455
4,041
120
208
18,711
30
26,276
Jul–Sep
45,143
18,608
12,339
1,949
10,340
9,731
121
2,357
28,658
36
14,187
Oct–Dec
36,307
15,462
12,792
891
8,657
2,971
146
120
22,321
52
11,710
TOTAL
231,787
111,010
52,573
4,769
40,038
20,275
504
3,256
87,235
157
66,277
Source: Reported returns from the OWLS.
Review of the effectiveness of the waste disposal levy
19
Case study: Reuse
Waste prevention and reuse
Eunomia (2023) estimated that New Zealanders use around 2.3 billion single-use beverage
containers a year, many of which subsequently end up in landfills or enter the natural
environment. Most operators of reusable schemes have not been in business long enough to
establish accurate waste prevention data, with the exception of two longer-term operating
providers.
•
Conservative estimates are that reusable glass bottle providers, with a combined fleet of
30.1 million bottles, prevent around 100.5 million single-use containers from being
manufactured and entering Aotearoa New Zealand’s waste recovery system per year.
•
Most of this prevention occurs in Auckland (16.7 million items), followed by Canterbury
(15.6 million items).
•
Of the 30.1 million total, 30 million items are provided by a single operator (ABC), which
provides ‘swappa crate’ beer bottles.
•
Six reusable cup schemes, with an estimate fleet size of 563,000, are expected to
collectively prevent 4.7 million single-use cups from being manufactured and going on to
enter Aotearoa New Zealand’s waste streams.
Blumhardt (2022) also provided an overview of reusable packaging systems in Aotearoa, along
with examples of such systems in operation across a range of sectors, including:
•
hospitality, tourism and accommodation
•
beverages
•
construction
•
groceries
•
personal care and cleaning products
•
transit/transport packaging.
Both worldwide and in Aotearoa, however, reusable packaging constitutes a small proportion
of the overall market share of packaging. Sectors that have historically been leaders (such as
the beverage industry) continue to see an ongoing downward trajectory in their use of
reusable packaging (Wilcox and Mackenzie, 2021).
20
Review of the effectiveness of the waste disposal levy
Case study: Recovery
Recovery as defined in the WMA includes extraction of materials or energy from waste or
diverted material for further use or processing, and includes making waste or diverted
material into compost. Elsewhere, composting is sometimes defined as a form of recycling.
This case study considers recovering energy from waste materials.
Eunomia (2023) presented analysis of the biofuel energy potential from different waste
sources (such as wood waste that currently goes to landfill, crop residues, municipal biosolids,
forestry residues and manures). This analysis identified forest harvest residues as the largest
potential source of waste materials (although this is not material that currently goes to
landfill).
Energy recovery could take a number of forms, including the following.
•
Biogas: The Bioenergy Association suggests there is significant potential for growth in the
production of biogas from residual organic wastes from food processing, waste water
treatment facilities and dairy effluent if supplemented with other organic material
(Eunomia, 2023, pp 129–130).
•
Liquid biofuels: Liquid biofuels are substitutes for liquid fossil fuels and include biodiesel,
bioethanol and bio-oils. Current use in Aotearoa is very limited (less than 0.1 per cent of
total liquid fuel sales) (Eunomia, 2023, p 130).
•
Wood waste and solid fuels: Wood biomass (primarily from forestry slash and, to a lesser
extent, sawmill by-products) is the most commonly used biofuel in Aotearoa (Eunomia,
2023, p 130). Eunomia (2023) estimated such biomass to supply in the order of 8.5 per
cent of total energy supply, based on figures in Ministry of Business, Innovation &
Employment (2020). Waste tyres are also a potential energy source. In 2021, Golden Bay
Cement completed a project (supported with $16 million of funding from the WMF) that
will avoid up to three million used tyres going to landfill each year. The tyres are instead
used as a tyre-derived fuel in the cement plant, reducing coal and iron sands use, and
associated emissions (Fletcher Building, 2021).
•
Energy from residual waste: there is no large-scale incineration or other form of energy
generation from mixed waste in Aotearoa at present, although there have been, and
continue to be, a number of efforts to establish such facilities.
Achieving waste minimisation through
investment of the levy
Investment outcomes
The purpose of imposing a levy on waste disposed of in landfills is to increase the cost of waste
disposal, to recognise that disposal imposes costs on the environment, society and the
economy; and to raise revenue for promoting and achieving waste minimisation. Both central
and local government invest the levy to promote and achieve waste minimisation, and the
outcomes achieved by that investment are an important component of the overall
effectiveness of the levy.
Within this review period (covering the 2020 to 2022 calendar years), 51 projects were funded
by the WMF, with a total of over $20.2 million in funding approved for 46 organisations.
Review of the effectiveness of the waste disposal levy
21
link to page 24 link to page 24 link to page 25
Additional third-party funding of over $16.5 million was unlocked with this investment. For the
PIF, 7 projects were funded, with a total of over $7.6 million in funding approved for 7
organisations (since the fund opened in November 2021). The types of projects funded by both
funds are outlined in
table 9.
Table 9:
Summary of WMF and PIF funding (2020 to 2022)
WMF
PIF*
Project type
Count
Value
Count
Value
Community
7
$1,113,946
Data collection and
1
$80,000
analysis
Education and
3
$737,892
awareness
Services
8
$2,464,201
Feasibility or
12
$2,411,151
investigative review
Innovation
4
$1,261,558
Infrastructure
20
$13,446,741
3
$6,349,631
Total
51
$20,253,931
7
$7,611,189
* PIF data for one year only (2021/22) – PIF first opened in November 2021.
Projects funded through the WMF and PIF between 2020 and 2022 range from smaller-scale
projects (less than $100,000) such as pilot studies and feasibility studies, to multi-million-dollar
infrastructure investments. The overall distribution of investments is outlin
ed in table 10.
Table 11 shows examples of how investments have supported a range of strategic priorities
and work programme initiatives.
Table 10:
Spread of investments by funding amount (PIF and WMF, 2020 to 2022)
Funding quantum
Number of projects funded
Total funding in this category
Less than $100,000
14
$877,904
$100,000 to $249,999
15
$2,496,174
$250,000 to $499,999
11
$3,883,545
$500,000 to $999,999
12
$8,891,414
$1 million +
6
$11,716,083
22
Review of the effectiveness of the waste disposal levy
Table 11:
Examples of how funded projects have supported strategic priorities and work programmes
Strategic priority / work programme
Examples of funded projects
component
• Auto Stewardship New Zealand Limited: seeking to establish a product stewardship scheme for e-waste large batteries (over
Supporting development of regulated
5 kilograms).
product stewardship schemes
• Agrecovery Foundation: trialling its regulated product stewardship scheme for farm plastics before the scheme is rolled out
nationally. The scheme will require producers, brand owners, importers, retailers and consumers to take responsibility for
collecting and dealing with farm plastics.
• Co-design of Plastic Packaging Priority Product Stewardship Scheme(s) for Aotearoa: a multi-stakeholder co-design of
accreditation-ready plastic packaging scheme(s) for all plastic packaging used for consumer goods at retail or wholesale level.
• Tyrewise: implementation of regulated product stewardship scheme for end-of-life tyres to become launch-ready.
• Pinehurst Associates: developing additional biodegradable bio-based formulations for nursery pots that degrade in soil and
Implementation of National Plastics
under home composting conditions, and manufacturing and market-testing 50,000 pots in agricultural and horticultural
Action Plan – contributing to action
sectors.
plan
• Again Again Limited: extending a technology platform that enables companies to loan and track reusable packaging such as
coffee cups and food containers.
• Kaipaki Dairies: substantially increasing their capacity to supply milk in reusable containers, allowing the removal of the
equivalent of more than 1 million single-use plastic milk bottles a year from 2025.
• Recycle South: a plastics pelletiser plant-expansion project. The plant washes polyethylene and polypropylene plastics from
the lower South Island, including agricultural bale wrap.
• Marley NZ Limited: increasing collection and processing ability for HDPE and PVC pipes, in partnership with Unitec and Waste
Management. This will minimise plastic waste going to landfill in the construction and demolition industry, by investing in new
sorting, washing and shredding capabilities in both North and South Island.
• Whanganui Kai Hub: a collaborative partnership project working to address organic food waste within the community,
Emissions reduction plan – organic
supporting the transition from food poverty to kai sovereignty. The project will support the fit-out of a centralised place to
waste
redistribute food waste, share nourishing meals and provide a space for people to attend educational workshops that create a
waste-free Whanganui.
(also supports objectives of preventing
• Nelson Environment Centre: developing a customised facility to distribute a greater quantity of rescued food to more people
food waste and supporting
in need. The fit-out and renovations will enable Kai Rescue to expand operations and divert an estimated 25 per cent more
communities)
food waste from landfill and, in turn, address the negative impact of organic waste in landfill and the associated greenhouse
gas emissions resulting from decomposition.
Review of the effectiveness of the waste disposal levy
23
• Waikato Regional Council: research project focusing on circularising organics. The research project is broken into three parts
looking at the whole chain and, when added together, aim to provide a pathway for a robust circular loop for organics.
Feedstocks include residential food scraps and green waste, as well as industrial sources such as agriculture and horticulture.
• Queenstown Lakes District Council: helping to establish local community composting hubs to help reduce organic waste to
landfill, working with community groups and the hospitality sector.
• EnviroWaste Services Limited: investing in de-packing equipment to increase capacity to de-package food waste. De-packaged
food waste can be further processed into useful products like compost.
• BioRich Limited: expanding its two commercial composting sites, which handle the bulk of organic waste in Hawke’s Bay, to
compost an additional 12,000 tonnes of organic waste per annum.
• Porirua City Council: two projects, to first prepare a business case and then deliver a resource recovery park at Spicer Landfill.
Reducing construction and demolition
The park will host three waste diversion facilities, including a specialist construction and demolition processing and diversion
waste
facility to service Porirua and process localised material from hubs in Hutt City and the Kāpiti Coast.
• Mercury Bay Resource Recovery Centre: community-led construction and demolition waste processing facility, to be
(also supports emissions reduction
established on the Thames-Coromandel District Council’s new transfer station site.
plan actions)
• New Plymouth District Council: establishing a commercial and industrial materials recovery facility in Taranaki (ie, a facility that
receives, separates and prepares recyclable materials).
• Nelson City Council: investing in infrastructure to undertake a pilot programme to divert timber and plasterboard waste from
construction and demolition sites.
• Northland Waste Limited: establishing a wood waste recovery operation for the purposes of shredding and converting wood
waste to biofuel.
• Central Environmental Limited: establishing a construction and demolition waste processing facility in the Manawatū, to
accept materials from demolition contractors, construction companies and waste management companies, and provide an
alternative to landfill disposal.
• Buller District Council: developing a coordinated regional waste recovery network for construction and demolition waste
across the West Coast.
• EnviroWaste Services Limited: establishing a permanent wood waste recycling facility to support the building and construction
sector in the Auckland/Tauranga/Hamilton regions, diverting wood waste from landfill and processing it for use as biofuel.
• Xtreme Zero Waste: upgrading its facilities with a recyclables processing building, recyclables processing equipment and
Improving kerbside recycling and
organics composting equipment, to establish a Centre of Excellence at the Raglan Resource Recovery Centre.
resource recovery networks
• Mackenzie District Council: improving current waste practices by diverting kerbside organic waste from landfill by distributing
240 litre organics wheelie bins to properties within the district’s kerbside collection area, with organic waste being processed
into usable compost (also supports emissions reduction plan work).
• Chatham Islands Council: optimising the layout of transfer stations and providing signage to encourage use; facilitating
collection and handling of recyclables by having suitable receptacles and providing a permanent facility for storing reusable
materials for use by the community.
24
Review of the effectiveness of the waste disposal levy
• WasteCo NZ Limited: enhancing sorting operations at its new Sort Centre through the establishment of an automatic sort line,
moving from hand sorting on the floor to conveyor sorting.
• Bin Hire Co: installing an automated sort line for sorting mixed waste bins, as well as developing and implementing an
educational programme for marae.
• Ōrākei Hapori Parakore (Ōrākei Community Zero Waste): running a one-year data and awareness project on waste reduction
Improving Māori participation
within their rohe (area) by collecting data through waste audits and surveys, raising awareness through workshops and
wānanga, and developing an organisational waste strategy.
• Para Kore Marae Incorporated:
− supporting Te Whānau-ā-Apanui towards its zero waste ambitions through co-designing and implementing waste
minimisation strategies in the 12 tribal hapū in the eastern Bay of Plenty region, establishing the infrastructure and
behaviour set to transform the tribal rohe into a low-waste-generating district.
− working with six Ngāi Tahu rūnaka (tribal council) and hapū to co-design and implement strategies to eliminate waste and
hiring three new kaiārahi (leadership) positions to establish a regional presence in and around Christchurch, Dunedin and
Invercargill.
Review of the effectiveness of the waste disposal levy
25
link to page 28
Changes to investment processes include collection of more data on anticipated and actual
outcomes of funded projects. A waste investments snapshot is now available on the Ministry
website, which includes information on forecast diversion of tonnes of organic waste and
forecast emissions reduction (relevant metrics for the current focus of funding). Additional
information on funded projects is also available in a searchable project database and map.
Territorial authorities invest in waste minimisation
Half the money collected through the levy is paid to territorial authorities quarterly each year.
The amount of levy each territorial authority receives is determined by the number of people
in each district.
Waste management and minimisation plans prepared by each territorial authority set out how
the levy will be used. Territorial authorities must spend the levy to promote or achieve waste
minimisation and in accordance with their waste management and minimisation plans.
With increases to the quantity of levy money territorial authorities receive, the Ministry has
provided some additional guidance on its website on how territorial authorities could use their
levy money.
Territorial authorities report to the Ministry annually on what they have spent their levy
revenue on. This is currently on a voluntary basis through the TAWLES, which was launched on
22 April 2022. From 1 July 2024, territorial authorities will be subject to mandatory record-
keeping and reporting requirements, with the first report (covering the 2024/25 financial year)
due by 30 September 2025.
Territorial authorities invest levy funds in a wide variety of projects and activities. Common
investments include services such as kerbside recycling, and education and communication
(see
table 12). The levy spend areas in this review period are similar to the long-term trend
(overall, 45 per cent of levy revenue has been spent on services and 25 per cent on education
and communication over the time series).
Table 12:
Reported spending areas for territorial authorities’ share of levy funds
Proportion of total spend
Amount (%)
Spending area
2019/20
2020/21
2021/22
Services
$10,177,426 (50%)
$7,837,385 (45%)
$6,929,833 (50%)
Education and
$4,993,240 (24%)
$5,706,722 (33%)
$3,545,406 (25%)
communication
Infrastructure
$1,968,712 (10%)
$1,430,248 (8%)
$572,798 (4%)
Research and
$664,041 (3%)
$773,815 (4%)
$595,411 (4%)
reporting
Other initiatives
$2,617,472 (13%)
$1,703,491 (10%)
$2,304,968 (17%)
Total spend
$20,420,891
$17,451,661
$13,948,417
Source: TAWLES.
Note: Not all levy revenue received by councils is spent in any given financial year; levy revenue may be accrued to
spend on larger projects. Dataset includes 66 out of 67 territorial authorities in 2019/20, 65 out of 67 in 2020/21
26
Review of the effectiveness of the waste disposal levy
link to page 25 link to page 30
and 48 of out 67 in 2021/2022. The decreased reporting from territorial authorities in 2021/2022 is due to a change
in data collection method and therefore comparison of absolute values is not recommended.
Reported spending areas align well with the work programme priorities identified
in table 11.
Not all spending is attributable to a specific waste stream or category (ie, projects may target a
range of material types). For the portion of funding that can be attributable to a specific waste
stream, projects targeting organics (such as household food waste) received the most funding
within the review period, with other priority areas, including plastics and priority products
(such as e-waste and agrichemicals), also receiving funding.
The results of audits of territorial authorities’ spending of levy revenue are outlined in annual
regulatory performance monitoring reports (Ministry for the Environment, 2021d, 2022a).
Discussion
Domestic policies can support waste
reduction and recycling – but it remains
strongly influenced by global conditions
Table 13 outlines a range of factors that have influenced reuse, recycling and recovery in this
review period. Key factors include:
•
restrictions on exports of certain types of recycling commodities from key trading partners
•
impact of the COVID-19 pandemic
•
increasing standardisation of domestic recycling
•
changing public attitudes and beliefs
•
supporting policies and measures, including the waste reduction work programme and
emissions reduction plan actions.
Review of the effectiveness of the waste disposal levy
27
link to page 30
Table 13:
Factors influencing Aotearoa New Zealand recycling between 2020 and 2023
Factor
Potential impact on recycling
Likely impact on
recycling quantities
Trends in international recycling
A significant amount of the collected recyclable materials in Aotearoa is currently exported. China
Reduction
markets
used to be the main market for over 50 per cent of the world’s recycling, which included receiving
waste and recyclables from Aotearoa. However, since the implementation of China’s National
Sword polic
y,4 recyclable commodities, such as plastic, have had to find new markets. These are
now exported to south-east Asian countries, including Vietnam, Indonesia, Thailand and
Malaysia. China’s National Sword policy has impacted what can be recycled, as well as prices and
quality standards for materials.
COVID-19
The onset of the COVID-19 global pandemic led to some immediate, short-term impacts on
Mixed
domestic recycling in Aotearoa, including:
• an inability for some local authorities to continue kerbside recycling due to concerns about
exposure to the virus
• increased contamination in co-mingled wheelie bins in some local authority areas, leading to
the discontinuation of sorting during the lockdown period
• an initial lack of overseas markets for fibre (paper/cardboard) due to overseas mills closing,
followed by an increase in demand due to mills that continued operating becoming short of
material
• a shortage of glass at Visy’s beneficiation (pre-treatment) plant and at the glass re-processor
O-I Glass
• increased volumes in kerbside recycling, organics and rubbish collected during the lockdown
period (WasteMINZ, 2020).
Alongside these shorter-term impacts related to the immediate effects of COVID-19 and the
response to it (such as lockdowns), additional short- to medium-term impacts include the
following.
• instability of supply chains, shipping delays and/or capacity challenges.
4 China’s National Sword policy, announced in February 2019, included bans on certain types of recyclable waste and a strict maximum contamination standard of
0.5 per cent. The policy led to the removal of the largest recycling market in the world for low-value mixed plastics (eg, resin types 3 (PVC), 4 (low-density polyethylene), 6
(polystyrene) and 7 (other)).
28
Review of the effectiveness of the waste disposal levy
link to page 31
• Use of certain types of plastics increased, such as masks, takeaway containers, and consumer
goods packaging, alongside a drop in the costs of virgin plastic relative to recycled plastic
(linked to the cost of oil) (Brock, 2020).
• Plastics use declined in the early stages of the pandemic, in line with reduction in demand
and output, although the reduction was substantially smaller than the decline in overall
economic activity (ie, the plastics intensity of the economy increased, on average). In some
sectors, such as healthcare, plastics use increased significantly. The pandemic also resulted in
significant disruptions to plastics recycling, due to the temporary halting of some recycling
collections, a temporary shift to single-use plastics, disruptions to waste plastic trade, and a
temporary loss of competitiveness for recycled plastics (linked to the low price of oil and
resulting low prices for primary plastics) (OECD, 2022).
• Government investment in resource recovery infrastructure increased, through the COVID-19
Response and Recovery Fun
d.5
Increasing standardisation of
In 2020, sector organisation WasteMINZ prepared a report for the Ministry that provided
Increase
domestic recycling
recommendations on opportunities to standardise domestic kerbside collections of waste in
Aotearoa, to increase consistency, reduce confusion for householders, improve material quality
and reduce residual rubbish to landfill (WasteMINZ, 2020). The report identified a lack of
consistency across the country in the types of materials collected and the way they are collected.
Extensive discussions were carried out with waste/recycling re-processors, collectors and sorters
(such as materials recovery facility operators), as well as local government, to reach agreement
on a standardised national approach. Some of the recommendations could be achieved
voluntarily. For example, a number of councils have stopped collecting lower-value plastic types.
The Ministry subsequently consulted on, and is partway through, implementing a range of
proposals to achieve standardisation (Ministry for the Environment, 2022b, 2023b).
Public attitudes and beliefs
In 2023 the Ministry funded research to understand and track changes in people’s attitudes,
Possible increase
awareness and behaviours around waste minimisation (AK Research and Consulting, 2023). This
initial research (which will be repeated for the next three years) found that:
• people are doing a good job at recycling and are mostly putting the right items into recycling
bins
• the most frequent recycling and reusing behaviours are ‘using reusable bags when shopping’
(81 per cent); ‘recycling waste at home’ (72 per cent); ‘carrying a reusable water bottle’ (58
per cent) (AK Research and Consulting, 2023, p 5)
5 An initial funding allocation of $124 million was made, for a range of resource recovery infrastructure solutions to divert and process recyclable or recoverable products
such as food organics, fibre, plastics and construction and demolition materials. Allocation was also made for installation of weighbridges at landfills and resource
recovery sites. Of the initial projects identified for investment, not all proceeded to a funding arrangement. To date, 30 projects have been funded, totalling $62.6 million.
Review of the effectiveness of the waste disposal levy
29
link to page 32
• the majority of people (72 per cent) say that they actively try to reduce waste (AK Research
and Consulting, 2023, p 6)
• food waste is an important issue for New Zealanders, with 88 per cent agreeing that wasting
food feels wrong; key reasons for wasting food were not eating leftovers and having food in
the fridge/freezer ‘going off’ (AK Research and Consulting, 2023, p 7)
• most (82 per cent) agreed that reducing plastic waste was an important issue (AK Research
and Consulting, 2023, p 8)
• the biggest barrier to reducing plastic waste is finding alternatives (40 per cent) (AK Research
and Consulting, 2023, p 65).
These results were also compared with earlier studies from a range of sources to gain a sense of
how public attitudes and behaviours are changing over time (Ministry for the Environment,
2023c
).6 The main findings were:
• people are finding recycling easier (71 per cent) and less confusing (37 per cent) than in the
past
• in general, recycling and reducing behaviours seem to have improved in the last few years –
but people are less confident about what happens to their recycling than in previous surveys
• more people are dropping off e-waste at a separate location for recycling (46 per cent).
The Packaging Forum also conducted a packaging and recycling survey in 2022, which compared
consumer behaviours with an earlier survey in 2018. Key findings included (Horizon Research,
2022, p 2):
• 90 per cent of respondents said they put their recycling out for collection at kerbside,
compared to 84 per cent in 2018
• of those who do not have a kerbside collection, 30 per cent put their recyclables in the
rubbish bin
• the most recycled items at kerbside are plastic bottles (95 per cent); paper and cardboard
(92 per cent); glass bottles and jars (85 per cent) and aluminium cans (82 per cent).
Waste reduction work programme
Policy and regulatory changes made since 2020 that may have increased the amount of reuse,
Increase
and emissions reduction plan
recycling and recovery include:
initiatives
6 Comparisons were made between Colmar Brunton
(2018), WasteMINZ (2018) and Rabobank surveys (Rabobank).
30
Review of the effectiveness of the waste disposal levy
link to page 33 link to page 33 link to page 33
• phase-outs of various single-use or hard-to-recycle plastics (with a first tranche of products
banned from 1 Octobe
r 20227 and a second tranche from 1 July 2023)
,8 which can help
reduce contamination in recycling
• implementation of a permitting system under the Basel Convention for the export of low-
grade plastics, meaning Aotearoa New Zealand companies require a permit to import or
export hard-to-recycle plastic waste
• as well as investment through the WMF and PIF outlined above, additional investment in
domestic recycling infrastructure through the COVID-19 Response and Recovery Fund and the
Climate Emergency Response Fund
• moves to standardise kerbside recycling (as outlined above)
• adoption of a National Plastics Action Plan (Ministry for the Environment, 2021e).
Improving the effectiveness of the levy
Cabinet agreed to changes to increase the effectiveness of the levy in 2020, along with a number of supporting recommendation
s. Table 14
summarises these topics and progress to date.
Table 14:
Status of topics identified in previous levy reviews and Cabinet decisions related to the waste disposal levy
Topic
Description
Status
Managing the
Recycling operations produce some
While recyclers do face higher disposal costs, some recycling operations have also benefited from the increased
impact of an
waste by-products (such as floc from
levy and supporting parts of the work programme (such as investment in improved materials recovery facility
increase in
metal shredders) that must be
sorting equipment).
disposal costs on
disposed of, and will face higher
The New Zealand Association of Metal Recyclers received funding from the WMF to assess options for improved
recycling
disposal costs as the levy increases.
management of shredder floc. The resulting report proposed options for further consideration, although none
operations
are considered to be short-term solutions, and disposal costs will continue to be a challenge for metal recyclers.
7 Tranche 1: Single-use plastic drink stirrers (all plastic types), single-use plastic cotton buds (all plastic types), plastics with pro-degradant additives (subset of plastic type 7),
certain PVC food trays and containers (plastic type 3), polystyrene takeaway food and beverage packaging (plastic type 6), expanded polystyrene food and beverage
packaging (plastic type 6).
8 Tranche 2: single-use plastic drinking straws (with some limited exceptions), single-use plastic tableware and cutlery, single-use plastic produce bags, non-home-
compostable produce labels.
Review of the effectiveness of the waste disposal levy
31
link to page 34
Future introduction of regulated product stewardship schemes (including for tyres – to begin in 2024) and
e-waste (scheme design currently underway) could also help to shift some of the costs of managing products at
their end of life, from recycling operators to producers and manufacturers.
Strategic
Cabinet recognised, with the growing
Changes to the systems and processes for investing the central government portion of the waste levy are
investment of the
quantum of levy revenue, the
outlined above. Territorial authorities are required to invest their portion of levy revenue on matters to promote
levy
importance of ensuring it is invested
or achieve waste minimisation, as outlined in their waste management and minimisation plans. In turn, waste
strategically by both central and local
management and minimisation plans must have regard to the Aotearoa New Zealand waste strategy.
government.
A new waste strategy was released in March 2023, outlining a future vision, alongside phases and goals for
achieving it (Ministry for the Environment, 2023d). Councils will progressively incorporate strategy goals and
targets as they update their planning documents. Work is currently underway on an action and investment plan,
which will provide further guidance on investment priorities. An investment strategy was released as part of a
proactive release of Cabinet papers associated with new waste legislation in November 2023.
Reform of the
Cabinet recognised updates to the
Public consultation on new legislation occurred between October and December 2021. Since then, policy
WMA and Litter
WMA and Litter Act 1979 would:
proposals have been approved by the previous Government and will be discussed and agreed with the incoming
Act 1979
• support greater strategic alignment Government, to determine priorities and alignment and agree next steps (such as revised policy proposals going
of levy investment by central and
to Cabinet and drafting of new legislation).
local government
• allow for improvements to the
administration, compliance,
monitoring and enforcement of the
levy
• allow for modernisation of both
pieces of legislation.
Improved
Cabinet recognised that increasing
In 2022, the Ministry funded Keep New Zealand Beautiful from the levy, to develop a behaviour-change
management of
disposal costs could also lead to an
programme to reduce illegal dumping. The first piece of research was a literature review into international
illegal dumping
increased risk of littering and illegal
strategies for tackling illegal dumping and recommendations for New Zealand to implement (Keep New Zealand
and littering
dumping. In response, Cabinet agreed
Beautiful, 2022a).
to adopt strategies for litter prevention
Sustainable Coastlines also received levy funding for its national coastal litter database, Litter Intelligence
.9 The
and illegal dumping, and to the
data collection methodology is based on United Nations guidelines and was co-designed alongside the Ministry,
establishment of funds to tackle litter
Stats NZ and the Department of Conservation.
9 Between the previous levy review period (2016/17 to 2018/19) and this review period (2019/20 to 2021/22), there was a decrease in average litter density (from an average
of 397 items to 301 items per 1,000 square metres. However, it is difficult to draw inferences as there was also a substantial change in litter surveys logged over those
32
Review of the effectiveness of the waste disposal levy
and dumping (as part of new waste
The most recent litter audit by Keep New Zealand Beautiful suggests a substantial increase in litter since the
legislation).
previous audit (Keep New Zealand Beautiful, 2022b).
Proposals for new waste legislation include improvements to tools for managing and preventing litter and
dumping.
Improvements in
Past reviews of the levy (and other
Progressive changes to the levy and associated reporting requirements are increasing the amount of information
waste data
reports) have identified a lack of waste
the Ministry has on disposal of materials to landfill. In particular, past reviews have only had data available on
data.
municipal landfills, but disposal information is now available for class 1 to 5 landfill sites, industrial monofills, and
transfer stations. Additional reporting requirements, to be introduced from 1 July 2024, are outlined above.
The Ministry is also working on improving the accessibility of data it holds, including through public-facing
dashboards.
Approach to
Industrial monofills are sites that
Preliminary data from expansion of reporting obligations to industrial monofills (which have been subject to
industrial
accept for disposal waste that is
reporting obligations since 1 January 2023) shows 26 industrial monofill sites are now reporting to the Ministry.
monofils
generated from a single industrial
In total, these sites have reported over 4.8 million tonnes of material disposed of in 2023 to date. This is
process (for example, steel or
dominated by a single site, which accounts for over 4 million tonnes of that total.
aluminium making, or pulp and paper
Some sites are voluntarily reporting the origin of the waste they accept, while others report the waste as
making). At the time changes to the
‘unspecified’ (72 per cent). Most of the waste with a specified origin was ‘commercial and industrial’
levy were adopted in 2020, limited
(39 per cent).
information was available on the types
or quantities of waste going to these
sites, so it was difficult to assess
whether a levy would be appropriate.
Approach to rural
Some submitters to the levy
Work has progressed on improved management of inorganic farm wastes (including agrichemicals and their
waste and farm
consultation considered that farm
containers, and farm plastics) through regulated product stewardship (Ministry for the Environment, 2023e).
dumps
dumps should also be made subject to
Work has not yet taken place on an overarching regulatory framework (such as national direction under the
a levy, or else should be better
Resource Management Act 1991), given the substantial reform that has been underway in that area.
regulated in other ways to ensure farm
waste disposed of on site was also
Freshwater farm plans are a regulated farm-planning process for farmers and growers to identify, manage and
minimised (and its environmental
reduce the impact of farming on the freshwater environment. Freshwater farm plans are required to consider
effects appropriately managed).
risks and mitigation actions, including point source discharges such as rubbish dumps and offal pits.
Levy rate and
Cabinet noted a range of stakeholder
The changes to the levy agreed in 2020 will be fully implemented by 1 July 2024 (when levy rates will rise to $60
differentiation
views on both what levy rates were
and $30 for municipal and construction and demolition landfills, respectively).
periods (from 96 surveys and a total item count of 39,933 to 1,075 surveys and a total item count of 297,072). In both survey periods, plastic comprised the majority of
litter items (over 65 per cent in both cases).
Review of the effectiveness of the waste disposal levy
33
link to page 36
most appropriate, and whether (or
Some stakeholders have identified a perceived trend of materials shifting from municipal landfills to other landfill
how) rates should differ between sites. types (which are typically subject to less-stringent environmental controls). This could include waste that is
Cabinet identified that this review
legally able to be accepted at other landfill types, as well as material that should be going to municipal sites – in
could assess the initial impacts of the
which case, the movement of material would result in both forgone levy revenue and potentially more
changes and consider the need for
environmental harm (eg, if putrescible waste is disposed of in landfills without adequate leachate and emissions
additional changes, such as further
capture systems in place).
increases to levy rates or changes to
A time series of data on levy payments for sites other than municipal landfills is not yet available, to identify any
differentiation of rates between sites.
such possible trends. The time series of waste disposal to municipal sites does not necessarily support this
hypothesis; there have not been substantial drops since the levy rate was introduced for construction and
demolition sites in 2022.
Implementation
The changes to the levy have led to an
Lessons from the levy expansion to date include:
of changes to the
increase in regulated parties from 36
• the need for a wider range of tools in the regulatory toolbox to enable compliance with a range of regulatory
levy
regulated sites in 2017 to 348 by 30
requirements
June 2022 (and 570 sites by the end of
• the need to align powers of entry with similar jurisdictions in other sectors
2022). Levy revenue has also increased,
from around $40 million per annum in
• challenges with detection of disposal facilities not registered in the OWLS – and resistance from the wider
the previous review period to $80.3
sector to inform or report on operators who are not registered
million per annum in the 2021/22
• benefits of increased mandatory reporting – the Ministry now has much more information on the quantities
financial year.
of waste being disposed of, and to which fill sites. Additional regulations that take effect from 1 July 2024 will
further increase available information, including on the types of waste being disposed of in landfills
• the need for clarity of the scope and coverage of the regulation
s.10
10 The wording of the current regulations is such that certain types of earthworks and quarrying activity are also captured by reporting and/or levy payment obligations.
There is an opportunity to refine and clarification the intended coverage, which should balance the need for sensible coverage with minimising the risk of levy avoidance
activity (ie, it is not desirable for regulations to either over- or under-include sites).
34
Review of the effectiveness of the waste disposal levy
Conclusions and
recommendations
The changes that were made to the levy from 2021 onwards were major, and they are still
being implemented. The regulated community grew substantially over the period of this
review, as did the quantum of levy revenue to be invested.
Recommendations
In order to support continued effective management of the levy, the recommendations are as
follows.
•
Continue ongoing efforts to ensure strategic investment of levy revenue by both central
and local government.
•
Ensure waste legislation better supports administration, collection and investment of the
levy.
•
Clarify the intended scope of the levy and reporting obligations (through regulatory
change proposals, or as part of the legislative change process in the previous
recommendation).
•
Consider options for better understanding and management of rural wastes.
Review of the effectiveness of the waste disposal levy
35
References
AK Research and Consulting. 2023.
2023 Behavioural Trend Monitoring Survey Of Waste
Minimisation Practices – A Quantitative Report for the Ministry for the Environment, June
2023. Prepared for the Ministry for the Environment by AK Research and Consulting.
Blumhardt H. 2022.
Reusable packaging in Aotearoa — getting back to the future. Mount
Maunganui: Reuse Aotearoa.
Brock J. 2020.
The Plastic Pandemic: COVID-19 trashed the recycling dream. A Reuters Special
Report. Retrieved 15 December 2023.
Colmar Brunton.
2018.
Environmental attitudes baseline. Prepared for the Ministry for the
Environment by Colmar Brunton.
Eunomia. 2018.
National Resource Recovery Project – Situational Analysis Report. Prepared for
the Ministry for the Environment by Eunomia Research & Consulting Ltd (NZ).
Eunomia. 2021.
Waste and Resource Recovery Infrastructure and Services Stocktake –
Summary Report. Prepared for the Ministry for the Environment by Eunomia Research &
Consulting Ltd (NZ).
Eunomia. 2023.
Waste and Resource Recovery Infrastructure and Services Stocktake and Gap
Analysis – Full Project Summary Report. Prepared for the Ministry for the Environment by
Eunomia Research & Consulting Ltd (NZ).
Fletcher Building. 2021.
Golden Bay Cement sustainable disposal solution for waste tyres a New
Zealand first. Retrieved 15 December 2023.
Horizon Research. 2022.
Packaging & Recycling Survey 2022. Prepared for The Packaging
Forum March 2022 by Horizon Research.
Keep New Zealand Beautiful. 2022a.
Illegal dumping. A review of international strategies and
best practice examples. Prepared for the Ministry for the Environment by Keep New Zealand
Beautiful.
Keep New Zealand Beautiful. 2022b.
National Litter Audit. November 2022. Auckland: Keep
New Zealand Beautiful.
Ministry for the Environment. 2019.
Reducing waste: a more effective landfill levy. Summary
document. Wellington: Ministry for the Environment.
Ministry for the Environment. 2021a.
Waste Minimisation Act 2008. Compliance, monitoring
and enforcement strategy. Wellington: Ministry for the Environment.
Ministry for the Environment. 2021b.
Waste Minimisation Act 2008. Enforcement decision-
making policy. Wellington: Ministry for the Environment.
Ministry for the Environment. 2021c.
Waste Minimisation Act 2008. Prosecutions policy. Wellington: Ministry for the Environment.
36
Review of the effectiveness of the waste disposal levy
Ministry for the Environment. 2021d.
Waste Minimisation Act regulatory performance
monitoring framework. Inaugural report 2020/21. Wellington: Ministry for the Environment.
Ministry for the Environment. 2021e.
National Plastics Action Plan for Aotearoa New Zealand. Wellington: Ministry for the Environment.
Ministry for the Environment. 2022a.
Regulatory performance monitoring framework report
2021/22. Waste Minimisation Act 2008. Wellington: Ministry for the Environment.
Ministry for the Environment. 2022b.
Transforming recycling: Consultation document. Wellington: Ministry for the Environment.
Ministry for the Environment. 2023a.
Waste Investment Panel. Retrieved 15 December 2023.
Ministry for the Environment. 2023b.
Improving household recycling and food scrap
collections. Retrieved 15 December 2023.
Ministry for the Environment. 2023c.
Research into attitudes to waste and recycling. Retrieved
15 December 2023.
Ministry for the Environment. 2023d.
Te rautaki para | Waste strategy. Getting rid of waste for
a circular Aotearoa New Zealand. Wellington: Ministry for the Environment.
Ministry for the Environment. 2023e.
Regulated product stewardship. Retrieved 15 December
2023.
Ministry of Business, Innovation & Employment. 2020.
Energy in New Zealand 20 – 2019
Calendar Year Edition. Comprehensive information on and analysis of New Zealand’s energy
supply, demand and prices. Wellington: Ministry of Business, Innovation & Employment.
OECD. 2022. The effects of the COVID-19 pandemic on plastics use and waste. In:
Global
Plastics Outlook: Economic Drivers, Environmental Impacts and Policy Options. Paris: OECD
Publishing.
Rabobank.
Foodwaste. Retrieved 15 December 2023.
WasteMINZ. 2018.
Love Food Hate Waste Campaign Evaluation. National Report October
2018. Auckland: WasteMINZ.
WasteMINZ. 2020.
Recommendations for standardisation of kerbside collections in Aotearoa.
Prepared for the Ministry for the Environment by WasteMINZ.
Wilcox J, Mackenzie J. 2021.
What we waste: Tracking 20 years of growth in international
drinks container wastage, and how refillables and deposit return systems can reverse this
trend. Brussels: Reloop.
Review of the effectiveness of the waste disposal levy
37