link to page 1
Capital, Coast, Hutt Valley & Wairarapa Travel survey 2023/24
P a g e |
1
Te Whatu Ora - Capital, Coast, Hutt Valley & Wairarapa Travel
Survey 2023/24
Main survey findings:
• Travel mode share for Capital, Coast, Hutt Valley & Wairarapa (CCHV&W) employees
travelling by car was 58%, for those travelling by public transport 18% and active travel 24%.
• For those travelling by car or van, 48% are parking on site (at work) and 39% are parking for
free at on or off-street locations.
• For those employees based at Wellington Regional Hospital (WRH), driving alone by car has
decreased from 47% to 38% from 2020 to 2024,
• Walking and cycling combined mode share at WRH is the same as last year at 30%
• 21% of employees are using public transport at WRH an increase from 17% in 2023.
1982
Introduction
The workplace travel survey was open to all Te Whatu Ora Capital, Coast, Hutt Valley & Wairarapa
employees. The online survey ran for six weeks from mid December 2023 to 26 January 2024, 1123
employees completed the survey (referred to here as 2024 survey). The results from previous travel
surveys have been included in this report to enable comparisons on travel mode share, parking and
alternatives for travel over the last three or four years. The survey findings will be used to inform
transport policy and initiatives for CCHV&W.
Who participated in the survey?
Approximately 14% of employees completed the survey from a range of Te Whatu Ora services in
under the OIA
the Wellington region, a summary is shown in
Table 1 below. The majority of participants, 66% were
based at Wellington Regional Hospital (WRH) with 15% from Hutt Hospital, 8% from Kenepuru
Hospital and other Porirua services and remaining 9% from Upper Hutt, Other and Wairarapa health
services.
Table 1: The main workplace for participants
Released
Te Whatu Ora Health services
Number
%
Hutt Hospital
169
15%
Kapiti Health Centre
24
2%
Kenepuru Hospital & Porirua Health services
87
8%
Wellington Regional Hospital
744
66%
Other
99
9%
Total
1123
100%
link to page 2
Capital, Coast, Hutt Valley & Wairarapa Travel survey 2023/24
P a g e |
2
Secondary workplace
Some employees work in more than one location, so a question on identifying secondary workplace
was introduced this year. This question asked employees to identify their main and secondary
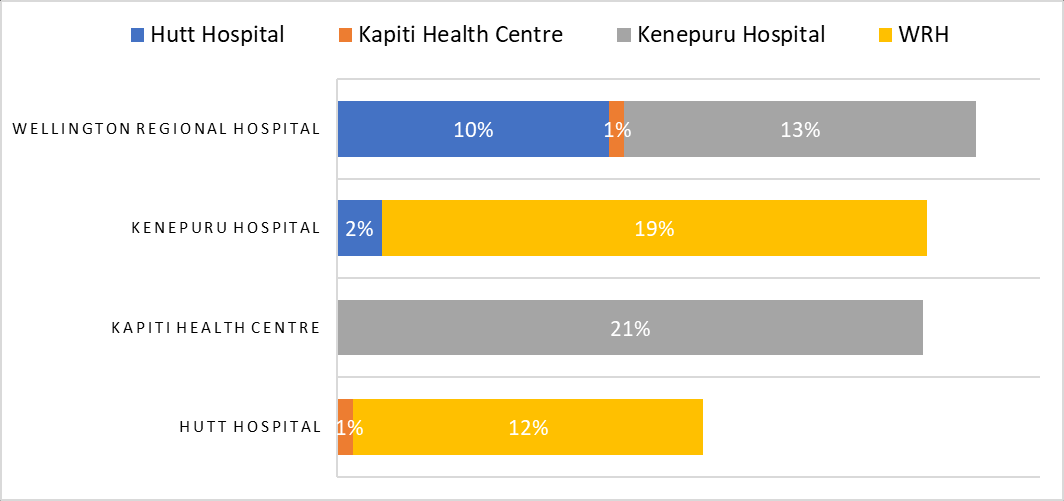
workplace (if applicable), 26% of employees identified two work locations.
In Figure 1 the primary
workplaces are listed on the left with the secondary workplace identified by the stacked column.
Results showed that 24% of Wellington Regional Hospital employees also worked at other hospitals
or health services, i.e. 10% also worked at Hutt Hospital, 1% at Kapiti Health Centre and 13% worked
at Kenepuru Hospital.
Figure 1: Primary and secondary workplace
1982
OIA
the
under
Released
link to page 3 link to page 3
Capital, Coast, Hutt Valley & Wairarapa Travel survey 2023/24
P a g e |
3
Occupational groups and shift work
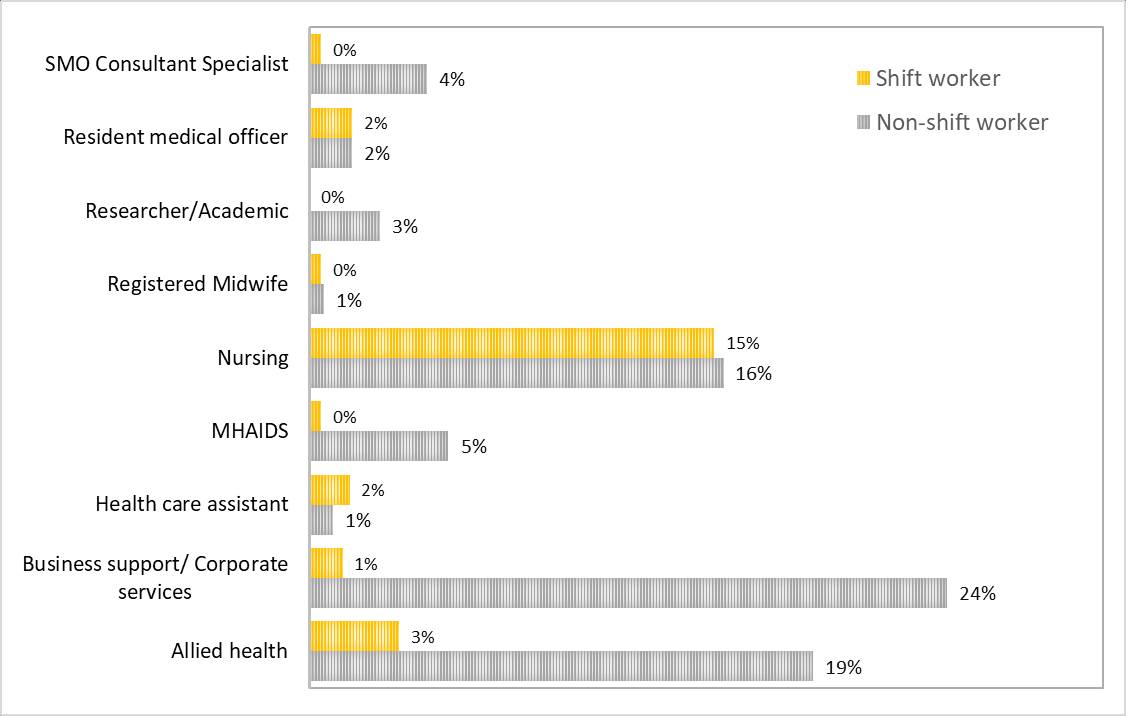
The main occupational groups represented in the survey were Nursing (31%), Business
support/Corporate services (25%), and Allied Health (22%).
Figure 2 shows that most participants, 76%, were working between 8am-5pm and 24% of the
participants were shift workers. The largest group of shift workers are nursing employees (15% of
respondents)
, Figure 2 shows that approximately half of the nursing employees are working regular
hours and the other half are employed in shift work.
Compared to previous surveys, the proportion of participants in the main occupational groups and
ratio of shift work to non-shift work have been consistently comparable from 2020 to 2024.
Figure 2: Occupational group by shift worker or non-shift worker (2024)
1982
OIA
the
under
Released
link to page 4
Capital, Coast, Hutt Valley & Wairarapa Travel survey 2023/24
P a g e |
4
Main travel mode to work
Participants were asked how they usually travel from home to work, specifically the travel mode
they used for the greatest part of their journey, this is used to estimate mode share for travel to
work (the proportion of people using each transport mode for their commute).
Travel mode share at Wellington Regional Hospital
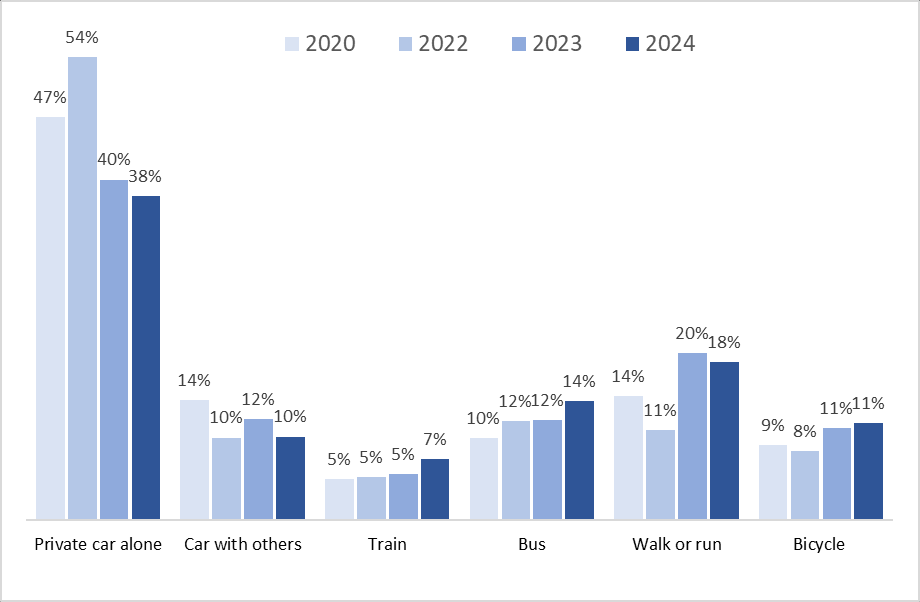
Figure 3 shows estimated mode share for employees at Wellington Regional Hospital (WRH)1 over
four surveys, between 2020 - 2024.
Main survey findings:
• The proportion of employees driving to work alone (private car) has dropped by 9
percentage points since 20202 to 38% in 2024.
• A small percentage increase in cycling over four surveys from 9% to 11% in 2024
• Bus mode share has consistently increased since 2020, now at 14% in 2024.
• Walking mode share has fluctuated since 2020, now above the 2020 result at 18% in 2024.
1982
Figure 3: Transport mode share for Wellington Regional Hospital employees (2020-24)
OIA
the
under
Released
1 This includes Newtown Community Health services.
2 The drop in mode share is statistically significant, P value<.05
link to page 5
Capital, Coast, Hutt Valley & Wairarapa Travel survey 2023/24
P a g e |
5
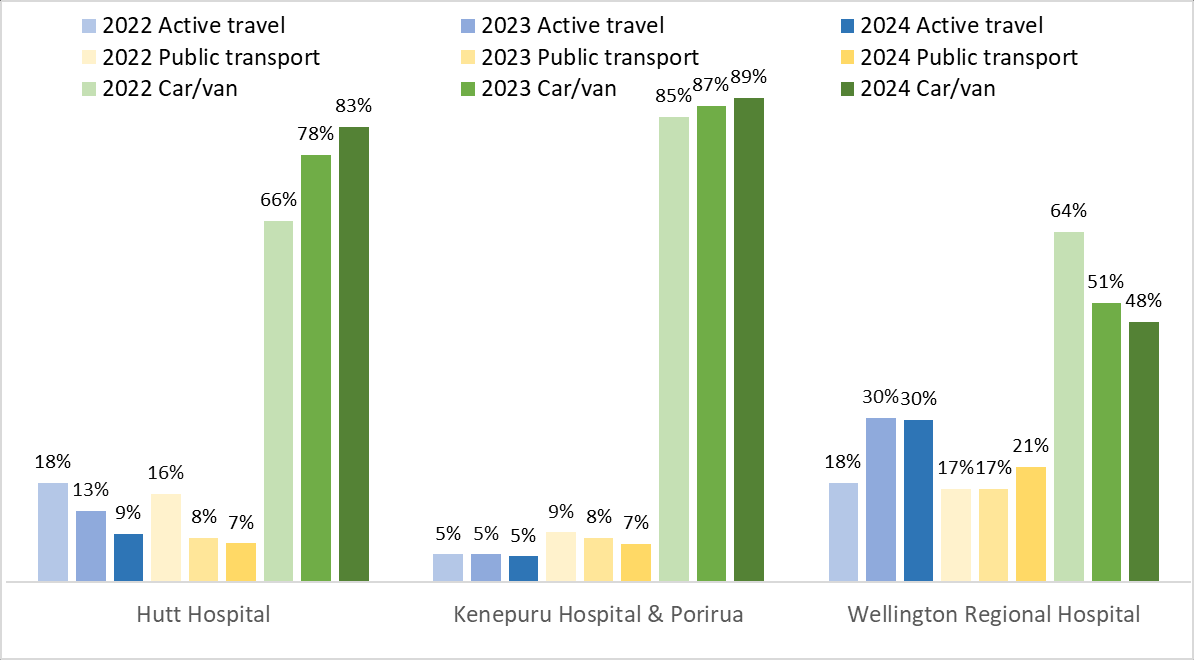
Mode share for three hospitals
The results for travel mode share were collated for three work locations (Wellington Regional
hospital, Hutt Hospital, Kenepuru Hospital & Porirua). The mode share summarised results for each
Hospital are shown in
Figure 4.
The travel mode share by Hospital shows that:
• There is a higher dependency on private car travel for Kenepuru, Porirua and Hutt Hospital.
• A relatively high proportion of employees are walking or cycling to work at WRH.
• Uptake in bus and train is increasing at WRH but decreasing at other hospitals.
There are a variety of reasons for the significant differences in mode share at different hospital
locations. Many factors go toward travel choice (by employees) for work trips. The following are
some of the reasons given (by survey participants) for choice of travel and summarised below.
• Low reliability of bus or train services, or no direct bus route to work
• Their car is used for transporting family members to school or work
• Cycling is not preferred due to the weather, safety concerns or no access to a bike
1982
• Availability of workplace and public cycling facilities (on-site secure bike storage, cycle lanes)
• Work is a short distance away so walking or cycling are an option.
• Train takes too long or there is a long walk to the station OIA
• Driving is the only option due to the distance I travel to work.
Figure 4: Main travel mode: Active travel, public transport and private car mode share by main
the
work location 2022 - 2024
under
Released
link to page 6 link to page 7
Capital, Coast, Hutt Valley & Wairarapa Travel survey 2023/24
P a g e |
6
Public Transport (PT)
Main survey findings:
• Those employees using either rail or bus are approximately 17% of the total workforce with
most working at WRH (combined PT mode share is 21% for WRH).
• 76% of PT users are employees working regular hours and 24% are shift workers.
• To access bus and rail services, 88% of employees walk to the bus stop and 42% walk & 39%
drive to the station.
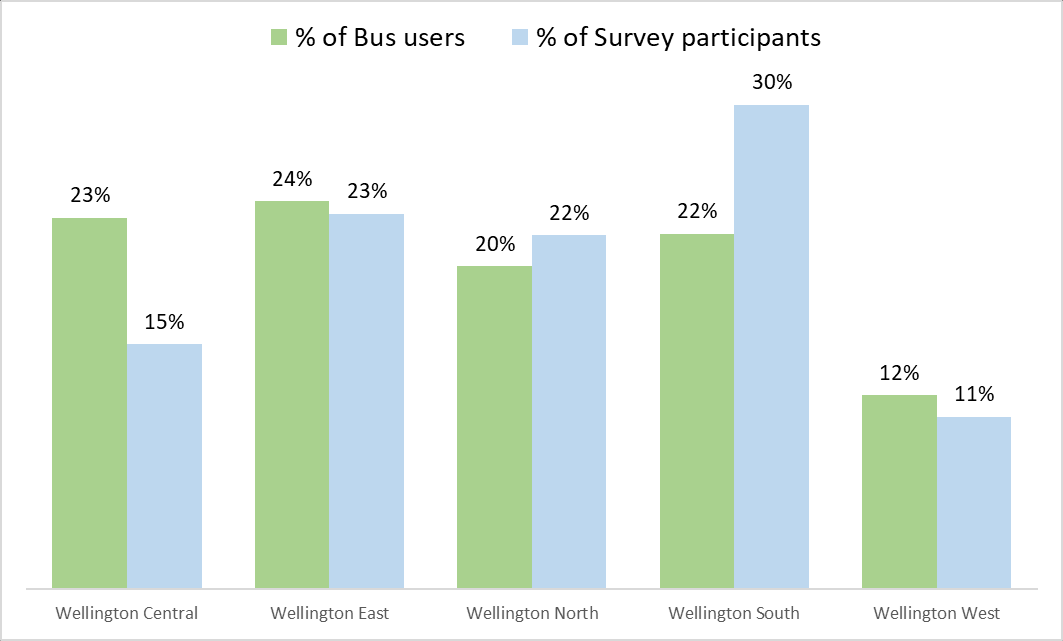
• Bus users are travelling from all sections of Wellington City for travel to WRH, shown in
Figure 5. Wellington South has less patronage compared to proportion of participants but is
also an area with a high proportion of employees walking and cycling to work.
• Those commuting by train to WRH mainly travel from Lower Hutt, Kapiti Coast and Porirua.
Figure 5: Home area for those travelling by bus to WRH (2024)
1982
OIA
the
under
Parking options for work
Survey participants who travel by private motor vehicle (as driver or passenger), were asked:
Where
do you usually park?
Released
Of the 640 respondents who travel by private car to work, on average, just under half were using on-
site employees parking (48%) and one third on-street parking for free (33%). Overall, 54% were
paying for parking (assuming on-site parking involves a fee) and 40% were using on or off-street free
parking.
Table 2 shows the usual parking option by work location (city/district). The table shows the
differences between city areas on the types of parking available to employees. For example: 40% of
employees are using on-site parking in Lower Hutt compared to 80% in Porirua and in Lower Hutt
free on-street parking is more available compared to all other city areas.
Compared to 2023, the estimated proportion of Wellington City employees (mainly WRH) parking on
the street for free has increased from 24% to 36% and off-street parking has decreased.
link to page 7 link to page 7
Capital, Coast, Hutt Valley & Wairarapa Travel survey 2023/24
P a g e |
7
Table 2: Usual parking location for employees by city area (2024)
Parking category
Hutt Valley
Porirua
Wellington City
I don't park, I get dropped off
6%
1%
7%
I pay for private parking
0%
0%
3%
Off street parking - free
7%
9%
4%
Off-street parking - metered/permit
1%
1%
0%
On site or Hospital staff parking
40%
80%
46%
On street parking - free
44%
8%
36%
On-street parking - metered/coupon
1%
0%
3%
Visitor parking
0%
0%
2%
Total
100%
100%
100%
Note: Other districts Kapiti Coast, and Wairarapa are not included due to low participant numbers.
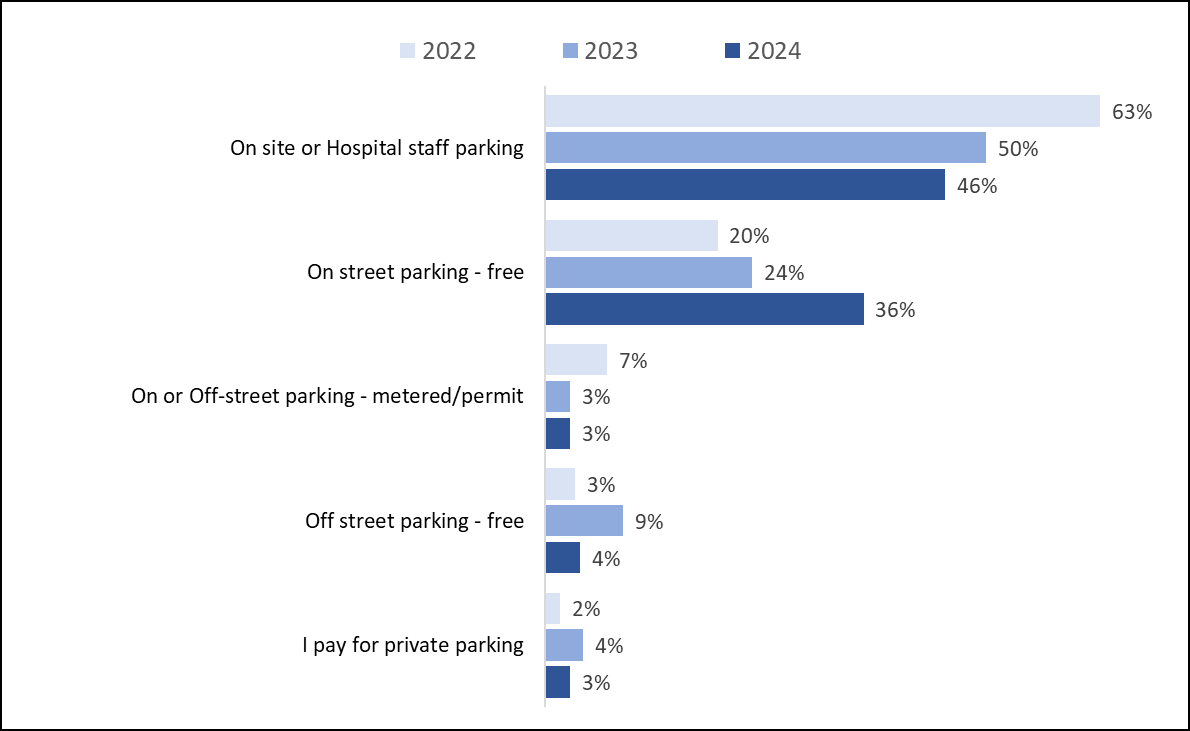
Figure 6 shows the usual parking for those working at Wellington Regional Hospital (WRH) for the
last three surveys. In the on-site parking category there is a significant drop in the proportion
parking on-site, from 63% to 46% from 2022 to 2024 (the changes in the last year are not
1982
significant).
The utilisation of on-site parking spaces by Hospital employees has increased over the last year, the
daily average is now 92%3 (up from 73%). Showing that on-site carparks are more likely to be
OIA
occupied compared to 2023.
For on street parking,
Figure 6 shows the proportion of employees parking on the street has
increased from 20% to 36% since 2022. Only 3% using on-street parking pay for parking.
the
Figure 6:Type of parking used by those based at Wellington Regional Hospital (2022-24)
under
Released
3 This statistic was provided by Hospital & Specialist Services, Capital Coast, Hutt Valley & Wairarapa
link to page 9
Capital, Coast, Hutt Valley & Wairarapa Travel survey 2023/24
P a g e |
8
Parking zones in Newtown
The Newtown area outside the hospital was divided into zones, with the aim to identify common
areas used (by employees) for on-street and off-street parking. Five zones around the hospital were
marked on a map and employees parking off-site were asked to select the zone where they usually
found a parking space.
Results showed that zone 1 was the likely area for parking (41%) followed by Zone 2 (28%), 8% of
drivers usually parked outside the five zones.
Table 3: Parking zones in Newtown
Parking zones in Newtown
2023
2024
Usually outside these zones
14%
8%
Zone 1 - east of Riddiford street & north of Constable Street
42%
41%
Zone 2 - west of Riddiford street & north of Te Wharepouri & Luxford Streets
23%
28%
Zone 3 - east of Riddiford Street & south of Constable Street
18%
19%
Zone 4 or 5 - east & west of the Berhampore shops & sth of Te Wharepouri St.
3%
0%
I don’t park, I get dropped off.
0%
4%
1982
Total
100%
100%
OIA
Alternative modes of transport for your commute?
Participants were asked if they would be willing to try alternative ways of travelling to work even for
the
one or two days per week.
Comments submitted by employees showed that many were using bus or rail on a few days per
week, or they were considering changing their travel for some days each week. Such as: carpool, or
walk and bus, or saving up to purchase an e-bike.
under
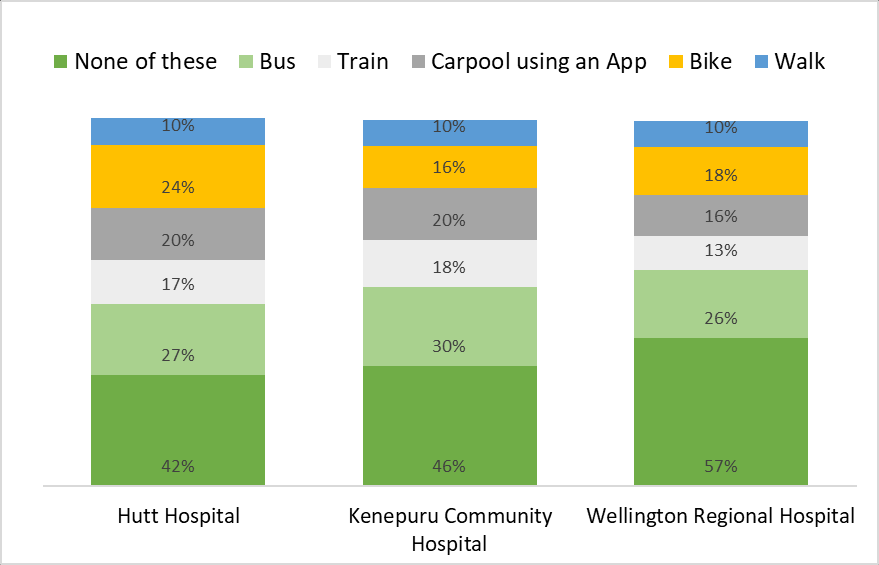
Figure 7 shows the results for those employees who are driving alone to work, (49% of all survey
respondents). Results show that by bus and bike were the most popular alternative choices for
travel, closely followed by Carpooling. Approximately half of participants identified at least one
alternative travel mode and half did not want to try any other travel modes.
Released
link to page 10 link to page 10
Capital, Coast, Hutt Valley & Wairarapa Travel survey 2023/24
P a g e |
9
Figure 7: Proportion of participants who drive and would consider alternatives to their usual mode
of transport.
1982
OIA
the
The results for the three hospitals, show small differences (between them) in their choice of
alternative modes:
• Biking was a more popular alternative mode at Hutt Hospital
• Bus was the most popular alternative at Kenepuru Hospital
under
• Compared to the 2022 survey findings there was a decrease in those choosing public
transport but an increasing interest in active transport.
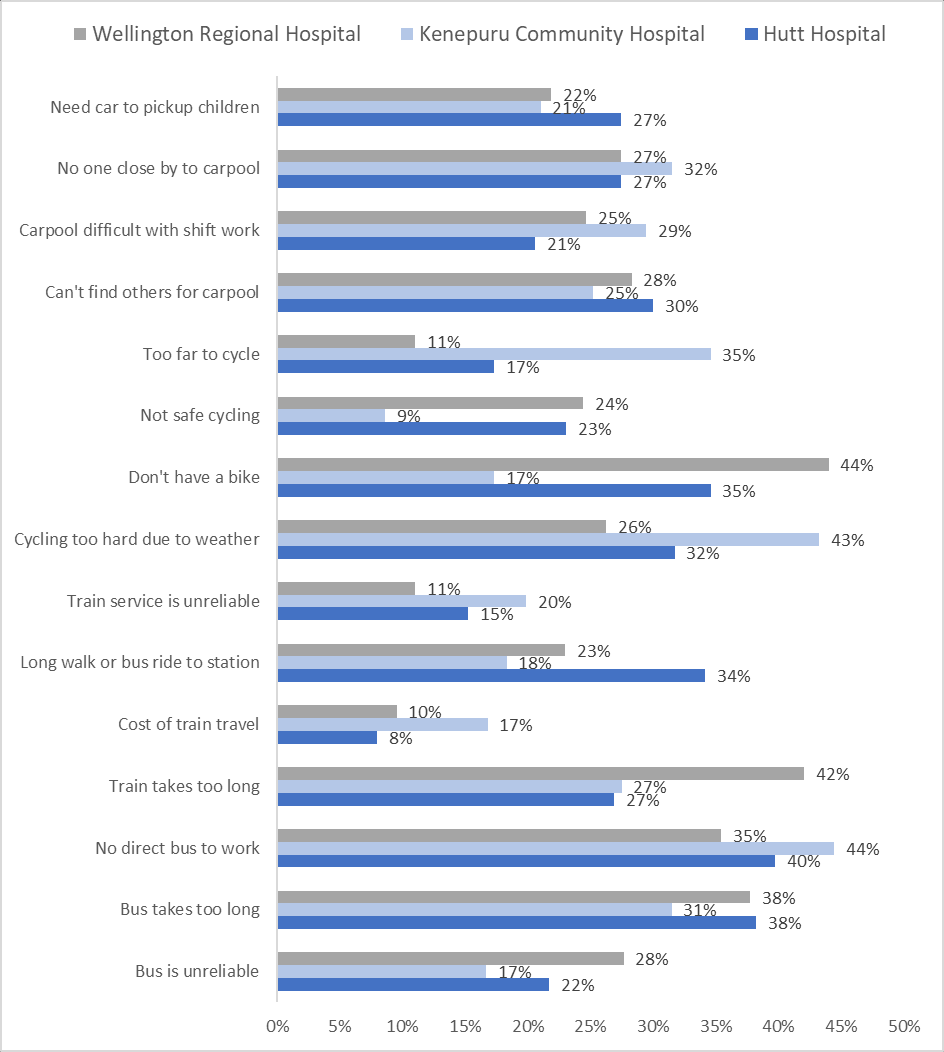
Reasons for not choosing to travel by bus, train, bike or walk
As outlined in the previous section, participants were asked which modes they would consider using
as an alternative to their usual travel mode. Following this, participants were asked the main reasons
they don’t currently travel this way. A list of options was provided for this question and these results
are shown in
Figure 8.
Released
There are many reasons given for why some modes are not suitable for commuting
Figure 8 displays
the major reasons provided by respondents by their main work location. Examples of Other reasons
were: “Its quicker to bike”, “the bus doesn’t run at appropriate times”, “My work hours are different
to others”.
Capital, Coast, Hutt Valley & Wairarapa Travel survey 2023/24
P a g e |
10
Figure 8: Reasons for not using other travel modes more often by main work location (2024)
1982
OIA
the
under
Released
link to page 11 link to page 11 link to page 11
Capital, Coast, Hutt Valley & Wairarapa Travel survey 2023/24
P a g e |
11
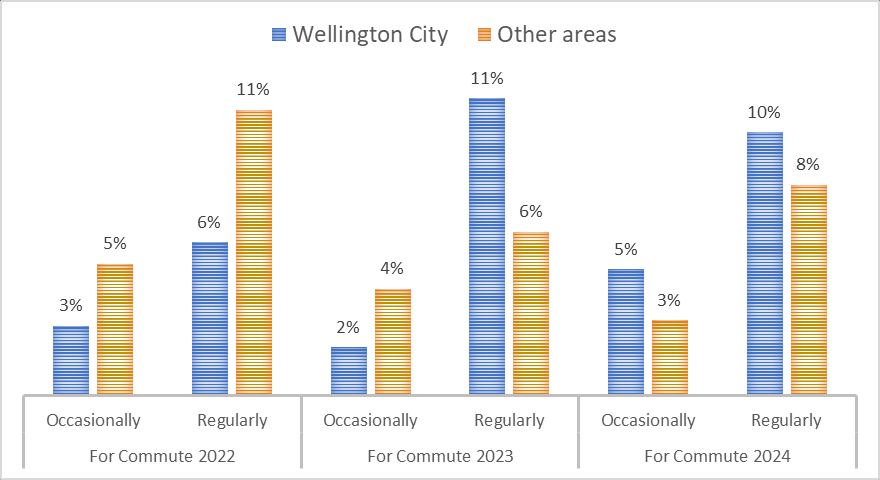
Cycling to work or cycling for recreation
Participants were asked - In the last month have you used any of the cycle paths for your journey to
work or for recreation?
Figure 9 shows the number of employees cycling to work occasionally or
regularly and using the cycle paths. The mode share results show 11% of employees are cycling to
work in Wellington City area and 5% employees are cycling to work in other areas (average).
Figure 9
shows that occasional cyclists using cycle paths have decreased slightly since 2022. The proportion
of cyclists regularly commuting on cycle paths in Wellington City in 2024 has been stable in the last
year but increased by 4 percentage points from 2022 to 2024.
Figure 9: The proportion of participants using the cycle paths on their way to work (2022-2024)
1982
OIA
the
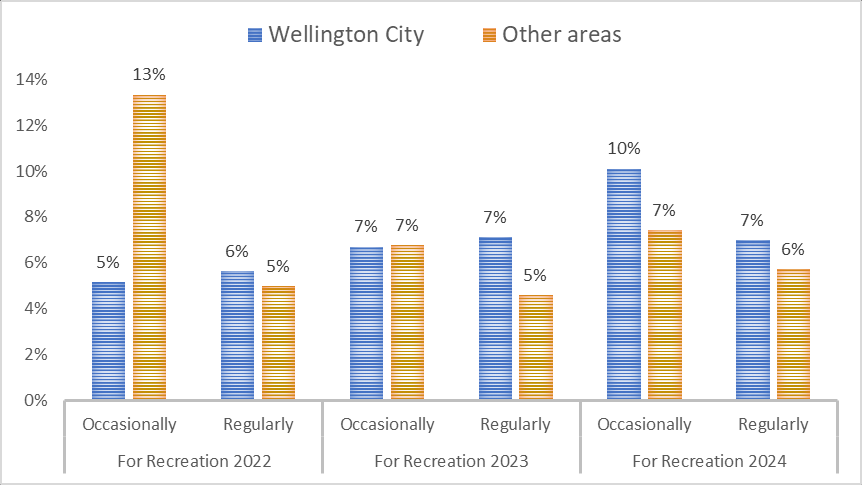
Cycling for recreation
under
Figure 10 shows cyclists that use the cycle paths for recreation in Wellington City and other areas.
Cycling in Wellington City has increased for recreation from 2022 to 2024 for both occasional and
regular users.
Figure 10: The proportion of participants using cycle paths for recreation.
Released
link to page 12
Capital, Coast, Hutt Valley & Wairarapa Travel survey 2023/24
P a g e |
12
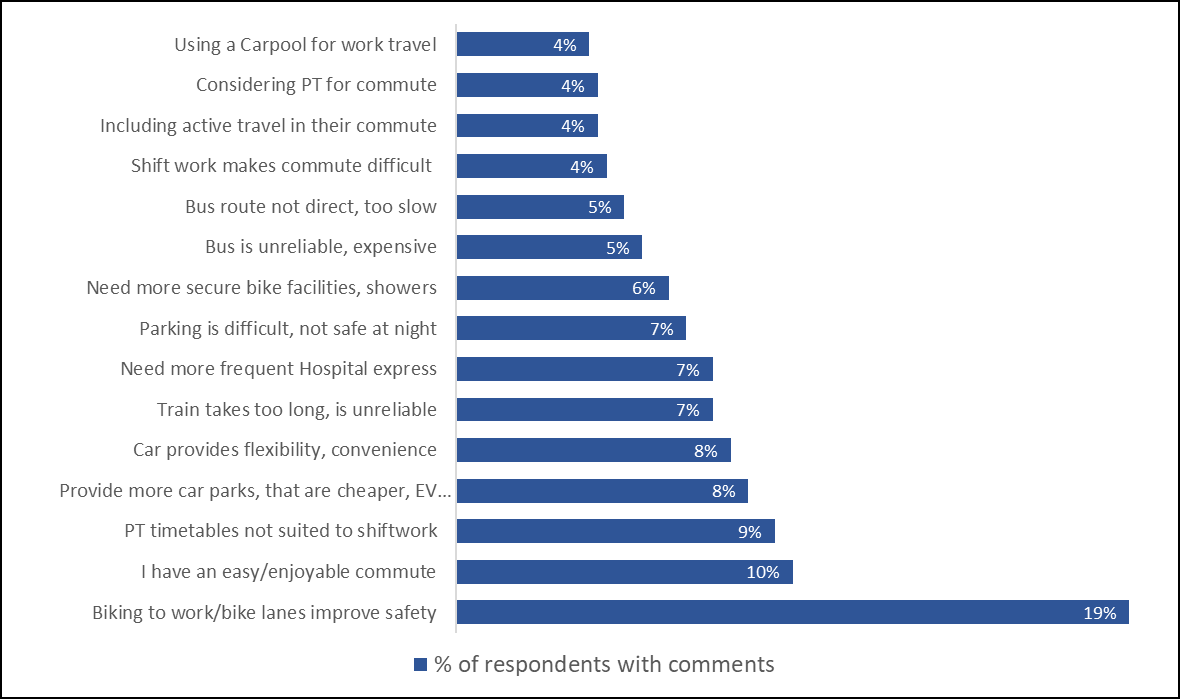
General comments
Survey participants were asked if they would like to comment on any aspect of their workplace
travel, 36% of participants provided comments on a range of topics. These have been collated into
common areas of feedback
in Figure 11 below. Many people commented about: public transport
services, needing a car for travel, difficulties parking, how they enjoyed walking or cycling, or
concerns about safety.
The topics most frequently commented on in the 2024 survey were common to other surveys: their
positive experience as a cycling commuter, saving for an e-bike, less choices for travel as a shift-
worker, bus frequency and reliability, the difficulties with parking etc.
Examples of typical comments:
The new bike lanes make it much easier for me to bike to work and it's much faster than taking the
bus.
I enjoy my daily commute as it gives me regular exercise.
I am a shift worker who has to juggle childcare drop off and pick up, as I live in the Hutt the only
1982
feasible way for me to get the WRH is by private car.
Very concerned for employees parking around the Newtown & Berhampore area when the new
parking restrictions come in.
OIA
Being a shift worker, i don’t need the stress of waiting for the bus, or carpooling.
Trying to get to work by public transport is currently too unreliable and takes too long. Otherwise I
the
would consider it.
I am hoping to have an E-bike to ride to work next year.
Figure 11: General comments about travel to work under the following headings
under
Released