
CLASSIFICATION
Update to NZ ETS and ERP2 policy model ing
Recommendations
We recommend that you:
a.
note officials have model ed the impact of key policies being developed for ERP2, and
potential impact of the NZ ETS at dif erent auction volumes
b.
note the impact of key ERP2 policies have been reflected in the draft Discussion
Document that has also been separately provided to you today
c.
forward the at ached slide deck to CPMG Ministers
Yes | No
Signatures
Hemi Smiler
General Manager
Climate Change Mitigation
13 June 2024
Hon Simon WATTS
Minister of Climate Change
Date
BRF-4913
CLASSIFICATION
2
CLASSIFICATION
9. The modelling of ERP2 policies is preliminary and based on a series of assumptions.
These wil be refined before the final ERP2 so are likely to change before the end of the
year. As outlined in BRF-4753, we are working with agencies to quantify as many of the
remaining ERP2 policies as possible for the final plan.
Budgets and targets
10. Our modelling produces a projected range of possible emissions. The range captures
different scenarios about how the future might play out and is constructed by changing
different input assumptions within the ENZ model. Our 'central scenario' is the scenario
that, in our judgement, uses the assumptions that are most likely to hold true. As a
result, we have used this scenario to provide analysis on sufficiency.
11. Using the latest ENZ model, and based on assumptions as of 12 June 2024, our latest
projections indicate:
i
EB1 - emissions are between a range of 278-286 Mt with a central scenario of 282
Mt that is
better than the budget of 290 Mt.
ii EB2 – emissions are between a range of 287-323 Mt with a central scenario of 305
Mt that is the
same as the budget of 305 Mt. With the inclusion of preliminary
estimates on impact of new ERP policies
the central scenario drops to 301 Mt.
iii 2030 methane target – emissions are between a range of 6-16 per cent reduction
from 2017 with a central scenario of 11 per cent reduction that is
slightly better
than the target of 10 per cent.
12. For EB2, this is an improvement from a range of 291-327 Mt with a central scenario of
309 Mt from the advice we provided in May (BRF-4753).
13. This is a change from both our previous ENZ-based projections and our traditional
sector-based modelling projections. There are a variety of reasons for these changes,
including changes in modelling approach and input assumptions such as:
i
revision downward of livestock population in Statistics New Zealand’s Agricultural
Production Survey
ii significantly reduced afforestation intentions as based on the 2023 Af orestation and
Deforestation Intentions Survey
iii changes in Government policy.
NZ ETS Settings
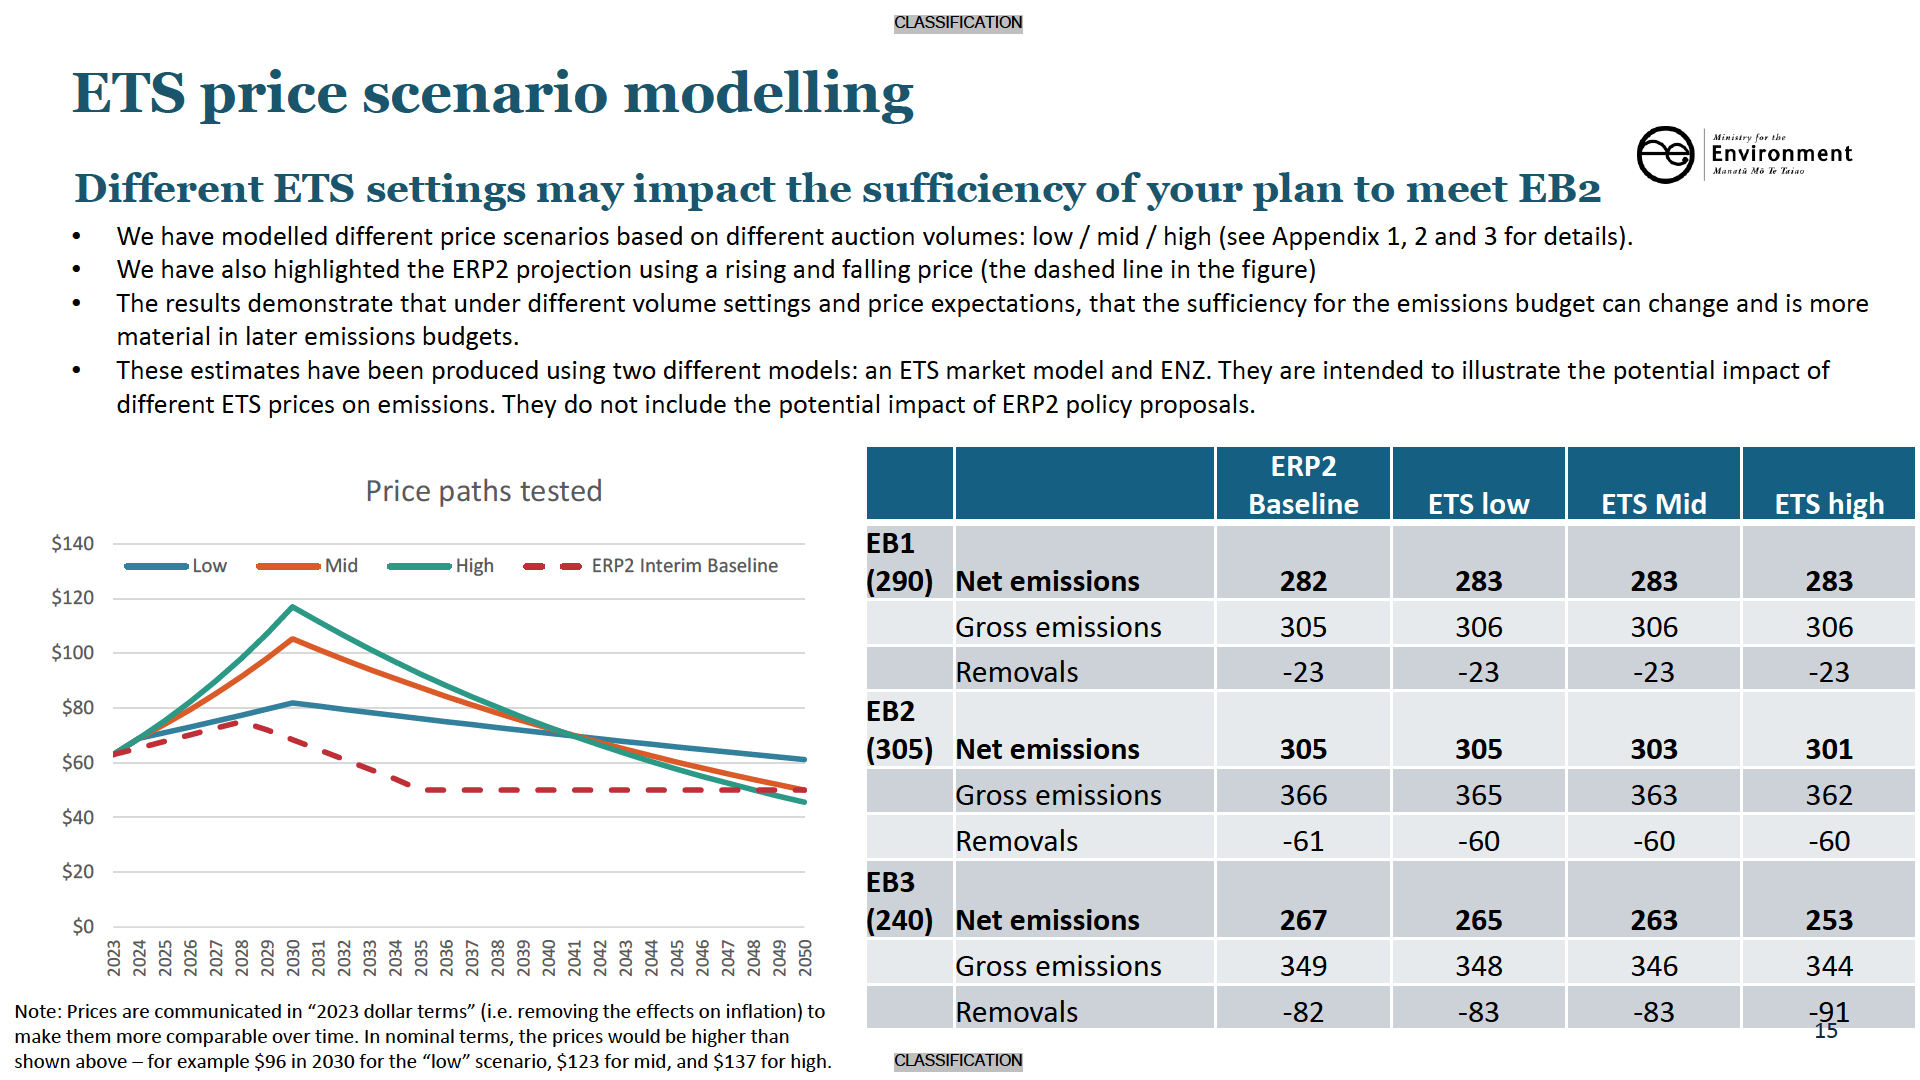
14. To help understand the possible impact of NZ ETS settings decisions on sufficiency (via
differing NZ ETS prices), we have also modelled the impact of dif erent NZ ETS volume
settings and the price pathways those volume settings may generate. This is presented
for il ustrative purposes only, and these are not necessarily the options that Ministers wil
be asked to consider in NZ ETS settings decisions due in August 2024. Those options
wil reflect feedback received during consultation and the most up-to-date information
available.
15. NZ ETS settings scenarios have a material impact on the delivery of EB2:
BRF-4913
CLASSIFICATION
4
CLASSIFICATION
Next steps
24. We have separately provided to you today an updated Cabinet Paper and Discussion
Document that include this new information (see BRF-4859). We expect Ministers to
have significant views to step through in ministerial consultation and in Cabinet that may
take time to work through.
25. To help deliver the final ERP2 needs by the end of the year, we recommend you begin
ministerial consultation on the draft ERP2 Discussion Document during the week starting
17 June 2024.
BRF-4913
CLASSIFICATION
6

CLASSIFICATION
Key points
Ministers need to be confident in the policies they will take to the public on ERP2
•
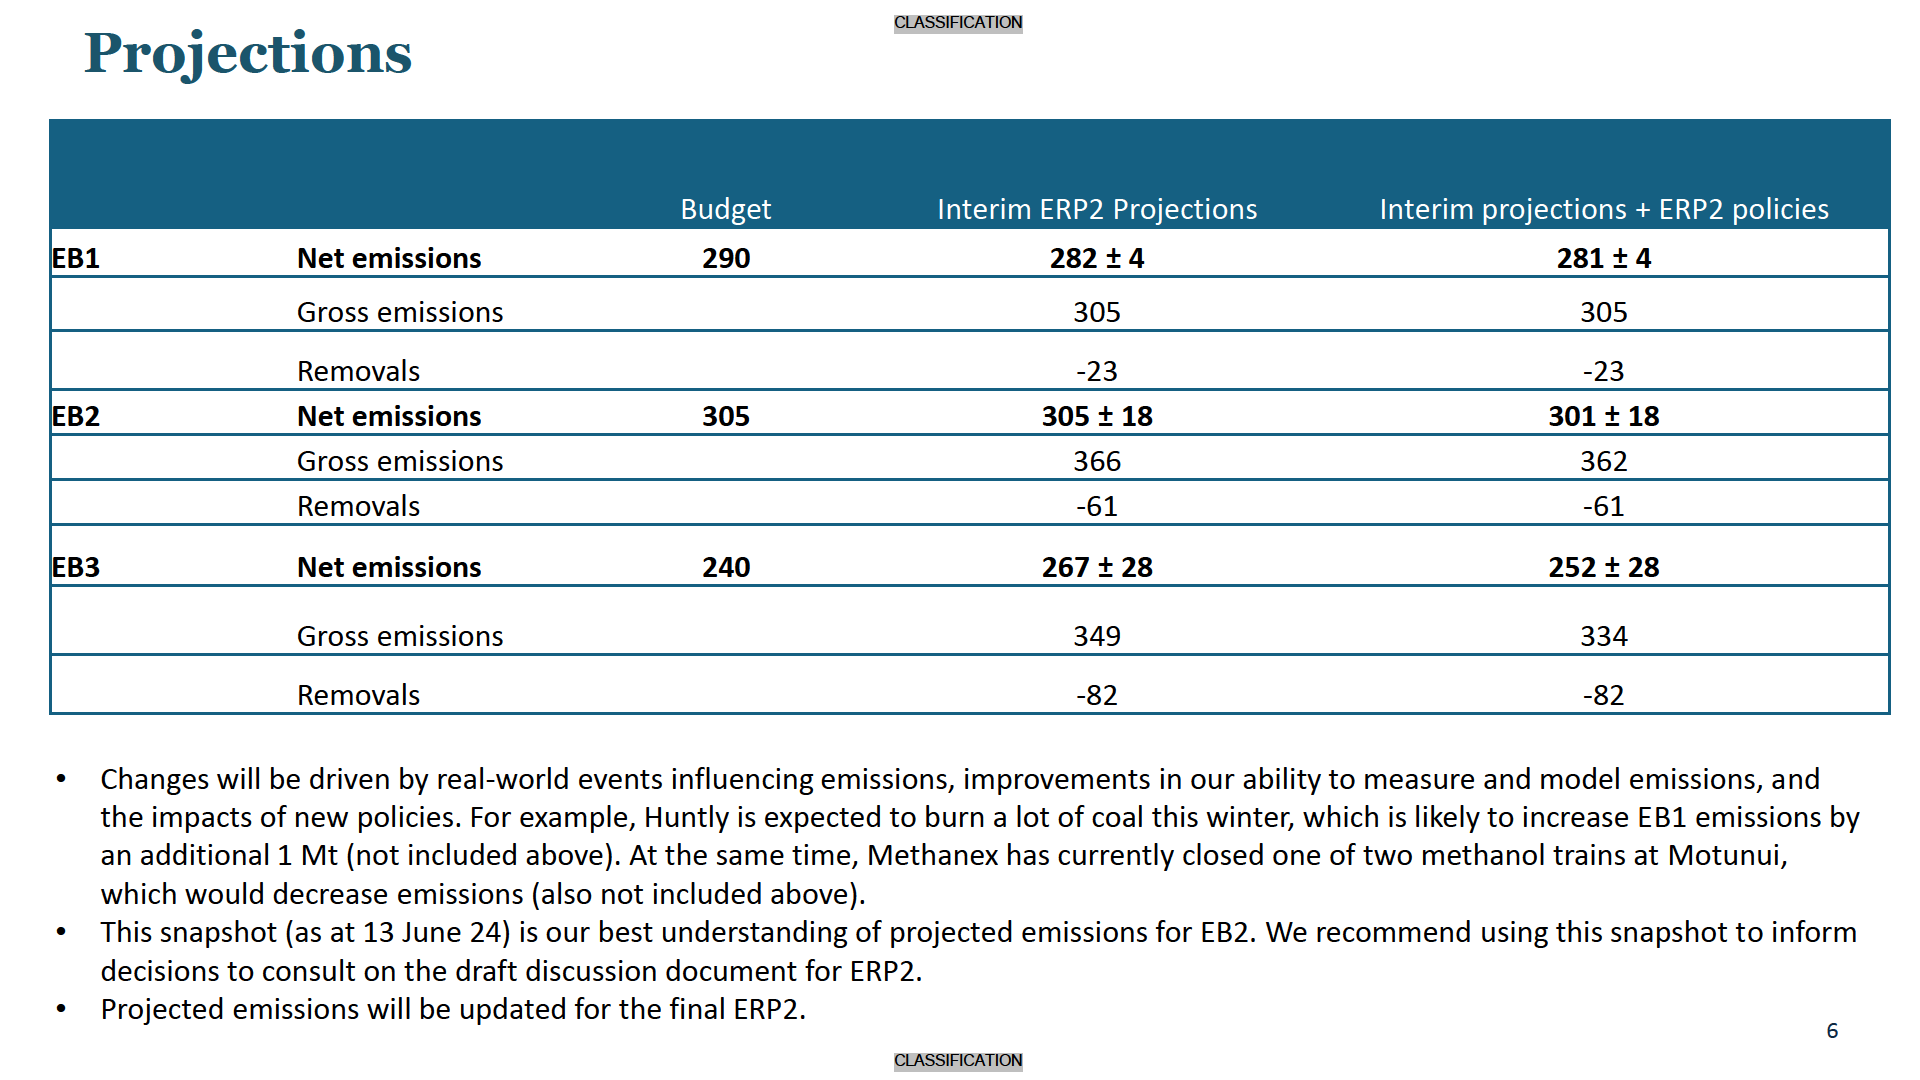
Interim projections indicate New Zealand’s emissions can stay within the first and second emissions budget (EB1) and (EB2) but are not
currently forecast to be within the third emissions budget (EB3).
•
The central estimate of expected emissions in EB2 is 305Mt, which is the limit for EB2. There is an uncertainty range for this estimate of
+ or – 18Mt.
•
New policies proposed for ERP2 suggest that they could contribute 4 Mt of reductions towards EB2 and 15 Mt towards EB3.
•
The impact of new policies on the central estimate in EB2 is 301 Mt, with an uncertainty range of + or – 18 Mt.
•
The modelling of new ERP2 policies is preliminary. We expect the estimates to move around as the modelling is improved.
•
Ministers need to consult on ERP2 before taking final decisions in December 2024. To do this, Cabinet will need to agree to consult on
the discussion document for ERP2 before the July recess. There is not much time.
• Meeting emissions budgets will be tight. Projections are uncertain and can change based on external factors (eg dry/wet years,
commodity prices), improvements in measuring emissions, and successful implementation of policies. Managing a tight margin where
changes occur frequently requires risk management.
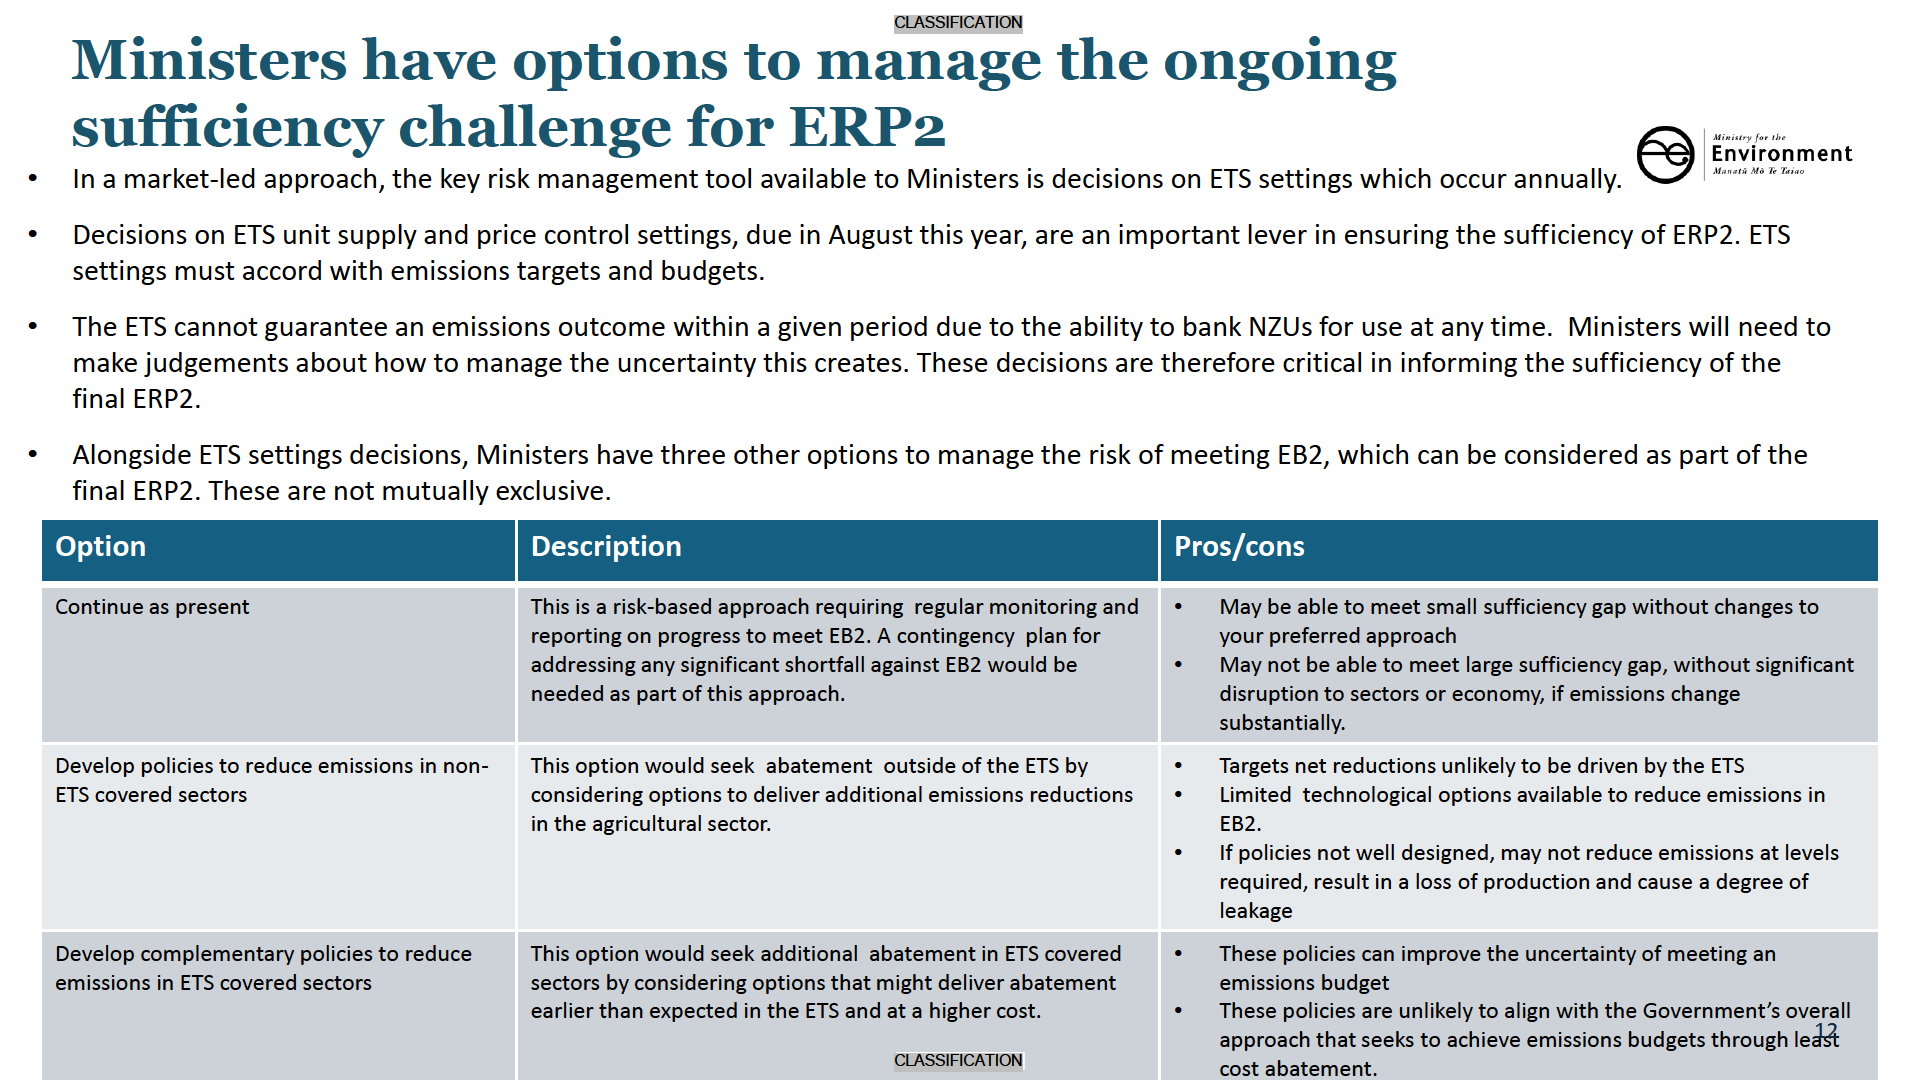
• Ministers have choices to manage uncertainty in a price-led strategy including:
a)
Decisions on the ETS settings as the Government’s key lever, now and over time
b)
Direction that officials develop policies, through public consultation and beyond, to give Ministers other complementary policy options.
2
CLASSIFICATION

CLASSIFICATION
The Government’s approach to ERP2
A market-led approach is preferred for ERP2
• Reducing net greenhouse gas emissions is one of nine public sector targets recently announced by the Prime Minister (Target
9). This target is:
•
On track to meet New Zealand’s 2050 net zero climate change targets with total net emissions of no more than 290 Mt CO2e from 2022 to
2025 and 305 Mt CO2e from 2026 to 2030.
• The Government needs to deliver New Zealand’s second emissions reduction plan (ERP2) by the end of the year, which will be
its plan to meet EB2 and Target 9.
• We understand that Ministers’ preferred approach to meet EB2 and Target 9 is to rely heavily on the New Zealand Emissions
Trading Scheme (ETS) to reduce net emissions at least cost.
• Alongside the ETS, enabling policies have been proposed for ERP2 to address market barriers.
• Methane emissions in agricultural and some parts of the waste sector are not covered by the ETS. We understand Ministers
intend to prioritise a technology-led approach, like supporting research & development, to reduce emissions in these sectors.
4
CLASSIFICATION

CLASSIFICATION
How we are tracking towards EB2
• Interim projections have been developed to provide greater clarity on the sufficiency of ERP2.
• They show we can stay within the first and second emissions budgets.
• For EB1, net emissions are projected to between a range of 278-286 Mt with a central scenario of 282 Mt. This is 8 Mt below
the budget of 290 Mt.
• Any over-achievement of EB1 can be ‘banked’ for use in EB2, if the Minister of Climate Change decides, after the emissions
budget period has finished and the Minister has considered the Climate Change Commission’s “true-up” report on EB1 and
accompanying advice.
• For EB2, net emissions are projected to between a range of 287-323 Mt with a central scenario equal to the budget of 305 Mt.
• When we include the impact of ERP2 policy proposals, net emissions are projected to between a range of 283-319 Mt with a
central estimate of 301 Mt. This is 4 Mt below EB2 limit of 305 Mt.
• Our modelling is ongoing, but the interim projections indicate biogenic methane emissions are below the 2030 target of 10 per
cent reduction below 2017 levels.
5
CLASSIFICATION

CLASSIFICATION
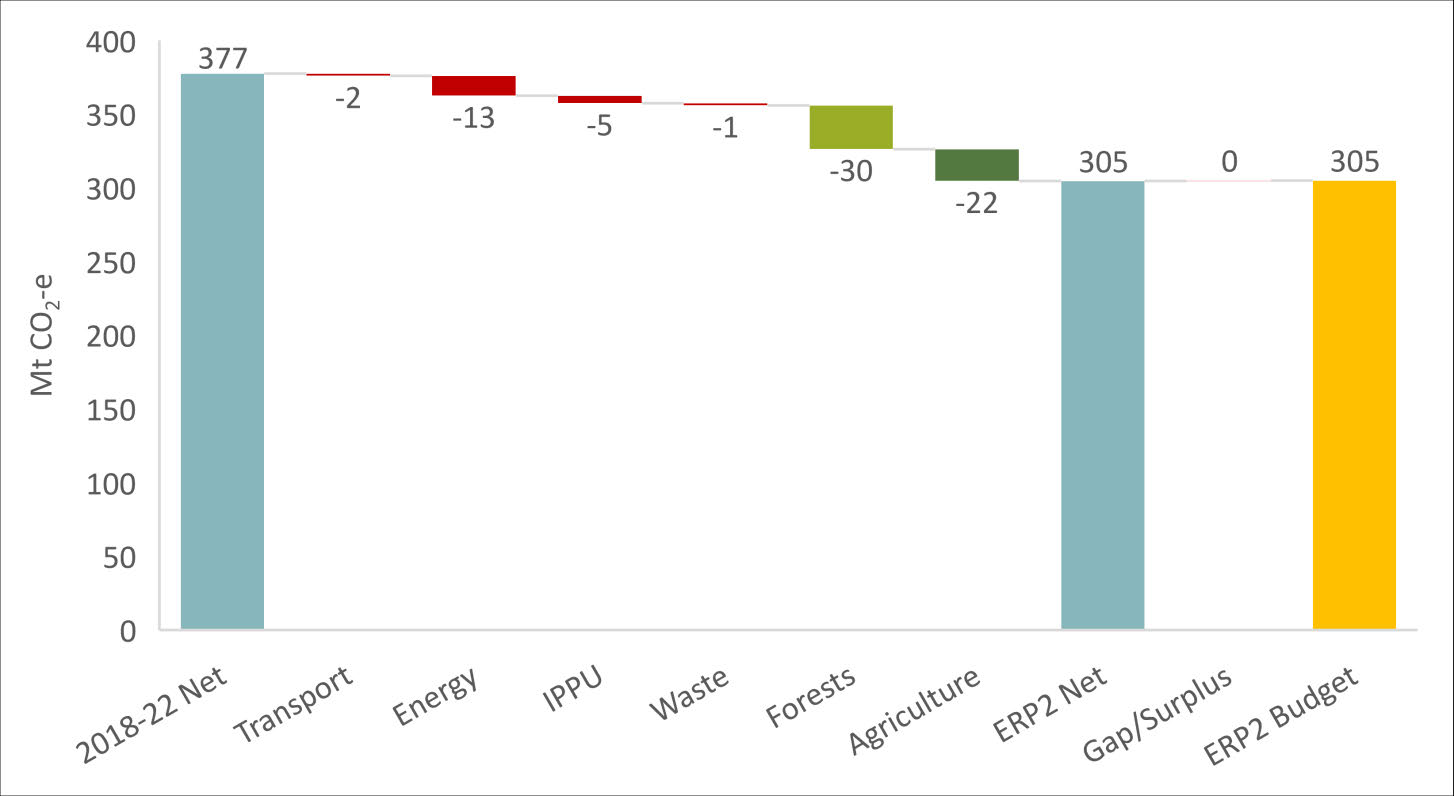
Interim sector projections for EB2
• The above graph shows projected reductions in emissions by sector through to the five-year second
emissions budget period.
• The projected reductions are compared to a baseline of average net emissions over the period 2018-
2022.
7
CLASSIFICATION

CLASSIFICATION
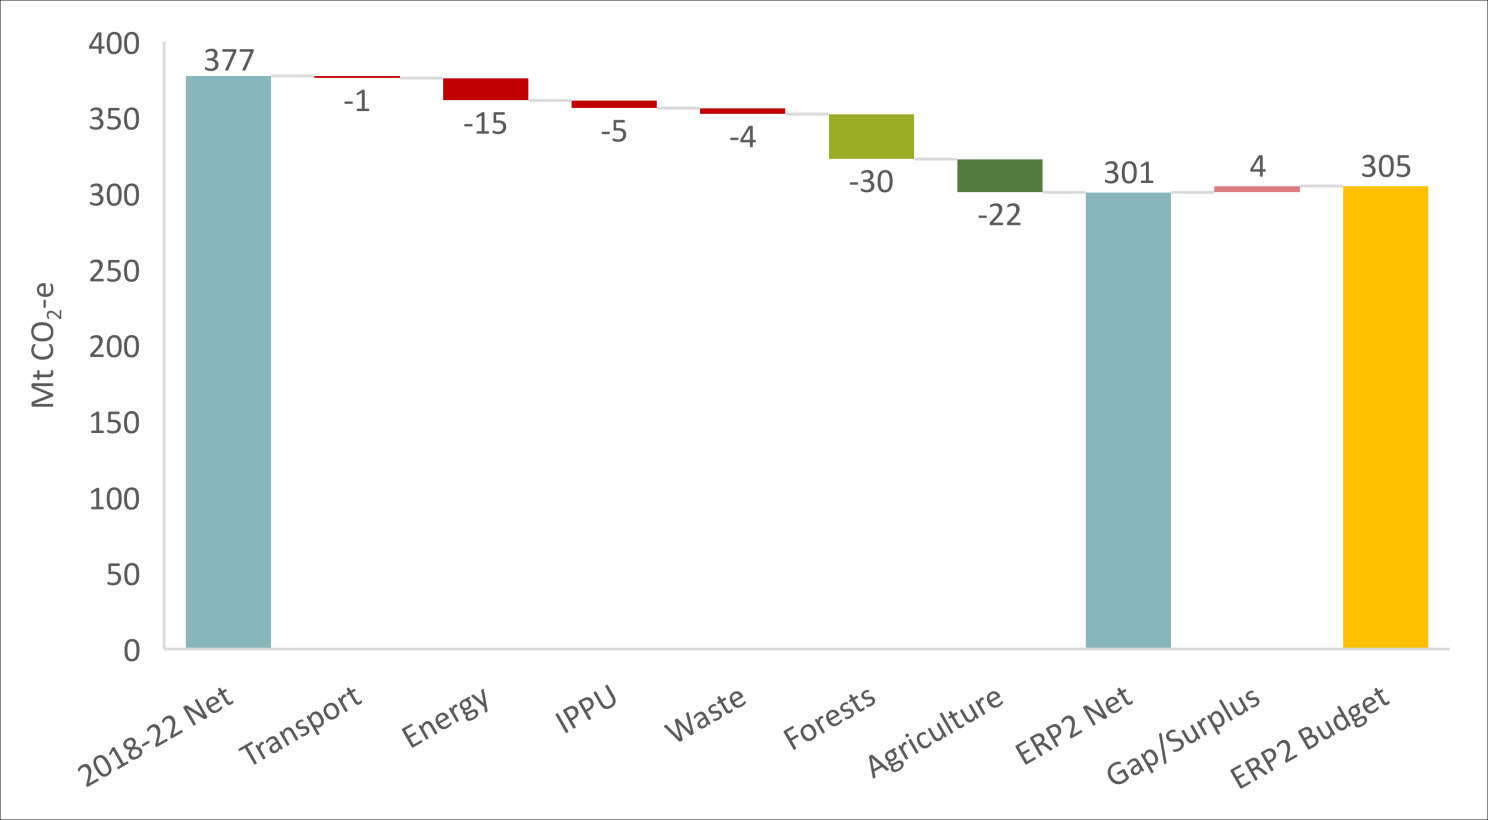
Interim sector projections + ERP2 policies for
EB2
8
CLASSIFICATION

CLASSIFICATION
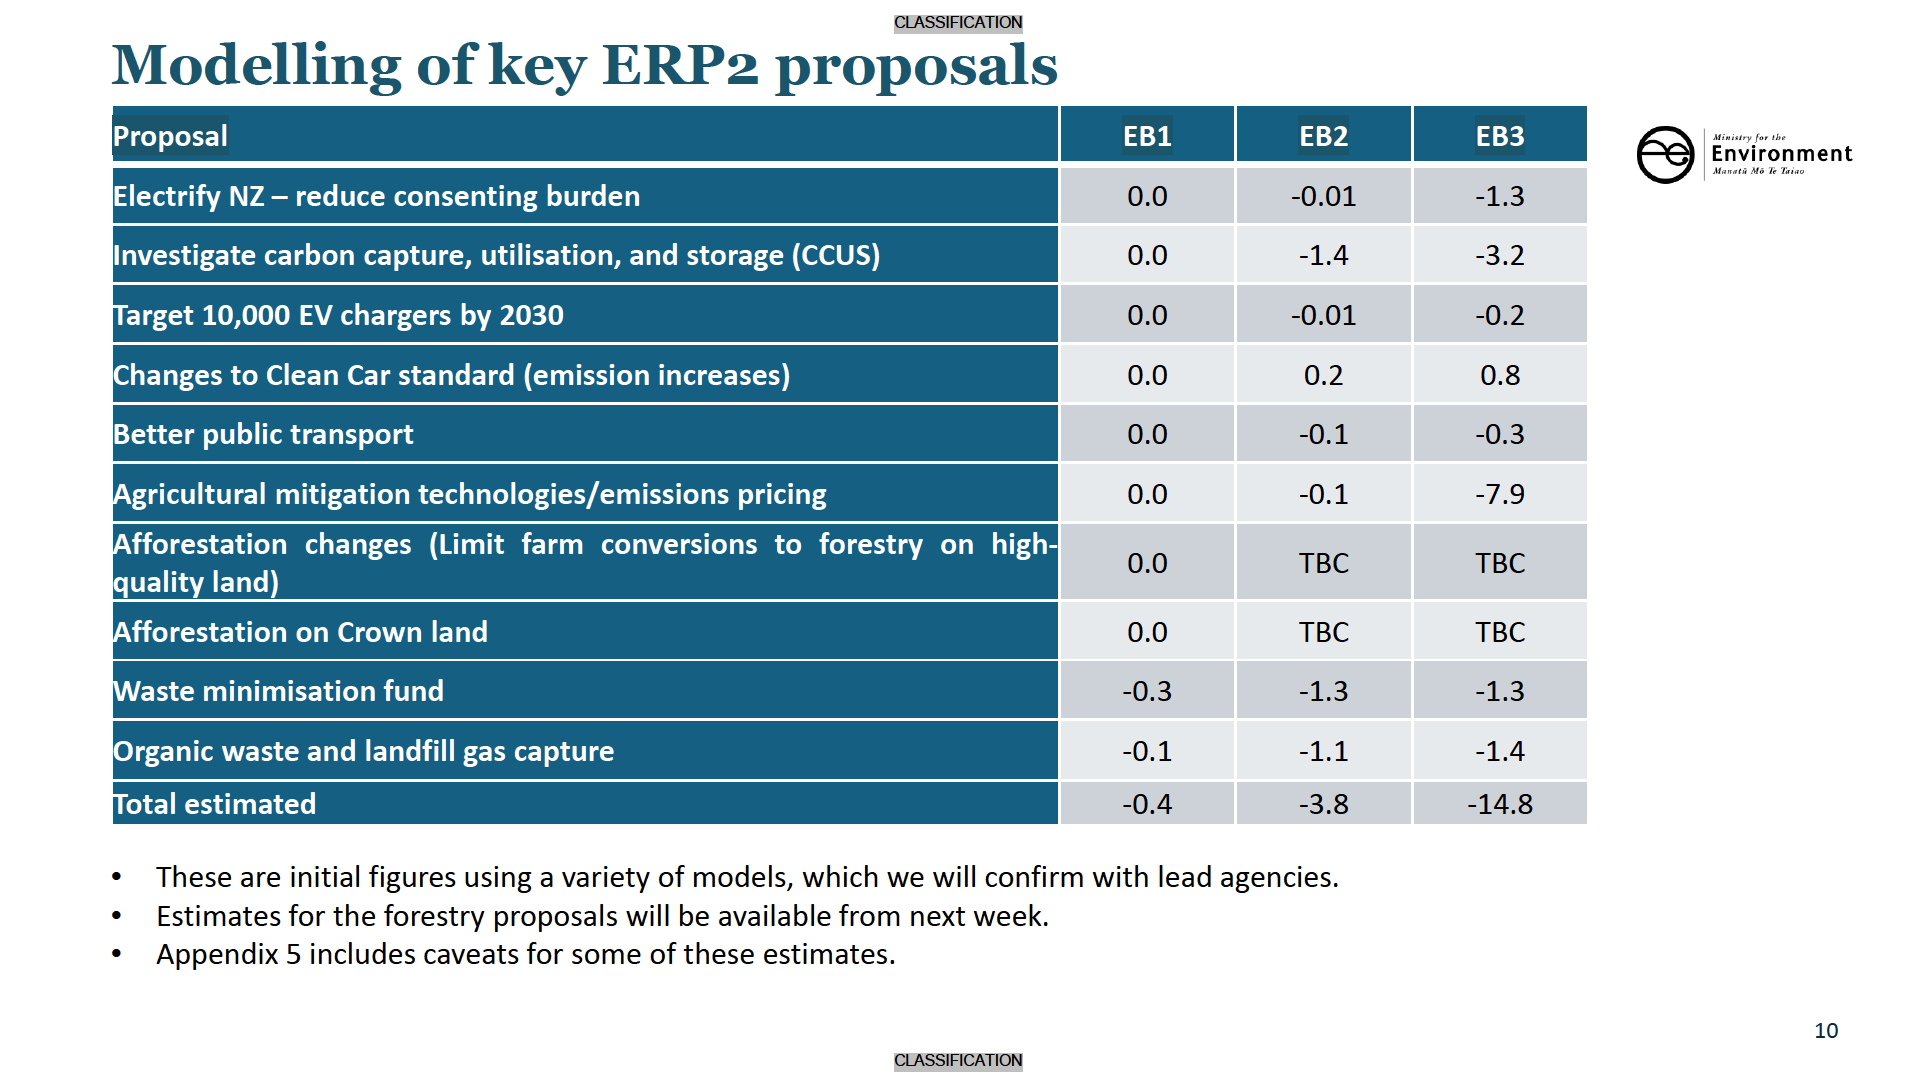
The impact of key ERP2 policies
The Government’s new policies for ERP2 contribute up to 4Mt for EB2 and 15Mt
for EB3
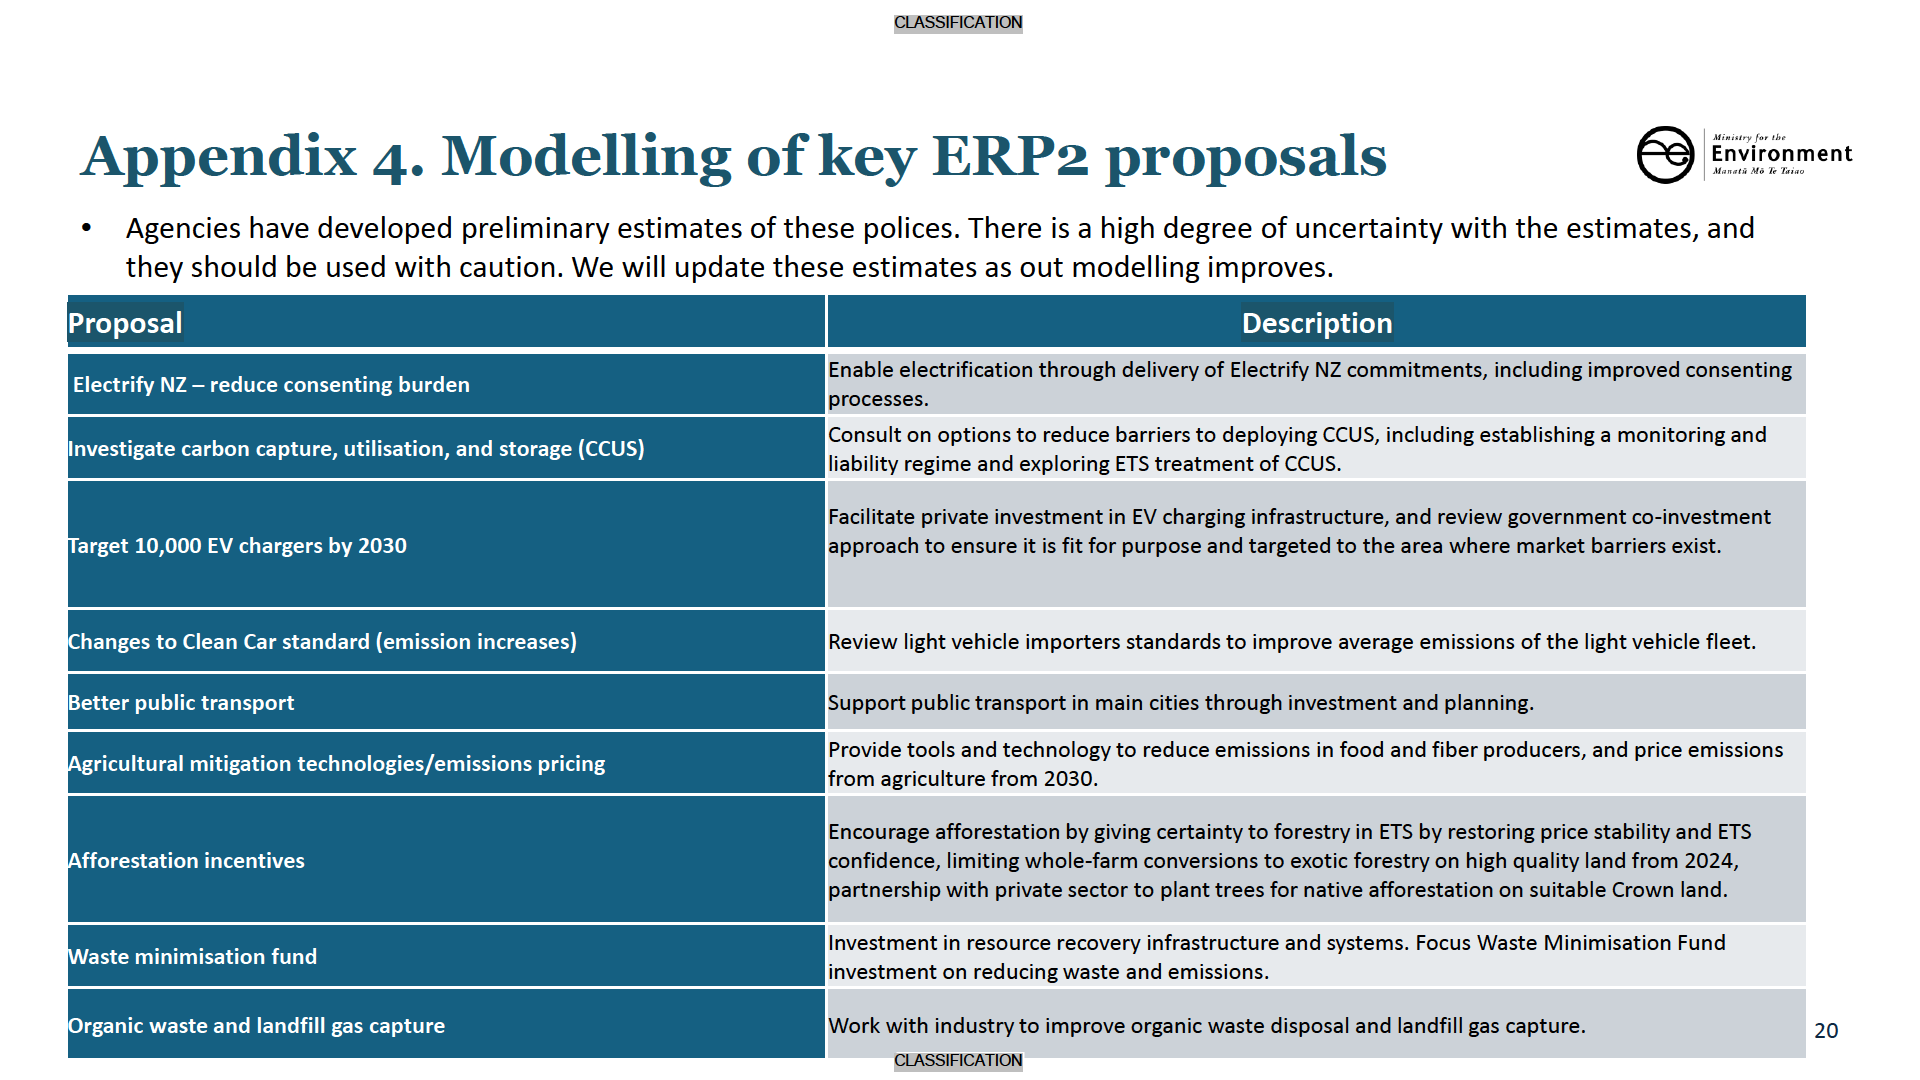
• We have modelled the impact of key policies proposed by Ministers for ERP2 (Appendix 3) to understand how much they can
increase the confidence in meeting EB2. The estimates should be considered preliminary and likely to change as our modelling
improves.
• Our modelling suggests that the Government’s new policies proposed for ERP2 could contribute 3.8 Mt of reductions towards
EB2. The following slide shows the estimated abatement from different ERP2 policy proposals.
• The proposals for ERP2 are likely to have a greater impact on emissions over the longer term and contribute to future
emissions budgets. Our modelling suggests that your ERP2 policies could reduce net emissions by 14.8 Mt for the third
emissions budget (2030-2035).
9
CLASSIFICATION

CLASSIFICATION
Relationship between ERP2 sufficiency,
and ETS settings decisions
• The legal adequacy of ERP2 is governed by "sufficiency", and of ETS settings by "accordance tests“. Both are subject to judicial
review, and we anticipate that in both cases there is a high risk of litigation against Government decisions.
• The Minister of Climate Change must form evidence-based views on the likelihood of a given package of ERP measures (sufficiency)
or ETS settings (accordance) to achieve a specified budget or target. These are the second emissions budget in the case of ERP2,
and all extant emissions budgets, NDCs, and the 2050 target in the case of ETS settings.
• In a market-led approach, how you determine accordance for ETS settings will have a large impact on sufficiency of ERP2.
• This ERP2 projections has used an assumed ETS price pathway that officials across agencies agree is consistent with current
settings. This can support your decision to commence consultation on ERP2, but is not intended as the final position on either the
accordance of a given combination of ETS settings or the sufficiency of the final ERP2.
• The actual ETS price faced by emitters, and therefore emissions reduction outcomes, will depend on ETS supply/demand dynamics.
Your main opportunity to influence this is via ETS settings decisions, due in August.
• Different combinations of these ETS settings will involve greater or lesser certainty about accordance, and therefore varying
degrees of risk. Your decisions on ETS settings are therefore critical in informing the sufficiency of the final ERP2.
13
CLASSIFICATION

CLASSIFICATION
Relationship between ETS and non-ETS
sectors
Agriculture is on track to meet the 2030 target; however, if this changes it may
require more abatement from ETS covered sectors to meet EB2
• Currently agriculture is on track to meet the 2030 target. However, if this changes a greater net reduction may be required by the
ETS to address any under-achievement. This may require tighter settings in the ETS.
• Alternatively, the Government could consider using non-ETS policies to make greater short-term reductions in agricultural
emissions.
• The effort between ETS and non-ETS sectors is being considered through the ETS settings consultation. No decisions have been
made on this yet.
14
CLASSIFICATION

CLASSIFICATION
Appendix 1. Modelling approach
• The December 2023 projections added up numbers generated by individual agency’s models. However, the
timeframes involved in running these has not allowed their use for consultation.
• An alternative model has been developed and used specifically for ERP2. This is the ENZ model developed
by Concept Consulting and previously used by Boston Consulting Group for its
Future is Electric work, the
Climate Change Commission demonstration path, and the gas industry understanding the impacts of supply
limits.
• ENZ is a multi-sector model that has details on economic activity driving emissions across all sectors and
that can be used to examine the emission impacts of policies, prices or activity scenarios (eg firm closures).
• ENZ produces results that are different from agency projections, but they are regarded as credible and
within the range of expected outcomes.
• The ETS market model simulates the price response to changes in NZU supply given a starting level of
market demand and estimates of the price responsiveness of emissions and forestry removals. It estimates
the price outcome of a change to auction supply, including the expected response of the NZU stockpile
under different conditions.
17
CLASSIFICATION

CLASSIFICATION
Appendix 2: Taking a market led approach
to meet EB2
• The ability of the ETS to influence emissions outcomes depends on the overall supply of units, including those held in the ETS
stockpile (~4 years worth of demand). Banked units can be supplied to the market at any point, which can allow for excess
emissions to occur. Given this, the ETS doesn't guarantee an emissions outcome for an emissions budget.
• To be more confident of achieving EB2 through a market led approach, Ministers could (a) reduce the volume of units available in
the ETS by (b) auctioning significantly fewer units over EB2 to (c) reduce the risk posed by the stockpile. Auctioning fewer units will
place upward pressure on carbon prices.
• However, we cannot guarantee auctioning fewer units will raise carbon prices to the levels used in the modelling to meet EB2. It
could simply draw more units out of the stockpile, and we note that forward prices are currently lower than those modelled.
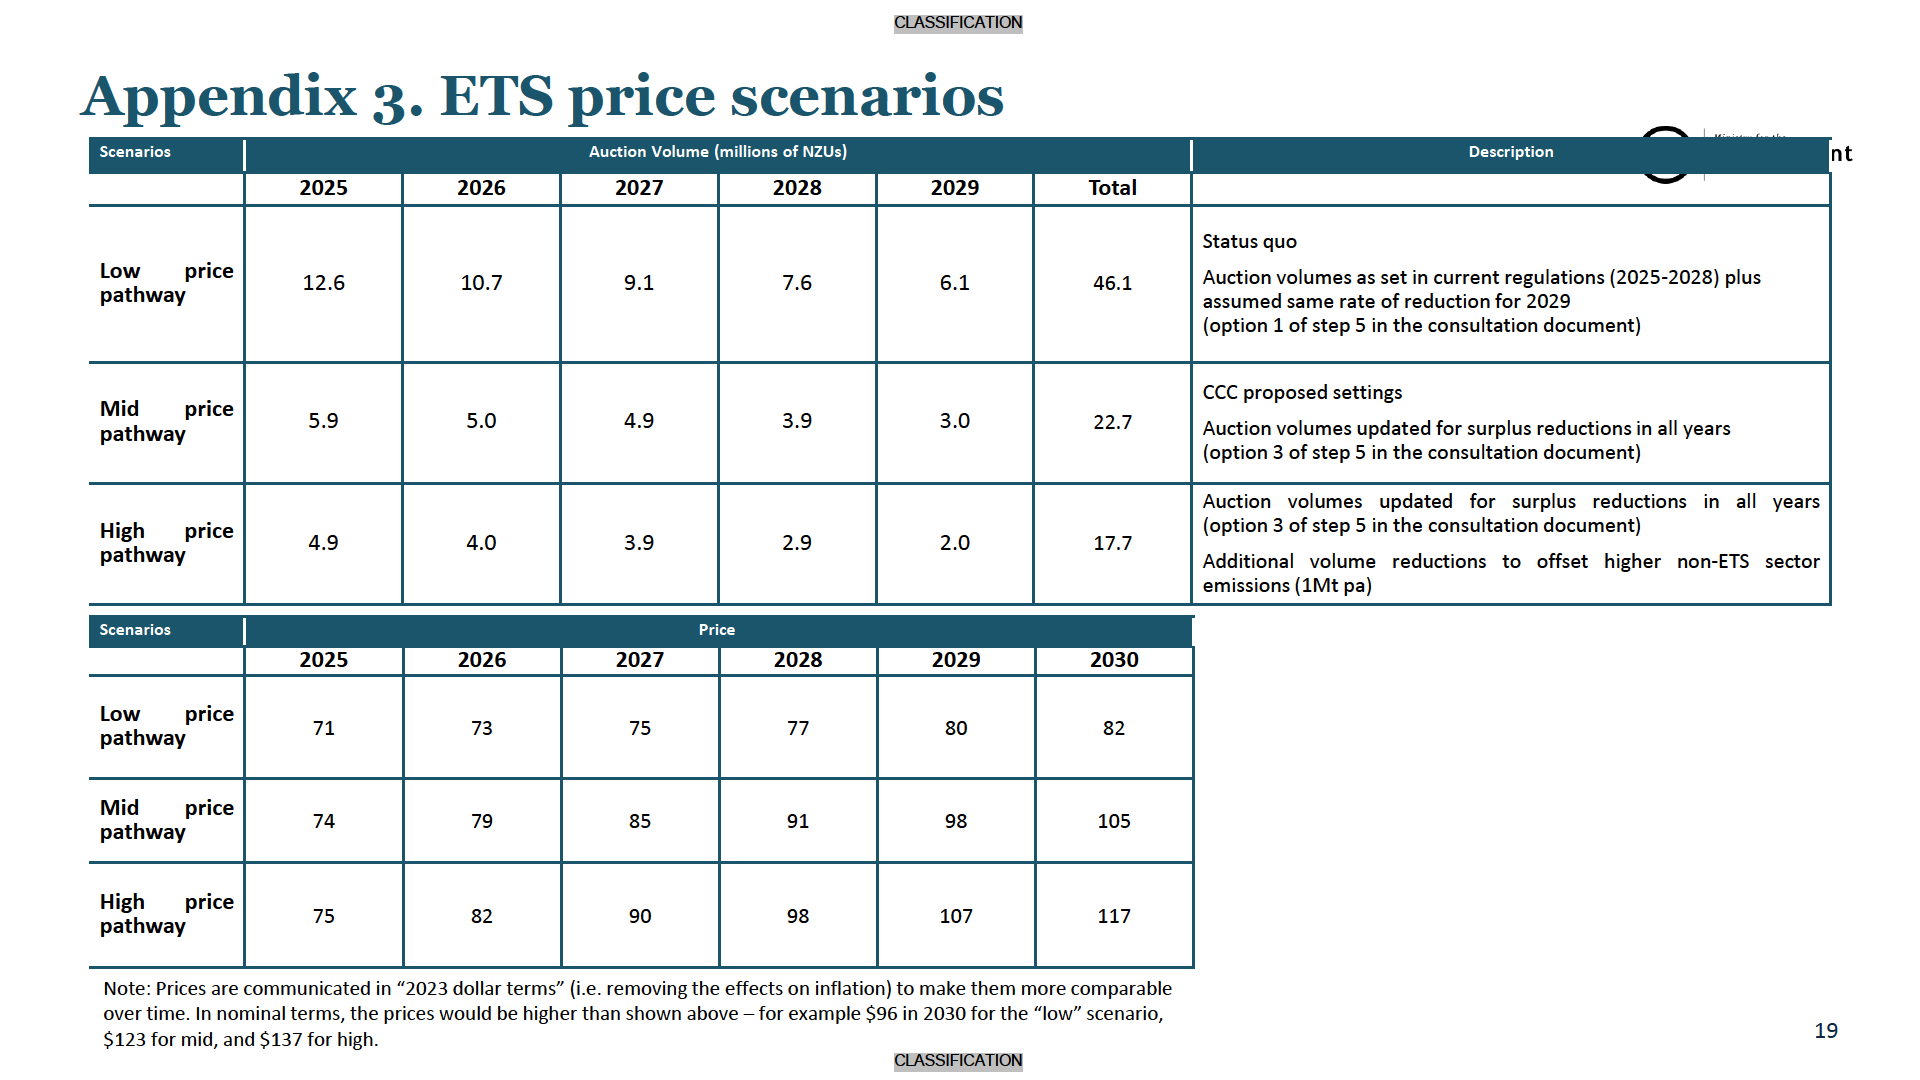
• We have modelled the impact of relying on the ETS and taking a market led approach on emissions for EB2 - the analysis is based
on three ETS price scenarios that reflect plausible price pathways for different volumes of auctioned units. These scenarios will be
further refined as part of advice on ETS unit settings.
Scenario 1: low price pathway
Scenario 2: mid-price pathway
Scenario 3: high price pathway
The Government auctions units over the
The Government significantly reduces
The Government reduces auction
next five years as currently set in
auction volumes to manage the risk
volumes even further to offset higher
regulation, accepting higher risk from
posed by the ETS stockpile, increasing
non-ETS sector emissions, creating even
the ETS stockpile, with relatively
upwards pressure on prices ($105 in
greater upwards pressure on carbon
subdued prices ($82 in 2030).
2030).
prices ($117 in 2030).
18
CLASSIFICATION

CLASSIFICATION
Appendix 5: key ERP2
proposals modelling caveats
•
CCUS figures are on the basis of a draft CIPA. The CIPA figures are not integrated with the wider ENZ model, and the relationship between
CCUS and the ETS is still being worked through. MBIE will be consulting on the policy details in parallel to ERP2 consultation.
•
Modelled GHG emissions estimates of the transport initiatives are subject to a high level of uncertainty. This reflects uncertainties about the
exact details/settings of the initiatives as well as limitations in our understanding of their impacts on GHG emissions. These interim estimates
should be expected to significantly change as policies are developed, and the GHG projections and policy impacts modelling is refined.
•
Assumes ongoing investment of the WMF into infrastructure to divert organic material from landfills at a rate of $30M/ year for 6 years
•
Assumes 7% increase in LFG capture efficiency and the expansion of LFG capture to all remaining class 1 landfills
21
CLASSIFICATION