
Woodend Bypass
Economic Assessment
October 2024
under the Official Information Act 1982
Released
Ref: 2024-007
Woodend Bypass Economic Assessment V03a
© QTP Ltd 2024
1982
Act
Information
Official
the
under
Released

Woodend Bypass – Economic Assessment
Contents
1
Introduction and Executive Summary ........................................................................... 1
2
Economic Evaluation Procedures .................................................................................. 3
3
Location and Option Summary ...................................................................................... 5
4
Adopted Input Assumptions........................................................................................... 6
4.1 Timing ............................................................................................................................... 6
4.2 Value of Time .................................................................................................................... 6
1982
4.3 Vehicle Operating Costs .................................................................................................... 7
4.4 Emission Costs ................................................................................................................. 8
Act
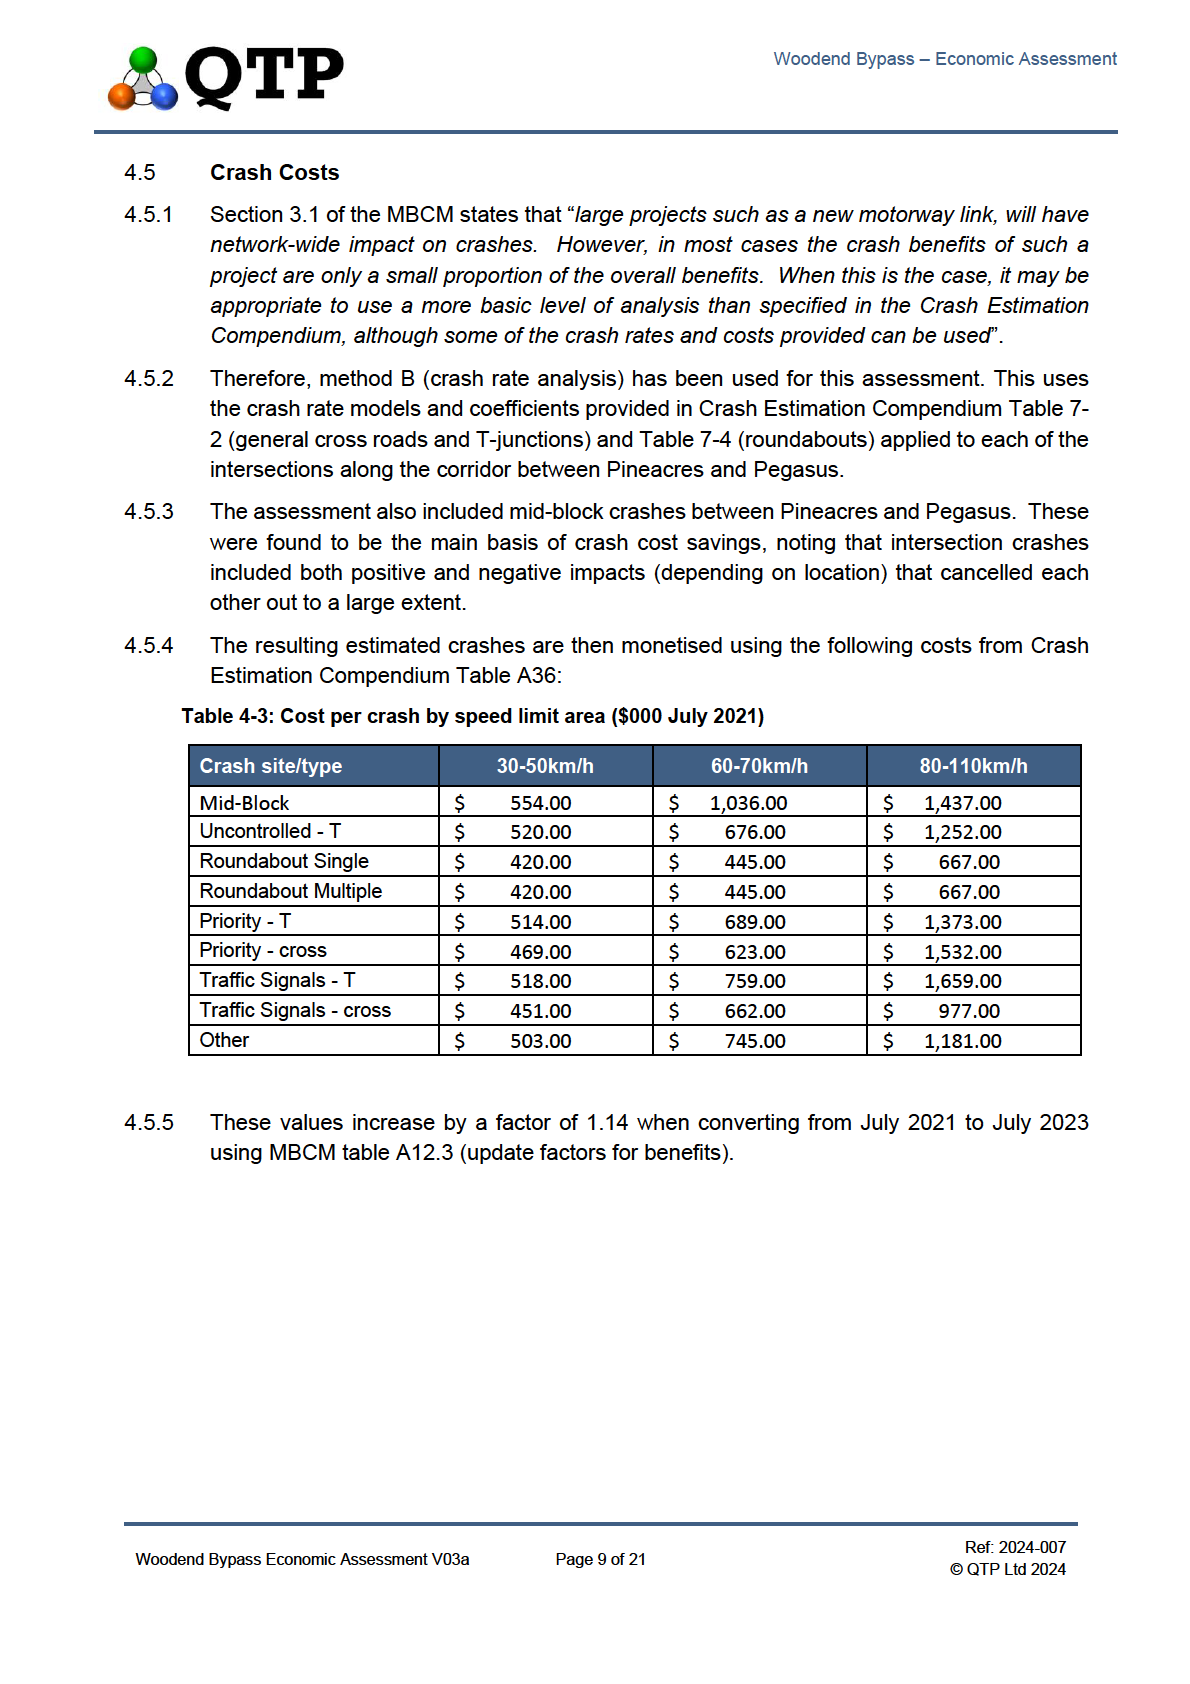
4.5 Crash Costs ...................................................................................................................... 9
4.6 Walking and Cycling Benefits .......................................................................................... 10
4.7 Reliability Benefits ........................................................................................................... 10
4.8 Daily to Annual Expansion Factor .................................................................................... 10
4.9 Do Minimum .................................................................................................................... 10
4.10 Traffic Modelling .............................................................................................................. 11
4.11 Summary of Network Performance .................................................................................. 12
5
Project Costs ................................................................................................................. 14
Information
5.1 Cost of Do-Minimum ........................................................................................................ 14
5.2 Option Additional Capital Expenditure (CAPEX) Costs .................................................... 14
5.3 Option Additional Operating Expenditure (OPEX) Costs ................................................. 14
5.4 Total PV Costs ................................................................................................................ 14
Official
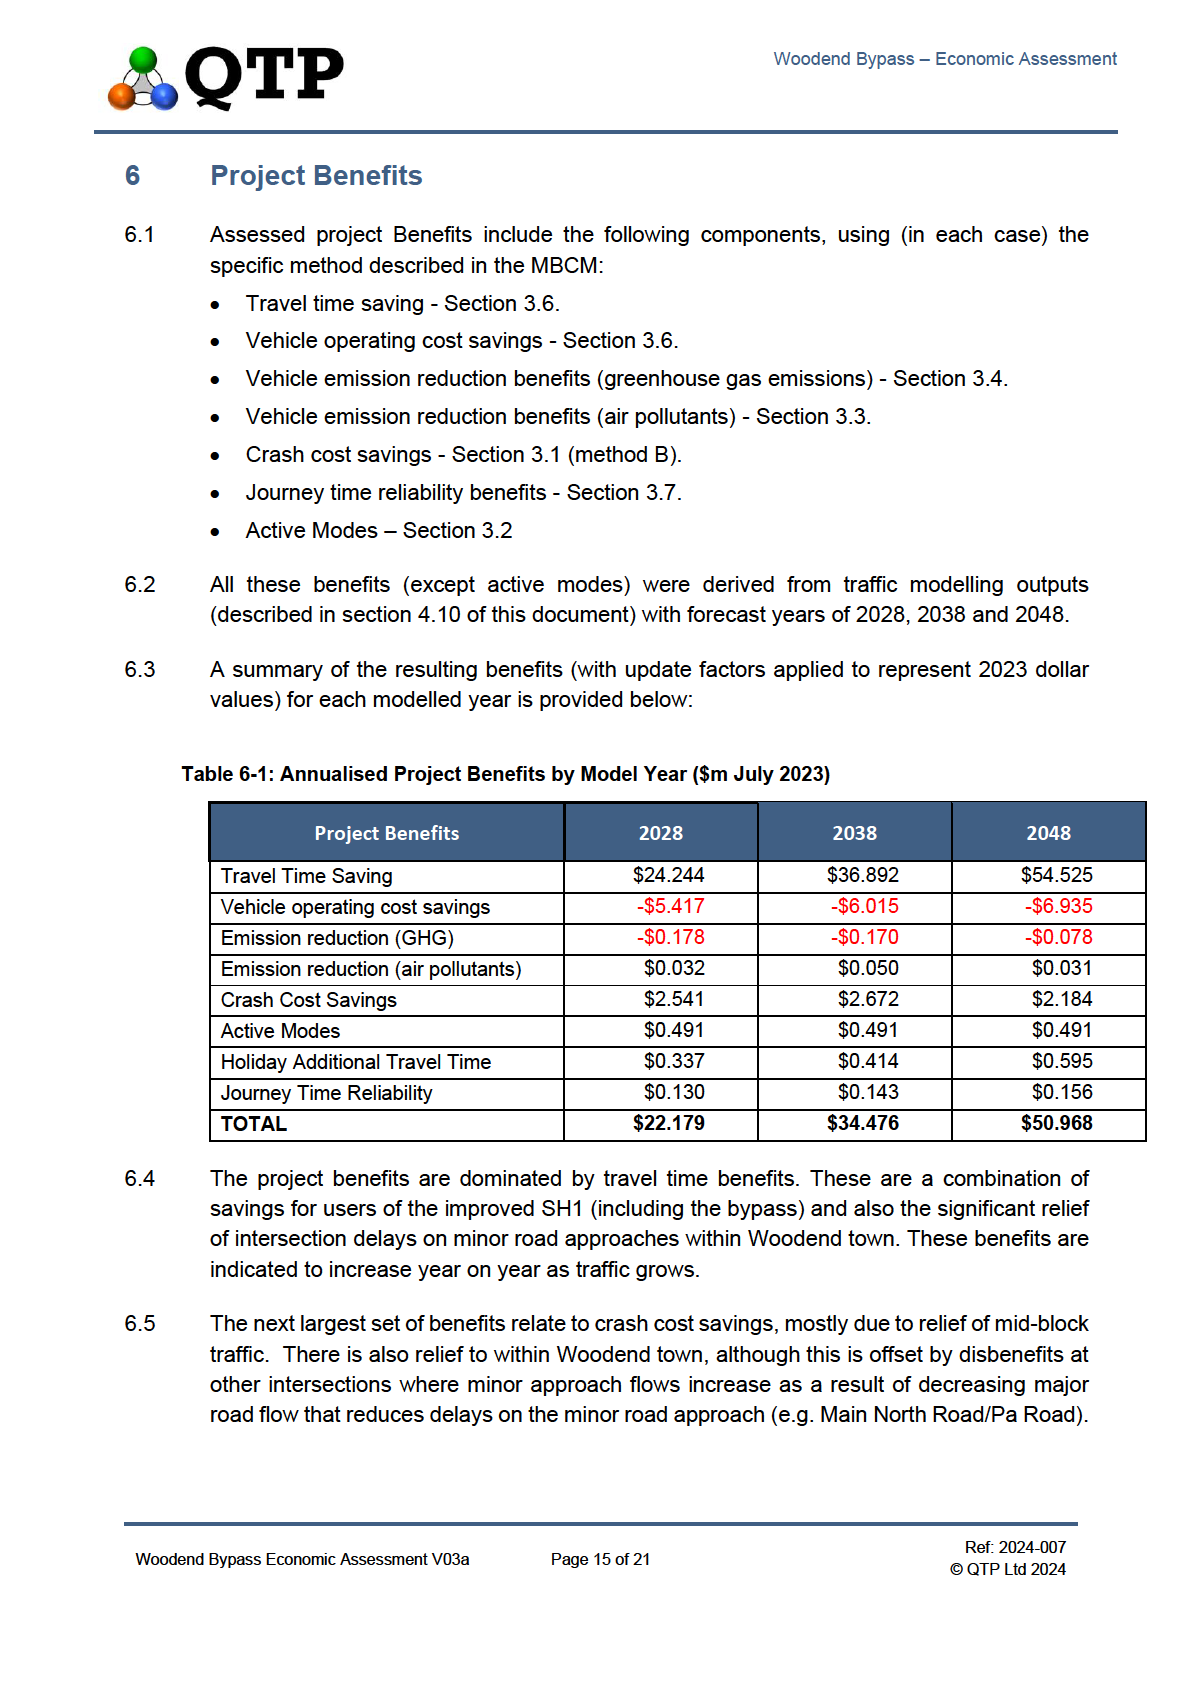
6
Project Benefits ............................................................................................................. 15
7
Benefit Cost Ratio – Summary ..................................................................................... 17
the
Appendices
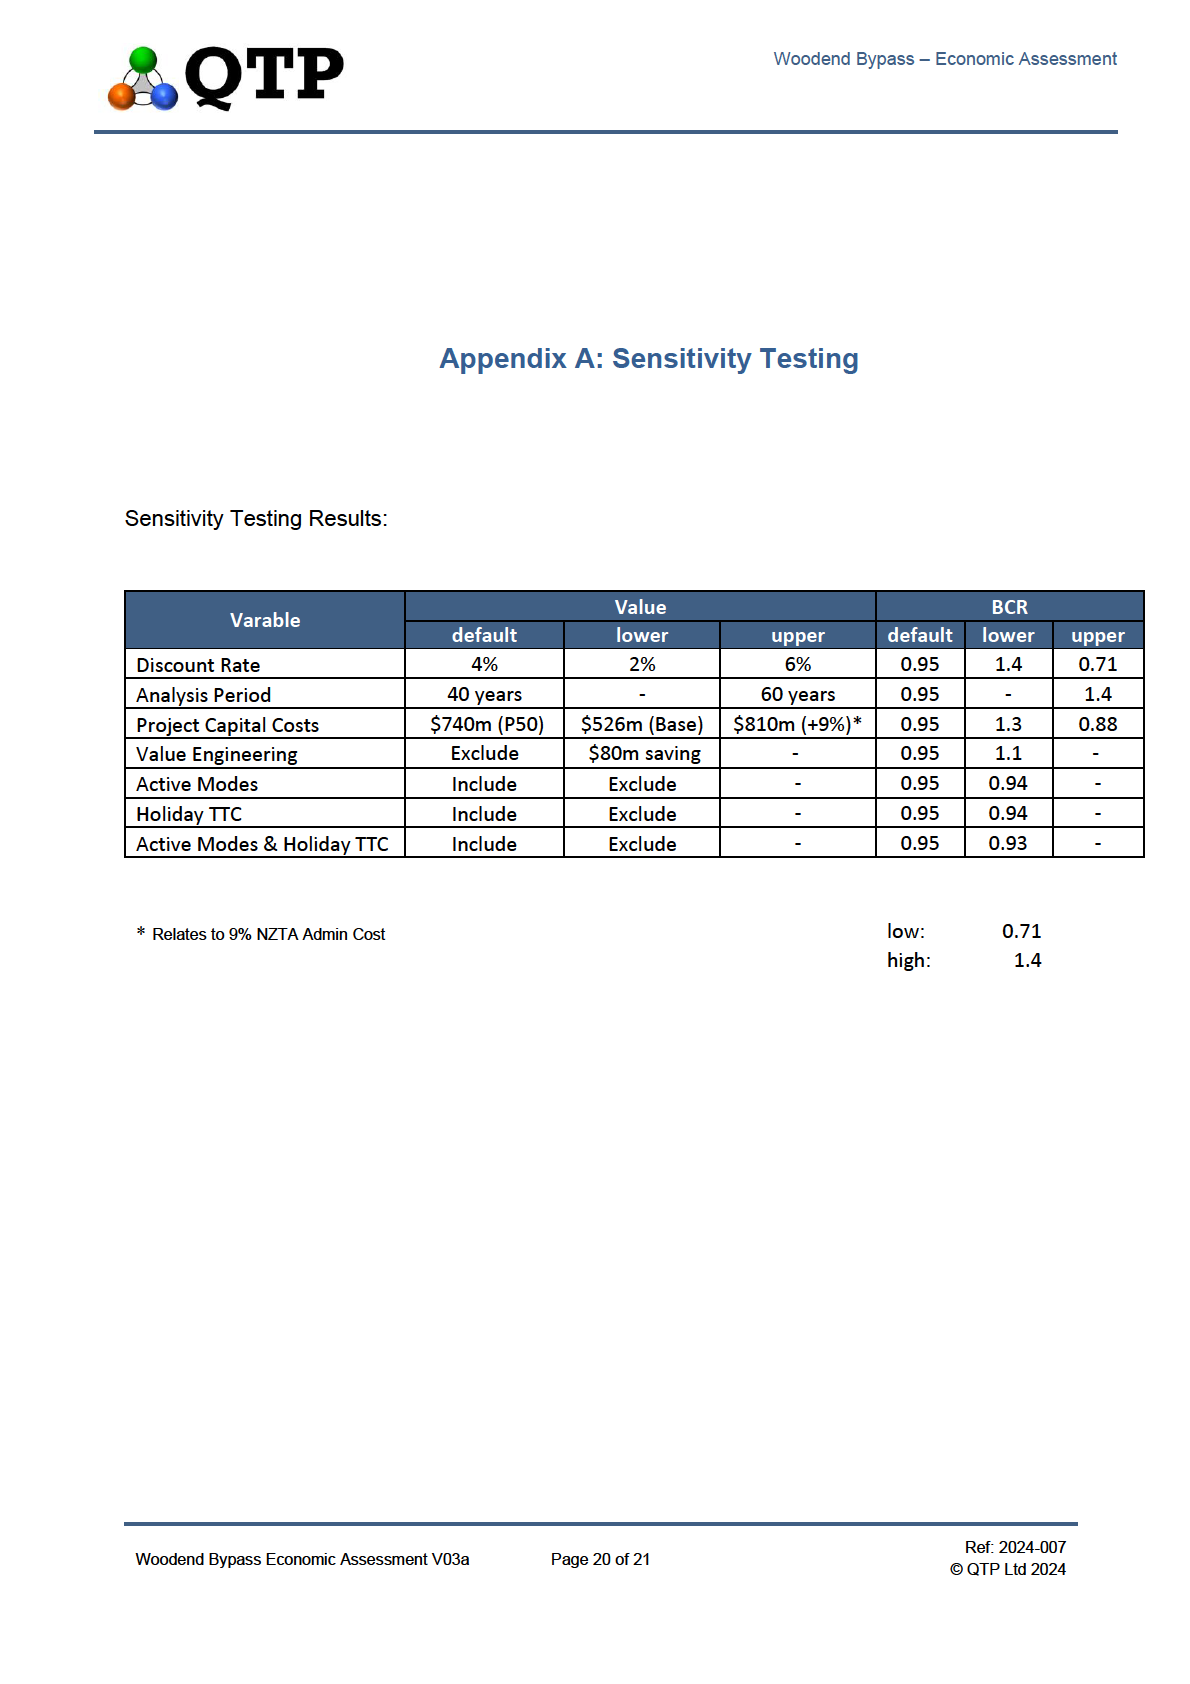
Appendix A: Sensitivity Testing
Appendix B: Toll Modelling Assessment Summary
under
Released
Ref: 2024-007
Woodend Bypass Economic Assessment V03a
Page ii
© QTP Ltd 2024

Woodend Bypass – Economic Assessment
1
Introduction and Executive Summary
1.1
The New Zealand Transport Agency Waka Kotahi (NZTA) have engaged QTP Ltd to use
updated traffic models to provide design flows and preliminary economic assessment for
the Woodend Bypass given that it has been identified for delivery in the draft GPS2024.
1.2
This document summarises the preliminary economic assessment. It directly utilises the
transport modelling used to develop the design flows, which is summarised in the separate
1982
QTP report titled "
Woodend Bypass Traffic Modelling v02a.PDF".
1.3
A single bypass option has been tested against the do-minimum. This option is based on
Act
the 'short eastern bypass alignment' (identified during 2013 work) between Pineacres and
Pegasus. The bypass is to include grade separated interchanges provided at Pineacres
and Pegasus1. In addition to the bypass component, the section of SH1 between the
northern end of the northern motorway and Pineacres has been upgraded to 4 lane
motorway standard.
1.4
The purpose of this report is to summarise the primary project benefits and the Benefit Cost
Ratio (BCR) in accordance with the NZTA Monetised Benefits and Costs Manual (MBCM).
This includes recording key input assumption details and noting any limitations or other
Information
matters which can then be referenced as part of other preliminary work.
1.5
The resulting Present Value (PV) benefits and costs for the preferred full programme of
works, along with the resulting BCR, are summarised below:
• TOTAL BENEFITS:
$ 638.8m
•
Official
TOTAL COST:
$ 670.9m
• BCRN
0.95 (with sensitivity 0.71 to 1.4)
the
1.6
The assessment indicates that the BCR is borderline between having a 'low' rating (greater
than 1.0 but less than 3.0) and ‘very low’ (less than 1.0) for the 'Efficiency' component of
Waka Kotahi's Proposed Investment Prioritisation Method (IPM) priority ranking for the
National Land Transport Fund (NLTP) 2024-2027.
under
1.7
Note that this Economic Evaluation informs part of a wider IPM assessment which also
considers 'GPS alignment' and 'Scheduling' components. The IPM only relates to funding
being sought from the National Land Transport Fund (NLTF), and it is possible that some
(or all) of funding for this project could come from an alternative source (e.g. Public Private
Partnership (PPP) or some form of tolling).
1.8
s 9(2)(ba)(ii)
Released
1.9
In addition to the national benefit-cost ratio, the introduction of tolling requires reporting of
1 The 2013 alignment, and previous version of this economic assessment did not include an interchange at Pegasus.
Ref: 2024-007
Woodend Bypass Economic Assessment V03a
Page 1 of 21
© QTP Ltd 2024

Woodend Bypass – Economic Assessment
the government benefit to cost ratio (BCRG). The BCRG is used to indicate the level of
benefits obtained from investment of local and central government funds in situations where
government funding is supplemented by the availability of third-party funding or tolling
revenue.
1.10
s 9(2)(ba)(ii)
1982
1.11
Act
1.12
1.13
Information
1.14
Further information about the process and assumptions are provided in the sections below.
Official
the
under
Released
Ref: 2024-007
Woodend Bypass Economic Assessment V03a
Page 2 of 21
© QTP Ltd 2024

Woodend Bypass – Economic Assessment
2
Economic Evaluation Procedures
2.1
The Economic Evaluation follows procedures specified in the Waka Kotahi Economic
Monetised Benefits and Costs Manual (MBCM) version 1.7 (May 2024).
2.2
Section 4.3 of the MBCM describes the procedures used to evaluate the economic
efficiency of road improvement activities. This assessment is based on those procedures.
2.3
Due to the financial scale of the project (being greater than $15m)2, 'Full Procedures' have
1982
been applied.
2.4
The do-minimum and do-something options have been run using elastic assignments to
Act
extract design flows.
2.5
The resulting corridor traffic flows indicate that fixed trip matrix benefits are unlikely to differ
by more than 10%3 from those from a variable trip matrix approach, therefore a fixed matrix
approach (using do-minimum demands) has been adopted for this assessment, with link-
by-link assessment of core benefits.
2.6
Relevant benefits and costs specified in Section 4.3 of the MBCM that are included in the
analysis include:
Information
Benefits:
The following benefits (or disbenefits) from the NZTA Land Transport Benefit Framework
(LTBF) have been assessed (listed by LTBF
benefit cluster and the associated MBCM
monetised benefit):
Official
Changes in User Safety - Impact on social cost of deaths and serious injuries:
• Crash cost savings the
Changes in Human Health - Impact on air emissions on health:
• Vehicle emission reduction benefits (air pollutants)
• Walking and cycling health benefits
Changes in transport Costs - Impact on network productivity and utilisation:
under
• Travel time saving.
• Vehicle operating cost savings.
Changes in transport Costs - Impact on System Reliability:
• Journey time reliability benefits.
Change in climate - Impact on greenhouse gas emissions:
Released
• Vehicle emission reduction benefits (greenhouse gas emissions).
2 %15m is the upper threshold where ‘Simplified Procedures’ can be applied (Section 4.3 of MBCM).
3 The relevance of this threshold is explained on page 268 of the MBCM (version 1.7, May 2024)
Ref: 2024-007
Woodend Bypass Economic Assessment V03a
Page 3 of 21
© QTP Ltd 2024

Woodend Bypass – Economic Assessment
Costs:
Any additional Capital Expenditure (CAPEX) over what is expected to be spent on the Do-
Minimum. This includes:
• Property
• Pre implementation costs (including investigation and design)
• Implementation costs (construction).
1982
Any additional Operational Expenditure (OPEX) over what is expected to be spent on the
Do-Minimum. This includes renewal costs and operation and maintenance costs.
Act
Information
Official
the
under
Released
Ref: 2024-007
Woodend Bypass Economic Assessment V03a
Page 4 of 21
© QTP Ltd 2024

Woodend Bypass – Economic Assessment
3
Location and Option Summary
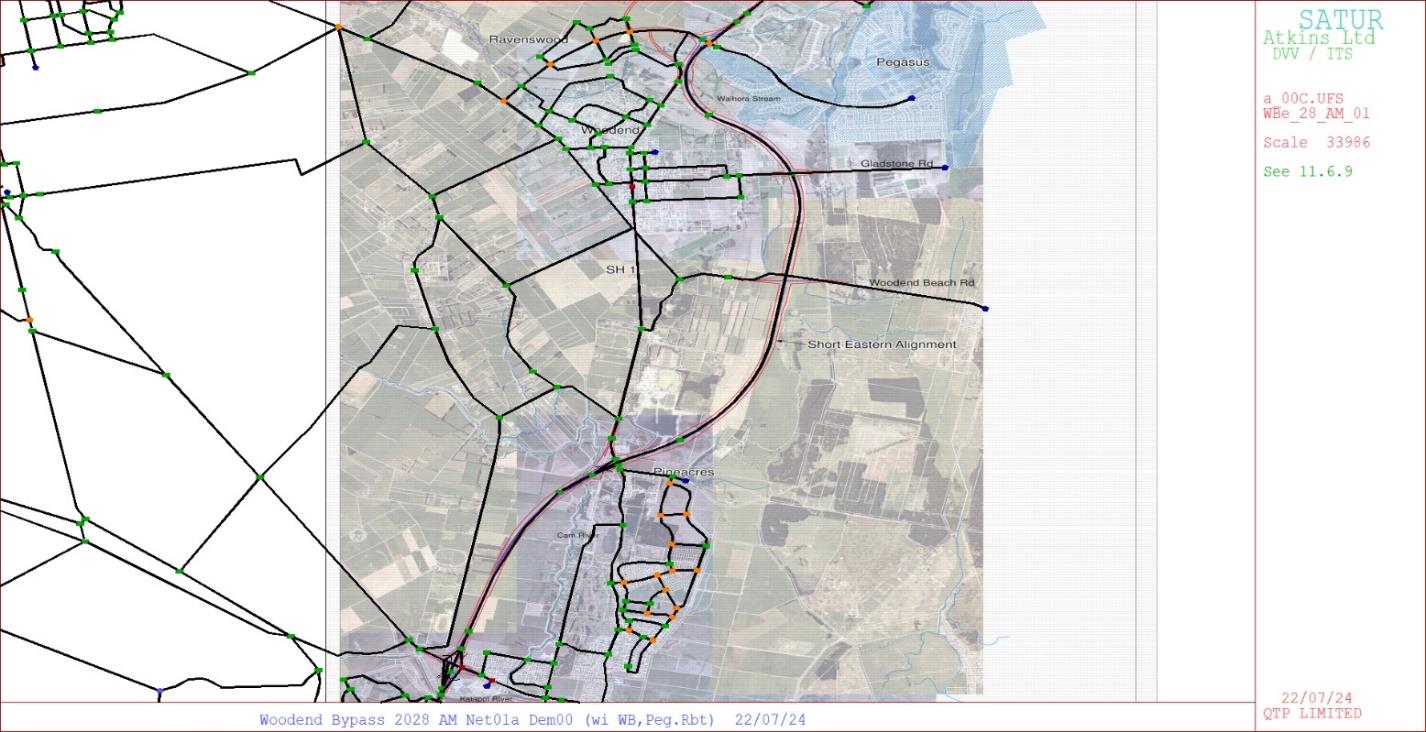
3.1
The Woodend Bypass scheme has initially been modelled based on the alignment and
general arrangement indicated within the plans developed in the Scheme Assessment
Reporting of February 2013 (the 'Short Eastern Alignment Route'). The modelled do-
something network, overlaid on the scheme plan, is illustrated within the following diagram,
extracted directly from the CAST model.
1982
Figure 3 1: Activity Location
Act
Information
Official
the
3.2
The length of corridor affected by the scheme is approximately 9km, with most of this being
the Pineacres to Pegasus bypass component (6km). Key features associated with the
scheme include:
• The scheme is to be generally 100 kph (posted speed limit), but 80 kph from Gladstone
under
Road through to the Pegasus Roundabout and north to the tie-in point on SH1.
• South-facing ramps only at Pineacres (Williams Street) interchange (operating under
priority control).
• The Pegasus Interchange is to include a 2-lane flyover for SH1, with signalised ramp
intersections.
• Four-laning will extend southbound through the Lineside Road interchange to provide
four continuous lanes.
Released
Ref: 2024-007
Woodend Bypass Economic Assessment V03a
Page 5 of 21
© QTP Ltd 2024
1982
Act
Information
Official
the
under
Released

Woodend Bypass – Economic Assessment
using MBCM table A12.3 (update factors for benefits).
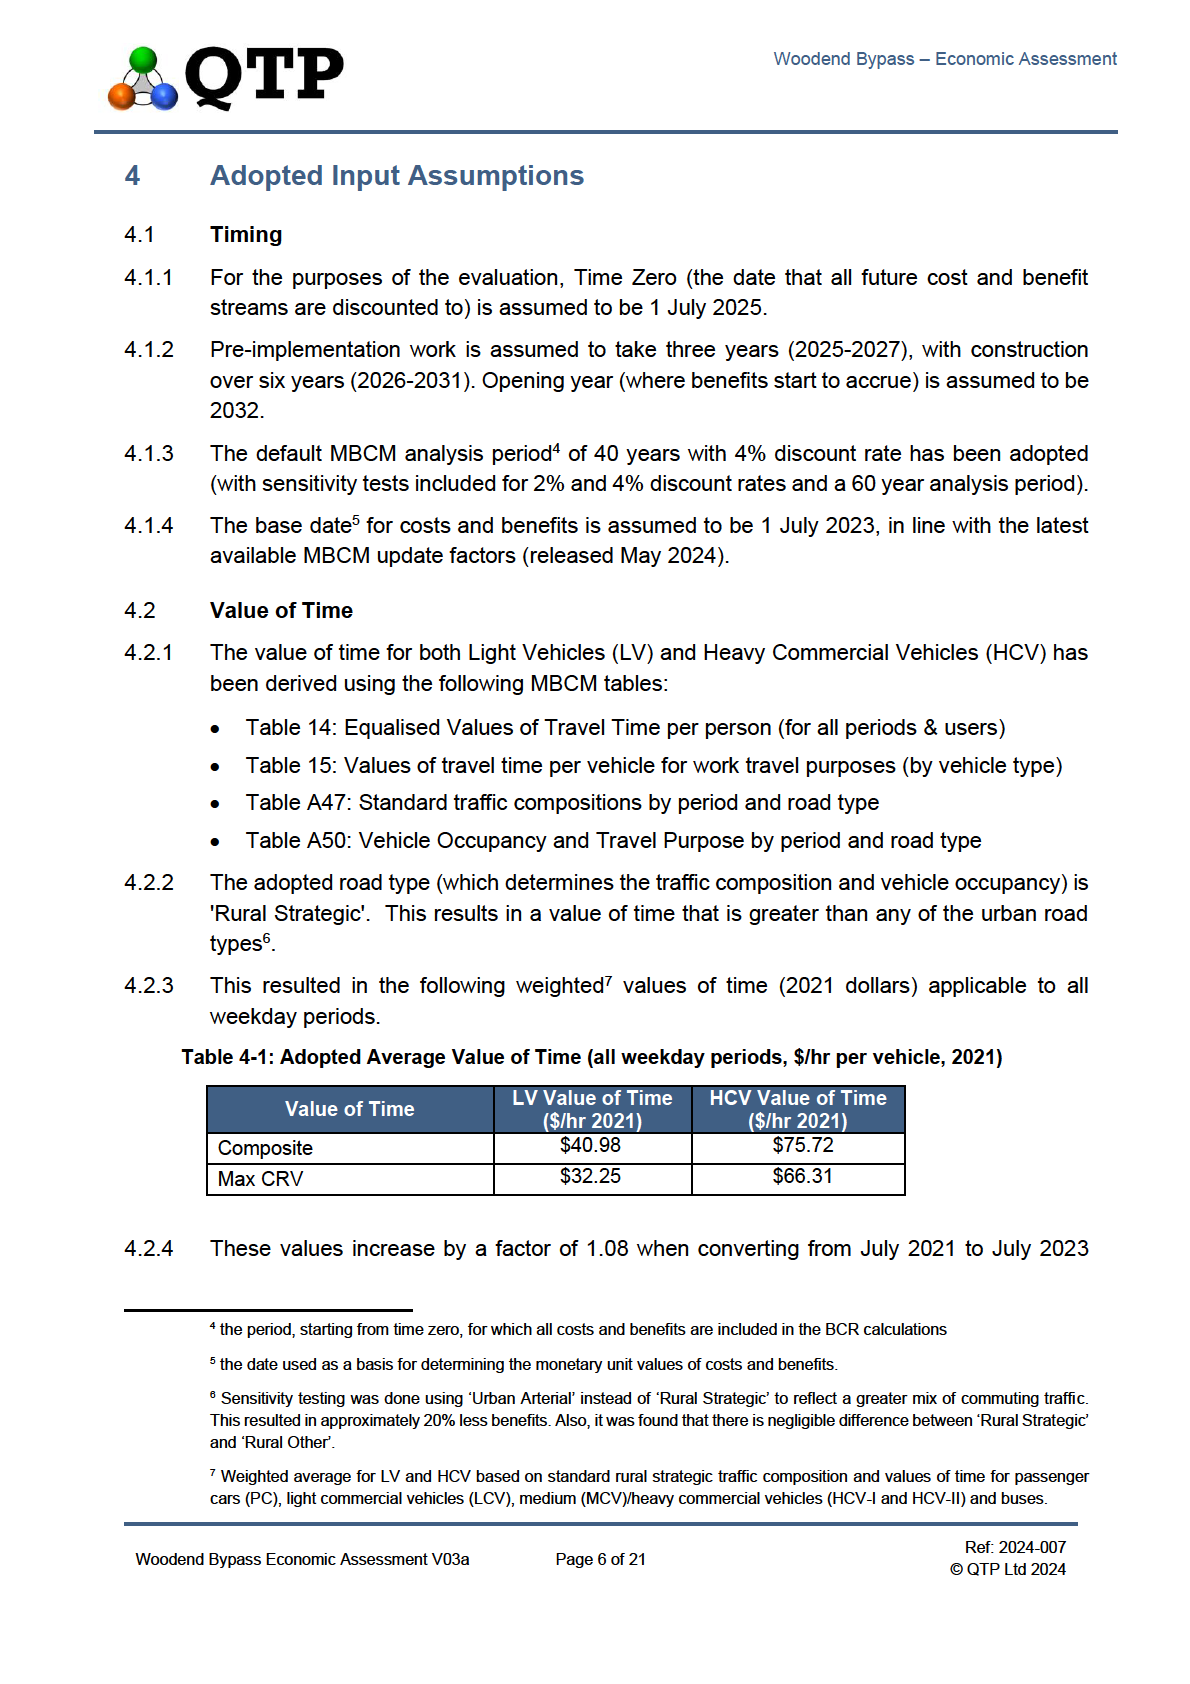
4.2.5
The Max CRV is applied on a link-by-link basis based on V/C (applied as per the MBCM
formula whenever link V/C exceeds 70%).
4.2.6
Travel time data (from Tom Tom, supplied by NZTA) indicates that additional congestion
occurs during public holidays where northbound traffic flows increase significantly in the
evening peak as travellers head north to popular holiday destinations. This additional travel
time has been included in the assessment as a separate calculation that imposes an
1982
additional 10 minute delay to northbound evening peak traffic for 11 public holiday days per
year. It has been assumed that these delays would increase in the future, with guesstimates
of 12 minutes and 16 minutes adopted for 2038 and 2048 respectively.
Act
4.3
Vehicle Operating Costs
4.3.1
The value of vehicle operating costs have been estimated separately for Light Vehicles (LV)
and Heavy Commercial Vehicles (HCV) using the following MBCM tables:
• Table A47: Standard traffic compositions by period and road type
• Table 22: Running cost by speed and gradient regression coefficients (cents/km - July
2015) by vehicle class and road category
• Table 23: Additional VOC due to congestion regression coefficient by vehicle class
Information
(cents/km - July 2015) by vehicle class and road category
4.3.2
The adopted road type (which determines the traffic composition8 and regression
coefficients) is 'Rural Strategic'.
4.3.3
The resulting 'base' vehicle operating costs are calculated on a link-by-link basis using the
MBCM formula based on individual link speed and coefficients from MCBM table 22. The
Official
terrain is flat in the project area, so gradients for all links have been assumed to be zero in
these calculations.
the
4.3.4
The resulting 'congested' vehicle operating costs are calculated on a link-by-link basis using
the MBCM formula based on link V/C and coefficients from MCBM table 23.
4.3.5
These values increase by a factor of 1.35 when converting from July 2015 to July 2024
using MBCM table A12.3 (update factors for benefits).
under
Released
8 Weighted average between standard rural strategic traffic composition for passenger cars (PC), light commercial vehicles
(LCV), medium (MCV)/heavy commercial vehicles (HCV-I and HCV-II) and buses.
Ref: 2024-007
Woodend Bypass Economic Assessment V03a
Page 7 of 21
© QTP Ltd 2024
1982
Act
Information
Official
the
under
Released
1982
Act
Information
Official
the
under
Released

Woodend Bypass – Economic Assessment
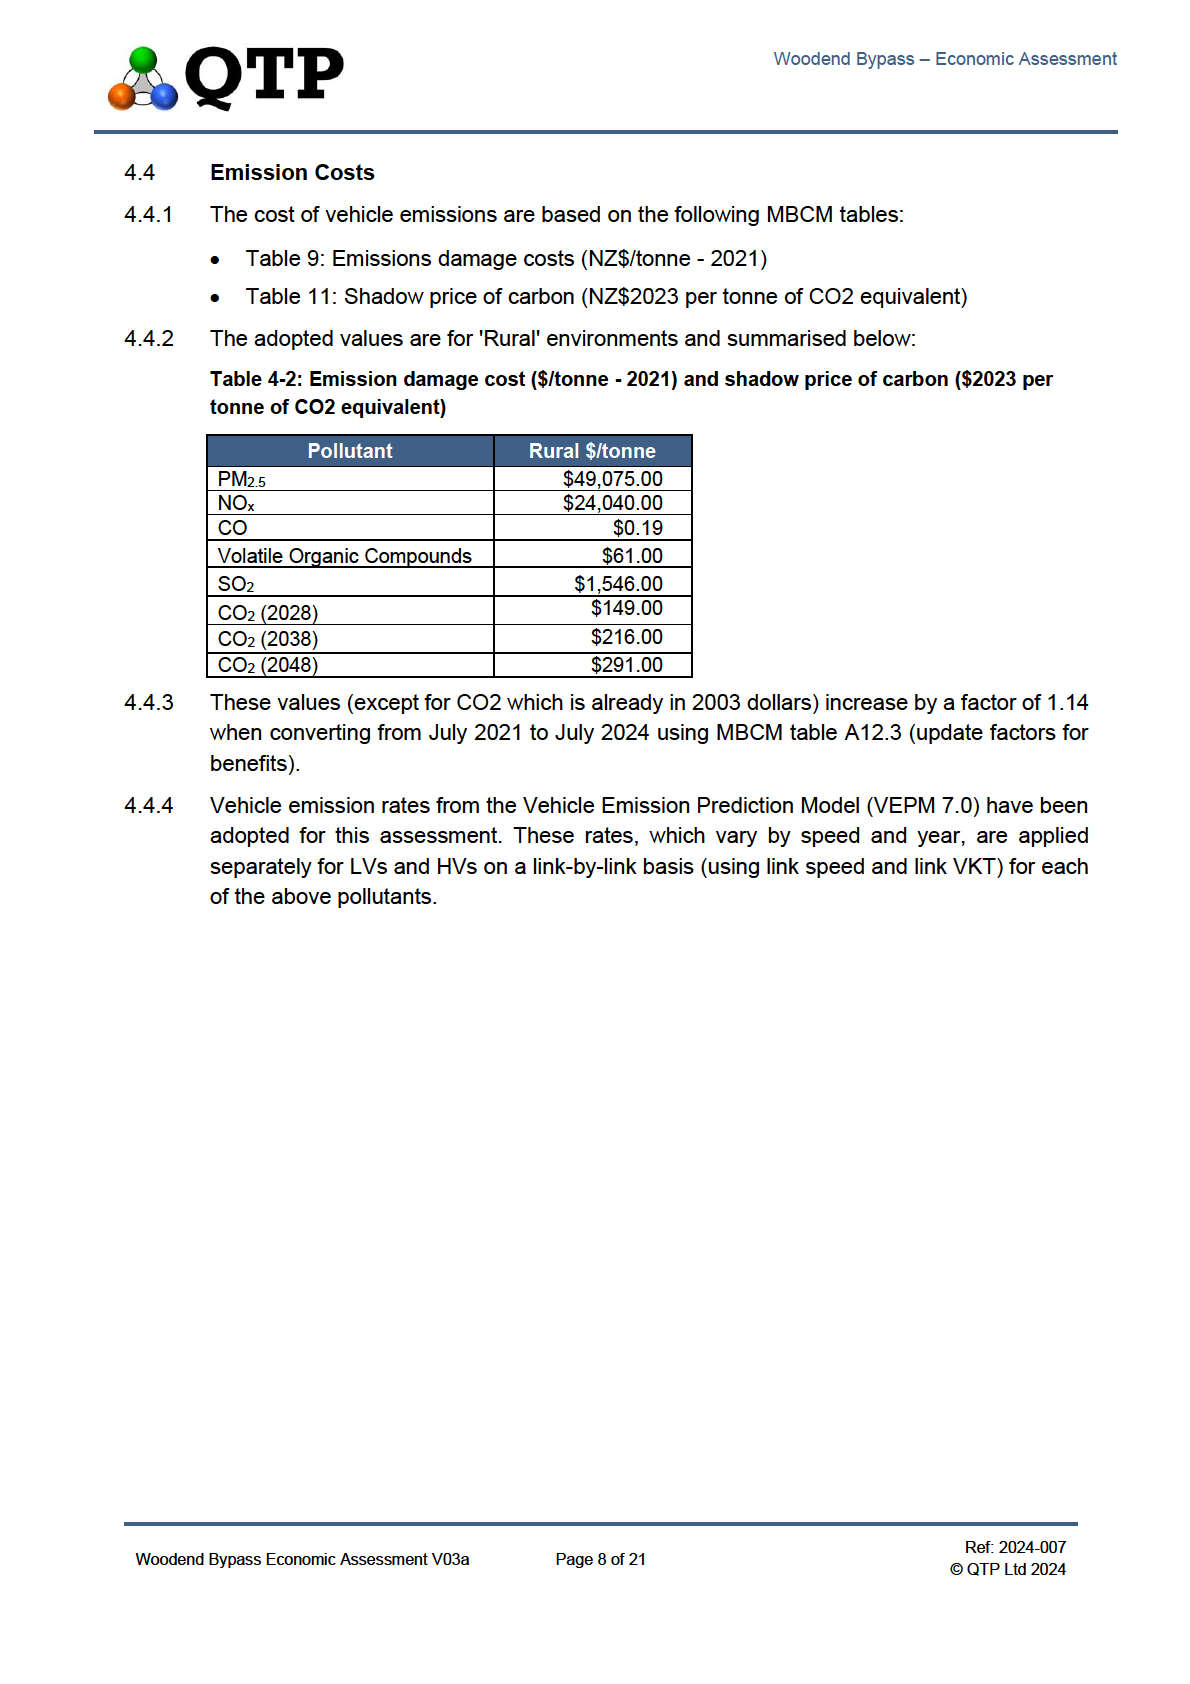
4.6
Walking and Cycling Benefits
4.6.1
The proposed Pegasus interchange will significantly improve the current impediment to safe
walking and cycling across SH1. This is covered by section 3.2 of the MBCM (impact of
mode on physical and mental health), which ascribes a benefit to walking and cycling users
that use the facility. This benefit is irrespective of the length of the improvement and is
ascribed to individual users, rather than trips. The value for walking trips is $9.90 (2021$,
from Table 6 of the MBCM) and the value for cycling is $14.70 (2021$, from the text
following Table 7 of the MBCM).
1982
4.6.2
Because the current site is such an impediment to cyclists and pedestrians, demand for
crossing SH1 is presently unknown. For the purpose of assessment, in discussion with
Act
NZTA, 30 pedestrians and 70 cycle users per day have been assumed (i.e. 100 users in
total, applied to all forecast years).
4.7
Reliability Benefits
4.7.1
Road journey reliability benefits have been estimated using the procedure described in
Section 3.7 of the MBCM. This procedure can’t use the model link-by-link method used to
estimate other benefits because it would double count whenever there a multiple links
between key sections of road (between intersections or speed environments).
4.7.2
Therefore, the process is highly manual and relies upon model flows and V/C at selected
Information
locations representing discrete segments. To keep this process manageable, only the main
corridor sections have been assessed and only for bypass traffic. The resulting benefits
are very small (<1% of total benefits), and compared to other included benefits and make
negligible difference to the BCR, therefore they serve no other purpose in the assessment
other do demonstrate that they have been considered.
Official
4.8
Daily to Annual Expansion Factor
4.8.1
Traffic model outputs reflect typical weekday (Mon to Fri) values. These daily values have
the
been annualised using an expansion factor of 351.
4.8.2
The expansion factor is based upon 245 weekdays per year plus 120 weekend and public
holidays that have 91% of weekday flow (based on 2021 SH1 Leithfield count) and 96%
benefit value reflecting different values of time on weekends compared to weekdays (based
under
on MBCM weekend composite values of time for rural strategic roads).
4.9
Do Minimum
4.9.1
The adopted Do-Minimum (from the concurrent traffic modelling work) includes assumes
no changes within existing the corridor. At all other locations, the default transport model
future year schemes are maintained.
Released
Ref: 2024-007
Woodend Bypass Economic Assessment V03a
Page 10 of 21
© QTP Ltd 2024

Woodend Bypass – Economic Assessment
4.10
Traffic Modelling
4.10.1 Traffic modelling of the do-minimum and option was undertaken using the CAST model.
Changes made to the CAST model for this application are described in the report "
Woodend
Bypass Traffic Modelling v02a.PDF".
4.10.2 The model demands used in this assessment are based on a 'fixed' matrix approach, where
both the do-min and option use the do-min demands. This enables the work to be
progressed more quickly and is appropriate for a preliminary assessment where there is still
1982
a lot of uncertainty around the project, especially in relation to cost.
4.10.3 A link-by-link assessment method has been adopted for many of the benefit streams (travel
time costs, vehicle operating costs and emissions). This enables link speed to be used to
Act
directly for calculate emissions and vehicle operating costs, and V/C to directly calculate
any additional congestion costs (for both travel time and vehicle operating costs). This was
done for all seven time slices in the CAST model. These were then summed to Average
Weekday Traffic (AWT) using local expansion factors. Resulting values were annualised
using the factors described in Section 0 above.
4.10.4 Centroid connectors were included in the assessment to ensure internal consistency. While
these don't represent actual roads, they do represent part of the journey (typically on local
access streets not included in the modelled network). Some zones in the CAST model have
Information
multiple centroid connectors, where different network options could alter the choice of
connector used when calculating least-cost paths. Omitting the centroid travel would
exclude a small part of the trip that is necessary for consistently comparing total trip time
and distance.
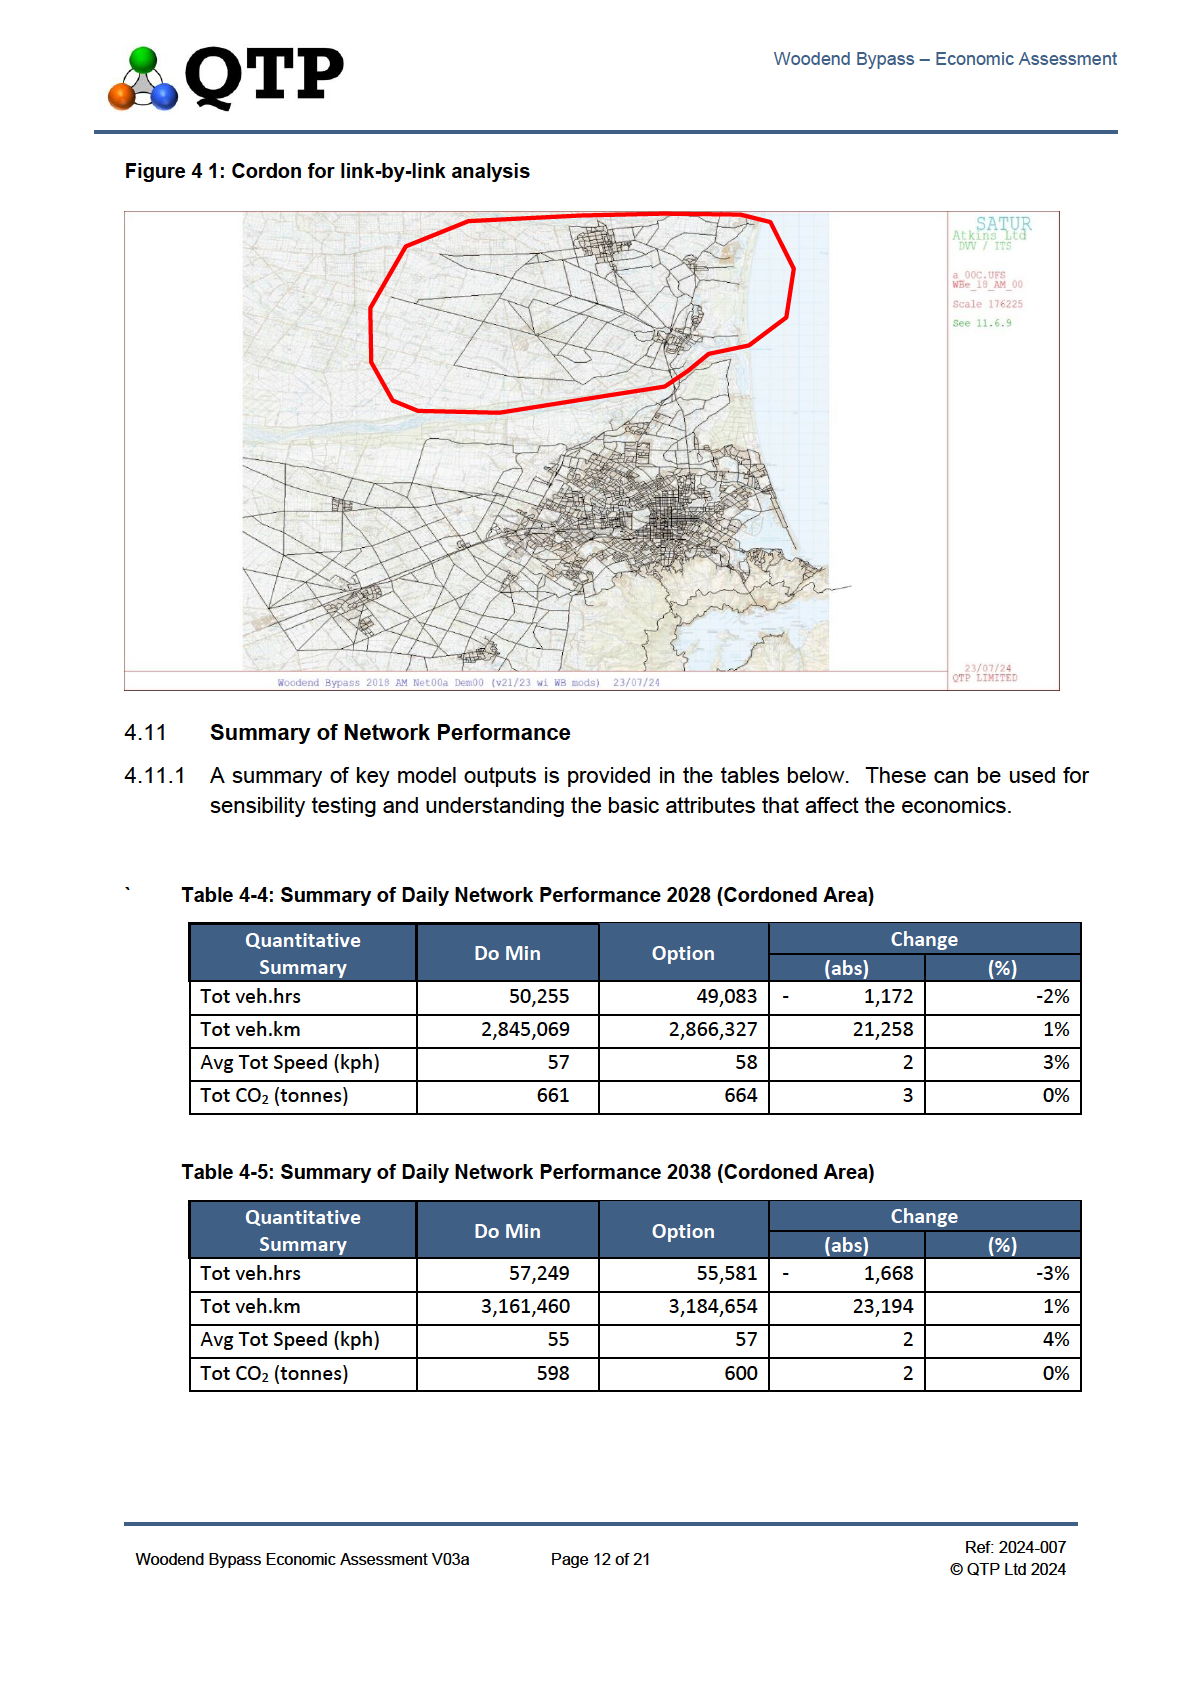
4.10.5 To make the process more efficient, and reduce potential noise, the model runs were done
using a cordoned area that included all model links north the Waimakariri River, as shown
Official
in the figure below.
the
under
Released
Ref: 2024-007
Woodend Bypass Economic Assessment V03a
Page 11 of 21
© QTP Ltd 2024
1982
Act
Information
Official
the
under
Released
1982
Act
Information
Official
the
under
Released
1982
Act
Information
Official
the
under
Released
1982
Act
Information
Official
the
under
Released

Woodend Bypass – Economic Assessment
6.6
There are disbenefits associated with vehicle operating costs, associated with faster vehicle
speeds and additional distance travelled on the bypass. There are also slight disbenefits
related to greenhouse gas emissions for the same reasons. These are indicated to
decrease over time despite ongoing traffic growth due to the assumed changes in the
vehicle fleet over time (with increased electrification).
6.7
The other included benefits are all much lower, but collectively add value.
1982
Act
Information
Official
the
under
Released
Ref: 2024-007
Woodend Bypass Economic Assessment V03a
Page 16 of 21
© QTP Ltd 2024

Woodend Bypass – Economic Assessment
7
Benefit Cost Ratio – Summary
7.1
The resulting present value (PV) of net benefits using the standard MBCM 40-year analysis
period and 4% discount rate are summarised below:
• Travel time saving (107%)
$ 684.0m
• Vehicle operating cost savings (-15%)
$ -93.4m
• Vehicle emission reduction benefits (GHG) (<1%)
$ -1.2m
1982
• Vehicle emission reduction benefits (air pollutants) (<1%)
$ 0.5m
• Crash cost savings (5%)
$ 32.5m
• Active modes (1%)
$
6.9m
Act
• Holiday Travel Time (1%)
$ 7.6m
• Journey time reliability benefits (<1%)
$ 2.1m
•
TOTAL BENEFITS
$ 638.9m
7.2
The PV of costs are summarised below:
• Additional CAPEX (95%):
$ 640.3m
• Additional OPEX (5%):
$ 30.6m
Information
•
TOTAL COST
$ 670.9m
7.3
The resulting
BCR is 0.95 with a sensitivity range
0.71 - 1.4.
7.4
The First Year Rate of Return (FYRR) is
3.08%.
Official
7.5
Results of the sensitivity tests are included in Appendix A.
7.6
The assessment indicates that the BCR is borderline between having a 'low' rating (greater
than 1.0 but less than 3.0) and ‘very low’ (less than 1.0) for the
the
'Efficiency' component of
Waka Kotahi's Proposed Investment Prioritisation Method (IPM) priority ranking for the
National Land Transport Fund (NLTP) 2024-2027.
7.7
Note that this Economic Evaluation informs part of a wider IPM assessment which also
under
considers 'GPS alignment' and 'Scheduling' components. The IPM only relates to funding
being sought from the National Land Transport Fund (NLTF), and it is possible that some
(or all) of funding for this project could come from an alternative source (e.g. Public Private
Partnership (PPP) or some form of tolling).
7.8
s 9(2)(ba)(ii)
Released
Ref: 2024-007
Woodend Bypass Economic Assessment V03a
Page 17 of 21
© QTP Ltd 2024

Woodend Bypass – Economic Assessment
s 9(2)(ba)(ii)
1982
Act
Information
Official
the
under
Released
Ref: 2024-007
Woodend Bypass Economic Assessment V03a
Page 18 of 21
© QTP Ltd 2024
1982
Act
Information
Official
the
under
Released
1982
Act
Information
Official
the
under
Released

Woodend Bypass – Economic Assessment
Summary of Woodend Bypass Economic Assessment
1982
Prepared 17/10/2024
COSTS
BENEFITS
BCR
Option Description
Model Reference
COMPONENT
Undiscounted (40 year)
Present value (@4% 40 Year)
COMPONENT
Undiscounted (40 year)
Present value (@4% 40 Year)
Toll Revenue
BCR(N)
BCR(G)
FYRR
Act
CAPEX
Property
$ 34,900,000
$ 33,187,870
TTC
$ 1
,727,039,732
$ 6
84,039,893
Pre-Implementation
$ 56,500,000
$ 54,341,864
VOC
-$ 2
21,109,486 -$ 9
3,554,448
With Bypass, no Tolls
Option 2a_T00
Implementation
$
648,600,000 $ 552,768,421 Crash
$ 6
9,362,677
$ 3
2,512,361
$ -
0.95
0.95
3.08%
OPEX
Maintenance & Renewal
$ 87,034,576
$ 87,034,576
Other
$ 3
8,407,124
$ 1
5,855,969
TOTAL
$ 827,034,576
$ 827,034,576
TOTAL
$ 1
,613,700,047
$ 6
38,853,774
-$
11,800,000
COSTS
BENEFITS
BCR
Option Description
Model Reference
COMPONENT
Undiscounted (40 year)
Present value (@4% 40 Year)
COMPONENT
Undiscounted (40 year)
Present value (@4% 40 Year)
Toll Revenue
BCR(N)
BCR(G)
FYRR
CAPEX
Property
$ 34,900,000
$ 33,187,870
TTC
$ 1
,324,141,267
$ 5
08,610,129
Pre-Implementation
$ 56,500,000
$ 54,341,864
VOC
-$ 1
77,764,928 -$ 7
4,742,304
With Bypass, Woodend 30kph, Option 2b_Ta125
Implementation
$ 660,400,000
$ 562,094,132
Crash
$ 4
9,650,936
$ 2
2,780,642
$ 3
8,931,623
0.69
0.67
1.83%
Toll N of Pineacres $1.25/$2.50
OPEX
Maintenance & Renewal
$ 87,034,576
$ 30,598,542
Other
$ 3
6,407,169
$ 1
5,004,483
TOTAL
$ 838,834,576
$ 680,222,407
TOTAL
$ 1
,232,434,443
$ 4
71,652,950
$
-
Information
COSTS
BENEFITS
BCR
Option Description
Model Reference
COMPONENT
Undiscounted (40 year)
Present value (@4% 40 Year)
COMPONENT
Undiscounted (40 year)
Present value (@4% 40 Year)
Toll Revenue
BCR(N)
BCR(G)
FYRR
CAPEX
Property
$ 34,900,000
$ 33,187,870
TTC
$ 1
,300,268,059
$ 4
98,814,853
Pre-Implementation
$ 56,500,000
$ 54,341,864
VOC
-$ 2
00,231,899 -$ 8
5,577,585
With Bypass, Woodend 30kph, Option 2b_Tb125
Implementation
$ 665,400,000
$ 566,045,705
Crash
$ 7
7,808,532
$ 3
7,397,812
$ 5
4,271,353
0.68
0.65
1.76%
Toll S of Pineacres $1.25/$2.50
OPEX
Maintenance & Renewal
$ 87,034,576
$ 30,598,542
Other
$ 3
6,919,873
$ 1
5,127,825
TOTAL
$ 843,834,576
$ 684,173,980
TOTAL
$ 1
,214,764,564
$ 4
65,762,905
$
5,000,000
Official
COSTS
BENEFITS
BCR
Option Description
Model Reference
COMPONENT
Undiscounted (40 year)
Present value (@4% 40 Year)
COMPONENT
Undiscounted (40 year)
Present value (@4% 40 Year)
Toll Revenue
BCR(N)
BCR(G)
FYRR
CAPEX
Property
$ 34,900,000
$ 33,187,870
TTC
$ 9
04,975,350
$ 3
30,298,704
With Bypass, Woodend 30kph,
Pre-Implementation
$ 56,500,000
$ 54,341,864
VOC
-$ 1
85,248,818 -$ 7
8,848,811
the
Toll N & S of Pineacres
Option 2b_Tc125
Implementation
$ 677,400,000
$ 575,529,479
Crash
$ 5
5,829,442
$ 2
7,464,772
$ 1
25,088,731
0.42
0.29
0.48%
$1.25/$2.50
OPEX
Maintenance & Renewal
$ 87,034,576
$ 30,598,542
Other
$ 3
3,649,310
$ 1
3,555,137
TOTAL
$ 855,834,576
$ 693,657,754
TOTAL
$ 8
09,205,284
$ 2
92,469,802
$
17,000,000
COSTS
BENEFITS
BCR
Option Description
Model Reference
COMPONENT
Undiscounted (40 year)
Present value (@4% 40 Year)
COMPONENT
Undiscounted (40 year)
Present value (@4% 40 Year)
Toll Revenue
BCR(N)
BCR(G)
FYRR
CAPEX
Property
$ 34,900,000
$ 33,187,870
TTC
$ 7
57,385,334
$ 2
68,233,216
under
Pre-Implementation
$ 56,500,000
$ 54,341,864
VOC
-$ 1
98,038,469 -$ 8
4,526,865
With
Bypass, Woodend 30kph, Option 2b_Tb250
Implementation
$ 670,400,000
$ 569,997,277
Crash
$ 6
3,255,953
$ 3
0,934,884
$ 1
28,958,812
0.33
0.18
0.09%
Toll S of Pineacres $2.50/$4.50
OPEX
Maintenance & Renewal
$ 87,034,576
$ 30,598,542
Other
$ 3
3,063,945
$ 1
3,367,443
TOTAL
$ 848,834,576
$ 688,125,553
TOTAL
$ 6
55,666,763
$ 2
28,008,678
$
10,000,000
Note that numbers above are linked to spreadsheets and are not rounded to assist with checking (but do not imply an accuracy a corresp
onding level of accuracy)
Ref: 2024-007
Woodend Bypass Economic Assessment V03a
Page 22 of 22
© QTP Ltd 2024
Released