link to page 1
 Student Fees Paper – Final Version dated 20 September 2017
INTERNAL MEMORANDUM
Student Fees Paper – Final Version dated 20 September 2017
INTERNAL MEMORANDUM
To:
Finance Committee
Professor Stuart McCutcheon, Vice-Chancellor
From:
Adrienne Cleland, Deputy Vice-Chancellor (Operations)
Date:
27 September 2017
Subject:
Domestic Student Fees 2018 and International Student Fees 2019
Purpose
The purpose of this paper is to explain and recommend a schedule of 2018 domestic fees and
2019 international fees for consideration by the University’s Finance Committee and Council.
1. Summary
This memorandum presents the fees recommendations for domestic students for 2018 and
international students for 2019. The University’s medium-term financial forecasts, as
contained in the Long-term Academic Capital Plan, indicate that planned strategic investments,
to enhance quality and reputation of provision, and the planned capital programme can
continue to be funded without breaching operating surplus or other prudential requirements.
1
This is the case provided;
• Fees are increased as recommended
• International student numbers grow as projected
• Research contributions perform as projected
• The cost of administrative transactional activity continues to reduce as planned
• Other costs are contained in line with EFTS and student-to-staff ratios acknowledging
that the faculties of Arts and Education & Social Work will require additional budget
support in excess of standard ratios over potentially the next three years in order to
address student recruitment shortfalls and/or adjust costs.
The following section (Section 2) provides the environmental and strategic context for the fees
decisions. While the University of Auckland continues to be New Zealand’s highest ranked
university it has not been possible, with the resources currently available, to materially
improve our position in the two main global ranking systems (A methodological change
contributed to an improvement in QS in 2015). The recent THE ranking had us fall by 27 places
as previously lower ranked but better resourced universities have overtaken us. Maintaining a
high ranking is important to the University, its staff and students as it allows us to attract
world-class researchers, gives us access to international collaborations and opportunities,
ensures we attract high-quality international students, and increasingly, is a factor for
domestic students. The University’s ranking also influences the potential and continued
membership of international networks that enable valuable research and educational linkages
for our staff and students, and the willingness of our alumni and friends to support us.
Sustaining and improving our ranking requires us to invest in academic capability and world-
class facilities. To do that we require higher average revenues per student as well as
appropriate cost structures. The recent fall serves as a warning that if our performance
remains static we will inevitably move backwards down the rankings.
Section 3 summarises the expected University movement in costs. For 2018 specifically, the
University’s costs are expected to increase by 3.7% (2.8%, 2017). For 2019, the University’s
costs are expected to rise by a further 3.5%. The cost rises for 2018 are driven by increases
1 Please note that when the Long-term Academic and Capital Plan is refreshed we expect continuing building cost pressures will require
careful prioritisation and sequencing to maintain this position.
1 | P a g e
Student Fees Paper – Final Version dated 20 September 2017
in people costs (1.73%), other operating costs (0.53%), and asset-related costs (1.44%), and
are expected despite active initiatives to reduce the cost of administrative transactions.
Section 4 outlines the recommended 2018 fees for domestic students, which are tightly
controlled by Government policy. Domestic student fees would have to increase by 8.7%
(4.2%, 2017) to maintain revenue per EFTS at the same level as 2017 in real terms, but the
Annual Maximum Fee Movement regulations limit increases to only 2.0%. If the recommended
domestic student fee increases are not approved for 2018, the University will carry the full
revenue impact of that decision for the life of the Annual Maximum Fee Movement regime.
The recommended tuition fees represent an average increase per full-time domestic
student of $123 per annum and overall additional revenue from domestic students of $3.5
million.
A loss of this amount of revenue would require, for example, a reduction in staffing by
approximately 32 positions in addition to the significant operational pressures resulting from
the insufficiency in government funding increases for 2018.
Section 5 outlines the recommended 2019 fees for international students. International tuition
fee increases are not limited in the way that domestic fees are, so a combination of cost and
market factors have been taken into account in reaching a recommendation.
Section 6 provides the recommendations for increases in the Compulsory Student Services
Fee and is followed by section 7 which examines Other General Fees.
Section 8 provides a conclusion and provides all recommendations on Student Fees. These
include:
• For 2018 undergraduate programmes, postgraduate taught programmes, research
masters, bachelors honours programmes and doctoral programmes, that the maximum
allowable increases under the Annual Maximum Fee Movement regulations are applied
for domestic students.
• For 2019 international tuition fees it is recommended that an average increase of
4.1% be applied. An increase of 1.6% to the Study Abroad fee is recommended for
2019.
• For the Compulsory Student Services Fee, a fee of $6.78 per point (GST inclusive) or
$813.57 per full-time student, is recommended.
2 | P a g e
link to page 1 link to page 4 link to page 9 link to page 9 link to page 9 link to page 11 link to page 11 link to page 11 link to page 12 link to page 12 link to page 14 link to page 14 link to page 14 link to page 15 link to page 15 link to page 17 link to page 17 link to page 18 link to page 22 link to page 23 link to page 25
Student Fees Paper – Final Version dated 20 September 2017
Table of Contents
1. Summary .....................................................................................................................................................1
2. Context ........................................................................................................................................................4
3. Projected Cost Movements ......................................................................................................................9
3.1 Projected Cost Movements 2018 .........................................................................................................9
3.2 Projected Cost Movements 2019 .........................................................................................................9
4. Domestic Tuition Fees 2018 ................................................................................................................. 11
4.1 Impact of the shortfall between Government domestic funding rates and projected cost
increases ....................................................................................................................................................... 11
4.2 Undergraduate Fees ............................................................................................................................ 12
4.3 Postgraduate Fees ............................................................................................................................... 12
5. International Tuition Fees 2018 .......................................................................................................... 14
5.1 Market conditions ................................................................................................................................ 14
5.2 Consultation for 2018 international tuition fees ........................................................................... 14
5.3 Recommendation for 2019 international tuition fees .................................................................. 15
5.4 Study Abroad Fee ................................................................................................................................ 15
6. Compulsory Student Services Fee ...................................................................................................... 17
6.1 Compulsory Student Services Fee (CSSF) ..................................................................................... 17
6.2 Student Consultation .......................................................................................................................... 18
6.3 Recommendation for 2018 Compulsory Student Services Fee .................................................. 22
7. Other General Fees ................................................................................................................................ 23
8. Conclusion and Recommendations ..................................................................................................... 25
3 | P a g e
 Student Fees Paper – Final Version dated 20 September 2017
2. Context
Student Fees Paper – Final Version dated 20 September 2017
2. Context
New Zealand continues to have one of the most efficient university systems in the world in
terms of the quality of education received relative to cost.
Ranking
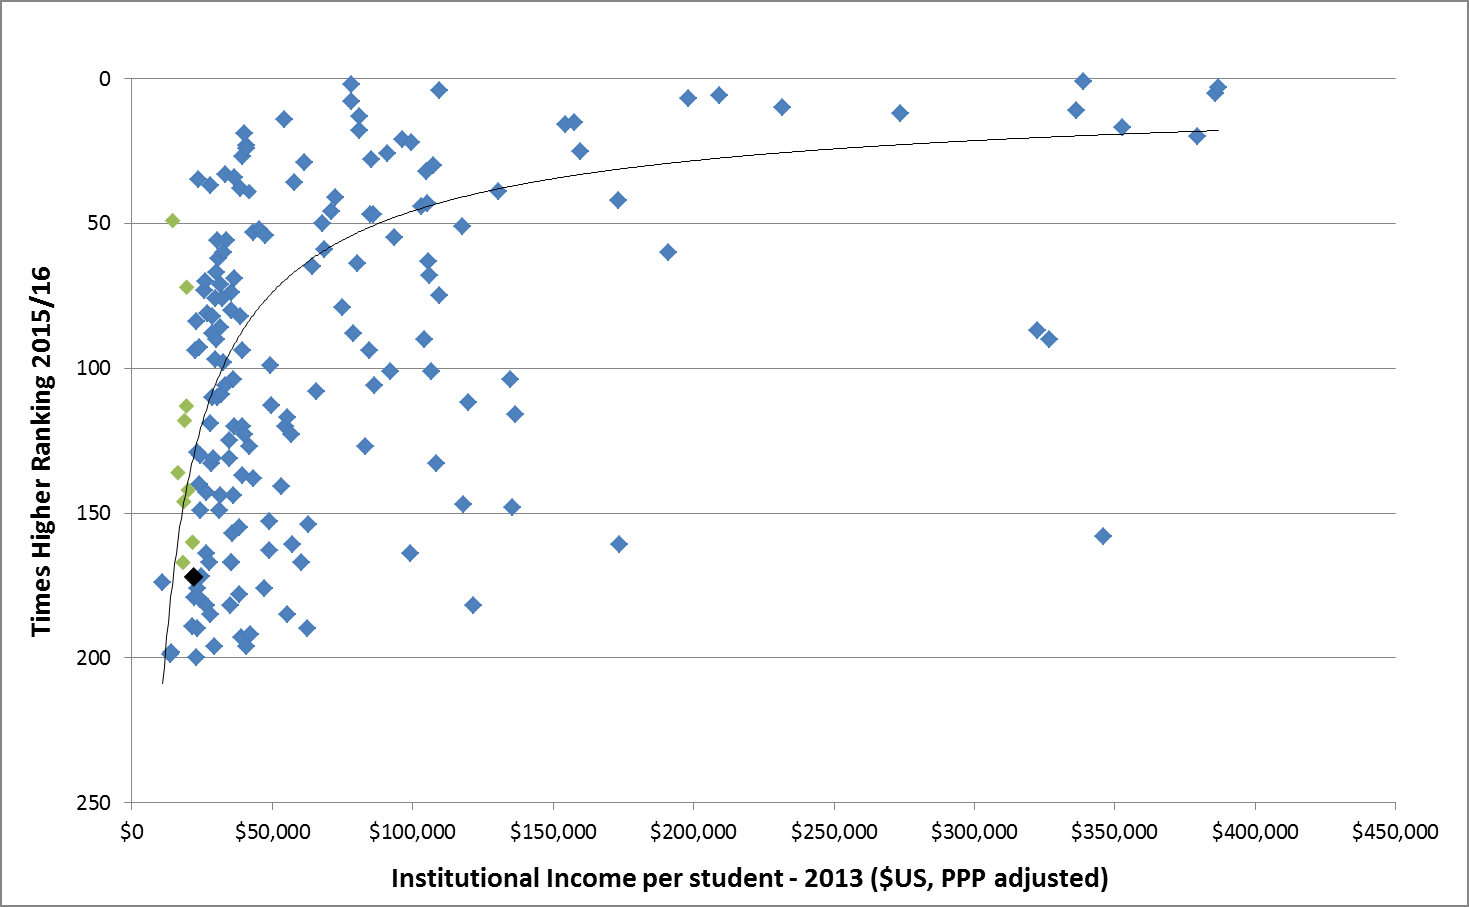
This efficiency is illustrated by figure 1 below, which plots ranking on the Times Higher
Education- world ranking of universities (the top 200) against expenditure per student
(expressed in $US on a purchasing power parity basis).
Figure 1. Institutional income versus Times Higher ranking 2015/16
Source: Times Higher dataset.
Note: Universities in green are those with less income than UoA, but higher ranking.
Rankings of universities in the Times Higher and QS systems typically improve with increased
income per student. Under the Times Higher Rankings system only nine of the world’s top 200
universities have a lower income per student but higher ranking than the University of
Auckland (shown in Figure 2 below). In the case of the QS system the number is just one
(Trinity College, Dublin)
4 | P a g e
link to page 5 link to page 5
 Student Fees Paper – Final Version dated 20 September 2017
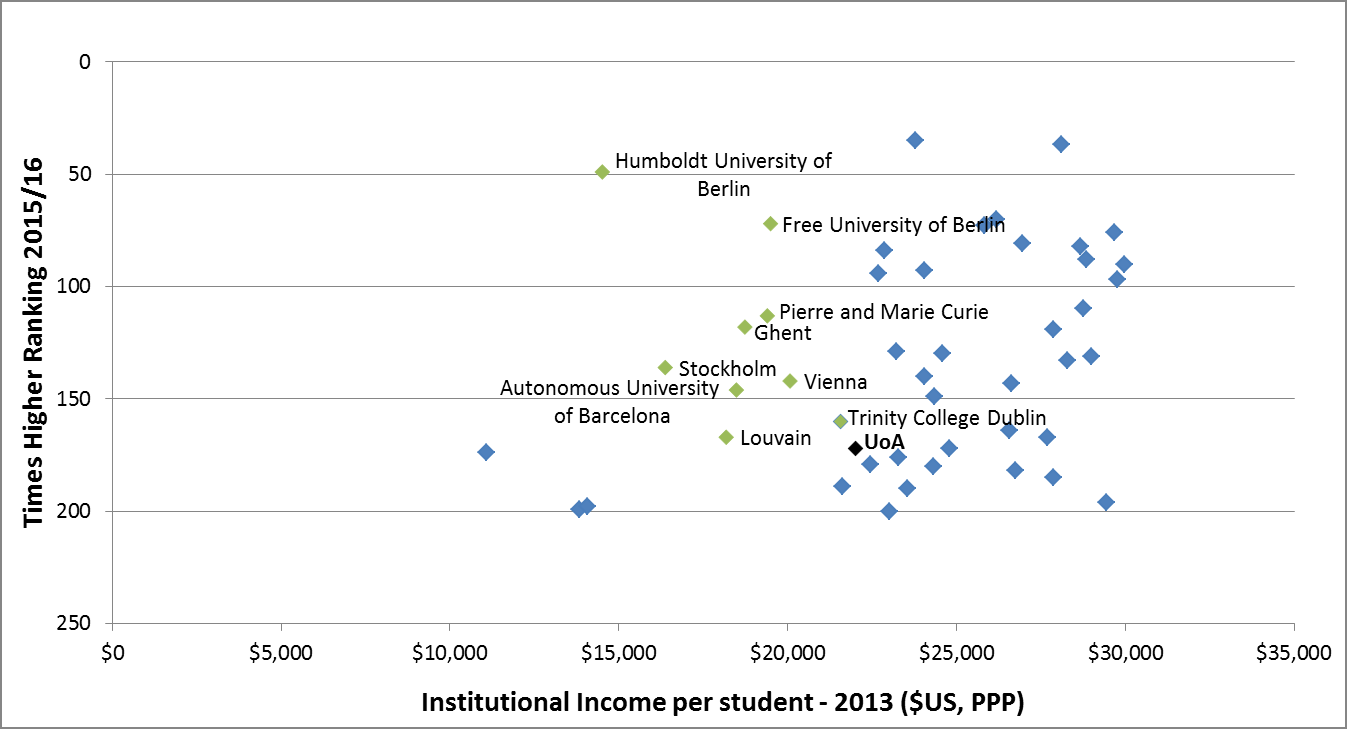
Figure 2. Institutional income per student versus Times Higher ranking 2015/16 – (universities with <$30,000)
Source: Times Higher dataset.
Student Fees Paper – Final Version dated 20 September 2017
Figure 2. Institutional income per student versus Times Higher ranking 2015/16 – (universities with <$30,000)
Source: Times Higher dataset.
We have analysed the characteristics of those universities that have a higher rank than the
University of Auckland but lower incomes per student. These universities are all European
universities with long histories and very strong reputations e.g. numerous Nobel Prize
winners. It is higher scores on the teaching, research and citations category scores (together
contributing 90% of the score) that drive the higher rankings of these universities under the
Times Higher methodology. Under the QS methodology the University of Auckland performs
relatively better, driven by a better performance on the reputational elements of the ranking
score (which contributes a lower proportion of the total score than in the Times Higher
system).
Government Support
There is significant variation in the cost of tertiary education and the level of support available
to students across the OECD. Together with Australia, the UK, the US, Canada and the
Netherlands, New Zealand falls into a group of countries with high tuition fees and well-
developed student support systems according to OECD’s categorization.
New Zealand spends a high proportion of GDP on tertiary education relative to the OECD.
However its expenditure on institutions is relatively low with only 52% of public investment in
tertiary education on the institutions, and 48% on support of students compared to an average
of 78% invested in the institutions in comparable countries across the OECD.
2 The relatively
high level of student support in New Zealand reflects a well-developed student financial
support system with a high level of public support for students designed to ensure that
participation is not compromised by the existence of tuition fees, and is consistent with but
higher than the picture seen in other countries where tuition fees are relatively high, for
example Australia (35% of funding in support of students), and the Netherlands (29%).
3
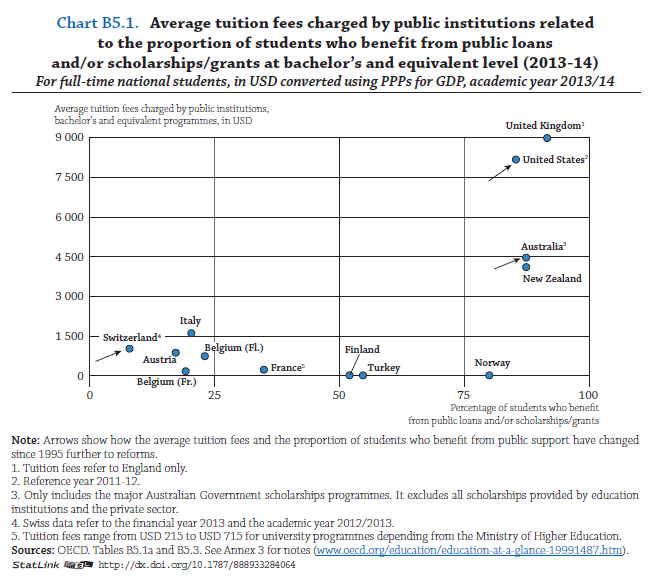
As is shown in the chart below from
Education at a Glance 2015 New Zealand students benefit
from a robust student financial support system, and one that compares favourably to systems
in other OECD countries in which fees are charged.
2 As a percentage of total public expenditure on education and GDP, for tertiary education (2011). OECD, 2014, Education at a Glance 2011 OECD
Indicators. Table B5.4 Public support for households and other private entities
3 OECD (2014). Education at a Glance 2014, p. 265.
5 | P a g e
 Student Fees Paper – Final Version dated 20 September 2017
Student Debt
Student Fees Paper – Final Version dated 20 September 2017
Student Debt
Concerns about mounting student debt are frequently raised in connection with New Zealand
universities’ annual fee setting. We have examined student loan debt trends in New Zealand and
reviewed the limited evidence from NZ and overseas on some of the wider social and economic
consequences of student debt (e.g. home ownership; family formation; entrepreneurial activity).
Focusing on university graduates only, average loan balances have hardly changed between
2002 and 2012 when adjusted for inflation. For most university qualifications (honours/postgrad
certificate/postgraduate diploma; bachelor; doctorate), average balances have declined
marginally in real terms. Only for Masters graduates did the real average loan balance increase
(by roughly 10%). This latter phenomenon appears to relate to the policy change in 2013
whereby postgraduate students are less likely to qualify for student allowances.
There is also little evidence of costs inhibiting enrolment of Māori and Pacific students. In 2015
approximately 69% of school leavers who achieved UE (in NCEA) went on to enrol at a New
Zealand university. The proportion for Māori and Pacific participation was similar at 65%
New Zealand evidence on the wider impact (e.g. on house purchase, partnering) of student loan
debt is limited to survey evidence. While there is some evidence from overseas pointing towards
negative implications of student debt (from the US and the UK where student debt levels are
significantly higher, and the findings are therefore not necessarily applicable to New Zealand),
this evidence must be considered together with the impact of attaining a degree on an
individual’s life-time earnings. There is certainly compelling evidence from New Zealand, as
6 | P a g e
link to page 7
Student Fees Paper – Final Version dated 20 September 2017
there is from elsewhere, that a degree is a worthwhile investment for an individual. Degrees
attract a significant earnings premium in New Zealand. As recent data released by Universities
New Zealand (2016) reveals, a typical graduate with a
bachelor degree will earn around $1.4
million more over their lifetime than a non-graduate, and this is after accounting for years of
lost earnings while studying and student loans.
4 For medical graduates the figure is closer to $4
million. The value of a university education is even greater for Māori and Pacific graduates who
earned 2.9x NZ median earnings in 2012 compared to the overall population where graduates
earn on average 2.6x median earnings. All of which explains the very significant increase in
numbers of students choosing to go to university over the last 20 years.
Context Summary
Thus the context in which we are setting fees is one in which our students have access to a high
quality university at a modest per student cost and with high levels of government support. The
context for the University is one in which we are trying to create, on behalf of students and the
country, an institution that is truly world-class with revenues that are extremely low by
international standards and strongly controlled by government policy. The University remains
committed to high entry standards but with strong support for those who were disadvantaged in
the compulsory sector, of offering a high quality, research-based, internationally connected
academic experience to students and of supporting them with a high level of extracurricular and
support activities, and in the provision of world-class facilities.
While New Zealand universities rate well in terms of quality compared with cost, the trend across
the New Zealand sector is for continued decline in rankings compared to international institutions.
Figure 3 below plots the QS rankings of each of New Zealand University over time, with the trend
being overwhelmingly downward (aside from the 2015 improvement in the rankings of some
universities resulting from a methodological change in how citations are handled).
This trend is linked to continuing falls in the real contribution made by revenue streams controlled
by Government relative to funding levels available to universities elsewhere.
4 Universities New Zealand (2016). Press Release – 16 February 2016: A Degree is a smart investment. Available:
http://www.universitiesnz.ac.nz/node/854
7 | P a g e
Student Fees Paper – Final Version dated 20 September 2017
Figure 3: NZ University QS rankings 2006-2017
0
100
Auckland
200
AUT
Waikato
ng 300
Massey
nki
Victoria
400
S Ra
Canterbury
Q
Lincoln
500
Otago
600
The University of Auckland continues to be New Zealand’s highest ranked University but has
struggled to materially reverse the decline in the two main global ranking systems. For the
University to move sustainably up the rankings, new investments are required in areas where the
University does not perform as well as it might. The University needs to increase average revenue
per student and to increase the number of high quality academics and research teams.
Given the growing use and influence of the international university rankings, including restrictions
being made based on rank (e.g. availability of scholarships in some countries from which we
source international students), it is important to have at least one highly ranked New Zealand
University. This will help ensure high quality world-class researchers and academics continue to
want to come to New Zealand, that New Zealand is not excluded from international collaborations
or scholarships, and that international students (and their parents or caregivers) continue to find
New Zealand tertiary education attractive.
New Zealand’s entire higher education system is likely to be held in higher regard if at least one
university is ranked in the top tiers.
8 | P a g e
Student Fees Paper – Final Version dated 20 September 2017
3. Projected Cost Movements
Our objective must be to ensure the University can operate sustainably in the medium and
long term. In order to maintain our quality and competitiveness objectives as well as deal
with financial constraints, we must align cost and revenues as much as possible. Therefore,
the recommendations for fee increases reference projected cost movements for the following
years.
3.1 PROJECTED COST MOVEMENTS 2018
Expected cost increases expected for 2018 can be grouped under three headings:
•
People Costs - The NZ Treasury is forecasting annual CPI of 1.6% for the
majority of 2018, reaching 2.0% by 2019. The University is currently projecting
a small increase in base salaries with promotions, mix shift, superannuation
participation and competitive pressures being the major factors resulting in an
overall increase of 3.28%.
•
Other Operating Costs: An inflation factor of 1.6%, based on the current NZ
Treasury CPI forecast for 2018, has been used as an estimate of the baseline cost
increases expected in 2018.
•
Building & Asset-Related Costs: Building and asset-related costs (e.g.
depreciation, maintenance, cleaning, utilities, security) which in a number of
cases are driven by previous spends of capital expenditure continue to increase
at a faster rate than CPI reflecting the current highly competitive market place
together with new projects and sites coming on stream; with a projected increase
for 2018 of 10.1%.
These costs have been considered in some detail over the medium term and the table
below shows the 2018 impact.
Table 1: Overall cost increases for 2018
COST TYPE
% INCREASE
% MIX OF COSTS AGGREGATE
People costs
3.28%
52.7%
1.73%
Other Operating Costs
1.60%
33.1%
0.53%
Building & Asset-related costs
10.10%
14.3%
1.44%
3.70%
This estimate in overall cost increases of 3.7% compares with the 3.0% movement in costs
used as the basis for the 2017 fee-setting process, and reflects, in particular, increased
asset-related costs.
3.2 PROJECTED COST MOVEMENTS 2019
Using the same methodology described above for the calculation of the 2017 projected
cost movements, the overall cost increases for 2019 over 2018 can be calculated as
follows:
•
People Costs:
An overall net increase of 3.78% is projected reflecting the higher CPI forecast
for 2019.
•
Other Operating Costs: An inflation factor of 2.10%, based on the current
Treasury CPI forecast for 2019.
9 | P a g e
Student Fees Paper – Final Version dated 20 September 2017
•
Building & Asset-Related Costs: Building and asset-related costs continue to
increase at a faster rate than CPI as new projects and sites come on stream, but
at a slower rate (5.72%). There is a risk that the percentage increase in this
category does not fall to this level as quickly as we currently estimate.
As for 2018 these costs have been considered in some detail over the medium term and
the table below shows the 2019 impact.
Table 2: Overall cost increases for 2019
COST TYPE
% INCREASE
% MIX OF COSTS AGGREGATE
People costs
3.78%
52.4%
1.98%
Other Operating Costs
2.10%
33.0%
0.69%
Building & Asset-related costs
5.72%
14.6%
0.84%
3.51%
10 | P a g e
Student Fees Paper – Final Version dated 20 September 2017
4. Domestic Tuition Fees 2018
4.1 IMPACT OF THE SHORTFALL BETWEEN GOVERNMENT DOMESTIC FUNDING RATES AND PROJECTED
COST INCREASES
Based on a 3.7% increase in costs and a 1.0% increase in Government Student
Achievement Component (SAC) funding rates, the increase in student fee revenue required
to maintain the same real revenue per EFTS would be 8.7%, as shown in the table below.
This compares to a 4.2% increase in student fee revenue required to maintain the same
real revenue per EFTS in 2017.
Table 3: Fees Increase Required to Maintain Constant Real Revenue per EFTS in 2018
BUDGET INCREASE INCREASE NOTIONAL
2017
%
$
2018
Student Component
$326.0m
1.0%
$3.3m
$329.3m
Domestic Fees
$176.0m
8.7%
$15.3m
$191.3m
Total
$502.0m
3.7%
$18.6m
$520.6m
If increases in Government funding rates fully reflected movements in the University’s
costs, they would increase by 3.7% for 2018. In fact, Government funding rates for 2018
are only increasing by an average 1%, effectively a cut, or an increase in Government
underfunding, of $8.8m.
The overall deficit, after taking account of the proposed increase in domestic student fees
is shown in the table below. The $11.8m deficit is the equivalent of approximately 107
staff positions (on average each full-time position in the University incurs costs of
approximately $110,000 per annum).
Table 4: Fees Increase Required to Maintain Constant Real Revenue per EFTS in 2018.
BUDGET
INCREASE INCREASE NOTIONAL
DEFICIT
2017
%
2018
Domestic Teaching Costs
$502.0m
3.7%
$18.6m
$520.6m
$0
Government contribution
required for zero fee inc
$326.0m
5.7%
$18.6m
$344.6m
$0
Actual Government
contribution
$326.0m
1.0%
$3.3m
$329.3m
$15.3m
Domestic Fees required
to make up deficit
$176.0m
8.7%
$15.3m
$191.3m
$0
Student Fees
recommended
$176.0m
2.0%
$3.5m
$179.5m
$11.8m
The University continues to pursue administrative efficiencies as part of its operational
effectiveness programme in order to reduce the impact of the lack of indexation of
government funding. The Faculty Administration Review, for example, allowed for the
recycling of administrative costs per EFTS by approximately $250 or 1.5%. Other initiatives
continue to build on these administrative efficiencies through the use of benchmarking and
process improvement techniques. In addition, a reduction in the ratio of space per student
is expected to be achieved on completion of the consolidated campus strategy i.e. the exit
of Tamaki, which is in progress, and Epsom campuses scheduled over the next 4-6 years,
11 | P a g e
Student Fees Paper – Final Version dated 20 September 2017
thereby reducing the impact of the general increases being experienced in asset-related
costs.
However more than offsetting these efficiency initiatives are: increased cost pressures
related to our property services portfolio such as depreciation, preliminary costs,
demolitions and increased repairs and maintenance; the need to invest in new and
improved services; for example new and expanded scholarship offerings, new academic
positions and programmes, wireless access, internship and employability services,
increased health and safety support and externally imposed costs, for example, the impact
of compliance with, amongst other legislation, hazardous materials regulations and the
Vulnerable Children Act.
It is also clear that students value well-specified fit-for-purpose facilities as well as having
sufficient space for their individual and team learning and social needs. Recent student
surveys indicate demand for a larger fit-for-purpose recreation centre and for greater
access to informal study spaces. The opening of the new Science Tower was indicative of
this demand with high occupancy of the ground-floor space within minutes of opening.
Students currently report increasing difficulty in finding space on campus to study between
lectures and to undertake group work.
Reducing the ratio of academic staff to students would reduce the overall cost per EFTS.
However this would also impact the quality of education offered which would be to the
detriment of students and therefore inappropriate. It would also negatively impact the
University rankings. The University continues to pursue a strategy of improving rather than
reducing quality and plans to continue the policy of allocating resources to faculties to
enable the staff: student ratios of the Go7 to be matched by discipline.
4.2 UNDERGRADUATE FEES
The Annual Maximum Fee Movement for 2018 has been set by Government at 2.0%. This
is the same as 2017 reduced from 3% for 2016 and 4% for 2011 to 2015, for all
Government-subsidised courses.
The University has two principal options to consider for undergraduate fees: increase all
undergraduate fees by the Annual Maximum Fee Movement or increase all or a selection
of undergraduate fees by less than the Annual Maximum Fee Movement.
Given that the application of the maximum allowable fee increase of 2.0% is well below
the estimated fee increase of 8.7% required to maintain the same real revenue per EFTS
in 2018, fee increases of less than the maximum allowable cannot be justified.
We therefore recommend that all undergraduate courses are increased by 2.0%, the
maximum allowable under the Annual Maximum Fee Movement regulations.
4.3 POSTGRADUATE FEES
As with undergraduate fees, we recommend that the Annual Maximum Fee Movement of
2.0% applies to postgraduate fees.
4.3.1 Postgraduate Taught Programmes
While recognising that broader financial issues remain important for students, when
considering fee levels for postgraduate taught programmes our conclusion is that price is
not the major influencer of choice, for several reasons:
• Most students report they are taking these programmes with an expectation of
career enhancement, in the form of promotion and/or earnings. An expectation of
greater earnings is usually associated with a willingness to invest to achieve that
outcome.
• The University’s brand and reputation is valuable to these students.
12 | P a g e
Student Fees Paper – Final Version dated 20 September 2017
• In the case of many such programmes, particularly in professional areas, a
proportion of students will have their fees wholly or partly covered by their
employer.
• To a certain extent cheaper programmes can be indicative of a lower value product.
As with the undergraduate programmes, the maximum allowable fee increase for
postgraduate taught programmes under the Annual Maximum Fee Movement regulations
of 2.0% is below the estimated fee increase of 8.7% required to maintain the same real
revenue per EFTS in 2018.
Our recommendation therefore, is that all postgraduate taught courses are increased by
2.0%, the maximum allowable under the Annual Maximum Fee Movement regulations.
4.3.2 Research Masters, Bachelors Honours Programmes & Doctoral Programmes
On average, the University of Auckland’s fees for research masters, bachelors honours
programmes and doctoral programmes are similar to those of New Zealand’s other major
universities.
Auckland’s high world ranking and leading local status is highly valued by postgraduate
students, since the reputation and value of a research-based programme is closely linked
to the reputation of the University from which it is gained. There are therefore no grounds,
based on comparison with other universities, to restrict fees growth. Indeed, if we were
able to charge appropriately we would command a price premium over the other NZ
Universities.
Again, as with undergraduate and taught masters programmes, the maximum allowable
fee increase for research masters, bachelors honours programmes and doctoral
programmes under the Annual Maximum Fee Movement regulations is, at 2.0%, below the
estimated fee increase of 8.7% that would be required to maintain the same real revenue
per EFTS in 2018.
Our recommendation therefore is that fees for all research masters, bachelors’ honours
programmes and doctoral programmes are increased by 2.0%, the maximum allowable
under the Annual Maximum Fee Movement regulations.
13 | P a g e

 Student Fees Paper – Final Version dated 20 September 2017
5. International Tuition Fees 2018
Student Fees Paper – Final Version dated 20 September 2017
5. International Tuition Fees 2018
In line with best practice, the University sets international student fees two years in advance
to maximise the efficiency of our recruitment efforts and to allow interested students and their
families to plan for their investment.
5.1 MARKET CONDITIONS
The University of Auckland saw continued growth in 2016 at 5.3% overall growth in
headcount, slightly below the overall university New Zealand sector growth of 6% for
international students by headcount. Growth was strongest in the PhD group at 7.8%,
followed by postgraduates at 4.4% and undergraduates at 5.2%.
Priority recruitment strategies for the next five years were confirmed in the 2016 Long-
Term Academic and Capital Plan exercise:
1. Post-graduate taught masters (PGT)
2. Transnational education (TNE)
3. Non-award / Study Abroad (SA)
4. Outbound.
Resource realignment and the initial work of the Strategic Recruitment and Admissions
project (SRA), as well as other market clarification efforts have begun to pay off and
results for Semester One 2017 were at record levels: +13% UG, +31% PG, +28% non-
award - with semester 2 tracking to target.
2016 saw government correcting the lower end of the Indian Private Training
Establishments (PTE) market, with potential negative immigration policy over-correction
impacts for the university sector going forward.
Brexit and Trumpit offer interesting opportunity for smaller markets such as New Zealand
but Canada and Ireland are best positioned to reap the benefits of the current rise of
nationalism. Immigration pressures in our own national elections continue to advise
caution in forecasting our ability to sustain strong growth in international enrolments.
The International Office, with the DVC (Strategic Engagement) team, is particularly
engaged in advocacy efforts and leadership at the national level in this regard.
5.2 CONSULTATION FOR 2018 INTERNATIONAL TUITION FEES
In last year’s exercise, and in the context of intensive planning for the Long-Term
Academic and Capital Plan (LTACP) and 2026 target setting, we undertook detailed
positioning analysis with each faculty, resulting in a differentiated approach to fees
proposed for 2018. This year’s proposal, to apply to 2019, is for a blanket increase of
4% with a few exceptions for further market repositioning building on the 2018 fees
paper. Figure 4 illustrates the average weighted increase for 2018 as well as the 10-year
average.
6.0%
5.0% 5.0% 5.0%
4.9% 5.0%
5.0%
4.0%
3.9% 3.6%
3.9%
4.0%
3.3% 3.6% 3.1% 2.8% 3.1%
3.0%
2.0%
1.0%
0.0%
Figure. 4. Average rate of increase in international tuition fees, last 13 years
14 | P a g e
Student Fees Paper – Final Version dated 20 September 2017
Continuing our work with the International Tuition-based Competition Database (ITBCD),
produced by Illuminate Consultant Group (ICG), we graphed several increase possibilities
for each faculty, forecasting the impact on our positioning for 2020. These are based on
several assumptions: 2016 & 2017 actual fees, 2018-2020 forecast fees for the
competition based on their historical rate of increase, as determined by ICG. In addition,
we consulted a bespoke survey of Australia and New Zealand international tuition fees
produced by StudyMove for Universities New Zealand.
The University’s traditional pricing strategy has been to position our fees at the top of the
New Zealand market and below the median of the Group of 8. Whilst we have posited
previously that international UG students are relatively impervious to modest pricing
fluctuations, the international PG student is comparison shopping from a broad market
and is very cost-sensitive. Consequently, we have maintained our current market
positioning with some adjustments for particular programmes (Business and Economics,
Engineering and Law).
5.3 RECOMMENDATION FOR 2019 INTERNATIONAL TUITION FEES
As a result of our consultation, we recommend the following increases by faculty for
2018, as illustrated in Table 5 below.
2019
B&E
ENGR
SCI
Arts
CAI
Law
FMHS
EDSW
UG
5.0%
2.0%
4.0%
4.0%
4.0%
4.0%
4.0%
4.0%
PG
5.0%
4.0%
4.0%
4.0%
4.0%
5.0%
4.0%
4.0%
Study Abroad Fee:
$12,950
Table 5. Recommended international tuition fee increases by faculty for 2019
Our assessment of EFTS weighting by faculty and study level, assuming 2018 projected
EFTS enrolment levels at the proposed 2019 international tuition rates, represents an
overall weighted increase of 4.1% of international full fee tuition revenues university-
wide for 2019. Taking into account the 2019 EFTS projections, an overall increase in
revenue from international full fees from 2018 to 2019 is 7.4%.
5.4 STUDY ABROAD FEE
Recommendation: 1.6% increase to $12,950
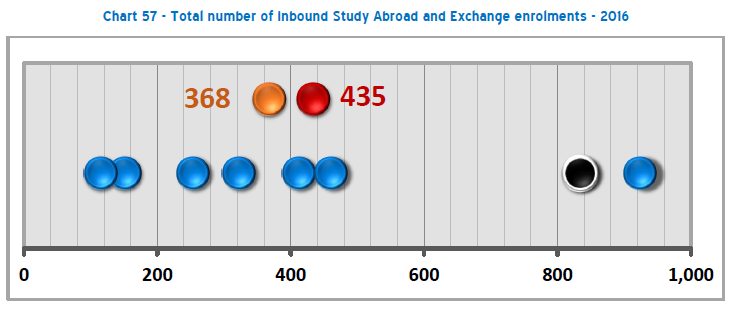
Otago retained the leading market share for fee-paying in-bound non-award students in
2016 but the University grew market share significantly. The University of Auckland is
represented by the black dot in the figure 5 below.
15 | P a g e
link to page 16
 Student Fees Paper – Final Version dated 20 September 2017
Figure 5. Total number of Inbound Study Abroad and Exchange Enrolments (Source: Huckel, D., Ramirez, K. (2017).
Student Fees Paper – Final Version dated 20 September 2017
Figure 5. Total number of Inbound Study Abroad and Exchange Enrolments (Source: Huckel, D., Ramirez, K. (2017).
New Zealand International Education Benchmark. Sydney, Australia: StudyMove) 5
The Generation Study Abroad non-award growth strategy approved in 2015, sets the
goal to double non-award enrolments by 2020. This strategy is particularly beneficial to
the Faculty of Arts as almost all inbound study abroad students take some courses in
Arts while here. We have recently repositioned our offering in the market with significant
enhancements to services. We have held the Study Abroad fee steady at $12,750 for
the last three years (2016 – 18) to support our aggressive repositioning in this market.
We recommend a 1.6% increase for 2019 to $12,950. For 2020, we will review gains
achieved through this strategy and consider whether additional value may be achieved
from a pricing readjustment as we may be priced lower than other New Zealand
universities at that stage. For 2017, the average semester study abroad fee at New
Zealand universities is $12,373 compared to $10,884 for Australia.
5 In the above figure the blue dots represent the other NZ Universities. The University of Auckland is represented by the black dot and our assumption
is that Otago University is to our right. For completeness we have also shown the mean and median which are represented by the orange and red
dots respectively.
16 | P a g e
Student Fees Paper – Final Version dated 20 September 2017
6. Compulsory Student Services Fee
6.1 COMPULSORY STUDENT SERVICES FEE (CSSF)
The Government passed legislation in 2011 that provides the Minister of Tertiary Education
the power to prescribe the range of services that may be funded by compulsory student
services fees. The current Ministerial direction on compulsory student services fees
prescribes the eligible range of services as follows:
(a)
Advocacy and legal advice: Advocating on behalf of individual students and
groups of students, and providing independent support to resolve problems. This
includes advocacy and legal advice relating to accommodation.
(b)
Careers information, advice and guidance: Supporting students’ transition into
post-study employment.
(c)
Counselling services and pastoral care: Providing non-academic counselling
and pastoral care, such as chaplains.
(d)
Employment information: Providing information about employment opportunities
for students while they are studying.
(e)
Financial support and advice: Providing hardship assistance and advice to
students on financial issues.
(f)
Health services: Providing health care and related welfare services.
(g)
Media: Supporting the production and dissemination of information by students to
students, including newspapers, radio, television and internet-based media.
(h)
Childcare services: Providing affordable childcare services while parents are
studying.
(i)
Clubs and societies: Supporting student clubs and societies, including through
the provision of administrative support and facilities for clubs and societies.
(j)
Sports, recreation and cultural activities: Providing sports, recreation and
cultural activities for students.
A comparison of 2017 non-tuition fees for New Zealand Universities is shown in the table below.
NZ$ (GST
Massey
inclusive)
Canterbury
Massey
(Albany)
Otago
Waikato
Victoria
Auckland
Building Levy
$29.30
Student Amenities
Levy
$234.20
Student Assistance
$24.00
Welfare & Recreation
$72.90
$150.10
Student Services
$795.00
$555.80
$555.80
$739.00
$479.00
$730.50
$765.00
Student Association
Foundation Levy
$23.40
$23.40
Total - 2017
$795.00
$681.40
$963.50
$739.00
$479.90
$754.50
$765.00
Total - 2016
$770.00
$670.60
$948.00
$732.00
$467.80
$742.00
$754.80
% change vs 2016
3.14%
1.58%
1.61%
0.95%
2.34%
1.66%
1.33%
$ change vs 2016
$25.00
$10.80
$15.50
$7.00
$11.20
$12.50
$10.20
Appendix E provides a full breakdown of the distribution of the University’s CSSF income by service
category.
17 | P a g e
Student Fees Paper – Final Version dated 20 September 2017
6.2 STUDENT CONSULTATION
In 2017 the annual consultation on the CSSF was undertaken between April and August.
Multiple channels for communication and feedback were utilised as part of the
consultation processes and an outline of the process and findings are summarised below.
Consultation on the CSSF began in April at the Student Consultative Group (SCG)
meeting with an overview of current Student Services fee allocations. In June a
comprehensive Consultation Document (“Consultation Document”) (Appendix E) was
developed by Campus Life and the Auckland University Students Association (AUSA) and
signed off by the Vice-Chancellor. The Consultation Document outlined key information
on the CSSF including its definition, purpose, and collection method. Detail on the
current allocation areas along with a summary of the allocation of funds to the particular
service area was included in the document. In June the Consultation Document was
circulated to all SCG members, as well as the main student groups within the University
and was made available on the University of Auckland website.
In addition to the Consultation Document, a joint University and AUSA survey was
created to seek feedback from the student body. This joint survey replaced the previous
two surveys conducted separately by each organization, signifying a significant step
forward in the partnership between the University and AUSA.
The survey sought student feedback to:
• ascertain the current level of satisfaction with CSSF allocation;
• provide information on the current services that receive funding; and
• seek feedback on prioritization of allocation levels.
The survey also sought feedback on any additional services currently not funded that
respondents felt should be represented in the CSSF process. The survey contained links
to the Consultation Document so that respondents could find further information about
the CSSF. A link to the survey was placed on the University of Auckland website in June
and was promoted to students via social media and other sources including via AUSA and
student clubs. The survey was open for five weeks until early July. The survey received
772 responses from students, and although less than 2% of the student base was an
increase of 284% on the previous year (in 2016 the University survey received 201
responses).
The SCG was kept informed of the consultation process and it was an agenda item on
SCG meetings in June, July and August, providing opportunities for feedback or requests
for further information. The President of AUSA, Will Matthews, presented the survey
results to SCG at its July meeting. A copy of the presentation is appended to this paper
(see Appendix F).
In addition to the SCG meetings and survey responses, Campus Life and AUSA met
throughout July and August to further discuss the results of the survey and consider
recommendations for allocation of the levy in 2018, including key areas for additional
funding based on student feedback. At the SCG meeting in August, AUSA President (Will
Matthews) and AUSA Education Vice President (Jessica Palairet) gave a presentation
summarizing the key feedback from the student body and making recommendations for
additional expenditure in the areas of health and wellbeing, international student support
and orientation activities. A copy of the presentation is appended to this paper (see
Appendix G).
The consultation process has continued to improve with greater transparency and
completeness of information. This year saw a marked improvement in the collaboration
between Campus Life and student groups, particularly AUSA, with partnering on the
consultation document, the levy survey and the recommendations for future expenditure.
The amount of information available to students and the multiple consultation channels,
coupled with the timing of SCG meetings to allow for earlier and more frequent
engagement has generated good discussion on the Student Services fee at SCG. We will
continue to work together with student groups to seek improvements to the consultation
process.
18 | P a g e
Student Fees Paper – Final Version dated 20 September 2017
Key Survey Findings
A summary of the survey was presented to SCG at its July meeting and this presentation
is located at Appendix F.
Key information about the survey:
• There was an increase in the number of students responding to the survey this
year (772 in 2017 compared to 201 in 2016) although this represents less than
2% of the total student population
• The survey sample was more representative of the student population than in
previous years, with the distribution of undergraduate, postgraduate and the main
faculty of students being characteristic of the general student population
• The findings are broadly consistent with previous years and show no significant
differences in trends
Students were asked to rank the importance of services to them personally and to the
whole student body. The key findings were:
• Health and counselling services continue to be the most important to students
surveyed, with an increase of importance placed on this service in 2017 compared
to previous years. This is reflective of feedback from other survey instruments
(new students survey, Teaching & Learning Survey) that also highlight health and
counselling services as being important to students. 84.9% of students rated
these as the most important to them personally. 66% of students agreed that
these services should be given more priority, an increase from 62% in 2016
• Careers and employability services rated second most important to students, and
is also reflective of feedback from other survey instruments. 67.6% of students
rated these services as important to them personally. However just one third
(33.5%) of students agreed that these services should be given more priority in
future.
• Student advocacy (services provided by student groups such as AUSA, PGSA,
NTM) and clubs and societies were ranked equally as the third most important
category to students responding to the survey. Students ranked clubs and
societies as being more important to the whole student body than to them
personally, while they ranked student advocacy more important to them
personally. This reflects the personal and individual nature of many advocacy
services.
The table below outlines the rankings for all service areas surveyed.
Service
Importance to whole student
Importance to students
Overal
body
personal y
Ranking
Health & Counselling
4.67
1
4.73
1
1
Careers & Employability
4.23
2
3.73
2
2
Clubs and Societies
3.94
3
3.58
4
=3
Student Advocacy
3.92
4
3.6
3
=3
Pastoral Care
3.91
5
3.52
5
5
Sport & Recreation
3.69
7
3.34
6
6
Cultural & Sporting Events
3.7
6
3.27
7
7
Transition & Orientation
3.6
8
3.19
8
8
Accommodation Advisors
3.53
9
2.93
9
9
Chapel & Prayer Services
3.04
10
2.09
10
10
19 | P a g e
 Student Fees Paper – Final Version dated 20 September 2017
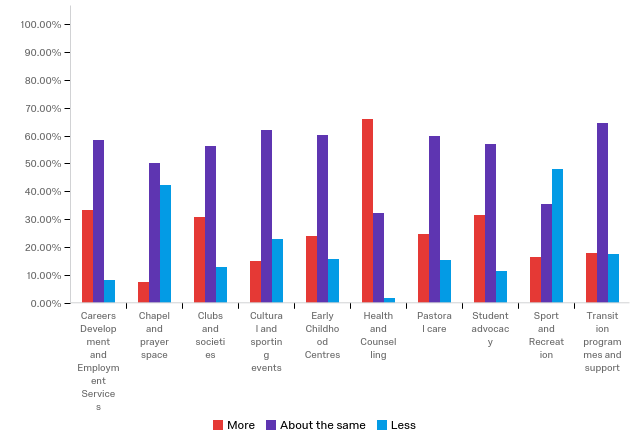
Students were asked what level of priority (i.e. spending) should be given to each of the
services in the future. Responses were generally consistent with the importance rating,
however of note:
• Health and counselling was the only service students thought should have more
priority in future
• Sport and recreation was the only service students thought should have less
priority in the future. This response is connected with the capital charge that is
being set aside for future sport and recreation facility rather than the provision of
sport and recreation services
• All other services students thought should receive about the same priority,
indicating they are comfortable with the current spend in those service areas.
The priority level for each area of service in the survey is represented in the graph below.
Students were also asked to identify any other services not listed that should be funded
by the levy. 38 free text responses were received, and most of these were about services
already funded by the levy. A number of responses indicated there should be more
specific funding for international student services, a number of responses asked for more
social and study spaces on campus, a number of responses asked for more free or
subsidized food. A number of responses specifically mentioned transport issues getting to
and from campus.
2018 Expenditure
Campus Life and AUSA representatives met several times throughout July and August to
discuss the 2018 expenditure of the CSSF. There are three proposals for additional
expenditure that are supported by both groups, and these were presented to SCG at its
August meeting (see a copy of the presentation at Appendix G).
20 | P a g e
Student Fees Paper – Final Version dated 20 September 2017
Service Area
AUSA Recommendation
Health & Counselling
Health and counselling was the only That an additional $200,000 be allocated to
service students surveyed felt needed fund health and counselling services in the
more priority in future. This is reflective following areas:
of the growing importance of mental
health within the university community, •
expand the Wellbeing Program to be
and indeed the general community.
directed at increased education and
Mental Health services in particular are
training for students and staff, increased
in greater demand, and this is a trend
communication of self-help tools and
throughout all universities. The
support services, increased funding for
university has made progress at
student-led resources and activities that
initiating a proactive wellbeing program
increase awareness of mental health and
aimed and equipping staff across the
wellbeing
university to identify and appropriately •
additional temporary staffing during peak
refer mental health matters, increase
times to ensure appointment availability
awareness amongst the student body
and wait times are kept to a minimum
and in particular provide information to
students to self-help. An expansion of
this program would enable a more
proactive approach to student mental
health, with a focus on prevention and
self-management as well as peer-based
support within the student community.
Orientation & Transition
This year saw a significant improvement That an additional $50,000 be allocated to
in the orientation activities provided further expand and enhance Orientation
through a partnership between AUSA activities.
and Campus Life and the uptake of the
various events and activities across the
period was increased as was the
satisfaction with the activities.
Additional funding would allow further
improvements to be made, including
expanding the Albert Park precinct,
expand the major event (Party in the
Park) from 2000 to 4000 attendees, and
improved transition initiatives such as
additional tours, better signage,
increased access to UniGuides.
International Student Support
International student support is not a That $55,000 be allocated to fund support,
specific service area within the CSSF or networking and engagement programmes
the survey. Support for international aimed at international students.
students is entwined in a number of
service areas, including student
advocacy and pastoral care. While for
these areas students indicated the same
level of priority should be given, there is
a strong case to provide additional funds
to support international students. The
University has growth targets for
international students, and as our
population grows, it is important that
21 | P a g e
Student Fees Paper – Final Version dated 20 September 2017
students are supported effectively.
AUSA has piloted an international
student buddy program that provides
social support for international students.
This has been extremely popular in 2016
and AUSA wishes to grow this activity,
ensuring that it fits within the suite of
pastoral care services offered through
various parts of the university.
6.3 RECOMMENDATION FOR 2018 COMPULSORY STUDENT SERVICES FEE
As with the other fees is it important to understand the cost movements in the underlying cost
types. Overall cost increases for 2018 based on a heuristic assumption of a 30/20/50 split between
People, Other Operating, and Asset-related costs leads to a weighted cost increase of 6.35%. This
is shown in the following Table.
COST TYPE
% INCREASE
% MIX OF COSTS AGGREGATE
People costs
3.28%
30%
0.98%
Other Operating Costs
1.60%
20%
0.32%
Building & Asset-related costs
10.10%
50%
5.05%
6.35%
As a result of our consultation and movements in costs, we recommend the following approach
for 2018:
1. The Compulsory Student Services Fee (CSSF) be increased by $48.57 (6.35%), being
the University’s 2018 projected cost movement for relevant services as outlined in
the above table. We note that the annual per full-time student charge would increase
from $765 in 2017 to $813.57 in 2018 enabling all funded services to be maintained
at their current level.
2. That the CSSF be used for additional spending of $305,000 to be allocated in the
following manner:
(a) $200k to the health and counselling service primarily to expand the proactive
wellbeing program
(b) $55k to provide enhanced networking and engagement programmes to
international students
(c) $50k to enhance orientation events and activities
3. Note that the additional spending of $305,000 is not being recovered through an
increase to the CSSF and therefore it effectively reduces the real value of the capital
charge that is being set aside for a future sport and recreation facility. Sport and
Recreation was the only service the 772 responding students thought should have
less priority in the future and this signal along with the continuing trend of reductions
in the capital charge will need to be considered within the refresh of the Long Term
Academic and Capital Plan.
22 | P a g e
Student Fees Paper – Final Version dated 20 September 2017
7. Other General Fees
A full list of general fees is included in Appendix C.
The following changes to the general fees are recommended.
Official Academic Records
In April 2017 academic records were digitised with the implementation of the My eQuals
cloud based platform.
This has changed the way official documents, such as graduation certificates and transcripts,
are provided to students and alumni giving them 24/7 access to their academic records, in a
format that can be easily and securely shared, enhancing student mobility and providing
credential integrity and security for digital student academic data.
To further enhance the service to our students and alumni, all graduates from 2010, and
future years, will be provided with a free certified digital transcript and graduation
certificate. The current student management system was implemented in 2010 and the
functionality between this system and Cloud-based technology has allowed for the easier
transfer of data. Student records from prior to this date (2010) require manual resources to
access and transcribe the information into the Cloud, so a charge is proposed for historic
records.
A fee is also proposed for students requesting a digital transcript who have not yet
completed a formal award as this also requires manual work to prepare. It should be noted
that students can download an unofficial version of their transcript at any time during their
studies, free of charge, from the student management system.
Official letters have retained a charge as both digital and hardcopy versions need to be
created manually. Digital versions are uploaded to My eQuals as PDFs, as currently there is
no data transfer for these document types between the systems.
The provision of hard copy official document charges has not changed, but the service is now
only available where the 3rd party recipient employer or professional body has indicated they
are not yet able to accept certified digital documents. A sector wide approach will be taken
to engage those third parties who are slow to adopt digital versions, as all New Zealand and
Australian universities are moving to digital provisioning of records.
Application fee
Over the last few years there has been a significant increase in applications from self-
referred international applicants, though there has not been a comparable improvement in
conversion from this group, indicating that we are not receiving a higher volume of quality
applications. Applications from the international self-referred transferring group have
increased 140% over the last 5 years, however conversion from application to enrolment has
decreased from 13.6% in 2012 to 9% (to date) in 2017. See Appendix D for more
information.
With the University now publishing more transparent information regarding programmes,
entry requirements and eligibility (including the GPE Calculator, programme pages
identifying entry requirements and the transfer credit calculator), prospective applicants now
have a lot of information to help guide their decision making, to support them to apply for a
programme(s) that they may be eligible for. Further work to support the applicant journey
should see an increase in the quality of applications coming through. However, with limited
boundaries to the application process, it is important for applicants to be considering their
choices before submitting one or more applications in order to support increased quality and
conversion. A review of application fees is timely to support this. The recommendations
below align with charging regimes at other Australian and New Zealand universities for
international applicants.
23 | P a g e
Student Fees Paper – Final Version dated 20 September 2017
Currently application fees are charged depending on application type and only apply to some
domestic applicants where there is complexity in assessing their application. They are
charged at the point assessment begins by a staff member within Academic Services.
It is recommended that an application fee is introduced for international applicants (ad
eundem statum) and reduced for domestic applicants (ad eundem statum) to align the fees,
with the following exclusions:
•
Applicants applying through a registered Agent or under an Articulation Agreement with
partner institutions
•
Applicants applying with study from another New Zealand tertiary institution (unless also
applying for credit)
•
NZ School Leaver applicants
•
Applicants applying from AGC New Zealand International College or Taylors College Auckland
It is also recommended that the Vice-Chancellor has delegated authority to make any other
exclusions to these fees to support strategic partnerships and recruitment priorities. The
proposed fees are outlined in Schedule –Part A (Appendix C). The application fee will be
charged and will be required to be paid in order to submit an application for admission. The
fee will only be charged once, allowing an applicant to go on to apply for more than one
programme.
It is important to note that the application (admission) fee will be offset against tuition fees,
should the applicant go on to enrol.
24 | P a g e
Student Fees Paper – Final Version dated 20 September 2017
8. Conclusion and Recommendations
For 2018 undergraduate programmes, it is recommended that the maximum allowable
increases under the Annual Maximum Fee Movement regulations are applied for domestic
students.
For all 2018 postgraduate taught programmes, research masters, bachelors honours
programmes and doctoral programmes, it is recommended that the maximum allowable
increases under the Annual Maximum Fee Movement regulations are applied for domestic
students.
Detailed schedules of the recommended domestic tuition fees for 2018 are attached as
Appendix A.
The recommended tuition fees represent an average increase per full-
time domestic student of $123 per annum. For 2019 international tuition fees it is recommended that an average increase of 4.1% be
applied. An increase of 1.6% to the Study Abroad fee is recommended for 2019.
Detailed schedules of the recommended international tuition fees for 2019 are attached as
Appendix B.
For the Compulsory Student Services Fee, a fee of $6.78 per point (GST inclusive) or $813.57
per full-time student, is recommended.
All other fees are set as outlined in Appendix C.
It is recommended that Finance Committee recommend to Council:
THAT this report be received
THAT Council approve the attached Domestic Fees Schedule for 2018
THAT Council approve the attached International Fees Schedule for 2019
THAT Council authorise the Vice-Chancellor to assign any new programmes, or programmes
becoming newly available to international students in 2019, to an appropriate band to
enable offers to be made during the recruitment cycle, and report these decisions back
to Council
THAT Council authorise the Vice-Chancellor to set fees for University programmes delivered
offshore and to report those to the Council meeting immediately following
THAT Council authorise the Vice-Chancellor to authorise faculty Deans to award bursaries
(effectively a discount) on international fees on the understanding that this should drive
volume, that the published fee remains at the approved rate and that standard University
overheads are not compromised
THAT Council approves the Compulsory Student Services Fee at $6.78 per point (GST inclusive)
THAT Council approve the attached Other Fees Schedule for 2018
Professor Stuart McCutcheon
Adrienne Cleland
VICE-CHANCELLOR
DEPUTY VICE-CHANCELLOR (OPERATIONS)
25 | P a g e
Document Outline