
Domestic Student Fees 2019 and International Student Fees 2020
Briefing to Finance Committee
The purpose of this paper is to explain and recommend a schedule of 2019 domestic fees and
2020 international fees for consideration by the University’s Finance Committee and Council
Professor Stuart McCutcheon, Vice-Chancellor
Adrienne Cleland, Deputy Vice-Chancellor (Operations)
8 October 2018
Page
1 of
31
link to page 2
Student Fees Paper – Final Version 1.1 dated 04 October 2018
1. Summary
world- class facilities. To do that we require higher average revenues per
This memorandum presents the fees recommendations for domestic student as well as appropriate cost structures.
students for 2019 and international students for 2020. The University’s
medium-term financial forecasts, as contained in the Long-term Academic
The recent fall serves as a warning that if our performance remains static
Capital Plan, indicate that planned strategic investments, to enhance we will inevitably move down the rankings.
quality and reputation of provision, and the planned capital programme can
continue to be funded without breaching operating surplus or other Section 3 summarises the expected University movement in costs. For
prudential requirements.
1 This is the case provided;
2019 specifically, the University’s costs are expected to increase by 3.15%
(3.7%, 2018). For 2020, the University’s costs are expected to rise by a
•
further 5.3%. The cost rises for 2019 are driven by increases in people
Fees are increased as recommended
•
costs (1.95%), other operating costs (0.51%), and asset-related costs
International student numbers grow as projected
•
(0.69%), and are expected despite active initiatives to reduce the cost of
Research contributions perform as projected
•
administrative transactions.
The cost of administrative transactional activity continues to reduce
as planned
•
Section 4 outlines the recommended 2019 fees for domestic students,
Other costs are contained in line with EFTS and student-to-staff
ratios acknowledging that the Faculty of Education & Social Work
which are tightly controlled by Government policy. Domestic student fees
will in the short term require additional budget support in excess of
would have to increase by 6.0% (8.7%, 2018) to maintain revenue per
standard ratios in 2019
EFTS at the same level as 2018 in real terms, but the Annual Maximum Fee
Movement regulations limit increases to only 2.0%. If the recommended
The following section (Section 2) provides the environmental and strategic
domestic student fee increases are not approved for 2019, the University
context for the fees decisions. While the University of Auckland continues
will carry the full revenue impact of that decision for the life of the Annual
to be New Zealand’s highest ranked university it has not been possible,
Maximum Fee Movement regime.
The recommended tuition fees
with the resources currently available, to maintain our position in the two
represent an average increase per full-time domestic student of
main global ranking systems. The THE rankings (released 27th September
$159 per annum and overall additional revenue from domestic students
2018) have us fall, for the first time, outside the Top 200 ranked of $4.6 million.
A loss of this amount of revenue would require, for example,
universities. Our understanding of the data indicates that relatively lower
a reduction in staffing by approximately 42 positions in addition to the
student:staff ratios combined with higher teaching revenues per academic
significant operational pressures resulting from the insufficiency in
have allowed previously lower ranked but better resourced universities to
government funding increases for 2019.
overtake us. Maintaining a high ranking is important to the University, its
staff and students as it allows us to attract world-class researchers, gives
Section 5 outlines the recommended 2020 fees for international students.
us access to international collaborations and opportunities, ensures we
International tuition fee increases are not limited in the way that domestic
attract high-quality international students, and increasingly, is a factor for
fees are, so a combination of cost and market factors have been taken into
domestic students. The University’s ranking also influences the potential
account in reaching a recommendation.
and continued membership of international networks that enable valuable
research and educational linkages for our staff and students, and the Section 6 provides the recommendations for increases in the Compulsory
willingness of our alumni and friends to support us. Sustaining and Student Services Fee and is followed by section 7 which examines Other
improving our ranking requires us to invest in academic capability and
General Fees.
1
Please note that when the Long-term Academic and Capital Plan is refreshed we expect
continuing building cost pressures wil require careful prioritisation and sequencing to maintain
this position.
2 | P a g e
Student Fees Paper – Final Version 1.1 dated 04 October 2018
Section 8 provides a conclusion and provides all recommendations on
Student Fees. These include:
• For 2019 undergraduate programmes, postgraduate taught
programmes, research masters, bachelors honours programmes
and doctoral programmes, that the maximum allowable increases
under the Annual Maximum Fee Movement regulations are applied
for domestic students.
• For 2020 international tuition fees, that an average increase of
3.7% be applied.
• For the 2019 Study Abroad fee, that the current rate of $12,950
be applied.
• For the Compulsory Student Services Fee, that a fee of $7.06 per
point (GST inclusive) or $847.50 per full-time student, is applied.
This reflects cost rises rather than additional services and maintains
our ability to provide current service levels.
3 | P a g e
link to page 2 link to page 5 link to page 10 link to page 10 link to page 10 link to page 12 link to page 12 link to page 12 link to page 13 link to page 13 link to page 15 link to page 15 link to page 15 link to page 16 link to page 17 link to page 18 link to page 18 link to page 20 link to page 25 link to page 25 link to page 26 link to page 30
Student Fees Paper – Final Version 1.1 dated 04 October 2018
Table of Contents
1. Summary ............................................................................................. 2
2. Context ................................................................................................ 5
3. Projected Cost Movements ................................................................... 10
3.1 Projected Cost Movements 2019 ................................................. 10
3.2 Projected Cost Movements 2020 ................................................ 10
4. Domestic Tuition Fees 2019 .................................................................. 12
4.1 Impact of the shortfall between Government domestic
funding rates and projected cost increases ........................................ 12
4.2 Undergraduate Fees ......................................................................... 13
4.3 Postgraduate Fees ............................................................................. 13
5. International Tuition Fees 2020 ............................................................. 15
5.1 Market conditions ................................................................................... 15
5.2 Consultation for 2020 international tuition fees ....................... 15
5.3 Recommendation for 2020 international tuition fees ............. 16
5.4 Study Abroad Fee ................................................................................... 17
6. Compulsory Student Services Fee .......................................................... 18
6.1 Compulsory Student Services Fee (CSSF) ............................... 18
6.2 Student Consultation ........................................................................ 20
6.3 Recommendation for 2019 Compulsory Student Services
Fee 25
7. Other General Fees .............................................................................. 26
8. Conclusion and Recommendations ......................................................... 30
4 | P a g e
 Student Fees Paper – Final Version 1.1 dated 04 October 2018
2. Context
Student Fees Paper – Final Version 1.1 dated 04 October 2018
2. Context
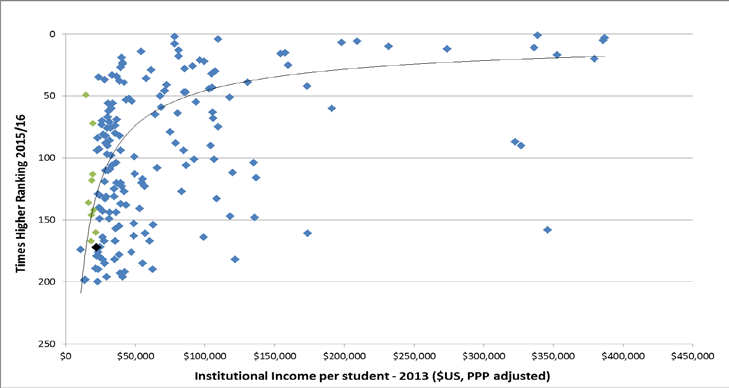
New Zealand continues to have one of the most efficient university systems
in the world in terms of the quality of education received relative to cost.
Ranking
This efficiency is illustrated by figure 1 below, which plots ranking on the
Times Higher Education- world ranking of universities (the top 200) against
expenditure per student (expressed in $US on a purchasing power parity
basis).
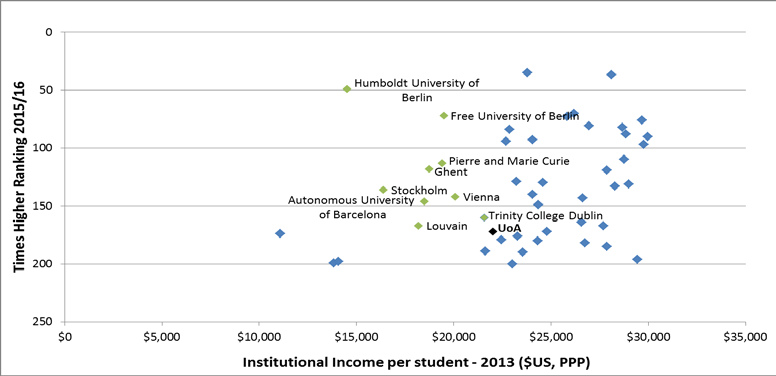
Figure 2. Institutional income per student versus Times Higher ranking
2015/16 – (universities with <$30,000)
Source: Times Higher dataset.
We have analysed the characteristics of those universities that have a
higher rank than the University of Auckland but lower incomes per student.
These universities are all European universities with long histories and very
strong reputations e.g. numerous Nobel Prize winners. It is higher scores
on the teaching, research and citations category scores (together
contributing 90% of the score) that drive the higher rankings of these
Figure 1. Institutional income versus Times Higher ranking 2015/16
universities under the Times Higher methodology. Under the QS
Source: Times Higher dataset.
methodology the University of Auckland performs relatively better, driven
Note: Universities in green are those with less income than UoA, but higher ranking.
by a better performance on the reputational elements of the ranking score
Rankings of universities in the Times Higher and QS systems typically
(which contributes a higher proportion of the total score than in the Times
improve with increased income per student. Under the Times Higher Higher system).
Rankings system only nine of the world’s top 200 universities have a lower
income per student but higher ranking than the University of Auckland
(shown in Figure 2 below). In the case of the QS system the number is just
one (Trinity College, Dublin).
5 | P a g e
link to page 6 link to page 6
Student Fees Paper – Final Version 1.1 dated 04 October 2018
Government Support
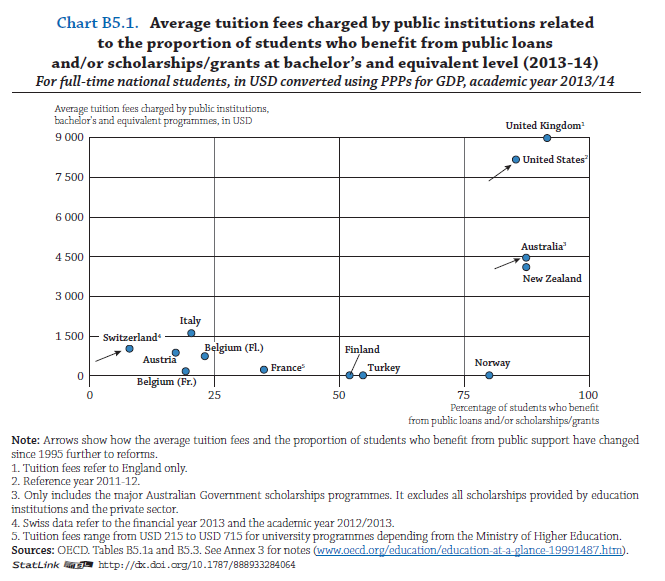
There is significant variation in the cost of tertiary education and the level
of support available to students across the OECD. Together with Australia,
the UK, the US, Canada and the Netherlands, New Zealand falls into a group
of countries with high tuition fees and well-developed student support
systems according to OECD’s categorization.
New Zealand spends a high proportion of GDP on tertiary education relative
to the OECD. However its expenditure on institutions is relatively low.
OECD information on the relative investment levels has not been updated
to include the impact of the Government’s “fees-free” policy. Information
published before the introduction of the fees-free policy, showed that only
52% of public investment in tertiary education is on the institutions, and
48% on support of students compared to an average of 67% invested in
the institutions in comparable countries across the OECD.
2 The relatively
high level of student support in New Zealand, before the introduction of
Fees-free, reflects a well-developed student financial support system with
a high level of public support for students designed to ensure that
participation is not compromised by the existence of tuition fees, and is
consistent with, but higher than, the picture seen in other countries where
tuition fees are relatively high, for example Australia (35% of funding in
support of students), and the Netherlands (29%).
3
As is shown in the chart below from
Education at a Glance 2015 New
Zealand students benefit from a robust student financial support system,
and one that compares favourably to systems in other OECD countries in
which fees are charged.
2 As a percentage of total public expenditure on education and GDP, for tertiary education
(2011). OECD, 2014, Education at a Glance 2011 OECD Indicators. Table B5.4 Public support
for households and other private entities
3 OECD (2014). Education at a Glance 2014, p. 265.
6 | P a g e
 Student Fees Paper – Final Version 1.1 dated 04 October 2018
Chart 1.
Student Fees Paper – Final Version 1.1 dated 04 October 2018
Chart 1.
7 | P a g e
link to page 8
 Student Fees Paper – Final Version 1.1 dated 04 October 2018
Student Debt
Student Fees Paper – Final Version 1.1 dated 04 October 2018
Student Debt
Concerns about mounting student debt are frequently raised in connection
There is little evidence of costs inhibiting enrolment of Māori and Pacific
with New Zealand universities’ annual fee setting. We have examined students. In 2018 approximately 66% of school leavers who achieved UE
student loan debt trends in New Zealand and reviewed the limited evidence
(in NCEA) went on to enrol at a New Zealand university. The proportion for
from NZ and overseas on some of the wider social and economic Māori and Pacific participation was similar at 64%.
consequences of student debt (e.g. home ownership; family formation;
entrepreneurial activity).
New Zealand evidence on the wider impact (e.g. on house purchase,
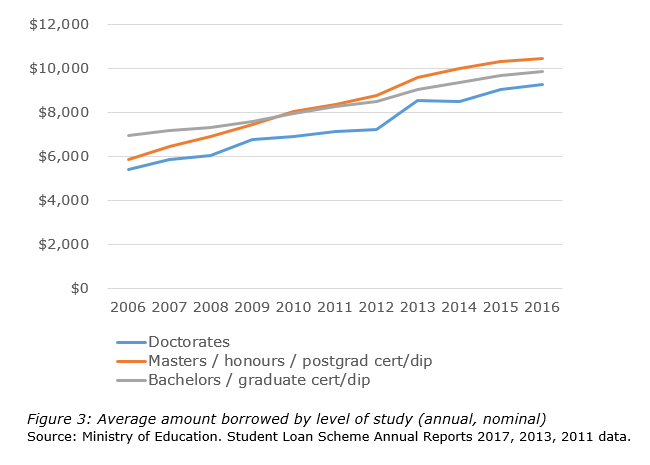
Focusing on university graduates only, average annual loan amounts have
partnering) of student loan debt is limited to survey evidence. While there
gradually increased between 2006 and 2016 largely reflecting rising
is some evidence from overseas pointing towards negative implications of
student fees, and for Masters and Doctorate students the increases also
student debt (from the US and the UK where student debt levels are
appear to relate to the policy change in 2013 whereby postgraduate significantly higher, and the findings are therefore not necessarily
students are less likely to qualify for student allowances. The graph below
applicable to New Zealand), this evidence must be considered together with
illustrates the student loan trend.
the impact of attaining a degree on an individual’s life-time earnings. There
is certainly compelling evidence from New Zealand, as there is from
elsewhere, that a degree is a worthwhile investment for an individual.
Degrees attract a significant earnings premium in New Zealand. As recent
data released by Universities New Zealand (2016) reveals, a typical
graduate with a
bachelor degree will earn around $1.4 million more over
their lifetime than a non-graduate, and this is after accounting for years
lost earnings while studying and student loans.
4 For medical graduates the
figure is closer to $4 million.
The value of a university education is even greater for Māori and Pacific
graduates who earned 2.9x NZ median earnings in 2012 compared to the
overall population where graduates earn on average 2.6x median earnings.
All of which explains the very significant increase in numbers of students
choosing to go to university over the last 20 years.
4 Universities New Zealand (2016). Press Release – 16 February 2016: A Degree is a smart
investment. Available: http://www.universitiesnz.ac.nz/node/854
8 | P a g e
Student Fees Paper – Final Version 1.1 dated 04 October 2018
Context Summary
Figure 4: NZ University QS rankings 2007-2018
Thus the context in which we are setting fees is one in which our students
have access to a high quality university at a modest per student cost and
QS Ranking
with high levels of government support. The context for the University is
one in which we are trying to create, on behalf of students and the country,
0
an institution that is truly world-class with revenues that are extremely low
Auckland
by international standards and strongly controlled by government policy.
100
The University remains committed to high entry standards but with strong
Otago
support for those who were disadvantaged in the compulsory sector, of
200
offering a high quality, research-based, internationally connected academic
300
Victoria
experience to students and of supporting them with a high level of
Canterbury
extracurricular and support activities, and in the provision of world-class
400
facilities.
Waikato
500
While New Zealand universities rate well in terms of quality compared with
Lincoln
600
cost, the trend across the New Zealand sector is for continued decline in
Massey
rankings compared to international institutions. Figure 4 below plots the
07
08
09
10
11
12
13
14
15
16
17
18
QS rankings of each of New Zealand University over time, with the trend
20
20
20
20
20
20
20
20
20
20
20
20
being overwhelmingly downward (aside from the 2015 improvement in the
rankings of some universities resulting from a methodological change in
how citations are handled).
The University of Auckland continues to be New Zealand’s highest ranked
This trend is linked to continuing falls in the real contribution made by University but has struggled to materially reverse the decline in the two
revenue streams controlled by Government relative to funding levels main global ranking systems. For the University to move sustainably up
available to universities elsewhere.
the rankings, new investments are required in areas where the University
does not perform as well as it might. The University needs to increase
average revenue per student and to increase the number of high quality
academics and research teams.
Given the growing use and influence of the international university
rankings, including restrictions being made based on rank (e.g. availability
of scholarships in some countries from which we source international
students), it is important to have at least one highly ranked New Zealand
University. This will help ensure high quality world-class researchers and
academics who continue to want to come to New Zealand, that New
Zealand is not excluded from international collaborations or scholarships,
and that international students (and their parents or caregivers) continue
to find New Zealand tertiary education attractive.
New Zealand’s entire higher education system is likely to be held in higher
regard if at least one university is ranked in the top tiers.
9 | P a g e
Student Fees Paper – Final Version 1.1 dated 04 October 2018
3. Projected Cost Movements
Table 1: Overall cost increases for 2019
Our objective must be to ensure the University can operate sustainably in
the medium and long term. In order to maintain our quality and COST TYPE
% INCREASE % MIX OF COSTS
AGGREGATE
competitiveness objectives as well as deal with financial constraints, we
People costs
3.48%
56.0%
1.95%
must align cost and revenues as much as possible. Therefore, the Other
recommendations for fee increases reference projected cost movements for
Operating
the following years.
Costs
1.60%
31.7%
0.51%
Building &
3.1
Projected Cost Movements 2019
Asset-related
costs
5.62%
12.3%
0.69%
Expected cost increases expected for 2019 can be grouped under three
3.15%
headings:
This estimate in overall cost increases of 3.15% compares with the 3.7%
•
People Costs: The Reserve Bank of New Zealand’s Monetary Policy
movement in costs used as the basis for the 2018 fee-setting process, and
Statement (May 2018) is forecasting annual labour costs inflation of
reflects, in particular, an increased proportion of costs moving towards
2.0% for 2019, reaching 2.3% by 2020. The University is currently
staffing.
projecting a small increase in base salaries with promotions, mix
shift, superannuation participation and competitive pressures being
3.2 Projected Cost Movements 2020
the major factors resulting in an overall increase of 3.48%.
Using the same methodology described above for the calculation of the
2019 projected cost movements, the overall cost increases for 2020 over
•
Other Operating Costs: An inflation factor of 1.6%, based on the
2019 can be calculated as follows:
current Reserve Bank CPI forecast for 2019, has been used as an
estimate of the baseline cost increases expected in 2019.
•
People Costs:
An overall net increase of 4.07% is projected reflecting the higher CPI
•
forecast for 2020.
Building & Asset-Related Costs: Building and asset-related costs
(e.g. depreciation, maintenance, cleaning, utilities, security) which
in a number of cases are driven by previous spends of capital •
Other Operating Costs:
expenditure continue to increase at a faster rate than CPI reflecting
An inflation factor of 1.8%, based on the current Reserve Bank CPI
the current highly competitive market place together with new
forecast for 2020.
projects and sites coming on stream; with a projected increase for
2019 of 5.62%.
•
Building & Asset-Related Costs:
These costs have been considered in some detail over the medium term
Building and asset-related costs continue to increase at a much faster
and the table below shows the 2019 impact.
rate than CPI as depreciation costs from new building projects and sites
come on stream.
10 | P a g e
Student Fees Paper – Final Version 1.1 dated 04 October 2018
As for 2020 these costs have been considered in some detail over the
medium term and the table below shows the 2020 impact. As part of our
normal cycle these figures will be revised before part of next year’s paper.
Table 2: Overall cost increases for 2020
COST TYPE
% INCREASE % MIX OF COSTS
AGGREGATE
People costs
4.07%
56.0%
2.28%
Other
Operating
Costs
1.80%
30.0%
0.54%
Building &
Asset-related
costs
17.71%
14.0%
2.48%
5.30%
11 | P a g e
Student Fees Paper – Final Version 1.1 dated 04 October 2018
4. Domestic Tuition Fees 2019
Table 4: Fees Increase Required to Maintain Constant Real Revenue per
EFTS in 2019.
4.1
Impact of the shortfall between Government domestic
BUDGET
INCREASE
funding rates and projected cost increases
2018
%
INCREASE
NOTIONAL
2019
DEFICIT
Domestic
Based on a 3.14% increase in costs and a 1.6% increase in Government
Teaching Costs
$512.9m
3.1%
$16.1m
$529.0m
$0
Student Achievement Component (SAC) funding rates, the increase in
student fee revenue required to maintain the same real revenue per EFTS
Government
contribution
would be 6.0%, as shown in the table below. This compares to an 8.7%
required for zero
$331.3m
4.9%
$16.1m
$347.4m
$0
increase in student fee revenue required to maintain the same real revenue
fee inc
per EFTS in 2018.
Actual
Table 3: Fees Increase Required to Maintain Constant Real Revenue per
Government
$331.3m
1.6%
$5.3m
$336.6m
$10.8m
contribution
EFTS in 2019
Domestic Fees
BUDGET
INCREASE
INCREASE
NOTIONAL
required to make
$181.6m
6.0%
$10.8m
$192.4m
$0
2018
%
$
2019
up deficit
Student Fees
Student
recommended
$181.6m
2.0%
$3.6m
$185.2m
$7.2m
Component
$331.3m
1.60%
$5.3m
$336.6m
Domestic
The University continues to pursue administrative efficiencies as part of its
Fees
$181.6m
5.96%
$10.83m
$192.4m
operational effectiveness programme in order to reduce the impact of the
Total
$512.9m
3.14%
$16.1m
$529.0m
lack of indexation of government funding. Multiple functional reviews, for
example, allow for the recycling of administrative costs per EFTS. These
include the Libraries and Learning Services (LLS) Functional Review the IT
If increases in Government funding rates fully reflected movements in the
Functional Review and the Finance Review carried out in 2018. These
University’s costs, they would need to increase by 3.14% for 2019. In fact,
reviews continue to build on administrative efficiencies through the use of
Government Student Component funding rates for 2019 are only increasing
benchmarking and process improvement techniques. In addition, a
by an average 1.6%, effectively a cut, or an increase in Government reduction in the ratio of space per student is expected to be achieved on
underfunding, of $7.2m, as shown in Table 4.
completion of the consolidated campus strategy i.e. the exit of Tamaki,
which is in progress, and Epsom campuses scheduled over the next 4-6
The overall deficit, after taking account of the proposed increase in years, thereby reducing the impact of the general increases being
domestic student fees is shown in the table below. The $7.2m deficit is the
experienced in asset-related costs.
equivalent of approximately 65 staff positions (on average each full-time
position in the University incurs costs of approximately $110,000 per
annum).
12 | P a g e
Student Fees Paper – Final Version 1.1 dated 04 October 2018
However more than offsetting these efficiency initiatives are: increased cost
pressures related to our property services portfolio such as depreciation,
Given that the application of the maximum allowable fee increase of 2.0%
preliminary costs, demolitions, and increased repairs and maintenance; the
is well below the estimated fee increase of 6.0% required to maintain the
need to invest in new and improved services; for example new and same real revenue per EFTS in 2019, fee increases of less than the
expanded scholarship offerings, new academic positions and programmes,
maximum allowable cannot be justified.
wireless access, internship and employability services, increased health and
safety support; and externally imposed costs, for example, the impact of
We therefore recommend that all undergraduate courses are increased by
compliance with, amongst other legislation, hazardous materials 2.0%, the maximum allowable under the Annual Maximum Fee Movement
regulations and the Vulnerable Children Act.
regulations.
It is also clear that students value well-specified fit-for-purpose facilities as
well as having sufficient space for their individual and team learning and
4.3
Postgraduate Fees
social needs. Recently Council has approved a fit-for-purpose recreation
centre and surveys show demand for greater access to informal study As with undergraduate fees and for the same rationale, we recommend that
spaces. The opening of the new Science Tower was indicative of this the Annual Maximum Fee Movement of 2.0% applies to postgraduate fees.
demand with high occupancy of the ground-floor space within minutes of
opening. Students currently report increasing difficulty in finding space on
4.3.1 Postgraduate Taught Programmes
campus to study between lectures and to undertake group work.
While recognising that broader financial issues remain important for
Reducing the ratio of academic staff to students would reduce the overall
students, when considering fee levels for postgraduate taught programmes
cost per EFTS. However this would also impact the quality of education
our conclusion is that price is not the major influencer of choice, for several
offered which would be to the detriment of students and therefore reasons:
inappropriate. It would also negatively impact the University rankings. The
University continues to pursue a strategy of improving rather than reducing
• The Government’s Fees Free policy
quality and plans to continue the policy, whilst fiscally feasible, of allocating
• Most students report they are taking these programmes with an
resources to faculties to enable the staff: student ratios of the Go7 to be
expectation of career enhancement, in the form of promotion and/or
matched by discipline.
earnings. An expectation of greater earnings is usually associated
with a willingness to invest to achieve that outcome.
• The University’s brand and reputation is valuable to these students.
4.2
• In the case of many such programmes, particularly in professional
Undergraduate Fees
areas, a proportion of students will have their fees wholly or partly
The Annual Maximum Fee Movement for 2019 has been set by Government
covered by their employer.
at 2.0%. The Student Achievement Component funding increase was set at
• To a certain extent cheaper programmes can be indicative of a lower
1.6% and then only after protests from the Vice-Chancellors (the original
value product.
Government Budget allowance was zero, for the first time in twenty years).
As with the undergraduate programmes, the maximum allowable fee
This Annual Maximum Fee Movement for 2019 is the same as for 2018 and
increase for postgraduate taught programmes under the Annual Maximum
is a reduction from the 3% for 2016 and 4% for the period 2011 to 2015,
Fee Movement regulations of 2.0% is below the estimated fee increase of
for all Government-subsidised courses.
6.0% required to maintain the same real revenue per EFTS in 2019.
The University has two principal options to consider for undergraduate fees:
increase all undergraduate fees by the Annual Maximum Fee Movement or
Our recommendation therefore, is that all postgraduate taught courses are
increase all or a selection of undergraduate fees by less than the Annual
increased by 2.0%, the maximum allowable under the Annual Maximum
Maximum Fee Movement.
Fee Movement regulations.
13 | P a g e
Student Fees Paper – Final Version 1.1 dated 04 October 2018
4.3.2 Research Masters, Bachelors Honours Programmes &
Doctoral Programmes
On average, the University of Auckland’s fees for research masters,
bachelors honours programmes and doctoral programmes are similar to
those of New Zealand’s other major universities.
Auckland’s high world ranking and leading local status is highly valued by
postgraduate students, since the reputation and value of a research-based
programme is closely linked to the reputation of the University from which
it is gained. There are therefore no grounds, based on comparison with
other universities, to restrict fees growth. Indeed, if we were able to charge
appropriately we would command a price premium over the other NZ
Universities.
Again, as with undergraduate and taught masters programmes, the
maximum allowable fee increase for research masters, bachelors honours
programmes and doctoral programmes under the Annual Maximum Fee
Movement regulations is, at 2.0%, below the estimated fee increase of
6.0% that would be required to maintain the same real revenue per EFTS
in 2019.
Our recommendation therefore is that fees for all research masters,
bachelors’ honours programmes and doctoral programmes are increased
by 2.0%, the maximum allowable under the Annual Maximum Fee
Movement regulations.
14 | P a g e
Student Fees Paper – Final Version 1.1 dated 04 October 2018
5. International Tuition Fees 2020
The all-of-government India strategy we have been leading for the past two
years is coming to fruition and has resulted in 46% growth for the
In line with best practice, the University sets international student fees two
University, nearly half of the overall growth from India for the eight New
years in advance to maximise the efficiency of our recruitment efforts and
Zealand universities. Identification of strategic partners continues with a
to allow interested students and their families to plan for their investment. senior delegation heading to India in November, assisted by our new in-
market representative.
5.1 Market conditions
Progress is on track for the four, priority recruitment strategies confirmed
in the 2016 LTCAP process:
2017 was an exceptional year for international enrolments at the University
of Auckland as a number of strategies initiated in 2015 and 2016 began to
1. Post-graduate taught masters (PGT) – nearly doubled since 2015
bear fruit. Against an overall decline of 4.7% for the New Zealand
International Education (IE) market as a whole, the University grew by 2. Transnational education (TNE) – several major initiatives underway
11.1% headcount and 12.3% EFTS (2x KPI) and exceeding the New
Zealand university sector, which grew by 7.0% in 2017. In addition, the
3. Non-award (Study Abroad) – 13.6% growth in 2017
2018 enrolment target has been reached at the start of Semester 2, 2018,
before additional enrolments from Q4 for the Graduate School of 4. Outbound – 20% outbound participation in 2017
Management suite of programmes. All major IE strategy initiatives
approved in 2015 and 2016 are tracking well, including improved
efficiencies in processing systems.
5.2 Consultation for 2020 international tuition fees
Geopolitical tensions are at a high with the winds of nationalism benefiting
primarily Canada, up 20%, and enjoying significant positive movement in
In last year’s exercise, and in the context of intensive planning for the Long-
brand perception against the Main English Speaking Destinations (MESD),
Term Academic and Capital Plan (LTACP) and 2026 target setting, we
including New Zealand. International Education Policy work with our undertook detailed positioning analysis with each faculty, resulting in a
Universities New Zealand counterparts and with government agencies has
differentiated approach to fees proposed for 2018. This year’s proposal, to
intensified. The new Government has implemented revisions to Post-Study
apply to 2019, is for a blanket increase of 4% with a few limited exceptions
Work Rights (PSWR) responding favourably to a proposal led by the for further market repositioning building on the 2018 fees paper.
University of Auckland. Combined with new extensive data on university
graduate behaviours, domestic and international, this equips us for
potential external and New Zealand communications; external to assert
market leading PSWR policy, internal to tackle resistance among some New
Zealand employers.
The transition of our China efforts from individual (retail) recruitment to
partnership (wholesale) is advancing well but subject to tensions in our new
Government’s relationship with China and an increasing focus on
prioritising New Zealand students. Our reliance on China as primary source
market continues to intensify at 46% of the international student body,
growing strongly through another jump in Chinese enrolments recruited on-
shore, reflecting the growing number of Chinese nationals in New Zealand’s
pre-tertiary system. Trade tensions with Australia are spilling over into IE
as China flexes its power in the most exposed IE market.
15 | P a g e
link to page 16
 Student Fees Paper – Final Version 1.1 dated 04 October 2018
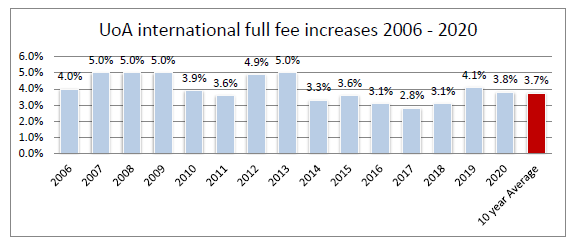
Figure 5 illustrates the average weighted increase for 2019 as well as the
5.3 Recommendation for 2020 international tuition fees
10-year average.
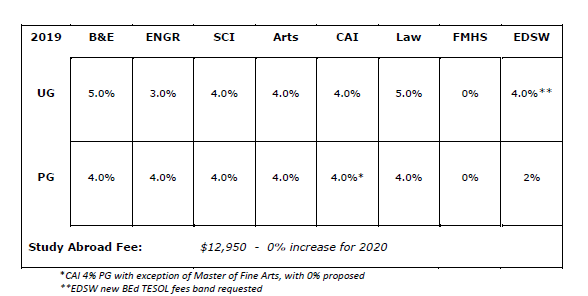
As a result of our consultation, we recommend the following increases by
faculty for 2020, as illustrated in Table 5 below.
Figure. 5. Average rate of increase in international tuition fees, last 15 years
We consulted faculty leadership to examine their satisfaction with current
and forecast future market positioning, primarily against New Zealand
universities and the Group of 8 (Go8). These are based on several
assumptions: 2017 and 2018 actual fees, 2019-2022 forecast fees for the
Table 5. Recommended international tuition fee increases by faculty for 2020
competition based on their historical rate of increase as calculated from
available data. In addition, we consulted a bespoke survey of Australia and
New Zealand international tuition fees produced by StudyMove for
Our assessment of EFTS weighting by faculty and study level, assuming
Universities New Zealand.
2019 projected EFTS enrolment levels at the proposed 2020 international
tuition rates, represents an overall weighted increase of 3.7% of
The University’s traditional pricing strategy has been to position our fees at
international full fee tuition revenues university-wide for 2020. Taking into
the top of the New Zealand market and below the median of the Group of
account 2020 EFTS projections, an overall increase in revenue from
8. Whilst we have posited previously that international UG students are
international full fees from 2019 to 2020 is 7.7%.
relatively impervious to modest pricing fluctuations, the international PG
student is comparison shopping from a broad market and is very cost
sensitive. Consequently, we have maintained our current market
positioning with some adjustments for particular programmes
5.
5
Have used a conservative exchange rate of 1.067NZD/AUD as our benchmark rate. This
reflects a three year historic average.
16 | P a g e
 Student Fees Paper – Final Version 1.1 dated 04 October 2018
5.4 Study Abroad Fee
Student Fees Paper – Final Version 1.1 dated 04 October 2018
5.4 Study Abroad Fee
This fee is benchmarked in the chart below (Figure 6).
Recommendation: Hold at current rate of NZD$12,950
Anticipating strong gains in market share from 2017 onwards from our
Generation Study Abroad campaign, we raised the Study Abroad fee 1.6%
to $12,950 for 2019 after several years of holding. In 2020 we recommend
holding for another year as we consolidate in the market at this higher fees
increment.
The average fee for Study Abroad programmes in 2018 in New Zealand is
NZD$12,531 ($12,373 in 2017) compared to NZD$10,884 in Australia
($10,884 in 2017).
Figure.6. Average international tuition fees for Study Abroad programs in Australia and New
Zealand. (Source: Huckel, D., Ramirez, K. (2018). Comparative Analysis of international
Tuition Fees in Australia and NZ. Sydney, Australia: StudyMove)
17 | P a g e
Student Fees Paper – Final Version 1.1 dated 04 October 2018
6. Compulsory Student Services Fee
6.1
Compulsory Student Services Fee (CSSF)
The Government passed legislation in 2011 that provides the Minister of
Tertiary Education the power to prescribe the range of services that may
be funded by compulsory student services fees. The current Ministerial
direction on compulsory student services fees prescribes the eligible range
of services as follows:
(a)
Advocacy and legal advice: Advocating on behalf of individual
students and groups of students, and providing independent support
to resolve problems. This includes advocacy and legal advice relating
to accommodation.
(b)
Careers information, advice and guidance: Supporting
students’ transition into post-study employment.
(c)
Counselling services and pastoral care: Providing non-academic
counselling and pastoral care, such as chaplains.
(d)
Employment information: Providing information about
employment opportunities for students while they are studying.
(e)
Financial support and advice: Providing hardship assistance and
advice to students on financial issues.
(f)
Health services: Providing health care and related welfare
services.
(g)
Media: Supporting the production and dissemination of information
by students to students, including newspapers, radio, television and
internet-based media.
(h)
Childcare services: Providing affordable childcare services while
parents are studying.
(i)
Clubs and societies: Supporting student clubs and societies,
including through the provision of administrative support and
facilities for clubs and societies.
(j)
Sports, recreation and cultural activities: Providing sports,
recreation and cultural activities for students.
18 | P a g e
Student Fees Paper – Final Version 1.1 dated 04 October 2018
A comparison of 2018 non-tuition fees for New Zealand Universities is shown in the table below.
Table 6:
NZ$ (GST
Massey
inclusive)
Canterbury
Massey
(Albany)*
Otago
Waikato
Victoria
AUT
Auckland
Building Levy
$29.90
69.60
Student Amenities
Levy
Student Assistance
$24.00
Welfare & Recreation
$74.40
$153.20
Student Services
$811.00
$567.40
$567.40
$798.00
$519.00
$756.00
$627.10
$813.57
Student Association
Foundation Levy
$23.80
$23.80
Total - 2018
$811.00
$695.50
$744.40
$798.00
$519.00
$780.00
$696.70
$813.57
Total - 2017
$795.00
$681.40
$963.50
$739.00
$479.00
$754.50
$683.00
$765.00
% change vs 2017
2.0%
2.1%
-22.7%
8.0%
8.4%
3.4%
2.0%
6.3%
$ change vs 2017
$16.00
$14.10
-$219.10
$59.00
$40.00
$25.50
$13.70
$48.57
*the decline is due to the removal of the Student Amenities levy which was previously charged for Students at the Albany Campus
Appendix D provides a full breakdown of the distribution of the University’s CSSF income by service category.
19 | P a g e
Student Fees Paper – Final Version 1.1 dated 04 October 2018
6.2
Student Consultation
including areas for additional funding. At the SCG meeting in August, AUSA
President (Anna Cusack) and AUSA Education Vice President (Jessica
In 2018 the annual consultation on the CSSF was undertaken between April
Palairet) gave a presentation summarising the key feedback from the
and August. Multiple channels for communication and feedback were student body and making recommendations for additional expenditure in
utilised as part of the consultation processes and an outline of the process
the areas of student advocacy and wellbeing. A copy of the presentation is
and findings are summarised below.
appended to this paper (see Appendix F).
Consultation on the CSSF began in April at the Student Consultative Group
Key Survey Findings
(SCG) meeting with an overview of current Student Services fee allocations.
In June a comprehensive Consultation Document (“Consultation A summary of the survey was presented to SCG at its July meeting and this
Document”) (Appendix D) was developed outlining key information on the
presentation is located at Appendix E.
CSSF including its definition, purpose, and collection method. Detail on the
current allocation areas along with a summary of the allocation of funds to
Key information about the survey:
the particular service area was included in the document. In June the
Respondents
Consultation Document was circulated to all SCG members, Faculty support
• There was a 46% increase in the number of students responding to
teams, as well as the main student groups within the University, it was also
the survey this year (1125 in 2018 compared to 772 in 2017). This
made available on the University of Auckland website.
represents approximately 3% of the total student population.
• 76% of the responses were from Undergraduate students, 22% from
In addition to the Consultation Document, a joint University and AUSA
Postgraduates, and 2% identified as other.
survey was created to seek feedback from the student body.
• Faculty responses rates are broken down as below:
The survey sought student feedback to:
Main Faculty
%
• ascertain the current level of satisfaction with CSSF allocation;
Arts
18
• provide information on the current services that receive funding;
Business
15
and
Creative Arts and
7
• seek feedback on prioritisation of allocation levels.
Industries
Education and Social Work 2
The survey also sought feedback on any additional services currently not
Engineering
16
funded that respondents felt should be represented in the CSSF process.
Law
7
The survey contained links to the Consultation Document so that
Medical and Health Science 10
respondents could find further information about the CSSF. A link to the
Science
25
survey was made available on the University of Auckland website from the
4 June and was promoted to students via social media and e-screens. It
• Campus response rates are broken down as below:
was also promoted via AUSA communication channels. The survey was
Main campus
%
open for eight weeks until late July. The survey received 1125 responses
City
87
from students, an increase of 46% on the previous year (in 2017 the
Epsom
3
University survey received 772 responses).
Grafton
6
Tamaki
2
The SCG was kept informed of the consultation process and it was an
agenda item on SCG meetings in June and August, providing opportunities
Newmarket
2
for feedback or requests for further information.
Te Tai Tokerau
0
Other
0
Following the closure of the survey, Campus Life and AUSA met to further
discuss the results and consider recommendations for 2019 allocation,
20 | P a g e
Student Fees Paper – Final Version 1.1 dated 04 October 2018
Figure 8:
Level of importance of services
How important are these services for the
Students were asked to rank the importance of services to them personally
whole student body?
and to the whole student body. The key findings were:
100
•
90
Health and counselling continues to be the most important service to
80
respondents overall. 88% recognised this service as very important or
70
important to them personally, while 94% of respondents recognised
60
50
this service as very important or important to the whole student body.
40
30
20
• Careers and Employability was considered to be the second most
10
important service to respondents overall, with 65% rating this service
0
as very important or important to them personally and 85% rating this
service as very important or important to the whole student body.
• Sport and Recreation was considered by respondents to be the third
most important service overall, with 71% recognising this services as
very important or important to them personally, while 73% recognised
these services as very important or important to the whole student
body.
Very important or important
Not very important or not very important at all
Figure 7:
How important are these services to you
personally?
100
90
80
70
60
50
40
30
20
100
Very important or important
Not very important or not very important at all
21 | P a g e
Student Fees Paper – Final Version 1.1 dated 04 October 2018
The table below outlines the rankings for all service areas surveyed.
which 70% of respondents thought should be given a greater level of
priority (an increase from 66% in 2017) and Chapel and prayer
Table 7:
service and spaces which 47% of respondents thought should be given
Service
Importance Rank Importance Rank Overall
less priority (an increase from 42% in 2017).
to students
to the
rank
personally*
whole
• Sport and Recreation saw a considerable shift in responses from 2017,
student
with 34% of respondents believing this service should be given a
body*
greater level of priority (compared to 16% in 2017), and only 19%
Health &
87.9
1
93.6
1
1
responding that this service should be given less priority (compared to
Counselling
48% in 2017).
Sport &
70.6
2
72.9
5
3
Recreation
Career
64.9
3
85.2
2
2
• The top 4 services which respondents believed should receive a
Development
greater level of priority were Health and Counselling (70%), Sport and
and
Recreation (34%), Career Development and Employability (30%) and
Employment
Student Advocacy (27%).
Services
Student
59.9
4
72.2
6
6
Advocacy
The priority level for each area of service in the survey is represented in
Pastoral care
59.2
5
74.5
4
4
the graph below.
Clubs and
59.1
6
76.3
3
4
Societies
Figure 9
Cultural &
51.4
7
67.3
7
7
Sporting Events
What level of priority should be given to these
Transition
50.3
8
63.8
9
8
services?
programmes
and support
80
70
Accommodation
45.6
9
64.1
8
8
60
advisors
50
Chapel and 14.8
10
36.8
10
10
40
prayer services
30
and spaces
20
10
0
*% rated as very important or important
Level of priority of services
Students were asked what level of priority should be given to each of the
services, results in summary were:
• Respondents largely thought that priority levels of the services should
More
About the same
Less
remain about the same, with the exception of Health and Counselling
22 | P a g e
Student Fees Paper – Final Version 1.1 dated 04 October 2018
Students were also asked to identify any other services not listed that
2019 Expenditure
should be funded by the levy. 61 free text responses were received, the
majority of which are covered in some way by the levy. Other responses
Campus Life and AUSA representatives met on a number of occasions
included the following areas:
during August to discuss the 2019 expenditure of the CSSF. There are two
• Additional study and breakout spaces
proposals for additional expenditure which were presented to SCG at its
• Financial support and advice
August meeting (see a copy of the presentation at Appendix E).
• Grants/discounts for materials or textbooks
• Financial support for dental fees
• A new theatre
• Subsidised dining options
• Additional recycling services on campus
• Support for transport costs
A number of responses also raised concerns regarding the distribution of
Faculty funding (in particular the lack of funding allocated to Faculty of
Creative Arts and Industries).
Service Delivery and Use of CSSF Increase
Last year, additional CSSF spending of $305,000 was approved for
allocation as follows:
a) $200K to the Health and Counselling service primarily to expand the
proactive wellbeing programme
b) $55k to provide enhanced networking and engagement programmes
to international students
c) $50k to enhance orientation events and activities
Forecast results for KPIs associated with these services indicate positive
outcomes i.e. the average wait time for a routine counselling appointment
is <5 days; the average wait time for a GP visit is the same day; overall
satisfaction with Health and Counselling is 86%; and that 8500 students
new to the University engaged in orientation activities (up from the prior
year of 8000).
23 | P a g e
Student Fees Paper – Final Version 1.1 dated 04 October 2018
Service Area
AUSA Recommendation
University response
Pastoral Care –
That an additional $40,000 be made The University supports a greater emphasis on welfare. However,
74% of respondents considered available for AUSA’s welfare support there are opportunities to improve the delivery of welfare services
pastoral services to be very services.
before additional funding is applied to this area, such as:
important or important to the
• Awareness of mental health issues is the responsibility of the
whole student body. It was With this money, AUSA will
University through the Wellbeing Programme and the Health &
ranked 4th overall in level of
Counselling service. AUSA would be best placed to work with
importance and 5th in services
1. Increase the amount of funding
these existing services rather than duplicate awareness activity.
that needed to be better available for welfare support e.g. hardship • The University provides a range of training programs for
prioritized.
grants, textbook grants, and dental
student leaders and would be happy to work with the AUSA
grants.
executive to tailor a program specific to welfare needs.
• The University would be happy to work with AUSA on
2. Increase the number of events and
streamlining the grant application process and utilizing systems
initiatives to help raise awareness of
that already exist for grant applications.
mental health issues and available support • The University offers a Student Emergency Fund grant. Better
3. Improve the quality of welfare
alignment between this and the AUSA Hardship grant may
programmes through increased training
reduce duplication.
and support for student leaders involved
in welfare delivery
There is currently limited transparency around the amount of
funding AUSA puts towards welfare programmes. In late 2017 the
4. Improve the efficiency and consistency University through Campus Life provided $30,000 to AUSA to
grant application processing by providing support its welfare programmes - $15k towards Hardship grants
dedicated administrative support.
and $15k towards food bank. It is not clear how much funding AUSA
has contributed towards these programmes. Improved reporting of
both demand and expenditure would benefit any request for
additional funding in this area. The University, through Campus
Life, offers its support to AUSA to improve this reporting.
Advocacy –
That an additional $40,000 be made Similar to above, the University considers there may be a range of
72% of respondents considered available for advocacy funding.
measures available to improve efficiency in the Advocacy service
student advocacy to be very
prior to any additional funding is provided. These measures include
important or important to the With this money AUSA will address two avoiding duplication between Advocacy and University services
whole student body, and it was areas:
such as the Proctor and Accommodation Solutions services. There
ranked 4th as the service that $20,000 to the advocacy office
could also be opportunities for efficiencies in the systems being
needed to be better prioritised. 1. To ensure that the advocacy office can utilised by both Advocacy and Class Representation to ensure that
continue to grow and meet increased administration workload is minimised and ensure that funding for
demand.
supporting students is maximised.
2. To be able to better support advocacy
volunteers.
Again, improved transparency and reporting of the outcomes of this
funding provided by AUSA towards Advocacy and Class
$20,000 to the Class representative system Representation systems would be of benefit.
to increase the resource provided by the
class representation co-ordinator, to
enable them to support the Education Vice-
President with education policy
24 | P a g e
Student Fees Paper – Final Version 1.1 dated 04 October 2018
The University supports both the welfare and advocacy programmes As a result of our consultation and movements in costs, we recommend
provided by the AUSA. However before considering increased funding for the following approach for 2019:
these services it is recommended that;
• AUSA and Campus Life document current service offerings in these
1. The Compulsory Student Services Fee (CSSF) be increased by
areas and identify any duplication of activity
$33.96 (4.17%), being the University’s 2019 projected cost
• AUSA and Campus Life complete a review of staffing structures,
movement for relevant services as outlined in the above table.
systems and processes in place for these services and identify any
We note that the annual per full-time student charge would
efficiencies that could be achieved
increase from $813.57 in 2018 to $847.53 in 2019 enabling all
• AUSA and Campus Life provide key performance information
funded services to be maintained at their current level.
related to these services including measures of demand, service
provision and outcomes
There are no further requests for additional funding for new or increased
services to be funded by the CSSF in 2019 that are mutually supported by
the University and the AUSA.
6.3
Recommendation for 2019 Compulsory Student Services Fee
Therefore, we recommend that the CSSF be increased by the projected
As with the other fees is it important to understand the cost movements cost movement of 4.17% to ensure that all existing services are funded to
in the underlying cost types. Overall cost increases for 2019 based on the the same level.
assumption of a 30/20/50 split between People, Other Operating, and
Asset-related costs leads to a weighted cost increase of 4.17%. This is
shown in the following Table.
Table 8:
COST TYPE
%
% MIX OF
INCREASE
COSTS
AGGREGATE
People costs
3.48%
30%
1.44%
Other Operating
Costs
1.60%
20%
0.32%
Building & Asset-
related costs
5.62%
50%
2.81%
4.17%
25 | P a g e
Student Fees Paper – Final Version 1.1 dated 04 October 2018
7. Other General Fees
A full list of general fees is included in Appendix C.
2. Examination Fees amendment
Some students have not interpreted the wording in Schedule A of the
The following changes to the general fees are recommended.
Fees Statute 2001 under ‘Examinations sat in New Zealand but out of
Auckland’, ‘Examinations outside New Zealand’, and ‘Examinations sat
outside the timetable’ as application fees. Where an application is
declined, refunds have been requested because they had understood
1. Admission application fees amendment
that the fee was for moving an exam time or location.
To ensure we remain equitable across all applicant groups, and to
The Examinations Office has always interpreted these as
non-
support attracting the right applicants, we seek approval for the
refundable application fees. To clarify that student requests to move
following amendments to the Admission application Fees in Fees
an exam time or location incur an application fee, it is recommended that
Schedule A.
the wording under these sections is changed and the words ‘Application
for’ inserted.
1. Amend the fees schedule to offset
all admission application fees
against tuition fees. This will ensure we have equity across applicant
The current wording for ‘out-of-centre’ exams says ‘Examinations sat in
groups, and will support moving to the application fee being paid
New Zealand but out of Auckland’. We request an amendment to change
before submission of the application. Revenue will be higher as more
this to ‘Examinations sat in New Zealand but outside University of
applicants will be charged a fee (see Table 9).
Auckland campuses’. This will ensure that no application fees are levied
for students who move their distance-learning exam to sit in our Tai
2. Amend fee schedule so there is only one fee of $85 for any transfer
Tokerau campus instead of in the city.
credit application. This fee will be non-refundable and would be
charged on top of the application fee (if applicable), at the point of
No changes to the examination application fees are proposed, only the
application. This will remove charging a higher fee ($140) to those
wording. We expect no impact on revenue and this change is to clarify
applying for credit with overseas study, which on top of the
the rules of application only.
application fee, would very likely dissuade applicants from submitting
their application.
3.
Only charge a subsequent application and/or credit fee when an
application is made for a new term and there is new study to assess.
4. Publish more detailed information on which applicants are not
required to pay a fee.
These amendments will support the application fee being payable on
submission of an application.
26 | P a g e
Student Fees Paper – Final Version 1.1 dated 04 October 2018
Proposed changes
External Transfer Credit
A summary of the proposed changes to Schedule A – All Students, for the
2019 calendar are highlighted as follows
Each application from any study undertaken at another
tertiary institution (e.g., Summer School, concurrent $85
Fee
enrolment at another institution)
Admission (domestic students only)*
Each application from any study undertaken at an overseas $140
tertiary institution
$85
Admission ad eundem statum through overseas tertiary $100
study
Fee
Admission ad eundem statum through overseas secondary $85
study
Examinations sat in New Zealand but out of Auckland outside
University of Auckland campuses
Discretionary Entrance, Special Admission
$60
Application for single examination per venue
$140
*
Admission fee assessment (ad eundem statum) will be offset against
tuition fees.
Application for each additional examination at the same $30
venue
Admission (international)*
Examinations outside New Zealand
Admission ad eundem statum through overseas tertiary $100
study
Application for single examination per venue
$175
Admission ad eundem statum through overseas secondary
Application for each additional examination at the same
$85
$30
study
venue
*
Admission fee will be offset against tuition fees. Fee does not apply to
applicants applying through a registered Agent, under an Articulation
Agreement with partner institutions, through Study Abroad Agreements
or to NZ Aid Scholarship applicants.
27 | P a g e
Student Fees Paper – Final Version 1.1 dated 04 October 2018
Examinations sat outside the timetable
Application for single examination on a day other than $120
timetabled
Application for each additional examination on a day other $30
than timetabled
+ Declined applications will receive a 50% refund of the relevant
examination application fee
28 | P a g e
Student Fees Paper – Final Version 1.1 dated 04 October 2018
Table 9:
provided for example so no assessment can take place). We would expect
the conversion from application to enrolment to also improve with the new
Application fees for 2017
application platform, requiring applicants to upload documents for
SF JNL:
SF JNL:
SF JNL:
assessment on submission. Conversion from offer to enrolment is higher
App Fee Special
App Fee O'Seas 2ndary
External Transfer Credit
than this.
Admission
Study/ External Transfer
Overseas Tertiary $140
$55-$60
Credit
$80-$85
** Decrease in applicant numbers is predicted to be 10 - 20% when a fee
Year
Months
Qty
Qty
Qty
Qty
Qty
Qty
Analysis Net
Qty
Total $
Percentage
is charged upfront in the first year. For the purposes of this estimation we
Monthly $
Unpaid
unpaid
have used 15%.
2017 TOTALS
473
378
496
112,828.53
155 13,
325.00
11.81%
2016 TOTALS
464
531
620
133,460.87
121 8,
754.00
6.56%
^ The Application fee amount to be offset (against tuition fees) has been
2015 TOTALS
655
545
668
144,739.74
241 18,
492.00
12.78% adjusted by 15% to account for expected increases in conversion from
application to enrolment.
Table 10:
∞ We would expect more applicants to apply through an Agent and also
increases in numbers coming through articulation agreements, so the
Breakdown of applicant numbers and conversion to enrolment:
estimated revenue, despite the adjustments made above is still expected
Includes estimated revenue from charging an application fee to these groups and to be inflated. In addition the fee will be waived for groups, as part of
recruitment/marketing campaigns. Numbers are uncertain, so no estimate
offsetting against tuition fees (based on 2017 application numbers).
has been included here, but this will also affect total revenue.
% Appl to
Total
Est. decrease
enrol (based
App fee App fee est.
App fee est.
estimated
Admit Type Description
2017
Applicants in 1st year**
Enrolled on est. decr.) # charged Total
offset^
revenue∞
ISQ
Applicant with overseas secondary school
ISQ
3266
2776
250
9.0%
$85
$235,968.50
$24,437.50
$211,531
ITQ
Applicant with overseas tertiary study
ITQ*
18746
15934
2709
17.0%
$100
$917,610.00
$311,535.00
$606,075
ITC
2087
1774
200
11.3%
$100
$177,395.00
$23,000.00
$154,395
Applicant with overseas tertiary study, applying for
SPA/SPN
1029
875
274
31.3%
$60
$52,479.00
$18,906.00
$33,573
ITC
credit
DIS
128
109
31
28.5%
$60
$6,528.00
$2,139.00
$4,389
Special Admission and Special Admission with New
$1,389,981
$380,017.50 $1,009,963.00 SPA/SPN
Start
DIS
Discretionary Entrance
Important notes:
* The application fee total has been adjusted in this row to remove
applicants applying through an agent (6758 applicants in 2017). At this
stage, we are unable to identify those who have come through an
articulation agreement so these have not been removed.
# Conversion from application to enrolment numbers are currently
relatively low, which accounts for the current process where we receive a
large number of applications which go nowhere (no documents are
29 | P a g e
Student Fees Paper – Final Version 1.1 dated 04 October 2018
8. Conclusion and Recommendations
For 2019 undergraduate programmes, it is recommended that the maximum allowable increases under the Annual Maximum Fee Movement
regulations are applied for domestic students.
For all 2019 postgraduate taught programmes, research masters, bachelors honours programmes and doctoral programmes, it is recommended
that the maximum allowable increases under the Annual Maximum Fee Movement regulations are applied for domestic students.
Detailed schedules of the recommended domestic tuition fees for 2019 are attached as Appendix A.
The recommended tuition fees represent
an average increase per full-time domestic student of $159 per annum.
For 2020 international tuition fees it is recommended that an overall weighted increase of 3.7% be applied.
For Study Abroad it is recommended that the fee be held at the current rate of $12,950 for 2020.
Detailed schedules of the recommended international tuition fees for 2020 are attached as Appendix B.
For the Compulsory Student Services Fee, a fee of $7.06 per point (GST inclusive) or $847.53 per full-time student, is recommended.
All other fees are set as outlined in Appendix C.
It is recommended that Finance Committee recommend to Council:
THAT this report be received
THAT Council approve the attached Domestic Fees Schedule for 2019
THAT Council approve the attached International Fees Schedule for 2020
THAT Council authorise the Vice-Chancellor to assign any new programmes, or programmes becoming newly available to international students in
2020, to an appropriate band to enable offers to be made during the recruitment cycle, and report these decisions back to Council
THAT Council authorise the Vice-Chancellor to set fees for University programmes delivered offshore and to report those to the Council meeting
immediately following
THAT Council authorise the Vice-Chancellor to authorise faculty Deans to award bursaries (effectively a discount) on international fees on the
understanding that this should drive volume, that the published fee remains at the approved rate and that standard University overheads are
not compromised
THAT Council approves the Compulsory Student Services Fee at $7.06 per point (GST inclusive), noting that the Vice-Chancellor will report back to
the Finance Committee on the review of coordination between the AUSA and the University on provision of services in early 2019
THAT Council approve the attached Other Fees Schedule for 2019
Professor Stuart McCutcheon Adrienne Cleland
VICE-CHANCELLOR
DEPUTY VICE-CHANCELLOR (OPERATIONS)
30 | P a g e
Student Fees Paper – Final Version 1.1 dated 04 October 2018
31 | P a g e
Document Outline