

19 June 2024
Chris Milne
[FYI request #26887 email]
Dear Chris Milne
Request for Information – Local Government Official Information and Meetings
Act 1987 (the Act)
We refer to you request dated 20 May 2024 for:
Please supply all the detailed operational plans and associated budgets for the
new Naenae Pool, as noted within Table 3, item 3, on page 17 of the agenda
papers for the LTP meeting on 17 May 2024.
Item 3 says:
Naenae pool operational budget
As the new build of the Naenae pool is nearing completion, the detailed
operational plans and associated budgets have been reviewed and updated
based on latest information.
Response:
The information that was provided to Council on 17 May 2024 had been based
on more up to date and detailed information on the expected revenues and
costs of operating the new Naenae Pool. The table below shows a high level
breakdown of the new costs compared to the original costs in the draft Long
Term Plan 2024/34.
30 Laings Road, Lower Hutt
Private Bag 31912, Lower Hutt 5040
/huttcitycouncil
0800 488 824
[email address]
www.huttcity.govt.nz
▲The pattern at the top of this page is inspired by the natural landforms, hil s, river, and coastline surrounding Lower Hutt. It represents our people, our place, and our home.
LTP
LTP
LTP
LTP
LTP
LTP
LTP
LTP
LTP
LTP
Budget Budget Budget Budget Budget Budget Budget Budget Budget Budget
Total
2024/25 2025/26 2026/27 2027/28 2028/29 2029/30 2030/31 2031/32 2032/33 2033/34
LTP
$M
$M
$M
$M
$M
$M
$M
$M
$M
$M
$M
Original Budgets
Revenue
(0.5)
(1.3)
(1.4)
(1.4)
(1.4)
(1.5)
(1.5)
(1.5)
(1.5)
(1.6)
(13.6)
Employee Costs
0.6
1.5
1.8
1.7
1.7
1.8
1.8
1.9
1.9
2.0
16.6
Operating Costs
0.4
0.8
0.8
0.9
0.9
0.9
0.9
0.9
0.9
1.0
8.4
Net
0.5
0.9
1.2
1.1
1.2
1.2
1.2
1.3
1.3
1.3
11.4
New Budgets
Revenue
(1.6)
(1.9)
(2.0)
(2.0)
(2.1)
(2.1)
(2.1)
(2.2)
(2.2)
(2.3)
(20.5)
Employee Costs
1.3
1.8
1.9
1.9
2.0
2.0
2.1
2.1
2.2
2.2
19.4
Operating Costs
0.9
1.2
1.2
1.2
1.3
1.3
1.3
1.3
1.4
1.4
12.5
Net
0.6
1.1
1.1
1.1
1.2
1.2
1.2
1.3
1.3
1.3
11.4
Difference
Positives Favourable/(Negatives Unfavourable)
Revenue
1.1
0.6
0.6
0.6
0.6
0.6
0.7
0.7
0.7
0.7
6.9
Employee Costs
(0.7)
(0.3)
(0.1)
(0.2)
(0.2)
(0.2)
(0.2)
(0.2)
(0.3)
(0.3)
(2.8)
Operating Costs
(0.5)
(0.4)
(0.4)
(0.4)
(0.4)
(0.4)
(0.4)
(0.4)
(0.4)
(0.4)
(4.1)
Net
(0.0)
(0.1)
0.1
0.0
0.0
0.0
0.0
0.0
0.0
0.0
0.0
Revenue has been based on expected numbers for pool entries, pool hire,
learn to swim, fitness users, sales, and other revenue.
Employee costs have been based on the expected numbers of staff to operate
the pool, which is a total of 28 FTEs. The costs have been updated to reflect the
increase to the living wage.
Staffing includes 11 permanent staff covering management,
reception/customer services, shift supervisors, swim school supervisor and
fitness instructor roles. It also includes 17 full time equivalent part-time and
casual lifeguard roles to ensure staffing requirements are met including
during busier periods ie, public and school holidays, and
afternoons/weekends.
Operating Costs include utilities costs (electricity, water charges etc),
insurance, security, cleaning, operational costs such as chemicals, al owance
for minor maintenance, etc. These costs reflect significant recent increases, in
addition to normal inflation, in electricity and insurance costs. The increases
in costs have been offset by similar increases in revenue.
The budgets in 2024-25 covers 9 months of operation.
Attached is the operating model work which was done in the design phase of
the project and is the basis for operational manuals which are currently being
developed.
Note that some aspects of design and operation have changed since this work
was done (eg: the pool now has two bulkheads which enables more areas of
Document Name / XX Month XXXX / Version XX
P.2
activity) and these figures did not make any al owance for inflation between
2020 and 2024 or changes to pricing for any other reason.
You have the right to seek an investigation and review by the Ombudsman of
this decision. Information about how to make a complaint is available at
www.ombudsman.parliament.nz or freephone 0800 802 602.
Please note that this response to your information request may be published on
Hutt City Council’s website. Please refer to the following link:
www.huttcity.govt.nz/council/contactus/make-an-official-information-act-
request/proactive-releases
Yours sincerely
Philip Rossiter
Senior Advisor, Official Information and Privacy
Document Name / XX Month XXXX / Version XX
P.3
 1.0 OPERATIONAL MODEL
1.1 INTRODUCTION
1.0 OPERATIONAL MODEL
1.1 INTRODUCTION
An indicative operating model has been developed for the proposed Naenae Pool and
Fitness Centre to reflect the concept design following value management changes. The
model is intended to provide an estimate of anticipated visits and the ongoing operating
costs for the proposed concept design.
The base operational model is based on the following scope of facility:
• 50 by 25 metre (10 lane) lap-pool with side ramp entry with one bulkhead (1,295m2).
• Leisure pool with a shal ow beach pool with water features and a multi-purpose leisure
pool with depth from 0.8 metre to 1.2 metre (330m2).
• Outdoor area with BBQs and shaded recreational area.
• 1 hydroslide.
• 1 birthday party room.
• 296m2 fitness space with individual changing spaces, storage and assessment room.
• Group, family and accessible changing rooms, administration, plant, and storage.
• Incorporates energy saving initiatives to GreenStar Level 5.
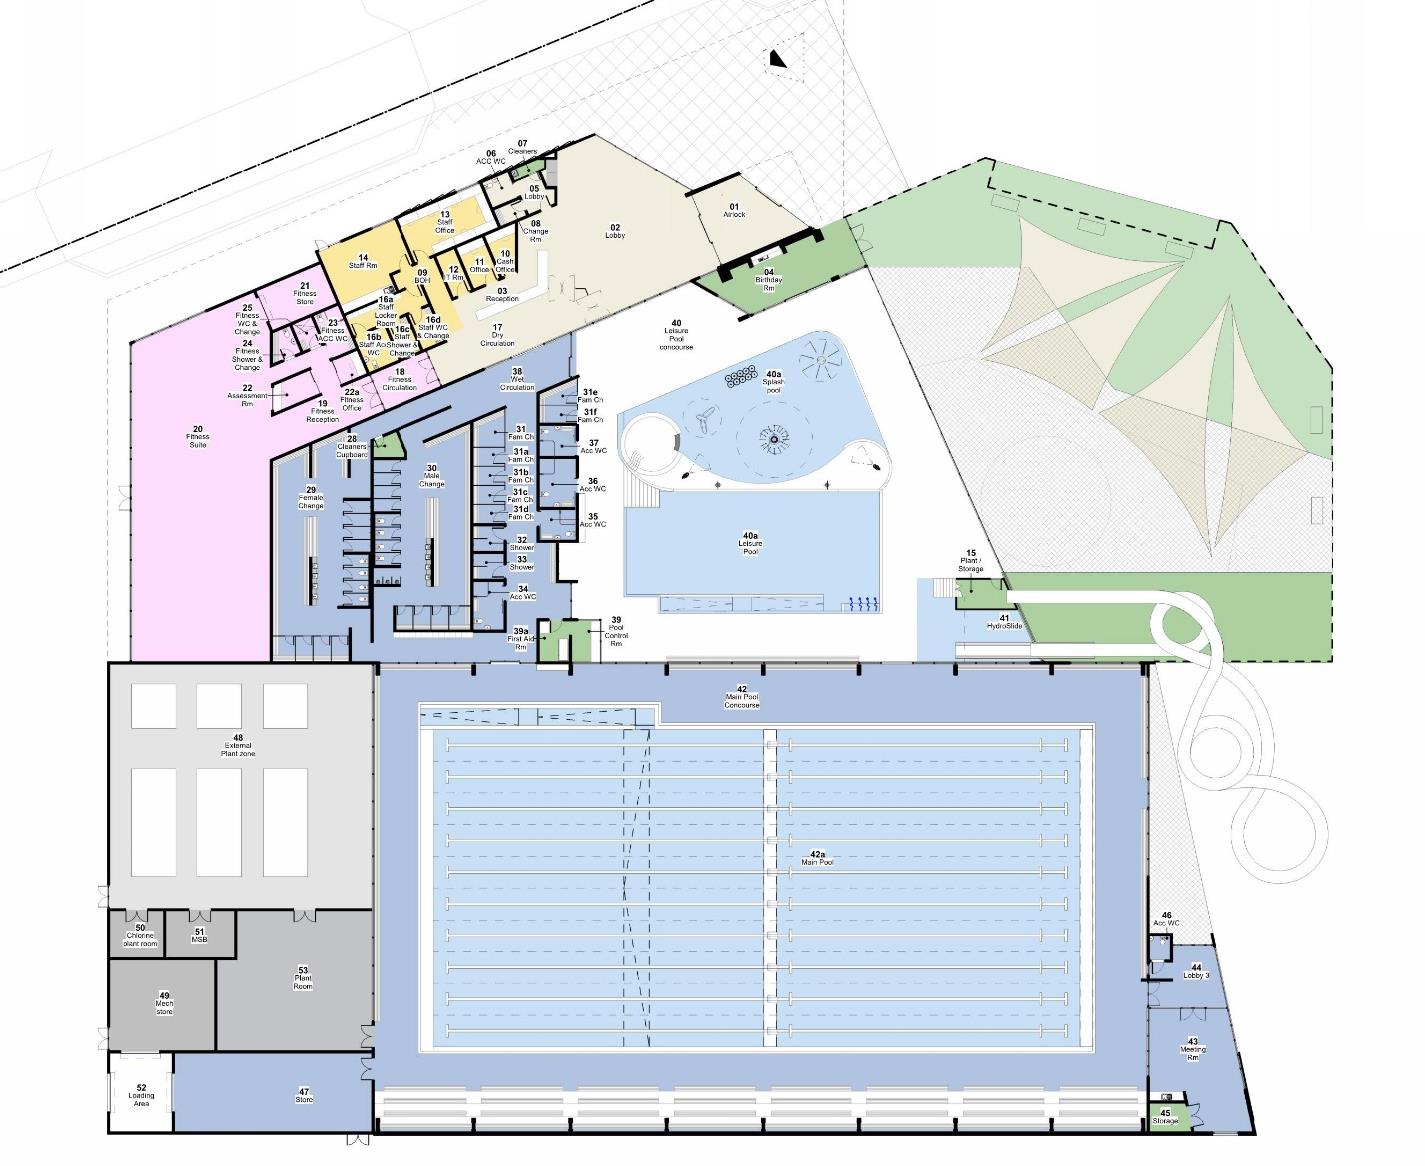
Figure 1.1 provides an outline of how the proposed design has been modelled:
• Area 1 - 50m pool and the pool hall.
• Area 2 - Multi-purpose leisure pool.
• Area 3 - Fitness Space.
FIGURE 1 – HOW THE NAENAE POOL IS DIVIDED IN THE OPERATIONAL MODEL
Area 3
Area 2
Area 1
NAENAE POOL & FITNESS CENTRE | OPERATIONAL MODEL POST VALUE MANAGEMENT
1
1.2 GENERAL ASSUMPTIONS
The following general assumptions have been applied in the operational model:
• All facilities are operated by Hutt City Council staff in an operating model similar to the
previous Naenae Pool and Fitness Centre.
• No escalation has been included (as directed).
• The operational model assumes a full-year of operation following opening (ie no part
years).
• The facility wil be operational for 50 weeks per year, allowing for a 2-week shutdown
period. No costs associated with a 2-week shutdown have been included. Day to day
maintenance is included but not renewal costs.
• 12 public holidays are included, with an allowance for time and a half.
• The financial picture provides an EBITDA view (Earnings before Interest, Taxes,
Depreciation and Amortization).
• No allowance has been included for internal costs, overheads, or insurance.
• All figures are GST exclusive.
It is important to note the operational modelling is inherently conservative and seeks to
present an achievable result rather than an optimistic or aggressive result.
1.3 PRICING
The pricing in the model is based on the approved entry prices for 2020/21, as specified in
Table 1. An allowance has been made for multi-visit and discounted rates for adults, seniors
and child as specified in Table 1. Under 5 are assumed as free in this model. Spectators
have been calculated but are assumed as free.
TABLE 1 PRICING STRATEGY FOR THE NEW AQUATIC FACILITY
2021/22 PRICING
IN MODEL (NO GST)
MULTI-BUY
DISCOUNTING
Adults
$6.00
$5.22
$4.43
55% full payment
40% multi-buy
5% non-payment
Senior
$4.50
$3.91
$3.17
35% full payment
60% multi-buy
5% non-payment
Child
$4.00
$3.48
$2.83
50% full payment
40% multi-buy
10% non-payment
Schools
$1.50 per head
$1.30
Pool Hire
$65.00 per hour for 25m x
$52.17
15m
$150.00 per hour for
$130.43
whole 50m
Learn to swim
Based on revenue per
$13.16
user 17/18
Swimzone
Based on revenue per
$2.10
user 17/18
Programmes
Based on revenue per
$5.65
user 17/18
Hydroslide
$4.50
$3.91
Parties
Based on similar facilities
$6.09
$7.00/child
Fitness
Based from average
$4.68
income 17/18
NAENAE POOL & FITNESS CENTRE | OPERATIONAL MODEL POST VALUE MANAGEMENT
2
1.4 OPERATING HOURS
The model is based on the following opening and operating hours when staff are on site.
PUBLIC OPENING HOURS
OPERATING HOURS
Weekdays
5.30am - 8pm
4.30am - 10.30pm
Weekends
8am-6pm
6am - 9pm
Public Holidays
9am -6pm
7am-9pm
1.5 ESTIMATING THE FUTURE USE
The operational model uses two approaches to estimate the future use of Naenae Pool and
Fitness Centre. The first approach uses Naenae Pool & Fitness Centre visit statistics to provide
a starting point and using the visits per square metre to calculate a range of potential visits
for the future facility. This is a rough approach but gives a useful guide for the lower and
upper range of potential visits.
The second approach uses a pool loading model which estimates the potential loading of
each water tank and builds the total visits using assumptions of use for different times of the
day, week, and year.
BASELINE VISITS
The last two full years of operation at Naenae Pool provide an indicative baseline for
estimating future visits. The last two years had aquatic visits between 270,000 to 300,000 per
annum, which correlates to between 245m2 to 270m2 visits/water-space. This represents a
high level of occupancy for the old facility.
The draft design for Naenae Pool has a similar pool composition to the previous facility,
except both pools are now larger:
- Main pool was 905m2 and the proposed new main pool is 1,295m2
- Leisure pool was 201m2 and the proposed new leisure pool is 330m2.
It is reasonable to assume the previous level of visits represents the lower range of potential
visits and the previous visits/water space represents the upper end of potential visits. Table
2 provides the total aquatic visits (not including spectators) to Naenae Pool in 2017/18 and
2016/17 and the ratio of visits to the water space.
TABLE 2 CURRENT AND POTENTIAL AQUATIC FACILITY VISITS
2016/17
2017/18
CONCEPT DESIGN
Water area
1,106
1,106
1,625
Aquatic visits
298,481
270,885
270,000 – 438,750
Visits/m2
270
245
166 - 270
The starting point for future aquatic visits is 270,000 as the minimum expected aquatic facility
visits, based on the aquatic visits achieved by the old facility. To estimate the upper end of
facility visits, the ratio of visits per water-area is used, which calculates to 438,750 aquatic
visits. 270 visits per water-space is high in comparison to other similar facilities, and therefore,
this is considered the likely maximum aquatic visits for the facility.
POOL LOADING
This approach is more refined to determine the likely loading of the facility. Loading is
different from maximum capacity. Maximum capacity is the absolute maximum number of
NAENAE POOL & FITNESS CENTRE | OPERATIONAL MODEL POST VALUE MANAGEMENT
3


people a facility can accommodate all the time. It is very rare for aquatic facilities to reach
maximum capacity as there is always peak and off-peak periods.
Loading is the expected number of people using the facility based on visits to each water
tank across different times of the day, week, and year. The loading model utilises common
use patterns in aquatic facilities by applying low, medium, and high loading patterns, to
estimate the number of visits to each pool-tank.
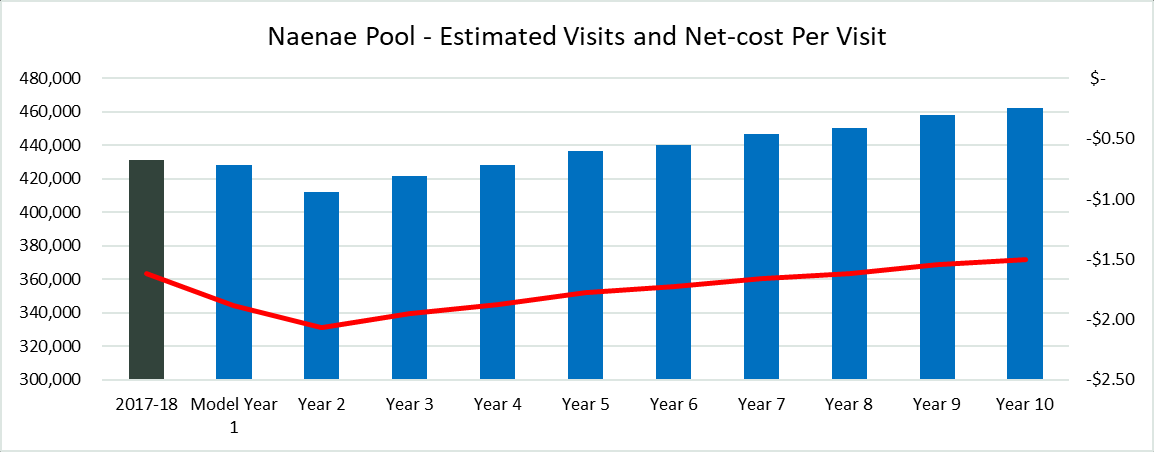
Based on the loading model, full loading is anticipated at 292,956 aquatic visits per annum,
this equates to 180 visits / square metre of water. It is typical for new aquatic facilities to
operate very close to full loading in year 1 as the new facility wil attract people to visit. It is
very common for visits to drop-away in year 2 and build across several years to reach full
loading (this is modelled in year 5 after opening). After this, it is expected small annual
increases wil be experienced based on population growth. At year 10, aquatic visits are
estimated at 310,000 (equates to 190 visits/m2).
Year 1
Year 2
Year 3
Year 4
Year 5
Small
Year 10
99%
95%
98%
99%
100%
increases
292,956 278,827
285,663
289,336
295,465
310,241
It is important to note, the model does not account for other variables such as opening or
closing of other aquatic facilities and changing weather patterns, which can impact
potential use (both positively and negatively). Therefore, we have not modelled visits
beyond 10 years.
The loading assumptions for each pool tank are outlined in the following sections. Table 3
outlines the estimated visits across different categories for facility visits including estimated
spectators, based on 50% aquatic sports and 50% child visits.
TABLE 3 – POOL LOADING ESTIMATED VISITS PER ANNUM
Year 1
Year 2
Year 3
Year 4
Year 5
Year 6
Year 7
Year 8
Year 9
Year 10
Adult
40,669
38,171
38,887
39,604
40,321
40,727
41,134
41,541
42,199
42,858
Child
70,154
65,795
67,064
68,333
69,602
70,304
71,005
71,707
72,826
73,945
Hire
71,679
68,812
70,245
71,679
72,396
73,113
73,829
74,546
75,263
75,980
School
43,680
44,117
44,558
45,004
45,454
45,908
46,367
46,831
47,299
47,772
Events
14,400
12,960
14,688
13,248
14,976
13,536
15,264
13,824
15,552
14,112
LTS
7,736
7,572
7,703
7,835
7,968
8,048
8,128
8,208
8,289
8,371
Swimzone
6,912
6,566
6,636
6,705
6,774
6,843
6,912
6,981
7,119
7,258
Programmes
5,092
4,751
4,859
4,968
5,076
5,127
5,178
5,229
5,302
5,375
Senior
9,271
8,590
8,828
9,065
9,303
9,396
9,488
9,581
9,694
9,807
Under 5
20,189
18,573
19,179
19,785
20,390
20,592
20,794
20,996
21,198
21,400
Parties
3,174
2,920
3,015
3,111
3,206
3,237
3,269
3,301
3,333
3,364
Slide
27,391
25,200
26,022
26,843
27,665
27,939
28,213
28,487
28,761
29,035
Fitness
62,515
63,936
65,357
66,778
68,198
69,619
71,040
72,461
73,882
74,592
Spectators
73,067
69,368
70,762
72,156
73,171
73,901
74,632
75,363
76,302
77,242
Total Facility
428,538 412,131 421,782 428,270 436,835 440,351 447,041 450,568 458,258 462,075
(No slide)
Total Aquatic visits 292,956 278,827 285,663 289,336 295,465 296,831 301,369 302,745 308,074 310,241
The pool loading has been built based on term and holiday periods as there are significant
differences expected in the visits across the year.
NAENAE POOL & FITNESS CENTRE | OPERATIONAL MODEL POST VALUE MANAGEMENT
4
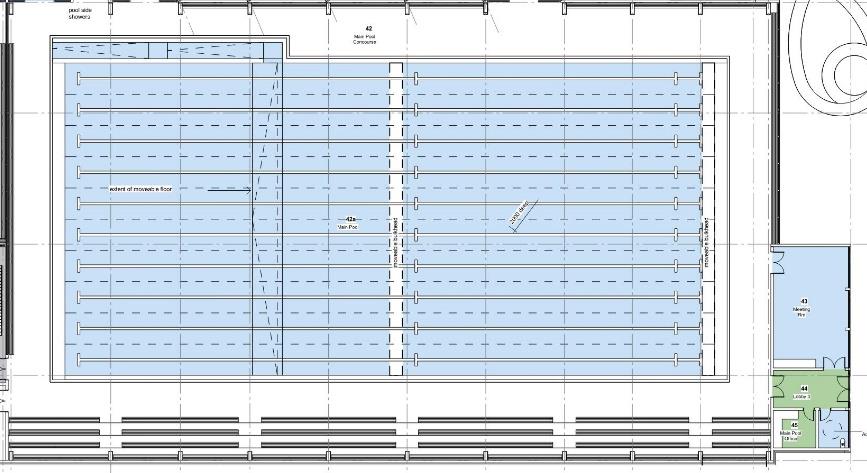 1.6 50M POOL
The 50m pool is designed to be multi-purpose and used for a range of activities including:
• Casual swimming for fitness – lap swimming, aqua-jogging and aqua-walking.
• Recreational play in both shallow and deeper water.
• Learn to swim using the moveable floor to create shallow water.
• School swimming using the moveable floor for shallow and deeper water as required.
• Aquatic sport training – swimming, water-polo, synchronised swimming, canoe-polo and
underwater hockey.
• Aquatic sport events – swimming, water-polo, synchronised swimming, canoe-polo and
underwater hockey.
The loading model is based on operating in 2x25m zones 7 days/week with lanes allocated
for different activities. It is noted the pool is likely to be in 50m mode at least once per week
and lanes have been allocated pro-rata to each activity. The loading model includes
variations between term and school holiday periods.
25m x 25m
25m x 25m
10 lanes
10 lanes
LOADING MODEL
PERIOD
TIME
TERM TIME
HOLIDAYS
Weekdays (5
Mornings
10 lanes casual laps
10 lanes casual laps
days/week)
10 lanes aquatic sport
10 lanes aquatic sport
During day
6 lanes casual laps
5 lanes casual laps
14 lanes schools
5 Lanes Learn swim mornings only
-
10 lanes play
After 3pm
2 lanes casual laps
4 lanes casual laps
3 lanes learn to swim (3 days/week)
-
2 lanes swim-zone
-
10 lanes aquatic sport
6 lanes aquatic sport
2 lanes play
10 lanes play
After 6pm
5 lanes casual laps
5 lanes casual laps
15 lanes aquatic sport
15 lanes aquatic sport
(20 lanes from 8pm to 10pm)
Weekends
Mornings
2 lanes casual laps
5 lanes casual laps
2 lanes play
5 lanes play
2 lanes learn to swim
-
4 Lanes swim-zone
-
10 lanes aquatic sport
10 lanes aquatic sports
Afternoons
9 lanes play
10 lanes play
1 lane casual laps
10 lanes casual laps
10 lanes aquatic sport
-
Public holidays
Day
10 lanes casual laps
10 lanes casual laps
10 lanes play
10 lanes play
Events
Day
Allowance for 30 event days
NAENAE POOL & FITNESS CENTRE | OPERATIONAL MODEL POST VALUE MANAGEMENT
5
The model allows for 30 event days each year. These have been al ocated in term periods
but could be allocated during holiday periods as well. The model also includes an
allowance to run 1 aquatic programme in the 50m pool every weekday (note most aquatic
programmes are modelled in the leisure pool).
MODELLED VISITS
MODEL
GROWTH ASSUMPTIONS
Adult
25,174
Estimated to grow in line with facility fluctuations
Child
41,782
Estimated to grow in line with facility fluctuations
Hire (aquatic sport)
71,679
Estimated to grow year on year by smal percentage growth.
Schools
43,680
Estimated to grow year on year by smal percentage growth.
Events
14,400
Estimated to grow on a 3 year cycle between high to low
Learn to swim
5,045
Estimated to grow year on year by smal percentage growth.
Swim zone
6,912
Estimated to grow year on year by smal percentage growth.
Programmes
2,208
Estimated to grow in line with facility fluctuations
Seniors
2,029
Estimated to grow in line with facility fluctuations
Total
212,909
164 visits per water-space
NAENAE POOL & FITNESS CENTRE | OPERATIONAL MODEL POST VALUE MANAGEMENT
6
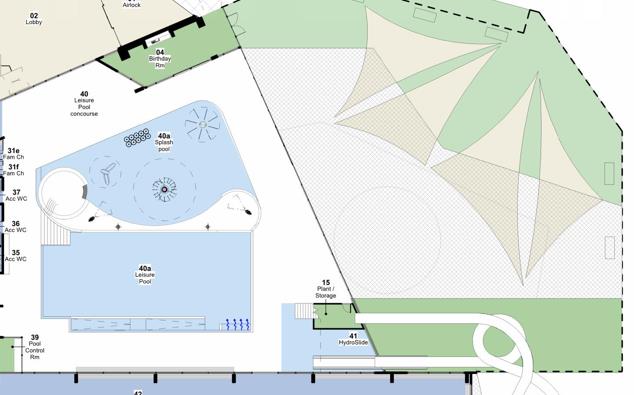 1.7 LEISURE POOL & HYDROSLIDE
The Leisure pool is designed to be multi-purpose and used for a range of activities including:
• Toddlers and young children play in the shallow water.
• Recreational play by older children and adults in the deeper water.
• Learn to swim in the deeper leisure pool.
• Aquatic programmes in the deeper leisure pool.
• Gentle hydrotherapy in the deeper leisure pool.
The loading model is based programming the pools for different activities across the day
and week. The loading model includes variations between term and school holiday periods.
LOADING MODEL
PERIOD
TIME
TERM TIME
HOLIDAYS
Weekdays (5
Mornings
Aqua-fitness
Aqua-fitness
days/week)
During day
Adults and toddlers play
Adults and toddlers for play swimming
swimming
Seniors for hydrotherapy
Seniors for hydrotherapy
3 Learn to Swim classes
-
(3 days/week)
-
Child for play swimming
After 3pm
3.30-5pm learn to swim
-
(3 days/week)
Adults and Child play swimming
Adults and Child play swimming
After 6pm
Aquatic programmes
Aquatic programmes
Weekends
Mornings
8.00-9.30am learn to swim classes -
Adult & child play swimming
Adult & child play swimming
Afternoons
Adult & child play swimming
Adult & child play swimming
Public holidays
Day
Adult & child play swimming
Adult & child play swimming
Hydroslide
Day
Based on 25% of adult visits and 48% of child visits
NAENAE POOL & FITNESS CENTRE | OPERATIONAL MODEL POST VALUE MANAGEMENT
7
MODELLED VISITS
MODEL
ASSUMPTIONS
Adult
15,495
Estimated to grow in line with facility fluctuations
Senior
7,243
Estimated to grow in line with facility fluctuations
Child
28,372
Estimated to grow in line with facility fluctuations
Under 5
20,189
Estimated to grow in line with facility fluctuations
Parties
3,174
Estimated to grow in line with facility fluctuations
Hydroslide
27,391
Percentage growth in line with the rest of the facility
Learn to swim
2,691
Estimated to grow year on year by smal percentage growth.
Programmes
2,884
Estimated to grow year on year by smal percentage growth.
Total
80,047
242 visits per water-space
(no hydroslide)
NAENAE POOL & FITNESS CENTRE | OPERATIONAL MODEL POST VALUE MANAGEMENT
8
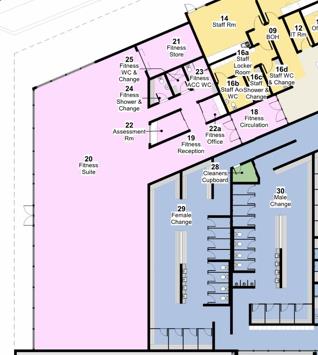 1.8 FITNESS SPACE
The estimated visits for the fitness space have been calculated using visits/square metre
compared to the old fitness space at the previous Naenae Pool and Fitness Centre.
Area
Visits
Visits/Area
2016-17
323m2
81,507
244/m2
2017-18
323m2
78,687
252/m2
Estimated visits
296m2
71,040
240/m2
Estimated capacity
296m2
74,592
252/m2
The model anticipates it wil take 6 years to reach estimated visits as a conservative
estimate. Maximum capacity is anticipated by year 10.
NAENAE POOL & FITNESS CENTRE | OPERATIONAL MODEL POST VALUE MANAGEMENT
9
 1.9 OTHER ASSUMPTIONS
COMPONENT
ASSUMPTIONS
Vending machines
1.9 OTHER ASSUMPTIONS
COMPONENT
ASSUMPTIONS
Vending machines Based on previous vending machine income, it is assumed income of $0.5 of
casual aquatic visits.
Retail
Based on a limited retail offering to begin with, it is assumed $1.02 of learn to
swim entries.
Staff
Facility Staff include:
• Facility Manager – ful -time salaried
• Operations Manager – ful -time salaried
• 6 Shift Supervisors – ful -time salaried
• Reception Team Leader – ful -time salaried
• Receptionist to cover al opening hours plus 20% cover for peak periods.
Based on a living wage hourly wage of $22.75.
Lifeguarding staff – al lifeguards paid a living wage of $22.75
• Minimum of 1 lifeguard for each pool for al operating hours.
• 2 additional lifeguards for 50m pool for afternoons, weekends and
holidays.
• 2 additional lifeguards for leisure pool during afternoons and weekends.
• 3 additional lifeguards for leisure pool for school holidays. Assuming some
of this capacity can float.
Learn to swim staff include:
• Supervisor – ful -time salaried
• 1 Teacher for al class/space hours at $22.75 living wage
Programme staff include an instructor on an hourly rate of $25.00 for al
programme hours.
Fitness staff include:
• Team Leader – ful -time salaried
• 5 instructors on 30 hours per week at the Living Wage $22.75
KiwiSaver and ACC levies at 5% of al wages.
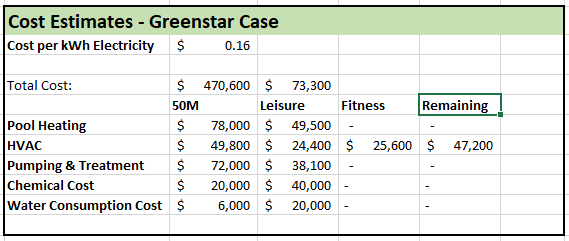
Utilities
Power for pool heating, air handling, pumping and treatment has been
calculated by Powell Fenwick for each pool area using their own modelling
on energy consumption and efficiency. The potential savings from Green
Star 5 have been applied. Water and chemicals have also been calculated
by Powell Fenwick.
Repairs &
An al ocation has been identified for each pool area and the remaining
Maintenance
facility based on a new facility.
Administration
To cover promotion, training, uniforms, software, office supplies.
Consumables
To cover changing room and cleaning supplies.
NAENAE POOL & FITNESS CENTRE | OPERATIONAL MODEL POST VALUE MANAGEMENT
10
 1.10 FINANCIAL FORECASTS
The following pages outline the estimated forecasts for each pool and the facility overall.
COMPARISON BETWEEN ACTUAL AND ESTIMATED – VISITS & FINANCIAL
VISITS
2016-17
2017-18
Model Year 1
Adult
45,494
42,104
40,669
Senior
10,534
10,607
9,271
Child
73,757
72,061
70,154
Under 5
20,189
Schools
45,253
42,252
43,680
Pool Hire
90,761
80,244
86,079
Learn to Swim
11,917
7,437
7,736
Programmes
4,014
5,019
5,092
Swimzone
16,751
14,858
6,912
Fitness
81,507
78,687
62,515
Parties
3,174
Hydroslide
27,391
Spectator
87,377
78,265
73,067
Total
467,365
431,534
428,538
FINANCIAL RESULTS
Revenue
$ 1,095,862 $ 955,820 $ 1,261,933
Operating Cost
$ 1,708,270 $ 1,653,669 $ 2,068,664
Net Cost
$ 612,408 $ 697,849 $ 806,731
Net Cost / User
$ 1.31 $ 1.62 $ 1.88
Revenue / User
$ 2.34 $ 2.21 $ 2.94
ESTIMATED VISITS AND NET COST OVER FIRST 10 YEARS
VARIATION OF VISITS ACROSS THE DAY AND YEAR
Average Hourly Visits Across the Day / Year - Year 1
150
100
50
0
Weekday mornings
Weekdays
Weekday afternoons
Weekday evenings
Weekend mornings Weekend afternoons
Term 1
Term 1 Holidays
Term 2
Term 2 Holidays
Term 3
Term 3 Holidays
Term 4
Summer Holidays
NAENAE POOL & FITNESS CENTRE | OPERATIONAL MODEL POST VALUE MANAGEMENT
11
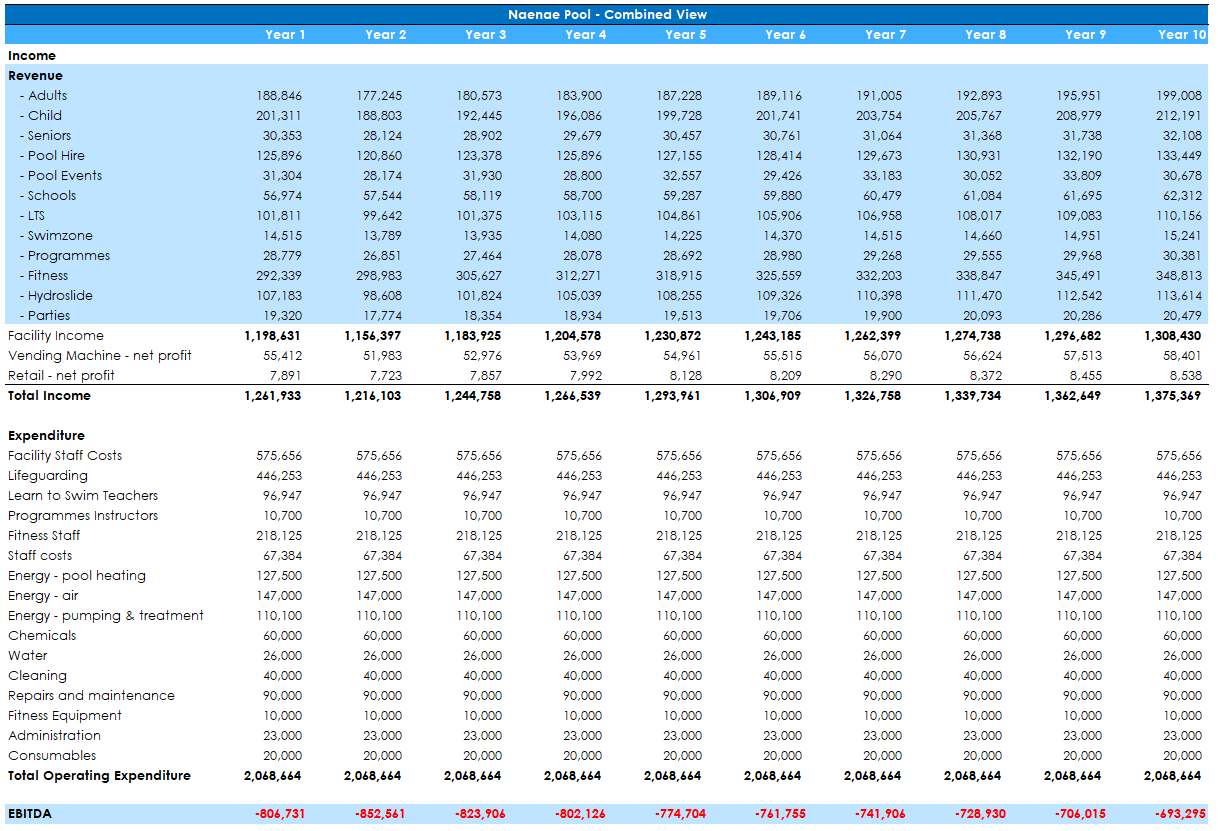 WHOLE AQUATIC FACILITY OPERATING MODEL 10 YEAR FORECAST
NAENAE POOL & FITNESS CENTRE | OPERATIONAL MODEL POST VALUE MANAGEMENT
12
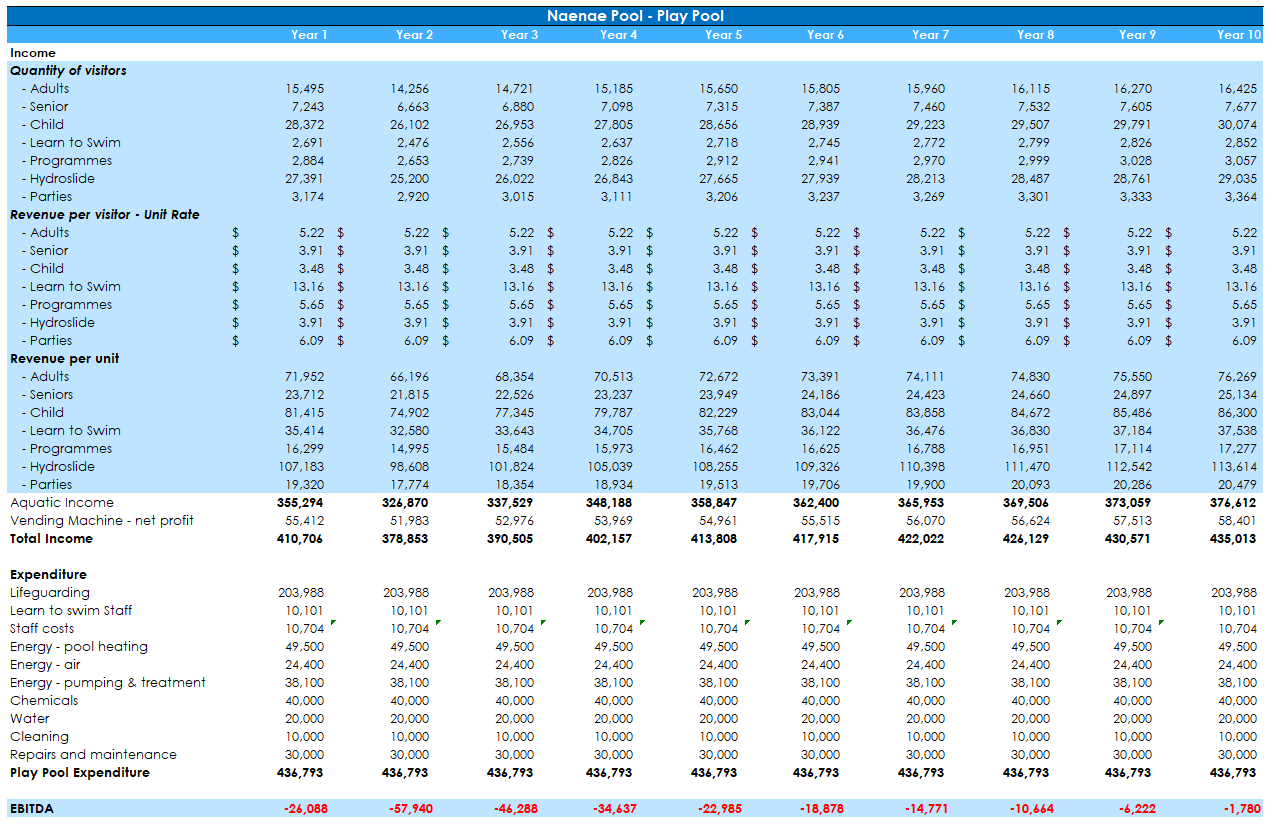
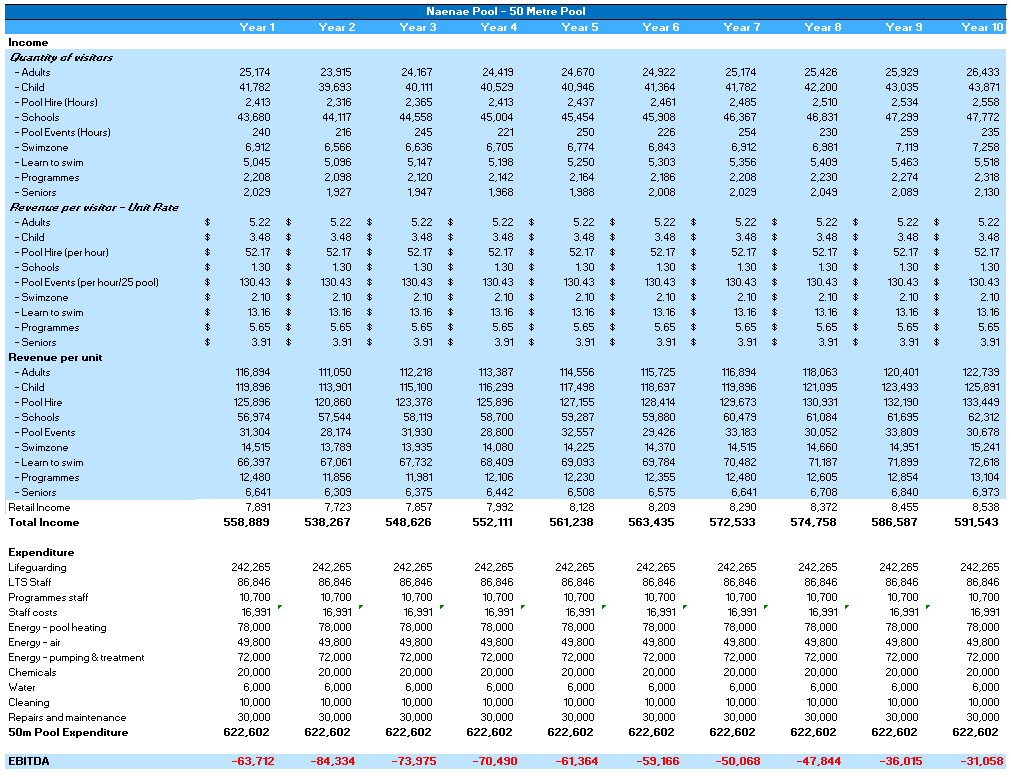 50M POOL OPERATING FORECAST
NAENAE POOL & FITNESS CENTRE | OPERATIONAL MODEL POST VALUE MANAGEMENT
13
 LEISURE POOL OPERATING FORECAST
NAENAE POOL & FITNESS CENTRE | OPERATIONAL MODEL POST VALUE MANAGEMENT
LEISURE POOL OPERATING FORECAST
NAENAE POOL & FITNESS CENTRE | OPERATIONAL MODEL POST VALUE MANAGEMENT
14
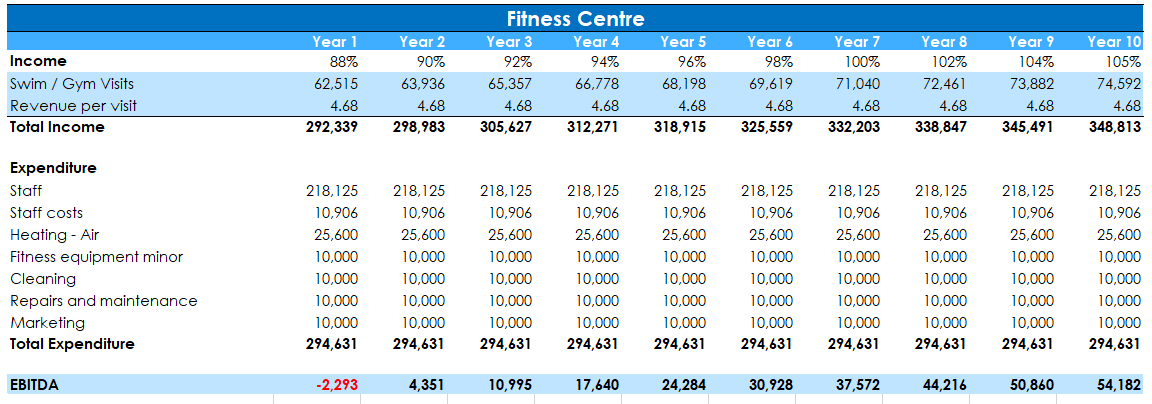 FITNESS OPERATING FORECAST
NAENAE POOL & FITNESS CENTRE | OPERATIONAL MODEL POST VALUE MANAGEMENT
FITNESS OPERATING FORECAST
NAENAE POOL & FITNESS CENTRE | OPERATIONAL MODEL POST VALUE MANAGEMENT
15
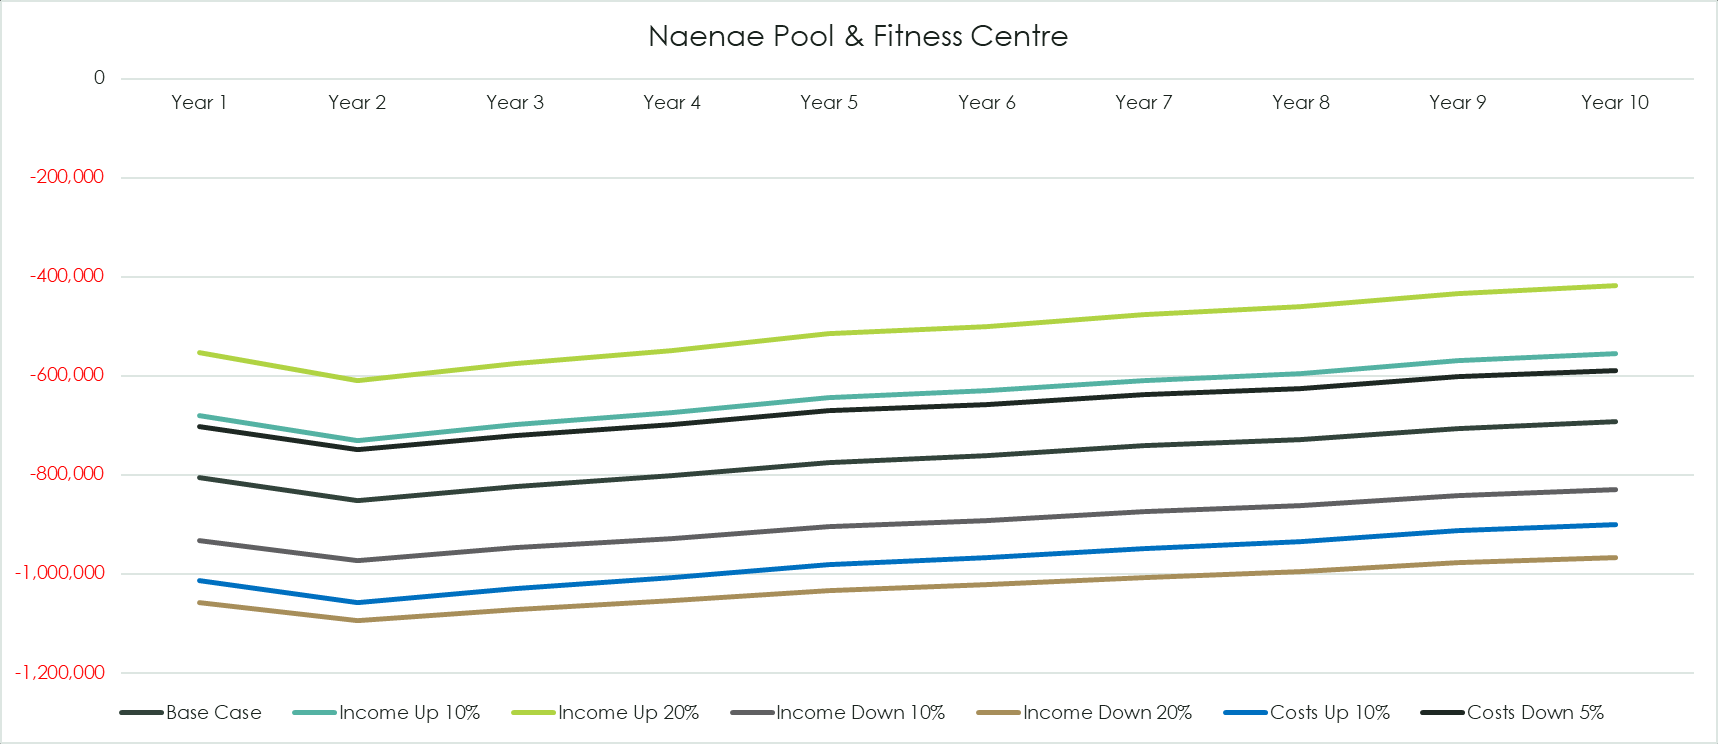 SENSITIVITY ANALYSIS
Sensitivity analysis has been undertaken on different levels of income and costs. The
following graph shows EBITDA (Earnings before interest, depreciation and tax) or the
operating result for different assumptions of income up/down or costs up/down. The graph
shows there are no scenarios where breakeven is possible.
NAENAE POOL & FITNESS CENTRE | OPERATIONAL MODEL POST VALUE MANAGEMENT
16
Document Outline