link to page 1 link to page 1 link to page 1 link to page 1 link to page 1 link to page 1 link to page 1 link to page 13 link to page 12 link to page 12 link to page 12 link to page 12 link to page 12 link to page 12 link to page 13 link to page 13 link to page 12 link to page 13 link to page 13 link to page 13 link to page 13 link to page 13 link to page 13 link to page 12 link to page 12

 Geoderma Regional 25 (2021) e00383
Contents lists available at
ScienceDirect
Geoderma Regional
j o u r n a l h o m e p a g e :
w w w . e l s e v i e r . c o m / l o c a t e / g e o d r s
Long-term monitoring of soil quality and trace elements to evaluate land
use effects and temporal change in the Wellington region, New Zealand
John J. Drewry
a,⁎, Jo-Anne E. Cavanagh
b, Stephen J. McNeill
b, Bryan A. Stevenson
c,
Dougall A. Gordon
d, Matthew D. Taylor
e
a Manaaki Whenua – Landcare Research, Private Bag 11052, Palmerston North, New Zealand
b Manaaki Whenua – Landcare Research, PO Box 69040, Lincoln, New Zealand
c Manaaki Whenua – Landcare Research, Private Bag 3127, Hamilton, New Zealand
d Greater Wellington Regional Council, PO Box 41, Masterton, New Zealand
e Waikato Regional Council, Private Bag 3038, Waikato Mail Centre, Hamilton, New Zealand
a r t i c l e i n f o
a b s t r a c t
Article history:
Soil quality monitoring is used to assess the soil's ability to maintain agricultural productivity, ecological, and en-
Received 16 June 2020
vironmental quality. Very few soil quality monitoring studies have reported on multiple samplings over the long-
Received in revised form 19 January 2021
term. Several regional authorities in New Zealand have monitored soil quality since the late 1990s. In the
Accepted 14 February 2021
Wellington region, dairy, mixed cropping, market garden, drystock (sheep/beef), horticulture, exotic forestry
Available online xxxx
and indigenous land use systems, and four soil orders have been monitored over 19 years, with up to five repeat
samplings per site. This study reports on key soil quality indicators and Cu, Zn, and Cd concentrations. For the
Keywords:
Soil quality
most recent sampling per land use, all land use system sites, except drystock, had Zn concentrations below rec-
Soil health
ommended ecological toxicity guidelines. Dairy land use had 21%, and 36% of sites within recommended soil
Land use
quality target ranges, for Olsen P, and macroporosity, respectively. Compared with indigenous land, across all
Carbon
samplings, Cu concentrations were elevated in horticultural and market gardens sites, while several land uses
Temporal change
had lower total nitrogen and higher Olsen P concentrations. Across all samplings, significant increases over
Soil compaction
time were observed in Zn for dairy, total nitrogen for drystock, and Olsen P for mixed cropping. Significant de-
Cambisols
creases over time were observed for Cu in forestry, Cd for indigenous and forestry, and bulk density for drystock.
Fluvisols
No changes over time were detected for macroporosity, anaerobically mineralised nitrogen, or organic carbon.
Gleysols
This study shows the programme and our analysis of multiple samplings are valuable for detecting significant
Planosols
trends as an early warning, e.g. Zn and Olsen P changes. The study provides evidence for recommending addi-
tional sites for several land uses and increased sampling frequency to ensure future robust statistical analysis.
This study included only sites where land use systems did not change, providing a robust basis for detecting
change over time, for informing policy, resource and environmental decision-making.
© 2021 Elsevier B.V. All rights reserved.
1. Introduction
difference, while others use the terms synonymously (e.g.
Bünemann
et al., 2018; Kibblewhite, 2018). To maintain consistency with early
Widespread and increasing concern over the state of the environ-
publications (e.g.
Sparling et al., 2004), the term soil quality is used for
ment and the impacts of human activities on ecosystem services and
this study, and throughout the paper. Soil quality monitoring
functions, highlights the essential need for high-quality, long-term
programmes are used by regulatory agencies to monitor the impact of
datasets in order to detect environmental change and understand the
land management changes on soil condition to help protect or improve
effects of multiple pressures (
Parr et al., 2003; Condron et al., 2014;
the soil resource
(Sparling et al., 2004;
McBratney et al., 2014). Soil qual-
Johnston et al., 2017). Soil quality is complex with a range of definitions
ity monitoring has led to inclusion of trace elements in policy, such as
(
Bünemann et al., 2018). Soil quality is used to assess the soil's ability to
regional policy statements to regulate environmental management,
maintain agricultural productivity, and ecological and environmental
for example, to limit accumulation of Cd, F, and Zn in soil
(Waikato
quality. The definitions of soil quality and soil health have been
Regional Council, 2016).
discussed in the literature with some maintaining that there is a
While soil quality monitoring programmes exist at regional, state,
national, and international scales
(Morvan et al., 2008; Saby et al.,
2009;
Nerger et al., 2016), most have only been undertaken on a one-
⁎ Corresponding author.
E-mail address:
[email address] (J.J. Drewry).
off basis
(Cotching and Kidd, 2010; Arrouays et al., 2012). In other
https://doi.org/10.1016/j.geodrs.2021.e00383
2352-0094/© 2021 Elsevier B.V. All rights reserved.
link to page 12 link to page 12 link to page 12 link to page 12 link to page 12 link to page 12 link to page 12 link to page 12 link to page 13 link to page 13 link to page 12 link to page 13 link to page 12 link to page 12 link to page 13 link to page 13 link to page 12 link to page 13 link to page 12 link to page 13 link to page 13 link to page 13 link to page 3 link to page 3 link to page 3 link to page 12 link to page 12 link to page 12 link to page 12 link to page 12 link to page 12 link to page 13 link to page 13 link to page 12 link to page 13 link to page 13 link to page 13 link to page 12 link to page 13 link to page 12 link to page 12 link to page 12 link to page 12 link to page 12 link to page 12 link to page 12 link to page 12
J.J. Drewry, J.-A.E. Cavanagh, S.J. McNeill et al.
Geoderma Regional 25 (2021) e00383
cases, considerable effort has gone into the planning of programmes,
Sampling frequency was 3-yearly for dairy, market garden and
but they have not been implemented
(Huber et al., 2008; Kibblewhite
mixed-cropping, 7-yearly for exotic forestry, horticulture, and drystock,
et al., 2010; Bünemann et al., 2018).
and 10-yearly for indigenous vegetation with sampling occurring in
Where programmes have re-sampled sites over time (e.g.
Cathcart
southern hemisphere autumn months of April and May. Within the
et al., 2008), these are for a single, or in some cases, several land uses
same land use/farm system, the vegetative cover may be different at
or climatic environments. For example, soil quality monitoring in Al-
the time of sampling; for example, a drystock sampling site may have
berta, Canada, regularly re-sampled the sites of cultivated cropping-
been under grazed pasture at one sampling and under fodder crop an-
land
(Cathcart et al., 2008; Caron et al., 2010), while other programmes
other sampling time. In this paper, we grouped sites based on the land
have re-sampled specific sites over time on multiple land uses (
Taylor
use system, rather than the ‘vegetation cover’ at the time of sampling.
et al., 2010; Curran-Cournane, 2015; Nerger et al., 2016). Soil monitor-
Details of field methods are reported in
Hill and Sparling (2009).
ing in Bavaria, Germany was limited to grassland sites, but was sampled
Briefly, at each site a 50-m transect was used to take 10-cm-depth soil
regularly
(Kühnel et al., 2019). The British Countryside Survey, for ex-
cores, taken approximately every 2 m. Individual cores were bulked and
ample, re-sampled sites three times, at approximately 10 year intervals,
mixed to obtain a representative sample for chemical and trace element
but the programme ceased in 2007 and had a limited range of four soil
analyses. The 10-cm depth was chosen as reported by
Sparling et al.
indicators (
Emmett et al., 2010; Reynolds et al., 2013).
(2004); that study implemented that depth due to standard equipment
Trace elements can accumulate over time from use of pesticides, an-
being available, the depth was the same as required for New Zealand
imal remedies, veterinary medicines, fertiliser, and manure, but few
IPCC surface carbon sampling, and similar to the soil fertility depth to
programmes regularly monitor a range of trace elements. The French
7.5 cm on New Zealand farms. For the soil physical analyses described
National Soil Quality Monitoring Network (
Saby et al., 2009), for exam-
below, three undisturbed (intact) soil samples were collected along the
ple, covers the whole of France using 16-km grid sampling, and moni-
field transect per site by pressing steel liners (10 cm diameter, 7.5 cm
tors trace element contamination, but has only been sampled once
depth) into the soil, and excavating them. Resampling of sites involved
(
Arrouays et al., 2012). In New Zealand, soil quality monitoring by re-
visiting the same transect. In some cases, revisiting the same site transect
gional authorities typically includes seven or more trace elements, and
was not possible every time (e.g. due to inaccurate record, accuracy of GPS
concentrations above maximum recommended soil guidelines have
technology, changes within paddock), in which case the resampling was
been recorded (
Taylor et al., 2010; Cavanagh, 2014).
undertaken at a position nearby in the same paddock, because the pad-
This study examines temporal change in soil quality including key
dock is the management unit where farm management is implemented.
trace elements, over the 19-year period (2000–2018 inclusive) of the
monitoring programme from the Wellington region of New Zealand.
2.2. Soil properties
This regional soil quality monitoring programme was developed from
an earlier national study across 10 regions (
Sparling et al., 2004). The
The programme monitors 11 trace elements (As, Cd, Cr, Cu, Pb, Ni, Zn
soil quality monitoring programme is intended to serve two main pur-
since 2000; Fe, Mn, U, F since 2013), and the soil quality indicators pH,
poses – to assess the quality of soils at sites in relation to land use during
bulk density, macroporosity, anaerobically mineralised nitrogen, total
a particular sampling period, and to assess any changes over time to in-
nitrogen, Olsen phosphorus, organic carbon, aggregate stability (tilled
form environmental policy decision making. However, no assessment of
sites), and, since 2012, hot water-extractable C and N. We have focussed
temporal changes has been made over the last 19 years, where re-
on a subset of the key soil properties, specifically cadmium (Cd), copper
sampling has occurred at intervals of 3 to 10 years. We assessed changes
(Cu), zinc (Zn), bulk density, macroporosity, anaerobically mineralised
over time for the key soil properties: cadmium, copper, zinc, bulk den-
nitrogen (AMN), total nitrogen (TN), Olsen phosphorus, and organic
sity, macroporosity, anaerobically mineralised nitrogen, total nitrogen,
carbon (OC). This is because Cd, Cu, and Zn are commonly elevated in
phosphorus, and organic carbon. We also discuss how results and learn-
agricultural soils due to inputs from fertilisers, fungicides and animal
ings from this analysis from regular re-sampling on multiple land uses
remedies respectively. Macroporosity is the percentage of large soil
can inform resource management decision-makers and inform future
pores responsible for soil drainage and aeration, and has been identified
improvements to monitoring programmes.
as an indicator of soil compaction
(Drewry et al., 2004a; Rab et al.,
2014). Olsen P is an indicator of plant-available P, OC is an estimate of
organic matter content, and TN has been shown to be a useful surrogate
2. Methods
measure of soil N supply (
Shepherd et al., 2015). AMN estimates how
much organic N is potentially mineralisable and can be considered bio-
2.1. Sites, land use and soils in the programme
logically active, and is also used as a surrogate measure of the microbial
biomass
(Hart et al., 1986;
Sparling et al., 2004;
Hill and Sparling, 2009).
The Wellington region's monitoring programme commenced in
Soil chemical analyses, except for trace elements, were carried
2000, with sampling across a range of land uses and soil orders. The
out by the Manaaki Whenua – Landcare Research environmental
original monitoring study design had a focus on soil and land use com-
chemistry laboratory (
Manaaki Whenua – Landcare Research,
binations perceived to be a risk to the environment from land use inten-
2019). The composite soil samples for chemical analyses were well
sification
(Sparling and Schipper, 2002; Sparling et al., 2004). The
mixed, air-dried and sieved (<2 mm). Total N and OC were deter-
distribution of land use in the region shows monitoring sites tend to
mined by dry combustion of air-dry, finely ground soil, AMN by an-
be spatially concentrated in areas with intensive land uses on low relief
aerobic 7-day incubation at 40 °C, and Olsen P was measured and
areas within river valley or basins, compared to less intensive land uses
reported gravimetrically
(Blakemore et al., 1987; Manaaki Whenua
in hill country areas
(Fig. 1). Land uses monitored in the programme
– Landcare Research, 2019). Total recoverable trace elements were
which are considered to be intensive are dairy, mixed cropping, and
analysed by inductively coupled-mass spectrometry (ICP-MS)
market gardens (
Table 1). Land uses considered less intensive are also
following concentrated nitric/hydrochloric acid digestion, by Hill
monitored: drystock (i.e. sheep/beef, non-dairy), horticulture, and ex-
Laboratories, Hamilton. From the three undisturbed (intact) soil
otic forestry and indigenous vegetation
(Table 1). The predominant
samples per site, a 3-cm deep subsample ring was taken to determine
soil orders monitored (New Zealand classification system
(Hewitt,
bulk density, and macroporosity (pores >30 μm) measured at
2010), followed by FAO
(Krasilnikov et al., 2009; IUSS Working Group
−10 kPa matric potential on ceramic tension plates, with remaining
WRB, 2015)), are Brown Soils, (Cambisols/Fragic Cambisols), Gley
soil for particle density used in the macroporosity calculation
Soils (Gleyic Fluvisols/Gleysols), Pallic Soils (Fragic Planosols/Luvic Pla-
(
Gradwell, 1972;
Hill and Sparling, 2009) by the Manaaki Whenua
nosols), and Recent Soils (Fluvisols).
– Landcare Research soil physics laboratory in Hamilton.
2
link to page 12 link to page 12 link to page 12 link to page 12 link to page 13 link to page 13 link to page 3 link to page 4
J.J. Drewry, J.-A.E. Cavanagh, S.J. McNeill et al.
Geoderma Regional 25 (2021) e00383
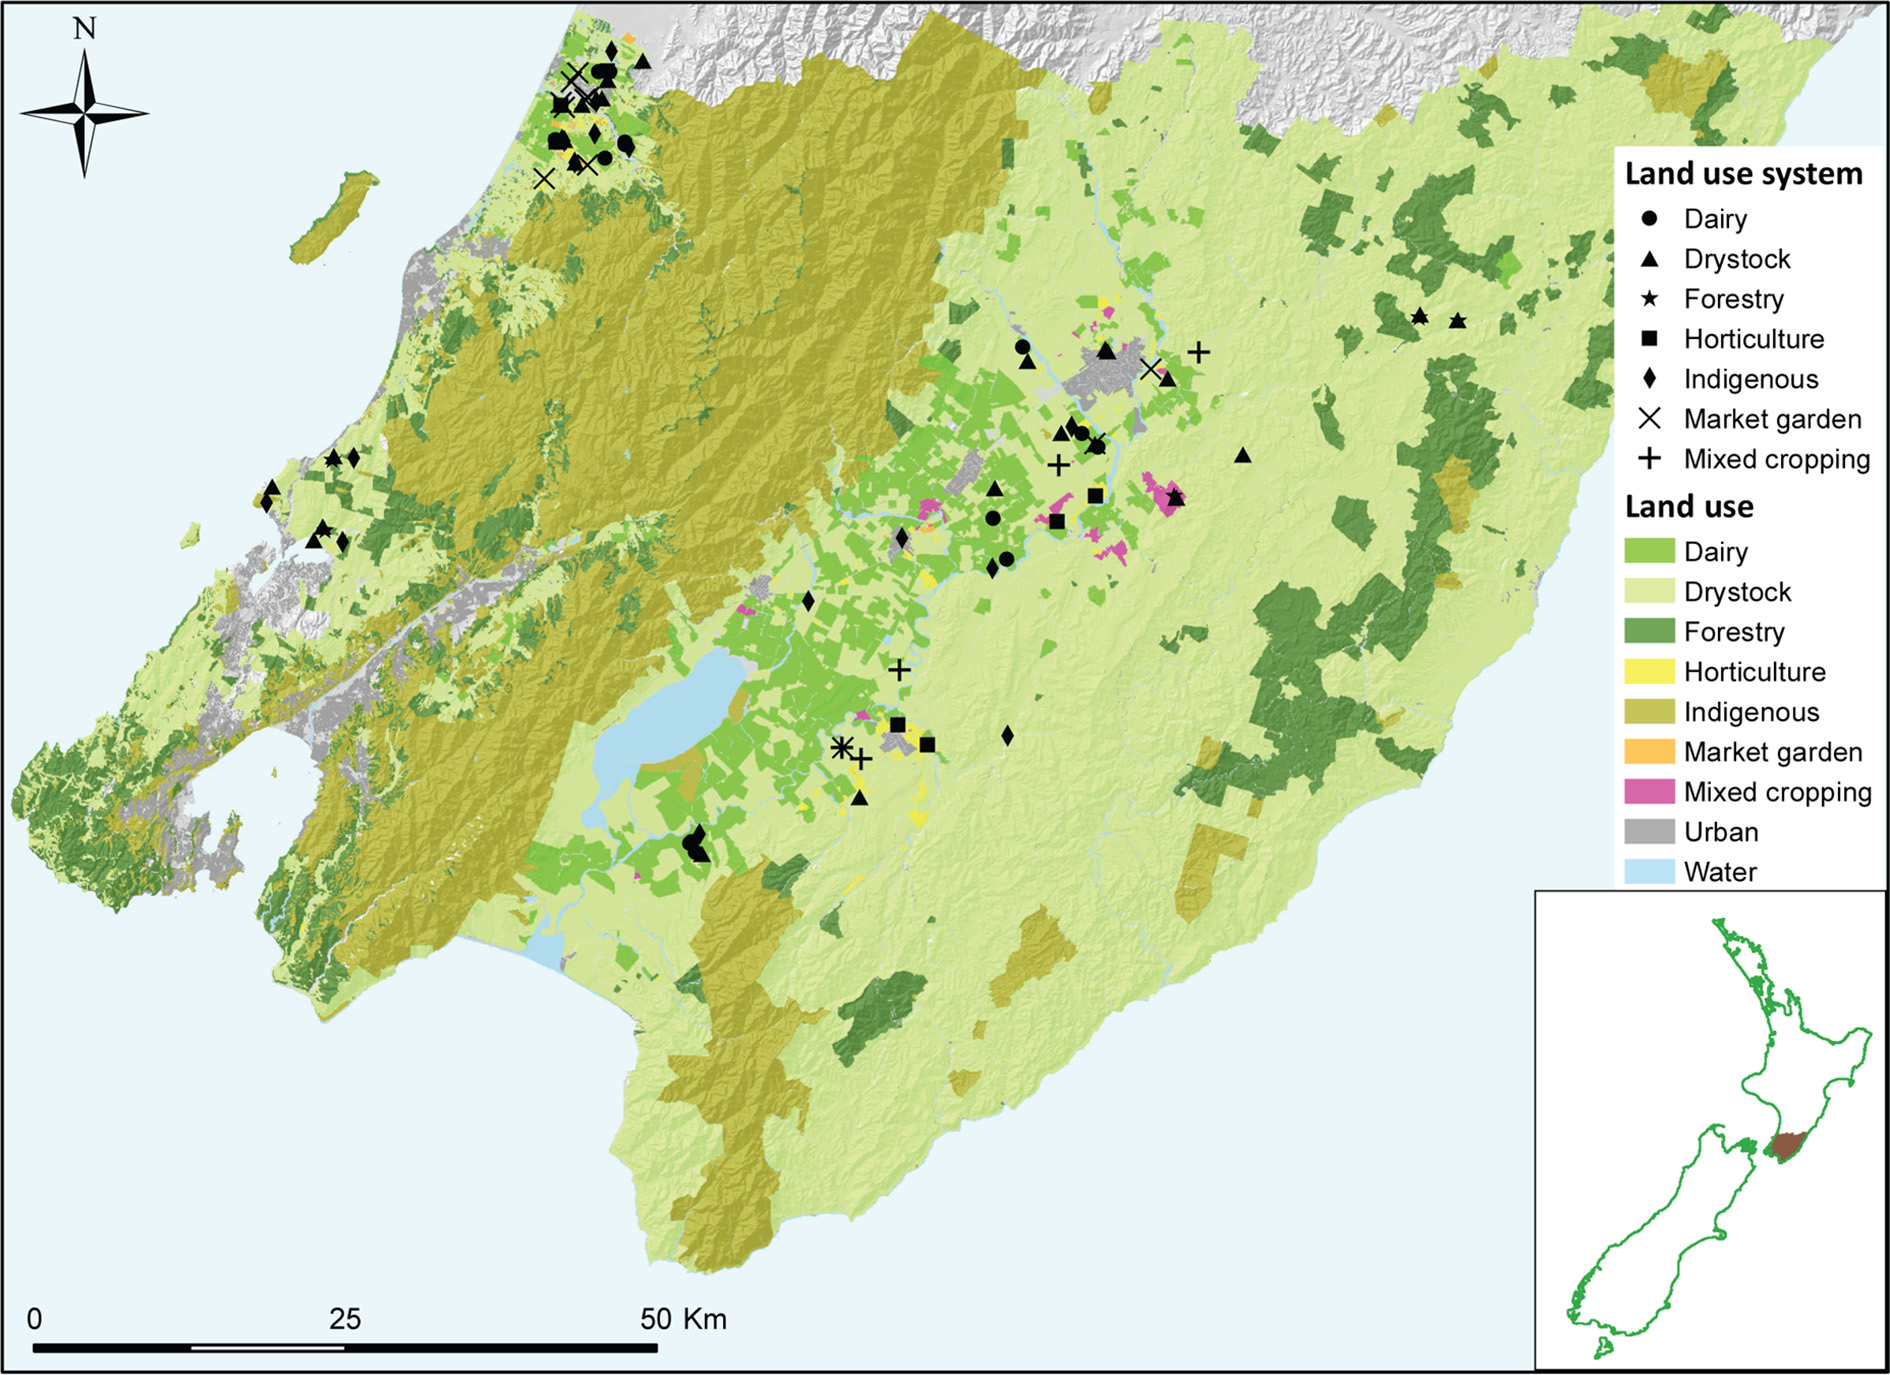
Fig. 1. Wellington region land use map and distribution of soil quality monitoring sites.
Table 1
A regional land use map was constructed by Greater Wellington Re-
Land use system classifications used in the analysis.
gional Council (GWRC) using GIS, council records, and LUCAS
(Ministry
Land use
Description
for the Environment, 2019) data to provided context to soil quality
system
monitoring results used in this study.
Mixed cropping
Extensive arable cropping (e.g. cereals, maize,
grass seed)
2.4. Data preparation and analysis
Dairy
Milking platform (effective area including
pasture and crop for grazing lactating cows)
Drystock
Sheep, beef, deer, dairy runoff (for non-lactating
Data were available from 2000 to 2018 inclusive (19 years) for 118
cows or young stock)
sites. Up to five repeat-samplings per site were available. There were
Forestry
Exotic forestry (e.g. Pinus radiata plantation)
too few sites to determine temporal trends for Melanic and Allophanic
Horticulture
Orchards, vineyards
Soils, so these, and all sites with only one sampling date were removed
Market garden
Intensive vegetables (for human consumption)
Indigenous
Indigenous forest and vegetation
from the analysis. Further, only sites with the same persistent land use
or ‘land-use system’ for all samplings in the period were used
(
Table 1). Thus, 23 sites were removed due to changes in the land use
system (e.g. from dairy to cropping). After removal of these sites, 281
2.3. Environmental guidelines, target ranges, and land use map
rows of data for 82 unique sites, across four soil orders
(Table 2), were
available for different soil properties.
To provide a perspective on the quality of the soil, results from the
most recent sampling were compared with relevant target ranges or
2.4.1. Statistical analysis
guideline values. Target ranges for nitrogen, phosphorus, carbon and
When measuring soil environmental properties over time, several
physical properties have been developed to balance productivity re-
factors determine the value and its change over time. First, an effect
quirements with environmental concerns for monitoring the 0–10 cm
due to the characteristics of the soil sample such as the sample depth,
soil depth, and sourced from
Hill and Sparling (2009), and
Mackay
soil order, or land use, as well as a possible effect due to the year of
et al. (2013). For trace elements, soil toxicity guideline values for the
the measurement. Second, a random effect that expresses the variability
protection of ecological receptors (
Cavanagh, 2019) were also used.
of the soil property between different sites with the same soil character-
For cadmium trigger values within the Tiered Fertiliser Management
istics (e.g. the same soil order and land use). The random effect captures
System, TFMS
(http://www.fertiliser.org.nz/Site/resources/tools.aspx),
the fact that different sites may have different levels of soil property and
which is used to manage accumulation of cadmium in productive soils
the change over time is expected to be small around the average for the
by imposing increasingly stringent fertiliser applications with increas-
site. A component of uncertainty is expected, due to measurement error
ing soil cadmium, were used.
or unrecorded variables.
3
link to page 12 link to page 13 link to page 12 link to page 4 link to page 13 link to page 13 link to page 5 link to page 13
J.J. Drewry, J.-A.E. Cavanagh, S.J. McNeill et al.
Geoderma Regional 25 (2021) e00383
Table 2
estimation of a 95% prediction interval, which is the range of values
Number of unique sites and temporal samples, per land use system, for each soil order.
into which a new observation will fall, with a certain probability
Unique sites
Soil order
(
Knowles and Frederick, 2019). Finally, we note that the analysis covers
the change in soil properties over 2000–2018, so predictions of soil
Land use system
Brown
Gley
Pallic
Recent
Total
properties before and after this period should be treated with some cau-
Dairy
3
2
6
3
14
Drystock
6
1
10
7
24
tion. Predictions would be compromised if management practices
Forestry
3
0
0
2
5
changed from those used in the analysis period, and predictions will
Horticulture
3
2
3
0
8
have increased uncertainties outside 2000–2018.
Indigenous
6
1
3
5
15
Market garden
1
2
2
6
11
Mixed cropping
0
2
2
1
5
2.4.2. Statistical model fit and outliers
Total
22
10
26
24
82
Each model was checked for conformance to the assumptions of the
Temporal samples
linear mixed effects model, such as residual-versus-fitted plots and checks
Land use system
Brown
Gley
Pallic
Recent
Total
that residuals and random effects are Gaussian distributed. Failures in any
Dairy
15
10
30
15
70
such checks would suggest problems with the form of the model. None of
Drystock
18
3
29
21
71
the diagnostic checks suggested problems in the form of the model.
Forestry
9
0
0
6
15
To examine the model
Horticulture
9
6
9
0
24
fit per indicator,
Table 3 shows R2 values for
Indigenous
12
2
6
10
30
each of the models, defined as in
Nakagawa and Schielzeth (2013).
Market garden
5
10
7
24
46
While R2 values are well-understood for linear models, there is less
Mixed cropping
0
10
10
5
25
agreement in the literature for application for the mixed effects models
Total
68
41
91
81
281
used here. The definition from
Nakagawa and Schielzeth (2013) defines
two R2 values: one (the marginal R2) gives the proportion of the vari-
ance explained by the fixed effects alone; the second (the conditional
All the observed soil properties have a lower limit of zero, and their
R2) gives the proportion of the variance explained by both the fixed
probability distributions tend to be skewed, with a variance that in-
and random effects. Table. Shows that the variance explained using
creases with the mean. For these reasons, a logarithmic transformation
the fixed effects model only is at best modest (the largest R2 value is
was applied to each soil property value to stabilise the variance, in ac-
0.57), but the variance explained by fixed and random effects is much
cordance with standard practice
(Faraway, 2006). A square-root trans-
higher (the largest value is 0.91). This suggests that adding the random
formation was found to be more suitable for macroporosity. The
effect due to the site is very important in providing a good model fit.
model for each soil property (using bulk density, ρ, as an example) was:
For Cd, 27 values were below the detection limit of the laboratory
method and these values were replaced by half of the minimum labora-
tory detection limit for the statistical analysis. If these values were
log ρi,j,k ¼ log ρ þ Li þ Sj þ Sitek þ Δit þ ϵ
discarded, then the conclusions for the temporal trends are unchanged
but the fixed effects for dairy, horticulture and market garden are signif-
where ρi, j, k is the bulk density for land use i, soil order j, and site k, log ρ
icantly different from indigenous land. This is because the greatest pro-
is the overall mean value of the log-transformed bulk density for some
portion of the replaced Cd values are in the indigenous and forestry
reference land use and soil order, Li is the change in log-transformed
systems, with 30% and 50% in each, respectively.
bulk density as a result of changing from the reference land use to land
For the Cu model, two horticulture site concentrations were highly
use class i, Sj is the change in log-transformed bulk density as a result of
influential, with estimated mean changes over time of 3.12 and
changing from the reference soil order to soil order j, while ϵ is the un-
1.03 mg kg−1 year−1 after two re-samplings, compared with the mean
certainty or error, assumed to be Gaussian distributed.
rate of change in this land use class of 0.13 mg kg−1 year−1. Similarly,
The value of Δi is the rate at which the log transformed bulk density
for the Zn model, two sites were highly influential, with apparentchanges
changes for each year, specific to each land use class i.
in concentration of between −2.4 and − 7.6 mg kg−1 year−1. For Cu
Finally, the term Sitek is the random effect associated with site k.
and Zn, these highly influential sites were removed, since they had an
No interaction was included in the model between land use and soil
unusually large effect for a relatively small number of sites.
order, since not all soil orders were sampled for each land use, although
the available soil orders were approximately balanced across each land
use class. The temporal change was limited to within each land use
3. Results
class, since each property was expected to change with respect to that
variable and not soil order. The complexity of the model was thus lim-
3.1. State and comparison with target ranges or guideline values
ited by the available data.
Using the model above, the important result from the analysis is to
Summary statistics including the current state (median) for soil
determine which of the Δ
properties (
Table 4), and a comparison with target ranges for
i is statistically significant, since this would in-
dicate that the corresponding soil property in that land use has a statis-
tically significant temporal effect.
The resultant linear mixed-effects model (
Pinheiro and Bates, 2000)
Table 3
Summary of the model fit per indicator.
was solved using maximum likelihood. Although described in terms of
bulk density, the model can be extended to any of the properties. For
Indicator
Marginal R2
Conditional R2
all properties except macroporosity, the log-transformed version of
Cd
0.26
0.78
the property was used as the response. For macroporosity, the square
Cu
0.51
0.91
root is used. For land use, indigenous land use was chosen as the refer-
Zn
0.38
0.87
ence since it can be considered a control, as management is not nor-
Macroporosity
0.36
0.54
Bulk density
0.45
0.81
mally applied to that class. For soil order, the choice is less obvious, so
AMN
0.53
0.73
Brown Soils were chosen. The model was kept the same for all proper-
TN
0.53
0.88
ties. Finally, although the model is presented in terms of the log (or
Olsen P
0.37
0.88
square root) transformed response, the estimates of soil properties
OC
0.57
0.90
were back-transformed to standard units. The predictions include the
Marginal and conditional R2 values defined as in
Nakagawa and Schielzeth (2013).
4
link to page 6 link to page 6 link to page 6 link to page 6 link to page 5 link to page 6 link to page 5 link to page 6 link to page 6 link to page 7 link to page 6 link to page 7 link to page 6 link to page 6 link to page 7 link to page 6 link to page 7 link to page 6 link to page 7 link to page 6 link to page 6 link to page 7 link to page 8 link to page 8 link to page 9 link to page 10
J.J. Drewry, J.-A.E. Cavanagh, S.J. McNeill et al.
Geoderma Regional 25 (2021) e00383
Table 4
Minimum, median and maximum for each soil indicator, for the most recent soil sampling.
Statistic
Land use
Cd
Cu
Zn
Bulk
Macroporosity
TN
AMN
OC
Olsen P
system
(mg kg−1)
(mg kg−1)
(mg kg−1)
density
(% v v−1)
(%)
(mg kg−1)
(%)
(mg kg−1)
(Mg m−3)
Minimum
Dairy
0.13
6.0
32
0.88
2.3
0.26
70
2.6
27
Drystock
0.05
4.0
28
0.81
3.1
0.31
56
3.0
9
Forestry
0.04
3.4
15
0.85
14.7
0.21
30
3.5
6
Horticulture
0.15
8.2
47
0.76
7.9
0.24
47
2.4
25
Indigenous
0.04
2.6
18
0.63
8.5
0.19
75
2.9
6
Market garden
0.09
13.1
52
1.04
9.6
0.14
14
1.3
38
Mixed
0.18
3.5
31
1.10
3.2
0.26
46
2.4
24
cropping
Median
Dairy
0.42
14.0
80
1.15
7.7
0.48
212
4.6
62
Drystock
0.18
9.0
49
1.03
11.8
0.44
121
4.8
34
Forestry
0.08
5.2
35
0.96
25.1
0.35
52
5.6
13
Horticulture
0.25
21.1
56
1.06
12.8
0.46
103
5.8
80
Indigenous
0.09
10.1
53
0.92
16.0
0.51
145
6.8
19
Market garden
0.28
24.0
92
1.31
17.0
0.19
37
2.0
159
Mixed
0.20
7.3
56
1.22
13.6
0.30
58
3.1
47
cropping
Maximum
Dairy
0.63
25.0
97
1.41
20.1
0.87
353
9.8
96
Drystock
0.50
20.0
177
1.21
19.3
0.87
222
10.6
96
Forestry
0.12
7.6
47
1.00
30.8
0.46
56
7.7
88
Horticulture
0.51
93.0
75
1.23
25.4
0.76
150
8.5
148
Indigenous
0.21
16.8
100
1.19
34.2
0.91
277
13.3
106
Market garden
0.46
98.0
112
1.42
26.0
0.37
145
4.9
219
Mixed
0.23
13.6
75
1.43
18.2
0.33
75
3.4
76
cropping
Sites used had no land use system change. Data for 82 unique sites were used as described in section 2.4.
productivity without environmental damage, or trace element toxicity
system had elevated Cd concentrations (
Table 6). For soil physical prop-
guideline values for the protection of ecological receptors
(Table 5),
erties, all non-indigenous land use systems, and Pallic and Recent Soils,
for the most recent sampling, for sites that had no change in land use
had elevated bulk density, while reduced macroporosity was observed
system during the monitoring period, are presented per land use system
for four land use systems, and Recent Soils
(Table 6,
Table 7).
in this section.
For AMN, forestry, horticulture, market garden, and mixed cropping
All land use system sites, except drystock, had Zn concentrations
land uses
(Table 6), and Pallic Soils, had lower concentrations (
Table 7).
below toxicity guidelines
(Table 5). Although one horticultural site
Four land use systems had reduced TN values compared with indige-
had Cu of 93 mg kg−1, which is just below the 100 mg kg−1 guideline,
nous land use (
Table 6), while Pallic and Recent Soils had reduced TN
other sites were well below the guideline. With the exception of two
compared with Brown Soils (
Table 7). Dairy, horticulture, and market
dairy sites (with Cd 0.6 and 0.63 mg kg−1), all sites had Cd concentra-
garden systems had elevated Olsen P concentrations
(Table 6). Com-
tions within Tier 0 of the TFMS
(Table 5).
pared with the indigenous reference, all land use systems had reduced
Most land use system sites had bulk density values within target
OC percentage
(Table 6), while Pallic and Recent Soils had lower OC per-
ranges, while all land uses had fewer sites within the macroporosity tar-
centage
(Table 7).
get range than for bulk density (
Table 5). The land use system with the
lowest compliance was dairy, where only 36% of sites were within the
3.3. Change over time
macroporosity target range, compared with 71% of drystock sites,
while median macroporosity was lowest for dairy land use
(Table 4).
This section presents the statistical modelling assessment of change
All land use system sites, except for market gardens, had AMN values
over time. A summary of the statistical modelling for the temporal
within target ranges
(Table 5). Market gardens had the lowest percent-
change Δi is presented in Fig. 2. Significant increases over time were ob-
age of sites (36%) within the target range for TN. Most non-indigenous
served for Zn in dairy, TN for drystock, and Olsen P for mixed cropping
sites were above the upper-target range for Olsen P values. Market gar-
(
Fig. 2). Significant decreases over time were observed for Cu in forestry,
den sites had very high Olsen P concentrations (
Table 4), with five sites
Cd for indigenous and forestry, and bulk density for drystock
(Fig. 2).
exceeding 150 mg kg−1. Only 21% of dairy sites were within targets for
The change in Zn per year for dairy land use was 1.4 mg kg−1 yr−1
Olsen P, with 29% of sites ≥80 mg kg−1 (double the upper-target range
(95% CI 1.1, 1.8). The mean change in Olsen P over time for the mixed
value). All mixed cropping, dairy, drystock, and forestry sites were
cropping farm system is 4.6 mg kg−1 yr−1 (95% CI 2.4, 9.3). Changes
within carbon targets
(Table 5).
over time for individual sites for each land use are also presented for
Zn (
Fig. 3) and for Olsen P
(Fig. 4). The supplementary material shows
3.2. Influence of land use and soil order
Cu and Cd changes over time, and a summary table of the statistical
modelling.
This section presents the statistical modelling assessment of the in-
fluence of land use and soil order on soil properties. A summary of the
4. Discussion
statistical modelling for the effect Li for each land use system
(
Table 6), and Sj for soil order (
Table 7) is provided. Comparisons are
4.1. Land use, soil order, and comparison with targets or guidelines
with the indigenous land use system or Brown Soil reference classes.
Cu concentrations were elevated in horticultural and market
Trace elements may accumulate in soils through intentional or unin-
gardens sites (
Table 6), and Recent Soils
(Table 7). The dairy land use
tentional application of agrichemicals. Nationally and internationally, it
5
link to page 12 link to page 12 link to page 12 link to page 12 link to page 12 link to page 13 link to page 13 link to page 13 link to page 13 link to page 11 link to page 13 link to page 12 link to page 12 link to page 11 link to page 13 link to page 13 link to page 12 link to page 12 link to page 12 link to page 13 link to page 12 link to page 13 link to page 13 link to page 12 link to page 12 link to page 12 link to page 12 link to page 12 link to page 12 link to page 12 link to page 12 link to page 6 link to page 6
J.J. Drewry, J.-A.E. Cavanagh, S.J. McNeill et al.
Geoderma Regional 25 (2021) e00383
Table 5
Target range or guideline value for individual soil properties, and percentage of sites within target range or below guideline value, for the most recent sampling of each site. Sites with no
land use system change were used.
Indicator
Unit
Land use system
Reference
Cropping
Pasture
Forestry
Horticulture
Market garden
Target range
Bulk density
(Mg m−3)
Pallic and Recent Soils (0.4–1.4), other soils (0.7–1.4)
1
Macroporosity
(% v v−1)
10–30
10–30
8–30
10–30
10–30
2
AMN
(mg kg−1)
>20
>50
>20
>20
>20 A
1
TN
(%)
0.25–0.7
0.25–0.7
0.1–0.7
0.25–0.7
0.25–0.7
1
Olsen P B
(mg kg−1)
20–40
20–40C
5–30
20–40
20–40C
2
OC
(%)
Recent Soils (>2), other soils (>2.5)
1
Guideline values
Cd
Tier 0 up to 0.6 mg kg−1, and Tier 1 up to 1.0 mg kg−1
3
Cu
100 mg kg−1
4
Zn
170 mg kg−1
4
Sites within target range (%)
Cropping
Dairy
Drystock
Forestry
Horticulture
Market garden
Bulk density
80
93
100
100
100
91
Macroporosity
60
36
71
80
63
82
AMN
100
100
100
100
100
82
TN
100
71
88
100
75
36
Olsen P
40
21
29
80
38
18
Carbon
100
100
100
100
88
45
Sites below guideline (%)
Cd
100
86
100
100
100
100
Cu
100
100
100
100
100
100
Zn
100
100
96
100
100
100
Pasture target includes dairy and drystock. Macroporosity at −10 kPa. A included as cropping. B Units were not clearly identified in
Mackay et al. (2013), but
Hill and Sparling (2009) state
mg kg−1 should be used so mg kg−1 are the units used from our analysis and measurement. C Hill country Olsen P target value is 15–20, with same comments as in note C; three sites in this
analysis classed as hill country. References: 1,
Hill and Sparling (2009); 2,
Mackay et al. (2013); 3,
MAF (2011); 4,
Cavanagh (2019), 95% protection level for ecological receptors.
is commonly reported that orchards and vineyards typically have higher
than other P fertilisers used in market gardening for example, and appli-
levels of trace elements due to use of fungicides containing Cu, than
cation history. Additionally, older superphosphate fertiliser had higher
other land uses (
Gaw et al., 2006; Komarek et al., 2009; Marzaioli
cadmium concentrations
(Roberts et al., 1994). The increased Cd concen-
et al., 2010; Duplay et al., 2014). In the Wellington region, no horticul-
tration in the dairy land use agrees with results reported by
Cavanagh
tural sites exceeded the 100 mg kg−1 maximum guideline for Cu
(2014) and
Abraham (2018). However,
Taylor et al. (2010) also reported
(though one orchard approached that value), and most horticultural
greater Cd concentrations in horticultural soils than other land uses, in-
sites were below 25 mg kg−1. For comparison, a quarter of horticultural
cluding dairy.
sites in the Waikato region of New Zealand exceeded the 100 mg kg−1
The greaterbulk density in non-indigenous land use systemsis consis-
Cu guideline
(Taylor et al., 2010), and this may be due to a longer period
tent with other studies (
Taylor et al., 2010;
Curran-Cournane, 2015) and
of more than 80 years in horticulture, compared to our study. The cli-
is likely to be attributable to compaction of soil from vehicles and animal
mate in the Wellington region is cooler and drier than in Waikato,
grazing (
Drewry et al., 2008; Houlbrooke et al., 2011). Our study shows
which may not favour fungus growth as much as other regions, thus re-
soil compaction is common in the dairy land use, a similar finding identi-
quiring less control. Zn concentrations in soils of the Wellington region
fiedinotherstudies
(Tayloretal.,2010;Curran-Cournane,2015;
Ministry
are considered typical of values published for other regions
(Taylor
for the Environment and Stats NZ, 2018), but contrasts results of
Clark
et al., 2011; Taylor, 2016), and New Zealand pastures
(Alloway, 2008).
et al. (2007), who reported most dairy sites had macroporosity values
Cadmium is a recognised contaminant of many phosphate fertilisers,
within the target range used in their study (8–20%).
and the elevated Cd in dairy land in our study likely reflectsboth theuseof
Several land use systems had lower AMN concentrations and TN
superphosphate fertiliser, which typically has higher Cd concentrations
than indigenous vegetation. However, typically there is greater soil
Table 6
Estimated regression parameters for land use system with respect to the reference (indigenous). The values for each land use system are the change in the transformed response as the
land use system changes from the reference, and where significant are shown by (*).
Response
Sigma1
Intercept2
Change for land use system from intercept
Drystock
Dairy
Forestry
Horticulture
Market garden
Mixed cropping
Log (Cu)
0.209
2.21
−0.102
+0.159
−0.444
+0.751 (*)
+0.971 (*)
−0.364
Log (Zn)
0.140
3.991
−0.136
+0.0247
−0.454 (*)
+0.131
+0.206
−0.179
Log (Cd)
0.302
−1.602
−0.0248
+0.753 (*)
+0.0251
+0.310
+0.162
−0.00304
Log (Bulk density)
0.0833
−0.1987
+0.22 (*)
+0.203 (*)
+0.164 (*)
+0.202 (*)
+0.335 (*)
+0.419 (*)
Sqrt (Macroporosity)
0.711
4.617
−1.02 (*)
−1.62 (*)
+0.0922
−0.770 (*)
−0.432
−1.480 (*)
Log (AMN)
0.351
5.085
−0.147
+0.0157
−0.952 (*)
−0.356 (*)
−1.29 (*)
−0.735 (*)
Log (TN)
0.173
−0.4713
−0.252 (*)
−0.103
−0.427 (*)
−0.174
−0.931 (*)
−0.688 (*)
Log (Olsen P)
0.346
2.971
+0.0199
+0.73 (*)
−0.466
+1.05 (*)
+1.36 (*)
−0.0212
Log (OC)
0.168
2.192
−0.379 (*)
−0.332 (*)
−0.315 (*)
−0.358 (*)
−1.06 (*)
−0.873 (*)
1 The sigma is the residual standard error of the residuals.
2 The intercept is the estimated mean for the indigenous land use system class with Brown Soil order.
6
link to page 12 link to page 13 link to page 12 link to page 12 link to page 12 link to page 12 link to page 13 link to page 13 link to page 12 link to page 13 link to page 12 link to page 13 link to page 13 link to page 13 link to page 12 link to page 13 link to page 13 link to page 12 link to page 11 link to page 12 link to page 13 link to page 13 link to page 13 link to page 12 link to page 13 link to page 13 link to page 12 link to page 12 link to page 12 link to page 12 link to page 13 link to page 12 link to page 13 link to page 12 link to page 12 link to page 13 link to page 12 link to page 12 link to page 12 link to page 12 link to page 12 link to page 12 link to page 12 link to page 12 link to page 12 link to page 13 link to page 12 link to page 13 link to page 12 link to page 12 link to page 13 link to page 12 link to page 13 link to page 12 link to page 13 link to page 12 link to page 12 link to page 13 link to page 13 link to page 12 link to page 12 link to page 13 link to page 12 link to page 12 link to page 12 link to page 7 link to page 7
J.J. Drewry, J.-A.E. Cavanagh, S.J. McNeill et al.
Geoderma Regional 25 (2021) e00383
Table 7
Many monitoring studies typically have focused on land use. Our
Estimated regression parameters for soil order with respect to the reference class (Brown
study was predominantly focussed on land use, but also included soil
Soils). The values for each soil order are the change in the transformed response as the soil
order. For example, Pallic and Recent Soils had greater bulk density
order changes from the reference, and where significant are shown by (*).
than Brown Soils. Brown Soils have also been shown to be generally
Response
Sigma
1 Intercept
2
Change for soil order from intercept
well structured, and therefore be naturally more resilient to soil physical
Gley
Pallic
Recent
damage than Pallic Soils
(Greenwood and McNamara, 1992;
Hewitt and
Shepherd, 1997; Drewry et al., 2000). Pallic Soils had greater bulk den-
Log (Cu)
0.209
2.21
+0.257
−0.0748
+0.44 (*)
Log (Zn)
0.14
3.991
+0.248
−0.0307
+0.336
sities than Brown Soils, irrespective of land use in our study, with similar
(*)
(*)
conclusions elsewhere
(McIntosh et al., 1997; Drewry et al., 2000). The
Log (Cd)
0.302
−1.602
+0.0714
−0.0505
−0.103
higher OC observed in Brown Soils is suggested to partly arise from their
Log (Bulk density)
0.0833
−0.1987
+0.0169
+0.0938
+0.158
formation in higher rainfall areas
(McIntosh et al., 1997;
Hewitt, 2013),
(*)
(*)
(*)
and contributes to their relative structural stability. Recent Soils are typ-
Sqrt
0.711
4.617 (*)
−0.427
−0.317
−0.405
(Macroporosity)
(*)
ically young weakly weathered soils which have had less time to accu-
Log (AMN)
0.351
5.085 (*)
−0.0929
−0.201 (*) −0.192
mulate organic matter, and contain lower OC and TN compared with
Log (TN)
0.173
−0.4713
−0.0926
−0.198 (*) −0.376
other soil orders
(Curran-Cournane et al., 2013). Studies have also re-
(*)
(*)
ported OC content is typically an inherent soil property, for well-
Log (Olsen P)
0.346
2.971
+0.245
+0.115
+0.267
Log (OC)
0.168
2.192 (*)
−0.150
−0.250 (*) −0.458
developed soils, explained more by soil order rather than by land use
(*)
(e.g.
Sparling and Schipper, 2002; Cotching and Kidd, 2010), and there-
1 The sigma is the residual standard error of the residuals.
fore related to inherent (pedological) soil properties, e.g. specific surface
2 The intercept is the estimated mean for the indigenous land use system class with
area
(McNally et al., 2017;
Kirschbaum et al., 2020). In contrast, how-
Brown Soil order.
ever, OC content can also be modified by land use and management,
e.g. depleted by cultivation. Our study showed Brown Soils had greater
TN than the other soils. Similarly, Brown Soils had greater TN content
than Pallic and other soils elsewhere (
McIntosh et al., 1997; Curran-
AMN and TN in pasture compared with cultivated soils, e.g. market gar-
Cournane et al., 2013), but in contrast to OC,
Sparling and Schipper
dens, as pastoral soils have urine and dung-N input. AMN and TN can
(2002) reported that land use had the same effect on TN as soil order.
also decrease in cultivated soils, relative to pasture, as higher frequency
of cultivation can be associated with reduced levels of soil carbon
4.2. Change over time
(
Curtin and McCallum, 2004;
Sparling and Schipper, 2004; Marzaioli
et al., 2010; Curtin et al., 2017; Bai et al., 2018). We had a similar finding
Monitoring the change of soil properties over time can be useful to
in our study. However, as noted by
Powlson et al. (2014), many studies
help assess the impacts of different land management practices, or
also show the additional carbon due to no-till practices is relatively
whether they are needed. For change over time, multiple samplings
small.
Stevenson et al. (2015) reported that land use classes do not al-
are more robust than only two samplings. In analysis of multiple sam-
ways have well-defined ‘boundaries’ due to a range of land (and possi-
plings of the same site, as in our study, site conditions (e.g. soil) do
bly N) management practices associated within land uses. Similarly,
not change, or are chosen so that changes are unlikely, or are minimal
pastoral and cropping land uses have been shown to have high variabil-
(e.g. land use system as in our analysis). The changes in soil properties
ity in AMN and TN
(Curtin and McCallum, 2004; Taylor et al., 2010;
at a site are therefore less likely to be the result of variations in site con-
Curtin et al., 2017).
ditions or management. Multiple samplings are preferred over a single
All land use systems in our study had lower OC content than indigenous
repeated measurement because there is a chance that a single detected
vegetation, a similar observation reported in other studies
(McIntosh et al.,
change is due to random variation, which is less likely when significant
1997; Taylor et al., 2010; Curran-Cournane, 2015). Similarly,
Sparling and
change is detected using additional samplings. Despite this, very few
Schipper (2004) reported OC was the lowest for cropping and tussock
soil quality monitoring programmes internationally have had more
grassland than in other land uses, at 0–10 cm depth. Soil OC typically de-
than a one-off sampling (
Arrouays et al., 2012; Bünemann et al., 2018;
creaseswithlanduseintensification,suchasincreasedfrequencyofcultiva-
Smith et al., 2020), from the same sites for multiple land uses, e.g. the
tion (
Marzaioli et al., 2010;
Akinsete and Nortcliff, 2014; Curtin et al., 2017;
study of
Curran-Cournane (2015) had two samplings per land use,
McNally et al., 2017;
Schipper et al., 2017). However, carbon stocks to 30 cm
while grassland sites were sampled five times and in a soil carbon
depth were reported by
Ministry for the Environment (2010) to be greatest
study
(Kühnel et al., 2019). In a study of environmental trace elements
in pastoral land. Therefore, OC levels vary considerably, spatially and with
in Swiss soils,
Desaules et al. (2010) recommended improving measure-
management practices and depth, even within land uses such as grazed
ment quality and increasing frequency of sampling to detect reliable
pasture
(Curtin et al., 2017; Mudge et al., 2017; Whitehead et al., 2018).
trends.
Grazed dairy pastures are typically reported to be within OC target ranges
With the exception of one land use for Zn and Cu, and two for Cd,
(e.g.
Clark et al., 2007; Curran-Cournane, 2015), including OC targets deter-
there was an absence of significant changes over time for these trace el-
mined by
Hill and Sparling (2009) based on development of production
ements in the other land use systems. The absence of a statistically sig-
and environmental response functions for New Zealand soil quality indica-
nificant change over time is not necessarily bad, as it depends on
tors
(Lilburne et al., 2004; Sparling et al., 2008).
reasons for the absence, e.g. a stable situation, as long as there are
In our study Olsen P in many non-indigenous sites exceeded the
enough monitoring sites to detect change. Where a significant trend is
upper target value, suggesting P concentrations are above agronomic
found, the importance depends on the direction. When a trend is de-
requirements, as also observed elsewhere (
Cotching and Kidd, 2010;
tected what is important is whether the magnitude of the trend is actu-
Taylor et al., 2010; Curran-Cournane, 2015;
Gourley et al., 2015;
ally meaningful from an environmental or a production perspective, and
Ministry for the Environment and Stats NZ, 2018). High P concentra-
its relativity to guideline values. The observed increase in Zn in dairy
tions pose a risk to water quality at some sites (
Burkitt et al., 2010;
land use suggests ongoing accumulation in soil Zn. The change in Zn
Curran-Cournane et al., 2011; Hart and Cornish, 2016). However,
per year was equivalent to mean change of 4.2 mg kg−1 over the
Olsen P concentrations range widely between sites as shown by
Clark
3-year sampling period, and shows that the statistical analysis is sensi-
et al. (2007), but in contrast to our study, they had dairy site median
tive. In practice, this increase would largely fall within the sampling and
values within agronomic targets for three of five catchments.
analytical variability, although over 20 years it suggests a mean increase
7
link to page 13 link to page 12 link to page 12 link to page 12 link to page 11 link to page 12 link to page 12 link to page 12 link to page 12 link to page 12 link to page 12 link to page 12 link to page 13
J.J. Drewry, J.-A.E. Cavanagh, S.J. McNeill et al.
Geoderma Regional 25 (2021) e00383
Fig. 2. Rate of change in transformed soil properties over time (units year−1) for each land use system class. The filled circles give the mean estimate of the rate of change for that land use
system, while the error bars indicate the 95% confidence interval for the estimate. Note that all but one property uses a log transformation as the response while a square-root
transformation is used for macroporosity.
of 28 mg kg−1. The accumulation could be attributable to use of animal
significant trend with few samples is less powerful, since there is a
health products for facial eczema treatment (
Taylor et al., 2010). Contin-
greater risk that replacing one of the measurements could change the
ued accumulation of Zn has potential negative impacts on soil quality if
significance compared with a larger dataset.
concentrations increase beyond what was observed in this study, such
Although there was a reasonable model fit for bulk density, and no
as Zn toxicity to soil microbial function and plants, induced copper defi-
change over time for other land use systems, the improvement (reduc-
ciency, and antibiotic resistance in soil bacteria
(Kim and Taylor, 2017;
tion) in bulk density over time for drystock systems should be treated
Heydari, 2020).
with caution, for the reasons described previously. Soil physical proper-
Cavanagh (2014) and
Abraham (2018) reported no clear trends in
ties, including bulk density, are reported to improve after summer dry-
soil Cd concentration over time for land uses monitored by regional au-
ing (
Drewry et al., 2004b). Although
Curran-Cournane et al. (2013)
thorities and fertiliser companies in New Zealand. Evidence of trends in
reported they could not rule out climate variability for their samplings
soil Cd varies, with indications of a plateau and levelling for Cd concen-
as a possible causal factor of change, a seasonal factor is an unlikely ex-
trations at a long-term sheep-grazed trial site
(McDowell, 2012), in con-
planation for the bulk density change in our study, as mean soil mois-
trast to a recent study at that site that showed Cd concentrations
ture between our samplings was similar in the drystock system. In
continuing to increase over time
(Gray et al., 2017). While the model-
contrast to other studies (e.g.
Curran-Cournane et al., 2013; Curran-
ling fit was good for the Cd and Cu changes over time in the forestry
Cournane, 2015; Taylor et al., 2017), our study did not detect significant
sites, this should be treated with caution as only five sites were moni-
changes in macroporosity over time for any land use, but the model fit
tored. Further sites would give more confidence in this result, as a
as assessed by conditional R2 was the lowest of all our models. Other
8
link to page 12 link to page 13 link to page 13 link to page 13 link to page 13 link to page 13 link to page 12 link to page 12 link to page 12 link to page 13 link to page 13 link to page 13 link to page 13 link to page 12 link to page 12 link to page 13 link to page 13 link to page 12 link to page 12 link to page 12 link to page 13 link to page 13 link to page 13 link to page 13 link to page 13 link to page 12 link to page 12
J.J. Drewry, J.-A.E. Cavanagh, S.J. McNeill et al.
Geoderma Regional 25 (2021) e00383
Indigenous
Drystock
Dairy
200
100
50
20
Forestry
Horticulture
Market garden
200
100
tion (mg/kg)
a
50
20
Zn concentr
Mixed cropping
2000
2005
2010
2015
2000
2005
2010
2015
200
100
50
20
2000
2005
2010
2015
Year of sampling
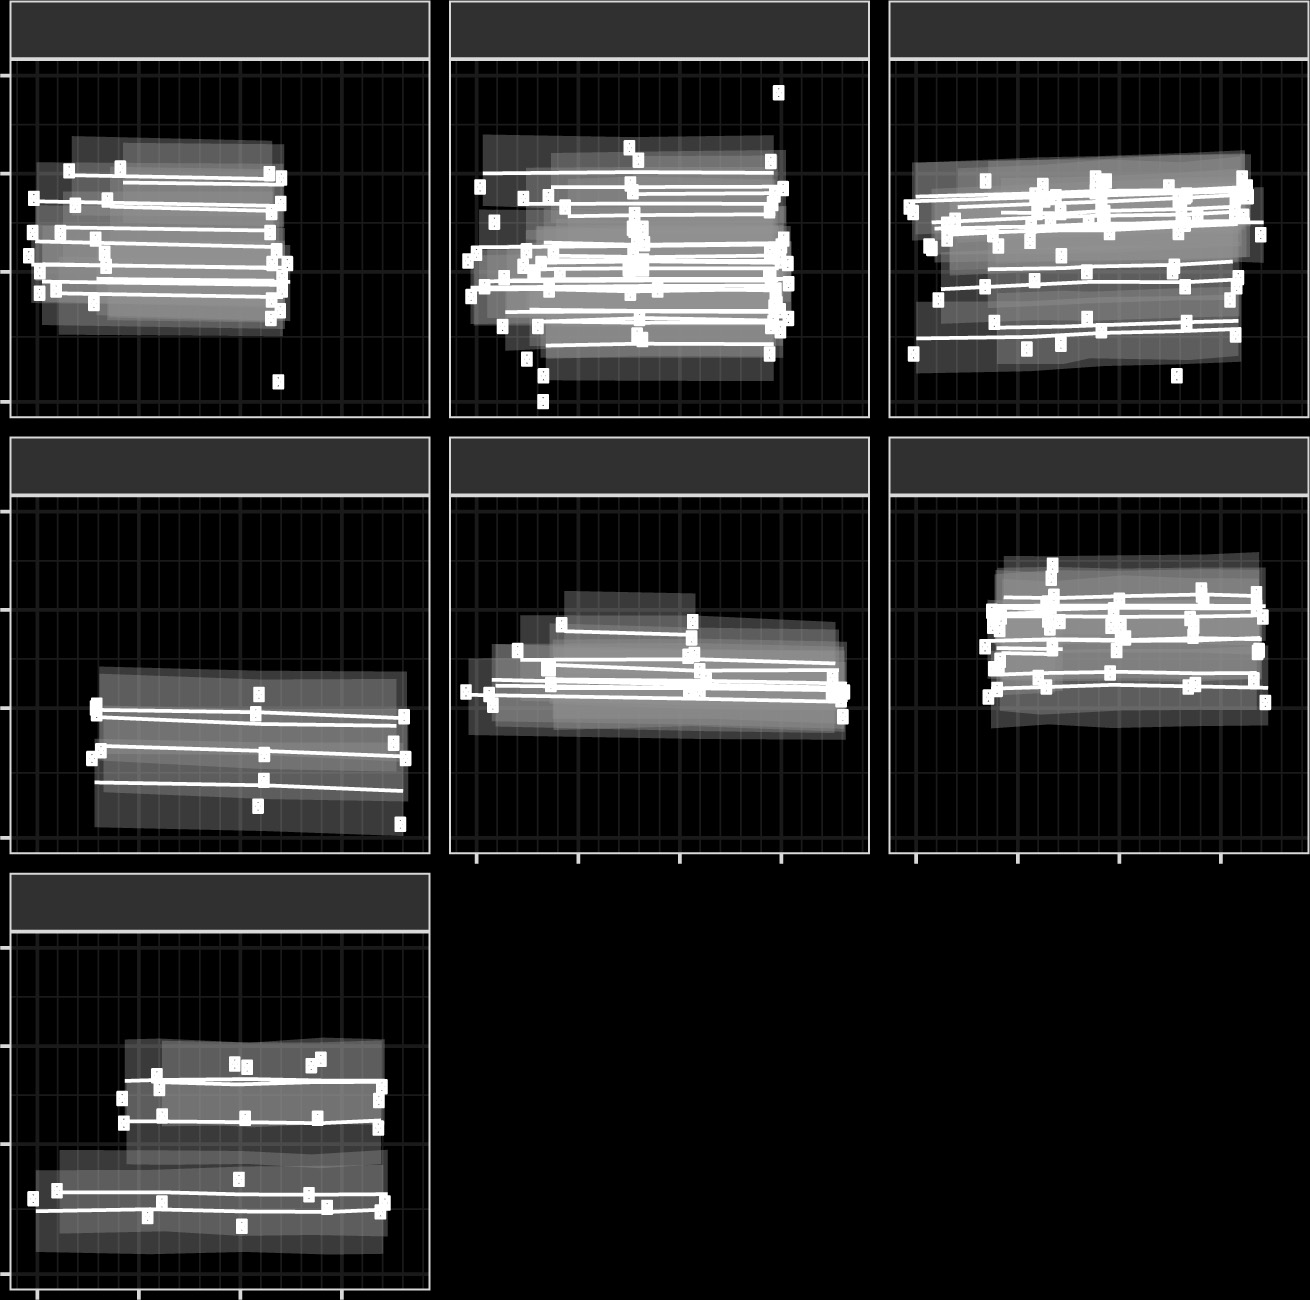
Fig. 3. Temporal predictions from the log-transformed Zn concentration model, grouped by land use system. Points indicate field data and lines indicate mean predictions for a specific site.
Unfilled points are outlier Zn values not used in the model. The shaded region is plus-or-minus one standard deviation from the mean prediction for a given site. Note that the values on the
vertical axes are back-transformed values in mg kg−1 on a log scale axis.
studies reported significant changes in macroporosity over time, and
national trends in nutrient mangement and environmental impact
therefore found this property to be a useful indicator of change over
remains a challenge.
time, particularly over the 0–10 cm depth (
Drewry et al., 2004b;
Monaghan et al., 2005;
Taylor et al., 2017), but these studies had
4.3. Implications for regional and national soil quality monitoring
much more frequent samplings (2–4 times per year for up to four
programmes
years) than those in our study.
Soil Olsen P is commonly measured by agronomic advisors and
Soil quality monitoring programmes are science-based soil manage-
fertiliser representatives as the basis for fertiliser application recom-
ment tools to assess soil ecosystem health (
Curran-Cournane, 2015), to
mendations in pasture (0–7.5 cm depth) and cropping (0–15 cm). As
provide an early warning of change
(Desaules et al., 2010;
Taylor et al.,
such, whether there is a change over time in Olsen P depends on the ex-
2010), and detect adverse changes (
Arrouays et al., 2012). They are
tent to which farmers actively manage fertiliser application based on
intended to inform land managers (and regulators) about the changing
this soil property. The observed increase in Olsen P concentrations in
state of the environment
(Desaules et al., 2010;
Bünemann et al., 2018),
mixed cropping system over time suggests growers are not managing
and inform resource management policy (e.g.
Waikato Regional
fertiliser application based on this property and crop requirements
Council, 2016). In New Zealand, national reporting on soil quality occurs
and are applying P fertiliser beyond agronomic need.
Parfitt et al.
every three years (
Ministry for the Environment and Stats NZ, 2018),
(2014) reported significant increases in P fertility on flat land for dairy
but regional scale data are not available in all regions, and their data re-
and drystock. More recently,
McDowell et al. (2019) also identified sig-
quire development to enable national consistency to ensure they are re-
nificant increases in soil Olsen P concentrations (0.08 to 1.15 mg P
liable and have sound statistical methodology to meet government
L−1 yr−1) over 2002–2014, across New Zealand. Different studies have
statistical criteria
(Statistics New Zealand, 2007; PCE, 2019).
suggested different factors may influence fertiliser application, but re-
Of particular importance in soil quality monitoring programmes is
search is needed on farmer soil testing and nutrient management
the ability to detect change over relevant temporal and spatial scales,
decision-making processes (e.g.
Daxini et al., 2018;
Lobry de Bruyn,
i.e. with adequate precision and statistical power from programme
2019). Taylor et al. (2017) suggested P application was also influenced
designs
(Arrouays et al., 2012). The absence of a statistically significant
by commodity prices, while
Parfitt et al. (2012) suggested economic re-
change over time may indicate stable conditions if sample size is
turn, drought, and the use of nutrient budgeting influenced changes in
sufficient. The sample size requirements for soil quality at a national
farm N fertiliser use during 1990–2010. However,
McDowell et al.
level analysed by
Hill et al. (2003), provides some guidance, with a
(2019) suggested that isolating probable causes for regional and
sample size per land use recommended to be >30 samples per region
9
link to page 12 link to page 3 link to page 13 link to page 13 link to page 12 link to page 12 link to page 13 link to page 13 link to page 13 link to page 13 link to page 13 link to page 13 link to page 12 link to page 12 link to page 13 link to page 13
J.J. Drewry, J.-A.E. Cavanagh, S.J. McNeill et al.
Geoderma Regional 25 (2021) e00383
Indigenous
Drystock
Dairy
300
100
30
10
3
Forestry
Horticulture
Market garden
300
, mg/kg)
ic 100
30
vimetr
a
10
3
Olsen P (gr
Mixed cropping
2000
2005
2010
2015
2000
2005
2010
2015
300
100
30
10
3
2000
2005
2010
2015
Year of sampling
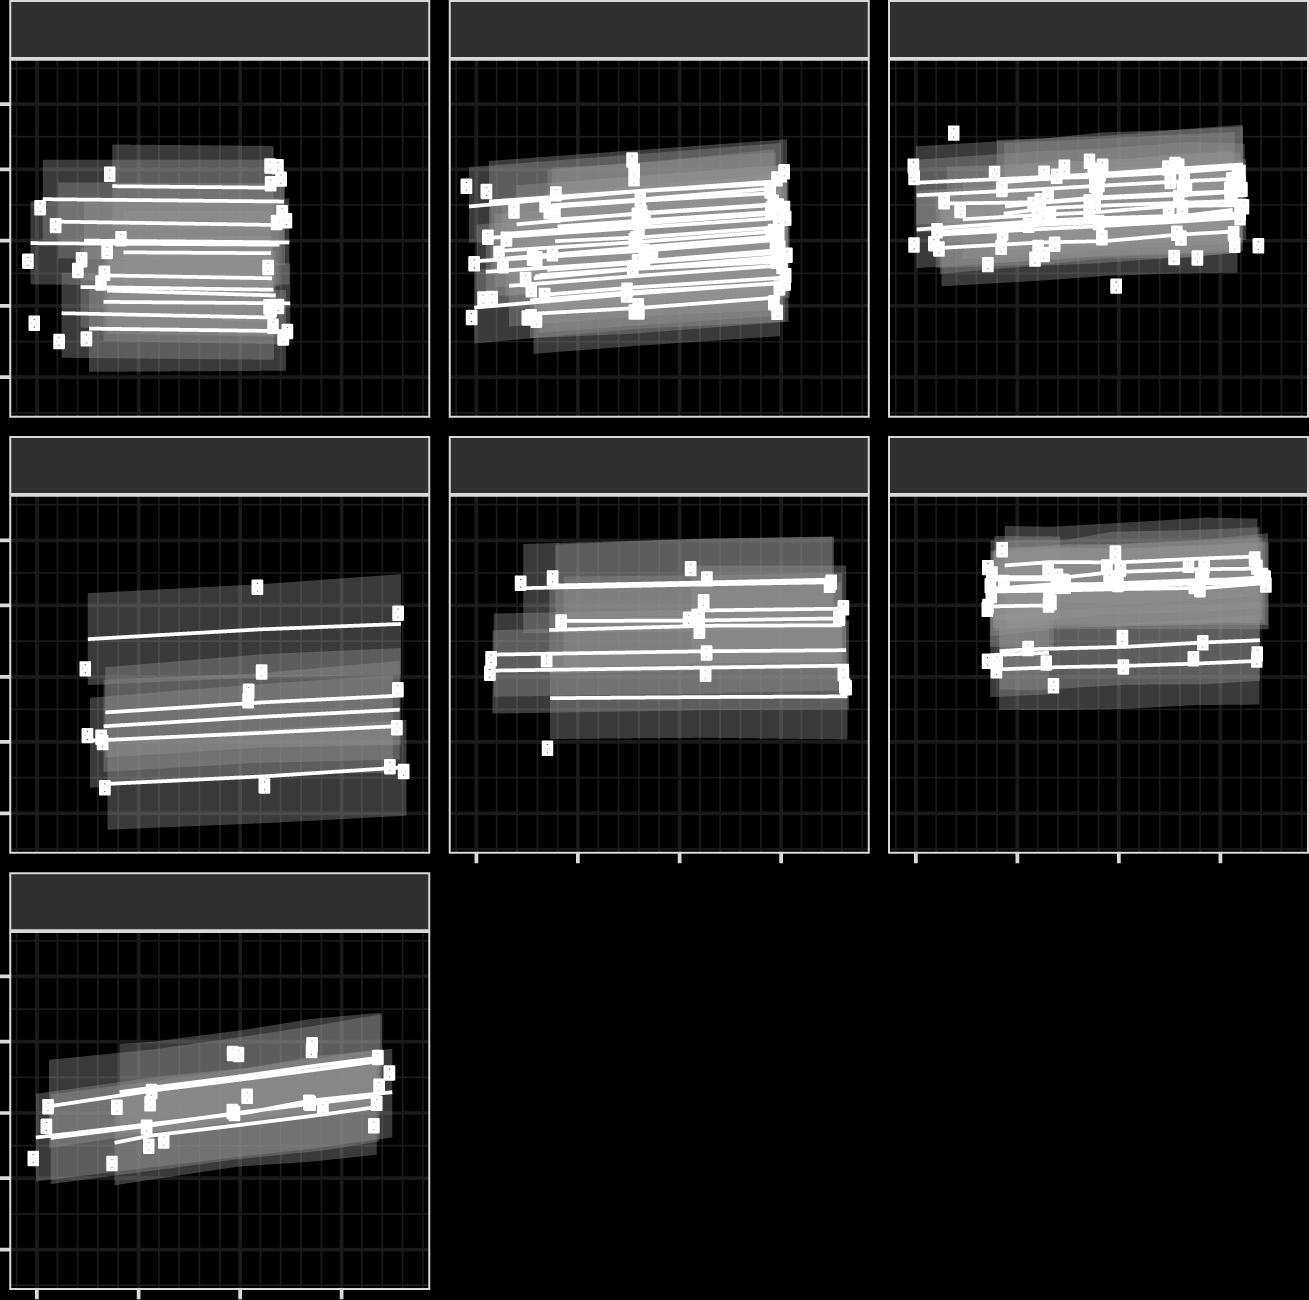
Fig. 4. Temporal predictions from the log-transformed Olsen-P model, grouped by land use system. Points indicate field data and lines indicate mean predictions for a specific site. Unfilled
points are outlier Olsen-P values not used in the model. The shaded region is plus-or-minus one standard deviation from the mean prediction for a given site. Note that the values on the
vertical axes are back-transformed values in mg kg−1 on a log scale axis.
(
Hill and Sparling, 2009), but other factors and environmental complex-
regional or national programmes. It may also be useful to consider
ity should also be considered. Increasing the number of forestry and
future monitoring an additional depth such as to 30 cm, as there is typ-
mixed cropping sites in the Wellington region would provide more rep-
ically more variance in surface soil layers than at depth. It is important
resentative and robust sampling and increase future ability to detect
to report soil properties, particularly OC (e.g.
Ministry for the
significant changes, as low numbers of sites provides less confidence
Environment, 2010;
Smith et al., 2020) and TN to greater depths than
that any change is robust and real, or the absence of change is not just
10 cm, to understand more fully the environmental impacts as well as
an artefact of data variability. However, change over time at regional
agronomic benefits. Soil carbon stocks, for example, are also generally
scale has not been evaluated in detail in those studies, so our study pro-
evaluated to 30 cm or deeper (
McNeill et al., 2014), and a minimum of
vides this knowledge.
30 cm was recommended for evaluating changes in carbon content
The apparent clustering of monitoring sites (
Fig. 1) largely reflects
(
Smith et al., 2020). A future challenge will be effects of climate change,
the distribution of intensive farming, i.e. dairy and mixed cropping, as
so an additional depth could be considered to provide more robust data
the original study design had its focus on risk to the environment
to evaluate its effects on soil quality, especially carbon. The monitoring
from land use intensification (
Sparling and Schipper, 2002). Drystock
programme has contributed to samples for a recent, separate study
systems in hill country are less intensive. However, eastern hill country
evaluating soil bacterial communities and soil quality using gene se-
drystock sites are spatially under-represented as the remaining
quencing (
Hermans et al., 2020), so consideration of this biological in-
drystock sites are mainly on flat land. Similarly, forestry sites are also
formation should be included in future.
under-represented in the eastern region. Detecting change over time
Even the definitions of land use class or system, and definitions in
has been challenging in this regional programme, due to varying sam-
spatial data (e.g.
Cavanagh et al., 2017) should be considered for consis-
pling frequency, low site numbers for two land uses, and high site vari-
tency when aggregating regions to a national scale. In our study, we
ability, but the repeat samplings and our analysis methods have helped.
considered market gardens to be a separate land use to mixed cropping
Other considerations include representativeness of spatial coverage and
because different processes occur, e.g. biannual versus much less fre-
variability of soil quality indicators which our study provides over an ex-
quent cultivation, respectively, so we gained knowledge for each of
tended period. These issues should be considered in any review of the
these systems. In contrast, other studies have typically aggregated
programme. Similarly, other issues such as improved harmonisation of
some land uses, e.g. cropping, market gardens, and horticulture aggre-
a range of indicators and methods from individual programmes, across
gated into a single class (e.g.
Ministry for the Environment and Stats
administrative boundaries (e.g.
Morvan et al., 2008;
Arrouays et al.,
NZ, 2018). However, our decision has a trade-off, namely generating
2012; Smith et al., 2020), should be considered when aggregating
knowledge on separate land uses, but compromises site numbers.
10
link to page 12 link to page 13 link to page 12 link to page 12
J.J. Drewry, J.-A.E. Cavanagh, S.J. McNeill et al.
Geoderma Regional 25 (2021) e00383
There are trade-offs between additional sites and ability of soil monitor-
bulk density and Olsen P concentrations. Pallic and Recent Soils had
ing programmes to detect meaningful, but also statistically significant
elevated bulk density, lower OC percentage compared with Brown Soils.
differences. The trade-off includes additional expense incurred for sam-
Across all samplings over the 19 years, significant increases over
pling and analysis. There are also trade-offs in monitoring programme
time were observed for Zn in dairy, TN for drystock, and Olsen P for
designs, e.g. when resampling sites, knowledge of temporal variation
mixed cropping land use systems. Significant decreases over time
is gained, but if more sites were sampled or locations changed, then spa-
were observed for Cu in forestry, Cd for indigenous and forestry, and
tial resolution would improve
(Arrouays et al., 2012). In our study, the
bulk density for drystock. No changes over time were detected for
sampling interval for intensive land use systems is frequent (3-yearly),
macroporosity, AMN, or organic carbon, for the 0–10 cm soil depth.
compared with other soil quality monitoring programmes internation-
The absence of a statistically significant change over time is not neces-
ally, and as discussed, frequent sampling has major benefits for detect-
sarily bad, as it depends on reasons for the absence.
ing statistically significant trends. A key requirement is to have enough
This study shows the monitoring programme and our analysis of
sampling sites so that changes in soil properties (if any) could be de-
multiple samplings are valuable for detecting significant trends as an
tected when sampled with the current frequency. Since temporal
early warning, e.g. Zn and Olsen P changes. The study provides evidence
changes in a key set of soil quality properties in New Zealand land use
and discussion for additional site numbers where they are low, and in-
systems have not been well documented, our study provides some in-
creased sampling frequency to ensure robust statistical analysis, as
formation to estimate what changes could be detected under the
low numbers of sites provides less confidence that any change is real.
same, or an expanded, setting. Since our study was concentrated on a
This study included only sites where land use systems did not change,
single region, to provide additional sites per land use and soil, the next
providing a sound basis for detecting change over time, and for
step would be to combine data from other regions for a comprehensive
informing regional resource management policy, land management
analysis, to provide additional evidence for decision-makers, and firm
and environmental decision-making. We recommend this programme
guidance for future sampling.
continues, because despite the value of long-term soil quality monitor-
There are very few soil quality monitoring programmes internation-
ing that we have shown in this study, very few programmes interna-
ally that have had more than a one-off sampling
(Saby et al., 2008;
tionally have endured over the long term. To ensure future knowledge
Arrouays et al., 2012). The soil quality monitoring programme in Al-
needs are able to be met by the programme, we also recommend con-
berta, for example, had four of the 23 national sites, but ceased when
sideration of additional sites, potentially an additional sampling depth
funding ended following the 10-year resampling of the sites in 2002/
especially for improved integration with other new programmes in
2003 (
Government of Alberta, 2020). That programme had been re-
New Zealand, such as carbon monitoring. This study adds significantly
sampled at 5 and 10 years only. Our study shows the Wellington region
to our knowledge on soil quality.
monitoring programme and its statistical analysis of multiple samplings
are valuable for detection of significant trends over time as an early
Declaration of Competing Interest
warning, e.g. Zn and Olsen P changes, and comparison with targets
and guidelines. Our study provides evidence to show that future moni-
The authors declare that they have no known competing financial
toring should consider additional site numbers where they are low, and
interests or personal relationships that could have appeared to influ-
increased sampling frequency to ensure robust statistical analyses can
ence the work reported in this paper.
be conducted. The potential for influential points (e.g. as seen in
changes of Cu concentration) suggest that maintaining consistent stan-
Acknowledgements
dards of site measurement and laboratory analysis is needed across time
and between regions for a national monitoring programme to provide
Thanks to the farmers and landowners for their participation and ac-
reliable information on soil quality.
cess to monitoring sites, GWRC staff who supported the programme and
Finally, our analysis included only the sites where land use systems
assisted with sampling, and staff at the Manaaki Whenua – Landcare Re-
did not change during the monitoring period, hence it provided a robust
search environmental chemistry and soil physics laboratories. Thanks to
basis for detecting change over time. These learnings and methods
the Land Monitoring Forum, and others for initiatives to develop re-
could be applied to other programmes internationally. Despite the
gional monitoring programmes. Thanks to Carolyn Hedley and Thomas
value of long-term soil quality monitoring that we have shown in this
Caspari for comments that improved the manuscript, Anne Austin for
study, very few programmes have endured long-term internationally,
editorial assistance, and John Gibson of GWRC for the regional land
so this study adds significantly to the knowledge on soil quality for
use map. The monitoring programme was funded by GWRC. This study
informing robust policy, resource, and environmental decision-making.
was funded by the Manaaki Whenua – Landcare Research led research
programme, ‘Soil health and resilience: oneone ora, tangata ora’, funded
5. Conclusions
by the New Zealand Ministry of Business, Innovation and Employment
(contract C09X1613), with co-funding from GWRC.
Very few soil quality monitoringstudies internationally have reported
on multiple samplings over the long-term, whereas our study reports five
Appendix A. Supplementary data
re-samplings. For the most recent sampling per land use for the
Wellington region programme, all land use system sites, except drystock,
Supplementary data to this article can be found online at
https://doi.
had Zn concentrations below ecological toxicity guidelines, while most
org/10.1016/j.geodrs.2021.e00383.
sites had Cd and Cu concentrations below these guidelines. Dairy and
market garden land use systems had low percentages of sites within the
Olsen P target range, indicating concentrations at some sites were
References
above agronomic needs, and of potential environmental risk. Dairy land
use systems had a low percentage of sites within themacroporosity target
Abraham, E., 2018.
Cadmium in New Zealand agricultural soils. N. Z. J. Agric.Res. 63,
202–219.
range, indicating soil compaction. Soil compaction has been associated
Akinsete, S.J., Nortcliff, S., 2014.
Storage of total and labile soil carbon fractions under dif-
with reduced pasture yield and increased environmental risk of surface
ferent land-use types: A laboratory incubation study. In: Hartemink, A.E.,
runoff and nitrous oxide gas emission.
McSweeney, K. (Eds.), Soil Carbon. Springer International Publishing, Switzerland,
Across all samplings, compared with indigenous land use, Cu con-
pp. 197–207.
Alloway, B.J., 2008.
Copper and zinc in soils: Too little or too much? In: Kim, N. (Ed.), New
centrations were elevated in horticultural and market gardens sites,
Zealand Trace Elements Group Conference. New Zealand Trace Elements Group,
while several land uses had lower macroporosity, AMN, TN, and higher
Hamilton, p. 10
11
J.J. Drewry, J.-A.E. Cavanagh, S.J. McNeill et al.
Geoderma Regional 25 (2021) e00383
Arrouays, D., Marchant, B.P., Saby, N.P.A., Meersmans, J., Orton, T.G., Martin, M.P., Bellamy,
Greenwood, P.B., McNamara, R.M., 1992.
An analysis of the physical condition of two
P.H., Lark, R.M., Kibblewhite, M., 2012.
Generic issues on broad-scale soil monitoring
intensively grazed Southland soils. Proceedings of the New Zealand Grassland Asso-
schemes: a review. Pedosphere 22, 456–469.
ciation 54, 71–75.
Bai, Z., Caspari, T., Gonzalez, M.R., Batjes, N.H., Mäder, P., Bünemann, E.K., de Goede, R.,
Hart, M.R., Cornish, P.S., 2016.
Soil phosphorus status and environmental risk of phospho-
Brussaard, L., Xu, M., Ferreira, C.S.S., Reintam, E., Fan, H., Mihelič, R., Glavan, M.,
rus run-off from pastures in south-eastern New South Wales. Soil Research 54,
Tóth, Z., 2018. Effects of agricultural management practices on soil quality: a review
685–691.
of long-term experiments for Europe and China. Agric Ecosyst Environ 265, 1–7.
Hart, P.B.S., Sparling, G.P., Kings, J.A., 1986.
Relationship between mineralisable nitrogen
Blakemore, L.C., Searle, P.L., Daly, B.K., 1987.
Methods for Chemical Analysis of Soils. New
and microbial biomass in a range of plant litters, peats, and soils of moderate to
Zealand Soil Bureau, p. 103.
low pH. N. Z. J. Agric.Res. 29, 681–686.
Bünemann, E.K., Bongiorno, G., Bai, Z., Creamer, R.E., De Deyn, G., de Goede, R., Fleskens, L.,
Hermans, S.M., Buckley, H.L., Case, B.S., Curran-Cournane, F., Taylor, M., Lear, G., 2020.
Geissen, V., Kuyper, T.W., Mäder, P., 2018.
Soil quality – a critical review. Soil Biol
Using soil bacterial communities to predict physico-chemical variables and soil qual-
Biochem 120, 105–125.
ity. Microbiome 8 (1), 79.
Burkitt, L., Dougherty, W., Carlson, S., Donaghy, D., 2010.
Effect of variable soil phosphorus
Hewitt, A., 2010.
New Zealand Soil Classification. Landcare Research, Lincoln, New
on phosphorus concentrations in simulated surface runoff under intensive dairy pas-
Zealand.
tures. Soil Research 48, 231–237.
Hewitt, A., 2013.
Survey of New Zealand soil orders. In: Dymond, J.R. (Ed.), Ecosystem Ser-
Caron, E., Farenhorst, A., Zvomuya, F., Gaultier, J., Rank, N., Goddard, T., Sheedy, C., 2010.
vices in New Zealand – Conditions and Trends. Manaaki Whenua Press, Lincoln, New
Sorption of four estrogens by surface soils from 41 cultivated fields in Alberta,
Zealand, pp. 121–131.
Canada. Geoderma 155, 19–30.
Hewitt, A.E., Shepherd, T.G., 1997.
Structural vulnerability of New Zealand soils. Aust J Soil
Cathcart, J., Cannon, K., Heinz, J., 2008.
Selection and establishment of Alberta agricultural
Res 35, 461–474.
soil quality benchmark sites. Can J Soil Sci 88, 399–408.
Heydari, A., 2020.
Resistance of Environmental Bacteria to Heavy Metals and Antibiotics
Cavanagh, J., 2014.
Status of Cadmium in New Zealand Soils. Landcare Research, Lincoln,
in Selected New Zealand Soils. Massey University, Wellington.
p. 36.
Hill, R.B., Sparling, G.P., 2009. Soil quality monitoring. Land and soil monitoring: a guide
Cavanagh, J.E., 2019.
Updated. User Guide: Background Soil Concentrations and Soil
for SoE and regional council reporting. Land monitoring. Forum, 27–88.
https://
Guideline Values for the Protection of Ecological Receptors (Eco SGVs) Consultation
www.mfe.govt.nz/publications/land/land-and-soil-monitoring-guide-soe-and-re-
Draft. Manaaki Whenua – Landcare Research, Linoln, p. 39.
gional-council%C2%A0reporting.
Cavanagh, J., Munir, K., McNeill, S., Stevenson, B., 2017.
Review of Soil Quality and Trace
Hill, R.B., Sparling, G., Frampton, C., Cuff, J., 2003.
National Soil Quality Review and Pro-
Element State of the Environment Monitoring Programmes. Landcare Research, Lin-
gramme Design. Ministry for the Environment, Wellington, p. 33.
coln, New Zealand, p. 90.
Houlbrooke, D.J., Paton, R.J., Littlejohn, R.P., Morton, J.D., 2011.
Land-use intensification in
Clark, D.A., Caradus, J.R., Monaghan, R.M., Sharp, P., Thorrold, B.S., 2007.
Issues and options
New Zealand: effects on soil properties and pasture production. J Agric Sci 49,
for future dairy farming in New Zealand. N. Z. J. Agric.Res. 50, 203–221.
337–349.
Condron, L.M., Hopkins, D.W., Gregorich, E.G., Black, A., Wakelin, S.A., 2014.
Long-term ir-
Huber, S., Prokop, G., Arrouays, D., Banko, G., Bispo, A., Jones, R., Kibblewhite, M., Lexer, W.,
rigation effects on soil organic matter under temperate grazed pasture. Eur J Soil Sci
Moller, A., Rickson, R., Shishkov, T., Stephens, M., Toth, G., Van den Akker, J.J.H.,
65, 741–750.
Varallyay, G., Verheijen, F.G.A., Jones, A.R., 2008. Environmental Assessment of Soil
Cotching, W., Kidd, D., 2010.
Soil quality evaluation and the interaction with land use and
for Monitoring: Volume I. Indicators and Criteria. Office for the Official Publications
soil order in Tasmania, Australia. Agric Ecosyst Env 137, 358–366.
of the European Communities, Luxembourg, Luxembourg, p. 339.
Curran-Cournane, F., 2015.
Soil quality state and trends in New Zealand’s largest city after
IUSS Working Group WRB, 2015.
World Reference Base for Soil Resources 2014, Update
15 years. International journal of environmental, ecological, geological and geophys-
2015. International Soil Classification System for Naming Soils and Creating Legends
ical. Engineering 9, 227–234.
for Soil Maps. FAO, Rome.
Curran-Cournane, F., McDowell, R., Littlejohn, R., Condron, L., 2011.
Effects of cattle, sheep
Johnston, A.E., Poulton, P.R., Coleman, K., Macdonald, A.J., White, R.P., 2017.
Changes in
and deer grazing on soil physical quality and losses of phosphorus and suspended
soil organic matter over 70 years in continuous arable and ley–arable rotations on a
sediment losses in surface runoff. Agric Ecosyst Environ 140, 264–272.
sandy loam soil in England. Eur J Soil Sci 68, 305–316.
Curran-Cournane, F., Fraser, S., Hicks, D., Houlbrooke, D., Cox, N., 2013.
Changes in soil
Kibblewhite, M.G., 2018.
Soil and soil health: an overview. In: Reicosky, D. (Ed.), Manag-
quality and land use in grazed pasture within rural Auckland. N. Z. J. Agric.Res. 56,
ing Soil Health for Sustainable Agriculture. Fundamentals. Burleigh Dodds Science
102–116.
Publishing, Cambridge, UK.
Curtin, D., McCallum, F.M., 2004.
Biological and chemical assays to estimate nitrogen sup-
Kibblewhite, M., Arrouays, D., Morvan, X., 2010.
A Framework for European Soil Monitor-
plying power of soils with contrasting management histories. Soil Research 42,
ing. 19th World Congress of Soil Science, Soil Solution for a Changing World. IUSS,
737–746.
Brisbane, Anstralia, p. 4.
Curtin, D., Beare, M.H., Lehto, K., Tregurtha, C.S., Qiu, W., Tregurtha, R., Peterson, M., 2017.
Kim, N.D., Taylor, M.D., 2017.
Cadmium and zinc – A tale of two metals. In: Massey, C.
Rapid assays to predict nitrogen mineralization capacity of agricultural soils. Soil Sci
(Ed.), The New Zealand Land & Food Annual 2017. Massey University Press, Massey
Soc Am J 81, 979–991.
University, Palmerston North, pp. 93–110.
Daxini, A., O’Donoghue, C., Ryan, M., Buckley, C., Barnes, A.P., Daly, K., 2018.
Which factors
Kirschbaum, M.U.F., Moinet, G.Y.K., Hedley, C.B., Beare, M.H., McNally, S.R., 2020.
A con-
influence farmers’ intentions to adopt nutrient management planning? J Environ
ceptual model of carbon stabilisation based on patterns observed in different soils.
Manage 224, 350–360.
Soil Biol Biochem 141, 107683.
Desaules, A., Ammann, S., Schwab, P., 2010.
Advances in long-term soil-pollution moni-
Knowles, J.E., Frederick, C., 2019.
merTools: Tools for analyzing mixed effect regression
toring of Switzerland. J Plant Nutr Soil Sci 173, 525–535.
models. R package version 0.5.0.
Drewry, J.J., Littlejohn, R.P., Paton, R.J., 2000.
A survey of soil physical properties on sheep
Komarek, M., Cadkova, E., Chrastny, V., Bordas, F., Bollinger, J.-C., 2009.
Contamination of
and dairy farms in southern New Zealand. N. Z. J. Agric.Res. 43, 251–258.
vineyard soils with fungicides: a review of environmental and toxicological aspects.
Drewry, J.J., Littlejohn, R.P., Paton, R.J., Singleton, P.L., Monaghan, R.M., Smith, L.C., 2004a.
Environ Int 36, 138–151.
Dairy pasture responses to soil physical properties. Aust J Soil Res 42, 99–105.
Krasilnikov, P., Martí, J.J.I., Arnold, R., Shoba, S., 2009.
A Handbook of Soil Terminology,
Drewry, J.J., Paton, R.J., Monaghan, R.M., 2004b.
Soil compaction and recovery cycle on a
Correlation and Classification. Earthscan, London.
Southland dairy farm: implications for soil monitoring. Aust J Soil Res 42, 851–856.
Kühnel, A., Garcia-Franco, N., Wiesmeier, M., Burmeister, J., Hobley, E., Kiese, R.,
Drewry, J.J., Cameron, K.C., Buchan, G.D., 2008.
Pasture yield and soil physical property re-
Dannenmann, M., Kögel-Knabner, I., 2019.
Controlling factors of carbon dynamics
sponses to soil compaction from treading and grazing: a review. Aust J Soil Res 46,
in grassland soils of Bavaria between 1989 and 2016. Agric Ecosyst Environ 280,
237–256.
118–128.
Duplay, J., Semhi, K., Errais, E., Imfeld, G., Babcsanyi, I., Perrone, T., 2014.
Copper, zinc, lead
Lilburne, L., Sparling, G., Schipper, L., 2004.
Soil quality monitoring in New Zealand: devel-
and cadmium bioavailability and retention in vineyard soils (Rouffach, France): the
opment of an interpretative framework. Agric Ecosyst Environ 104 (3), 535–544.
impact of cultural practices. Geoderma 230-231, 318–328.
Lobry de Bruyn, L.A., 2019.
Learning opportunities: understanding farmers’ soil testing
Emmett, B., Reynolds, B., Chamberlain, P., Rowe, E., Spurgeon, D., Brittain, S., Frogbrook, Z.,
practice through workshop activities to improve extension support for soil health
Hughes, S., Lawlor, A., Poskitt, J., 2010.
Countryside Survey: Soils Report from 2007.
management. Soil Use Manage 35, 128–140.
Centre for Ecology & Hydrology, Natural Environment Research Council, Lancaster.
Mackay, A., Dominati, E., Taylor, M.D., 2013.
Soil quality indicators: The next generation.
Faraway, J.J., 2006.
Extending the Linear Model with R. Chapman and Hall/CRC Press, Boca
Report prepared for Land Monitoring Forum of Regional Councils. Client report num-
Raton Florida.
ber: RE500/2012/025. AgResearch, Palmerston North.
Gaw, S.K., Wilkins, A.L., Kim, N.D., Palmer, G.T., Robinson, P., 2006.
Trace element and DDT
MAF, 2011.
Cadmium and New Zealand Agriculture and Horticulture: A Strategy for Long
concentrations in horticultural soils from the Tasman, Waikato and Auckland regions
Term Risk Management. A Report Prepared by the Cadmium Working Group for the
of New Zealand. Sci Total Environ 355, 31–47.
Chief Executives Environmental Forum. Ministry of Agriculture and Forestry,
Gourley, C.J., Aarons, S.R., Hannah, M.C., Awty, I.M., Dougherty, W.J., Burkitt, L.L., 2015.
Soil
Wellington, p. 27.
phosphorus, potassium and Sulphur excesses, regularities and heterogeneity in
Manaaki Whenua-Landcare Research, 2019.
Soil testing. Manaaki Whenua – Landcare
grazing-based dairy farms. Agric Ecosyst Environ 201, 70–82.
Research.
Government of Alberta, 2020. Alberta soil information – Resources. Government of Al-
Marzaioli, R., D'Ascoli, R., De Pascale, R.A., Rutigliano, F.A., 2010.
Soil quality in a Mediter-
berta
https://www.alberta.ca/other-alberta-soil-resources.aspx.
ranean area of Southern Italy as related to different land use types. Applied Soil Ecol-
Gradwell, M.W., 1972.
Methods for Physical Analysis of Soils. New Zealand Soil Bureau
ogy 44, 205–212.
Department of Scientific and Industrial Research, p. 59.
McBratney, A., Field, D.J., Koch, A., 2014.
The dimensions of soil security. Geoderma 213,
Gray, C., McDowell, R., Noble, A., 2017.
Analysis of Samples from the Winchmore Long-
203–213.
Term Fertiliser Trial for Total Soil Cadmium Contents. Report for Fertiliser Association
McDowell, R.W., 2012.
The rate of accumulation of cadmium and uranium in a long-term
of New Zealand. AgResearch, p. 6.
grazed pasture: implications for soil quality. N. Z. J. Agric.Res. 55, 133–146.
12
J.J. Drewry, J.-A.E. Cavanagh, S.J. McNeill et al.
Geoderma Regional 25 (2021) e00383
McDowell, R.W., Hedley, M.J., Pletnyakov, P., Rissmann, C., Catto, W., Patrick, W., 2019.
Roberts, A.H.C., Longhurst, R.D., Brown, M.W., 1994.
Cadmium status of soils, plants, and
Why are median phosphorus concentrations improving in New Zealand streams
grazing animals in New Zealand. N. Z. J. Agric.Res. 37, 119–129.
and rivers? Journal of the Royal Society of New Zealand 1–28.
Saby, N., Bellamy, P.H., Morvan, X., Arrouays, D., Jones, R.J., Verheijen, F.G., Kibblewhite,
McIntosh, P.D., Hewitt, A.E., Giddens, K., Taylor, M.D., 1997.
Benchmark sites for assessing
M.G., Verdoodt, A., Üveges, J.B., Freudenschuß, A., 2008.
Will European soil monitor-
the chemical impacts of pastoral farming on loessial soils in southern New Zealand.
ing networks be able to detect changes in topsoil organic carbon content? Glob
Agric Ecosyst Environ 65, 267–280.
Chang Biol 14, 2432–2442.
McNally, S., Beare, M., Curtin, D., Meenken, E., Kelliher, F., Calvelo Pereira, R., Shen, Q.,
Saby, N.P.A., Thioulouse, J., Jolivet, C.C., Ratie, C., Boulonne, L., Bispo, A., Arrouays, D., 2009.
Baldock, J., 2017.
Soil carbon sequestration potential of permanent pasture and con-
Multivariate analysis of the spatial patterns of 8 trace elements using the French soil
tinuous cropping soils in New Zealand. Glob Chang Biol 23, 4544–4555.
monitoring network data. Sci Total Environ 407, 5644–5652.
McNeill, S.J., Golubiewski, N., Barringer, J., 2014.
Development and calibration of a soil car-
Schipper, L.A., Mudge, P.L., Kirschbaum, M.U., Hedley, C.B., Golubiewski, N.E., Smaill, S.J.,
bon inventory model for New Zealand. Soil Research 52 (8), 789–804.
Kelliher, F.M., 2017.
A review of soil carbon change in New Zealand's grazed grass-
Ministry for the Environment, 2010.
New Zealand’s Greenhouse Gas Inventory
lands. N. Z. J. Agric.Res. 60, 93–118.
1990–2008. Ministry for the Environment, Wellington, p. 295.
Shepherd, M., Ghani, A., Rajendram, G., Carlson, B., Pirie, M., 2015.
Soil total nitrogen con-
Ministry for the Environment, 2019.
LUCAS NZ Land Use Map 1990 2008 2012 2016 v006.
centration explains variation in pasture response to spring nitrogen fertiliser across a
Wellington.
single farm. Nutr Cycl Agroecosyst 101, 377–390.
Ministry for the Environment, Stats NZ, 2018.
New Zealand’s Environmental Reporting
Smith, P., Soussana, J.-F., Angers, D., Schipper, L., Chenu, C., Rasse, D.P., Batjes, N.H., van
Series: Our Land 2018. Ministry for the Environment and Stats NZ, Wellington,
Egmond, F., McNeill, S., Kuhnert, M., Arias-Navarro, C., Olesen, J.E., Chirinda, N.,
p. 134.
Fornara, D., Wollenberg, E., Álvaro-Fuentes, J., Sanz-Cobena, A., Klumpp, K., 2020.
Monaghan, R.M., Paton, R.J., Smith, L.C., Drewry, J.J., Littlejohn, R.P., 2005.
The impacts of
How to measure, report and verify soil carbon change to realize the potential of
nitrogen fertilisation and increased stocking rate on pasture yield, soil physical con-
soil carbon sequestration for atmospheric greenhouse gas removal. Glob Chang Biol
dition and nutrient losses in drainage from a cattle-grazed pasture. N Z J AgricRes
26, 219–241.
48, 227–240.
Sparling, G.P., Schipper, L., 2002.
Soil quality at a national scale in New Zealand. J Environ
Morvan, X., Saby, N., Arrouays, D., Le Bas, C., Jones, R., Verheijen, F., Bellamy, P., Stephens,
Qual 31, 1848–1857.
M., Kibblewhite, M., 2008.
Soil monitoring in Europe: a review of existing systems
Sparling, G., Schipper, L., 2004.
Soil quality monitoring in New Zealand: trends and issues
and requirements for harmonisation. Sci Total Environ 391, 1–12.
arising from a broad-scale survey. Agric Ecosyst Environ 104, 545–552.
Mudge, P.L., Kelliher, F.M., Knight, T.L., O’Connell, D., Fraser, S., Schipper, L.A., 2017.
Irrigat-
Sparling, G.P., Schipper, L.A., Bettjeman, W., Hill, R., 2004.
Soil quality monitoring in New
ing grazed pasture decreases soil carbon and nitrogen stocks. Glob Chang Biol 23,
Zealand: practical lessons from a 6-year trial. Agric Ecosyst Environ 104, 523–534.
945–954.
Sparling, G.P., Lilburne, L., Vojvodic-Vukovic, M., 2008. Provisional targets for soil quality
Nakagawa, S., Schielzeth, H., 2013.
A general and simple method for obtaining R2 from
indicators in New Zealand. Landcare Research Science Series no. 34, Manaaki
generalized linear mixed-effects models. Methods in Ecology and Evolution 4,
Whenua Press, Palmerston North.
133–142.
Statistics New Zealand, 2007.
Principles and Protocols for Producers of Tier 1 Statistics.
Nerger, R., Beylich, A., Fohrer, N., 2016.
Long-term monitoring of soil quality changes in
Statistics New Zealand, Wellington, p. 65.
northern Germany. Geoderma Reg 7, 239–249.
Stevenson, B.A., McNeill, S., Hewitt, A.E., 2015.
Characterising soil quality clusters in rela-
Parfitt, R.L., Stevenson, B.A., Dymond, J.R., Schipper, L.A., Baisden, W.T., Ballantine, D.J.,
tion to land use and soil order in New Zealand: an application of the phenoform con-
2012.
Nitrogen inputs and outputs for New Zealand from 1990 to 2010 at national
cept. Geoderma 239-240, 135–142.
and regional scales. N. Z. J. Agric.Res. 55, 241–262.
Taylor, M., 2016.
The fate and impact of fertiliser derived contaminants in New Zealand
Parfitt, R., Stevenson, B., Ross, C., Fraser, S., 2014.
Changes in pH, bicarbonate-extractable-
soils - development of a priority assessment model. Fakultät Architektur.
P, carbon and nitrogen in soils under pasture over 7 to 27 years. N. Z. J. Agric.Res. 57,
Bauingenieurwesen und Umweltwissenschaften der Technischen Universität
216–227.
Carolo-Wilhelmina zu Braunschweig zur Erlangung des Grades eines.
Parr, T.W., Sier, A.R.J., Battarbee, R.W., Mackay, A., Burgess, J., 2003.
Detecting environ-
Taylor, M.D., Kim, N.D., Hill, R.B., Chapman, R., 2010.
A review of soil quality indicators and
mental change: science and society—perspectives on long-term research and moni-
five key issues after 12 yr soil quality monitoring in the Waikato region. Soil Use Man-
toring in the 21st century. Sci Total Environ 310, 1–8.
age 26, 212–224.
PCE, 2019.
Focusing Aotearoa New Zealand’s Environmental Reporting System. Parlia-
Taylor, M., Kim, N., Hill, R., 2011.
A trace element analysis of soil quality samples from the
mentary Commissioner for the Environment, Wellington, p. 100.
Waikato region. In: Currie, L.D., Christensen, C.L. (Eds.), Adding to the Knowledge
Base for the Nutrient Manager. Occasional Report. vol. 24. Fertilizer and Lime Re-
Pinheiro, J., Bates, D., 2000.
Mixed-Effects Models in S and S-PLUS. Springer-Verlag, New
search Centre, Massey University, Palmerston North, New Zealand, p. 7.
York.
Taylor, M.D., Cox, N., Littler, R., Drewry, J.J., 2017.
Trends in Soil Quality Monitoring Data in
Powlson, D.S., Stirling, C.M., Jat, M.L., Gerard, B.G., Palm, C.A., Sanchez, P.A., Cassman, K.G.,
the Waikato Region 1995–2015. Waikato Regional Council Hamilton New Zealand,
2014.
Limited potential of no-till agriculture for climate change mitigation. Nature
p. 74.
Climate Change 4 (8), 678–683.
Waikato Regional Council, 2016.
Regional Policy Statement for the Waikato Region. Wai-
Rab, M.A., Haling, R.E., Aarons, S.R., Hannah, M., Young, I.M., Gibson, D., 2014.
Evaluation
kato Regional Council, Hamilton, p. 303.
of X-ray computed tomography for quantifying macroporosity of loamy pasture
Whitehead, D., Schipper, L.A., Pronger, J., Moinet, G.Y.K., Mudge, P.L., Calvelo Pereira, R.,
soils. Geoderma 213, 460–470.
Kirschbaum, M.U.F., McNally, S.R., Beare, M.H., Camps-Arbestain, M., 2018.
Manage-
Reynolds, B., Chamberlain, P.M., Poskitt, J., Woods, C., Scott, W.A., Rowe, E.C., Robinson,
ment practices to reduce losses or increase soil carbon stocks in temperate grazed
D.A., Frogbrook, Z.L., Keith, A.M., Henrys, P.A., Black, H.I.J., Emmett, B.A., 2013.
Coun-
grasslands: New Zealand as a case study. Agric Ecosyst Environ 265, 432–443.
tryside survey: national “soil change” 1978–2007 for Topsoils in Great Britain—acid-
ity, carbon, and Total nitrogen status. Vadose Zone J 12.
13
Document Outline