 Hurunui District Council
Annual Report
2010 - 2011
Hurunui District Council
Annual Report
2010 - 2011

Hurunui District Council
66 Carters Road
PO Box 13
Amberley 7441
Phone:
03 314 8816
Fax:
03 314 9181
Email:
[Hurunui District Council request email]
Web:
hurunui.govt.nz
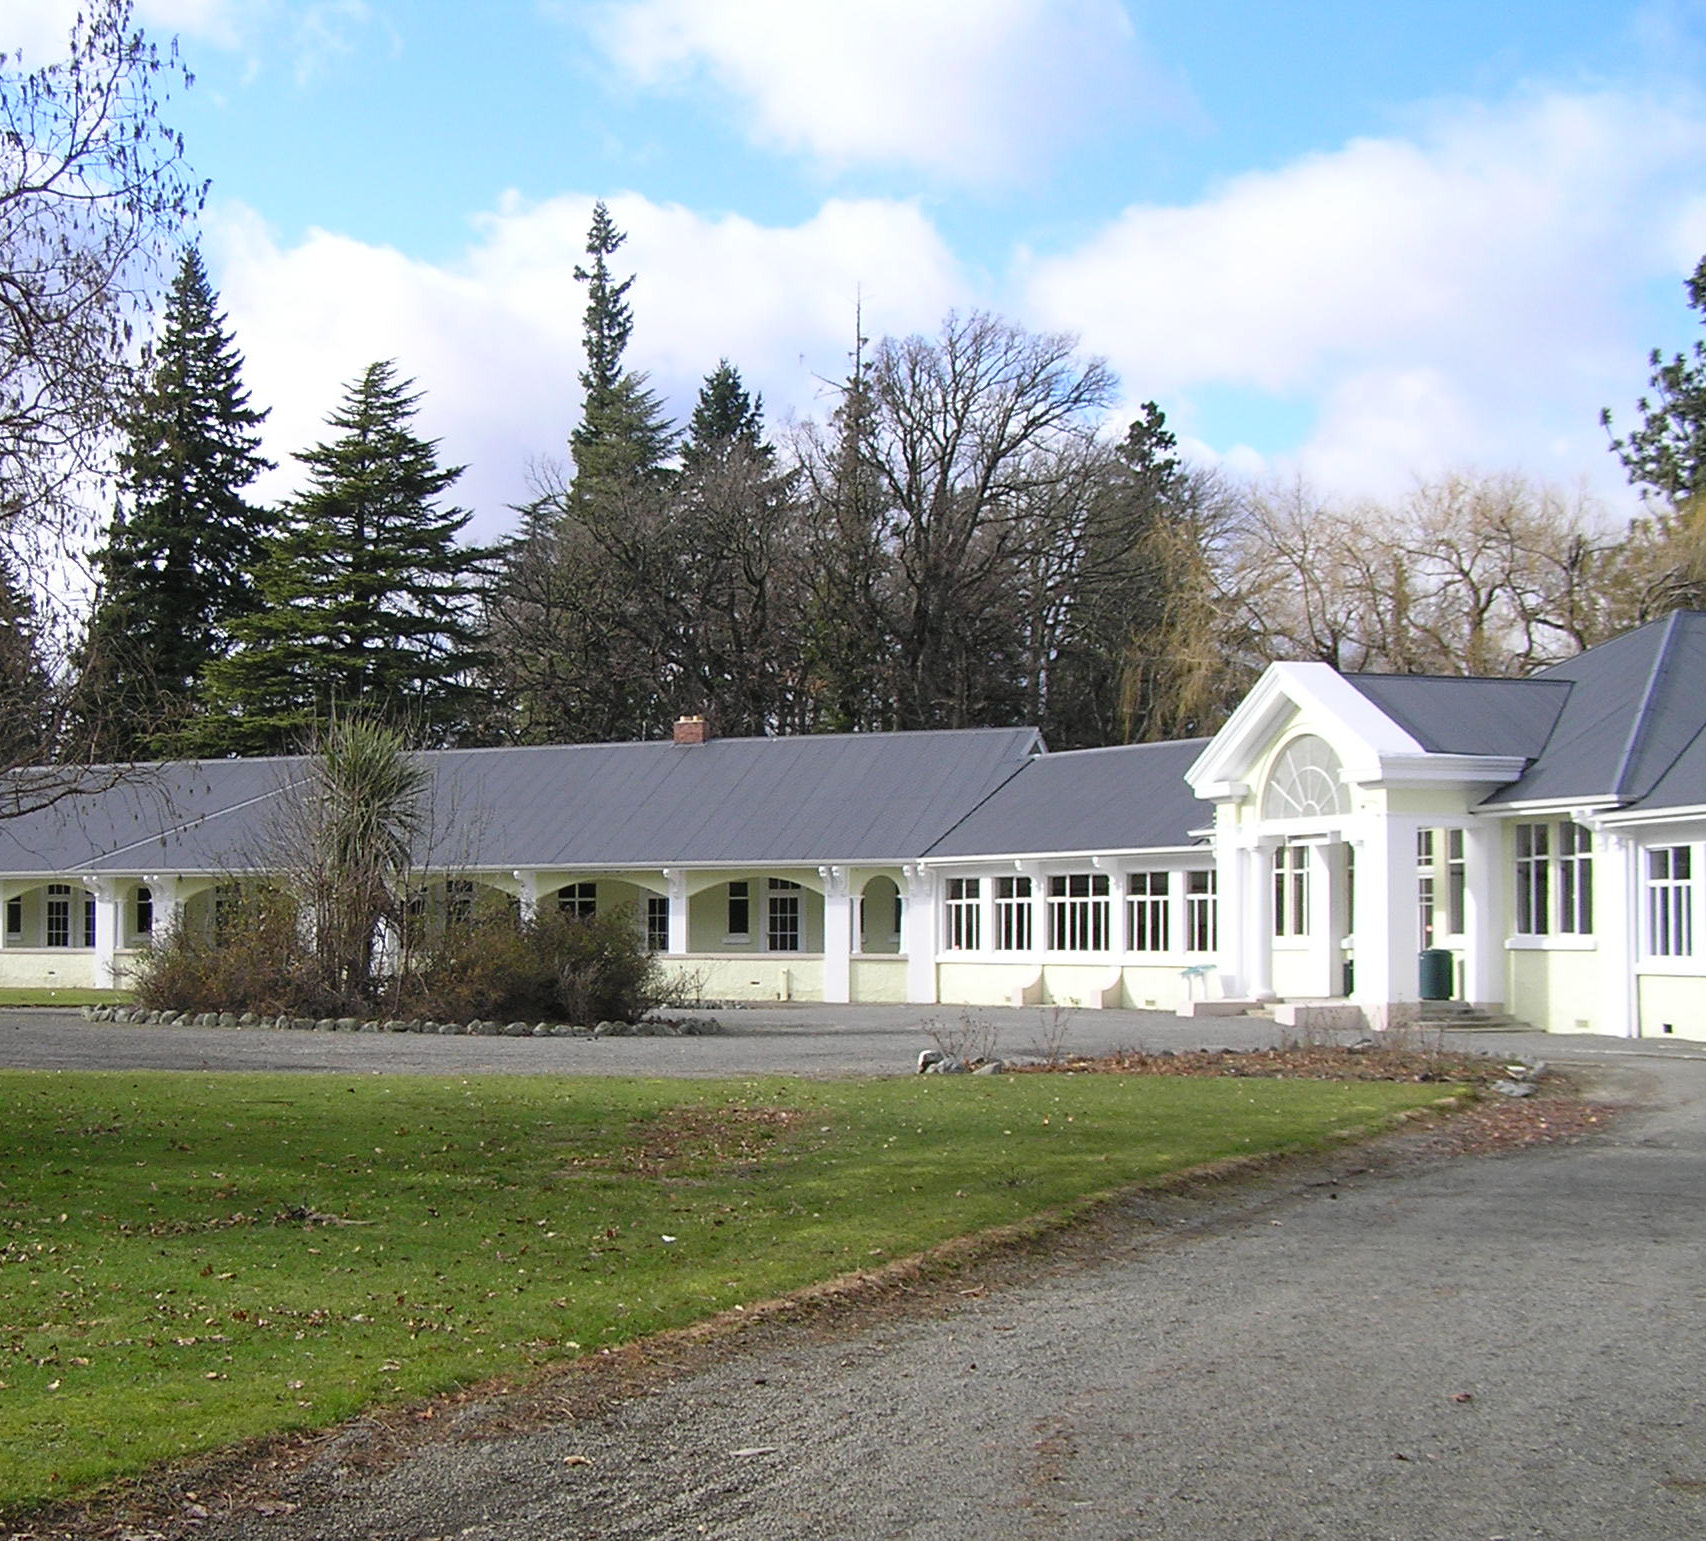
Cover: Chisolm Block, Queen Mary Hospital Historic Reserve
2
Annual Report - 1 July 2010 to 30 June 2011
Contents
4 Introduction
71 Financial Statements
4
Foreword
71
Statement of Comprehensive Income
N
72
Statement of Financial Position
IO
5
Introduction from Mayor and CEO
T
C
11
Planning Cycle
73
Statement of Changes in Equity
U
D
12
How the Canterbury Earthquakes Affected Us
74
Statement of Cash flows
RO
T
14
Cost of Compliance
75
Notes to the Financial Statements
IN
15
Māori Decision Making
104 Council Controlled Organisations
16
Statement of Compliance and Responsibility
104
Enterprise North Canterbury
17 Groups of Council Activities
105
Canterbury Economic Development Company
17
Introduction
106 Audit Report
19 (1) Community Services and Facillities
IES
21
1.1 Library
IT
IV
24
1.2
Township Facilities
T
C
A
26
1.3
Property
Y
IT
27
1.4
Public Toilets
N
U
28
1.5
Cemeteries
M
M
O
30
1.6
Reserves
C
32
1.7
Grants and Services Awards
33 (2) Environment and Safety
35
2.1
Resource Management / Planning
38
2.2
Civil Defence
40
2.3
Rural Fire
S
T
42
2.4
Building Compliance
EN
44
2.5
Public Health and Liquor Licensing
EM
T
46
2.6
Animal Control
L STA
IA
C
47 (3) Growth and Development
N
A
49
3.1
Tourism
FIN
50
3.2
Visitor Information
51
3.3
Economic Development
52 (4) Utility Services / Infrastructure
S
N
54
4.1
Roading Network
IO
T
58
4.2
Waste Minimisation
ISA
60
4.3
Sewerage
N
A
G
62
4.4
Stormwater and Drainage
R
O
63
4.5
Water Supplies
65 (5) Hanmer Springs Thermal Pools and
LLED
Spa
RO
T
N
69 (6) Governance
O
IL C
C
N
U
O
C
3
Hurunui District Council
Foreword
This Annual Report provides information on our performance
for the 2010 / 2011 financial year. We measure how we
are going by reporting on 113 key performance measures.
Overall, we believe we have performed well, particularly
given the devastating earthquakes that the Canterbury
Region faced during the year, and the continuing impact of
the global recession. As you read through our performance
results, you will note that the Canterbury earthquakes did
impact or delay many areas of our work. This is further
discussed in a separate section in this report.
Despite the year’s challenges, at the end of the financial
year 71 of our indicator targets (63%) were achieved. We
almost achieved or could not measure another 23 of our
performance targets (20%). 19 performance targets were
not met (17%).
We have colour coded our results in the Council Activity
section to help you identify instantly where we achieved
our targets, where we did not, and where we are on track
to achieve them. The colour BLUE signifies that the
targets that were achieved. YELLOW indicates a target
that was not reached but is either almost there (within a
few percentages) or is well on its way to being achieved.
YELLOW also represents any targets that we have not
been able to measure. The colour RED is used when
we have not met our target and are not on track to do
so. This indicates a project or programme is significantly
behind schedule. Further discussion on our performance
measures can be found under each activity.
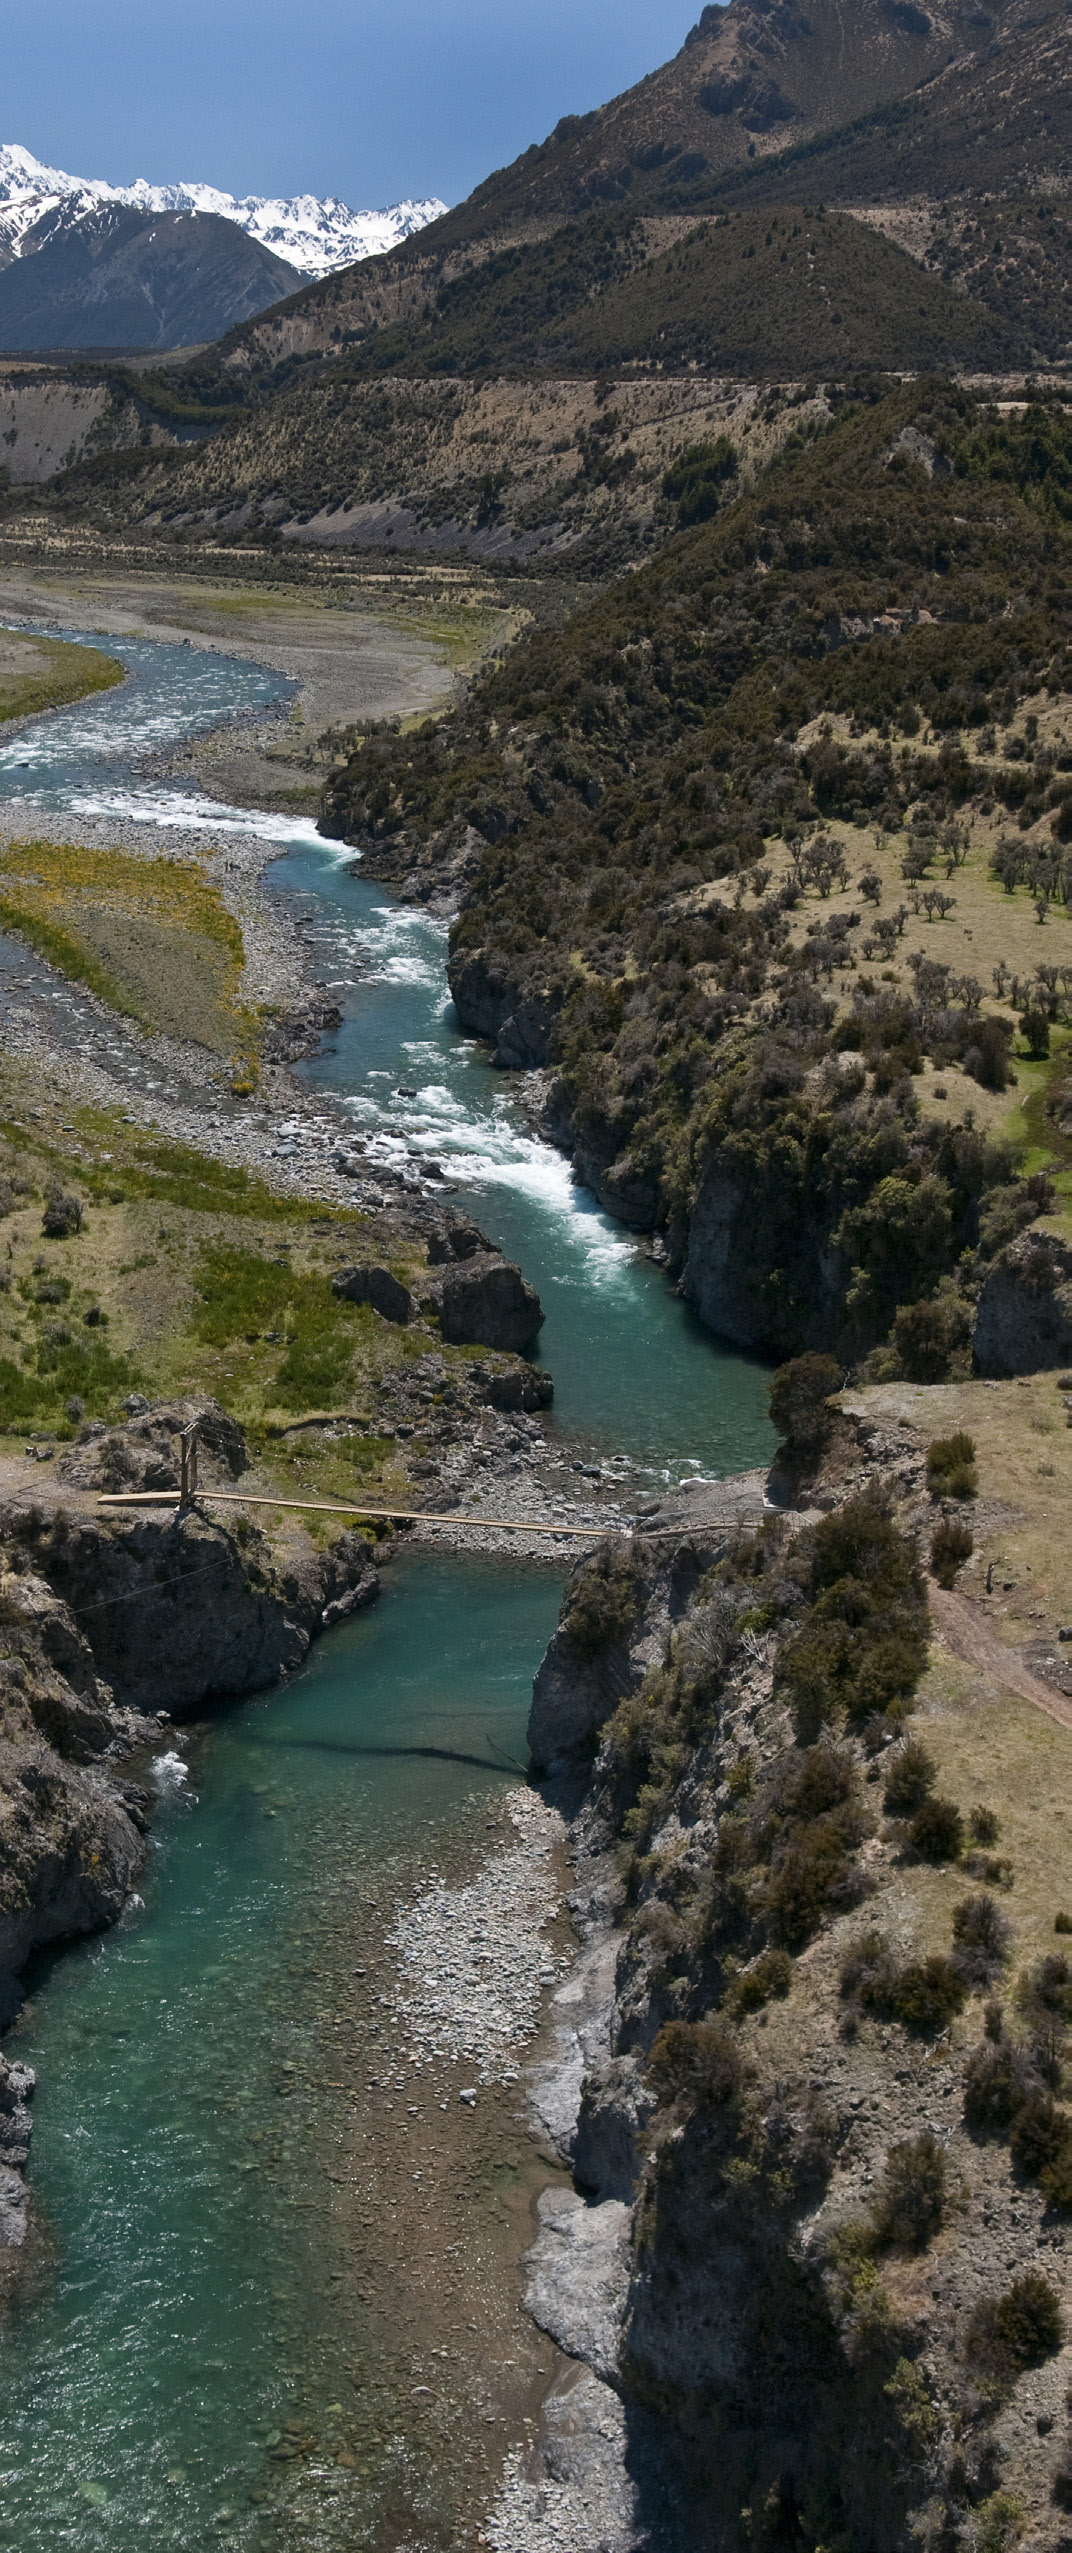
St James Walk way
4
Annual Report - 1 July 2010 to 30 June 2011
Introduction From the Mayor and Chief Executive Officer
This Annual Report explains how we have delivered the The results also show an improvement in the Hanmer
Council’s programme of activities for 2010/11, including Springs Community Board members’ overall performance
the achievement of performance measures and targets. which is at 63% satisfaction. The survey confirmed very
N
Our programme of works and services was originally set high levels of satisfaction by those who use our services
IO
T
out in the Council’s Hurunui Long Term Community Plan (libraries 96%; parks and reserves 94%; cemeteries
T
C
93%; public toilets 90%; local halls 90%; household
U
2009–19 (HLTCP) and then revised in the 2010/11 Annual
IN
D
Plan. Both Plans were prepared against a backdrop of waste collection 95%; water quality (towns) 82.5%).
O
R
the global economic recession, the effects of which still
T
continue to be felt. What we did not anticipate when While our roading satisfaction levels have continued to
IN
preparing the Plans, were the Canterbury earthquakes rise on the whole over the years, this is an area where
and the significant impact those have had.
our communities want further improvement. Latest results
show 73% satisfaction for the overall maintenance of
Our primary concern when preparing the programme for roads; 71% satisfaction with sealed roads; 49% with
2010/11 was affordability. We were cognisant that the unsealed roads; and 66% for public footpaths. We will
New Zealand economy was and is still shaking off the continue to focus on these important services, and try to
effects of an economic downturn. We developed a plan gain maximum leverage for our spend. See the ‘Roading’
which we saw as financially responsible. Among other section of this introduction for further information on this
ES
things, we strived to leverage returns from the Hanmer subject.
M
O
Springs Thermal Pools and Spa to the advantage of the
C
T
entire district.
The full survey results are available on our website at:
U
www.hurunui.govt.nz/news and veiws/resident surveys
O
Y
The Council recorded a total comprehensive income of
IT
N
$10.9 million. This is explained further throughout the Financial Performance
U
M
document.
M
O
As explained in the financial statements on pages 71 to
C
As you’ll see throughout this report, we are generally 103, the Council recorded a total comprehensive income
performing well against our targets. Where we fell short of $10.9 million. This is the result of a net surplus after
of the levels we expected, we are working to address this. tax of $6.2 million plus an increase in the value of the
The projects outlined in the Annual Plan were generally Council’s assets of $4.7 million.
completed or on track for completion, except when there
were factors beyond our control – for example, relocation Operating Revenue was $6.6 million greater than
of the Amberley Transfer Station, which was delayed due predicted in the Annual Plan but this is largely due to the
to issues in securing an appropriate area of land at an
S
value of Vested Asset Income resulting from the vesting of
T
affordable price.
the Queen Mary Hospital land and buildings, which was
EN
EM
$6,298,000. After accounting for this extraordinary item,
T
We operated on a 1.05% reduction in the general rate in the income had exceeded budget by $280,000.
the 2010/11 financial year (although we had indicated a
L STA
5.7% increase in the general rate in the HLTCP 2009/19).
IA
Operating Expenditure was $1,509,000 greater than was
C
Targeted rates varied from area to area and between
N
predicted in the Annual Plan, the key variances being:
A
properties increased on average by 6.1%. The overall rate
FIN
increase was 3%, which was in line with the average inflation • Additional costs of $514,000 in Utility Services and
rate assumed in the 2010/11 budget of 3%. Targeted
Infrastructure due to emergency reinstatement of
rates are influenced by community needs and decided on
areas of the roading network affected by the significant
by local ward/community committees and boards, rather
rain events in July and August 2010. In addition, an
than the Council. This enables local decision making on
extra $181,000 was spent on consultants relating to
S
N
matters which are of importance to local areas as opposed
stormwater resource consents.
IO
to those which impact on the entire district.
T
ISA
• Additional costs of $243,000 were incurred in Council
N
defending the appeal made by Mainpower on the
A
Service Performance
G
R
declined resource consent for a windfarm on Mt Cass.
O
Since 2007, we have conducted a resident satisfaction
survey each year. Opinions Market Research carried out • Additional operating costs of $282,000 incurred at the
LLED
the work in 2010/11. 500 residents are interviewed with a
Hanmer Springs Thermal Pools and Spa as a result
RO
T
margin of error + or – 4.3%. The results confirmed a general
of the expansion work completed prior to Christmas
N
2010, which was offset by the additional revenue
O
upward trend of satisfaction for the fourth year in a row.
earned.
IL C
In general, residents are positive about the performance
C
N
of the Council and the state of facilities and services,
U
ranging from libraries, public toilets to water supply. The net result, after excluding the value of vested assets,
O
C
Residents’ perception of the Council’s overall performance
in 2011 has improved since 2008 and now sits at 87%.
5
Hurunui District Council
was that the Council is approximately $572,000 behind depreciation) for 2010/11 was $2.8 million and this was
budget due to those additional costs incurred. Council will achieved.
review how this is funded as part of the Long Term Plan
preparation.
Hanmer Springs Township Upgrade
New Council and Committees
A major two million dollar upgrade of the Hanmer Springs
Township was completed in early 2011. This upgrade
We had a significant change in the Council’s included a major reconstruction of the main road in the
membership at the October 2010 elections with a new township to provide safer pedestrian crossing areas and
mayor and six new councillors joining three returning to encourage vehicles to slow down. It also included
councillors, to form the newly elected Council. The Hanmer stormwater improvements, general beautification of
Springs Community Board also gained four new members the town centre with attractive plantings, new seating
who joined the one returning member, along with the local arrangements and preservation of the feature oak trees
Ward Councillor we appoint to the Board. These changes along Amuri Avenue. The completing of this project was
were largely driven by the previous members deciding also delayed by earthquakes due to the contractors having
the time was right to step down and not seek re-election. other priorities.
In order to improve the efficiency and effectiveness of our Amberley Town Upgrade
governance model, a more consolidated and integrated
decision making committee structure was formed by the The major upgrade of the Amberley Township has been
new Council in October 2010. This resulted in the formation mostly completed. The $359,000 upgrade included new
of a new Strategy and Policy Committee, a new Regulatory signage at the southern entrance to Amberley, a new
Committee and a new Audit and Risk Committee. pathway through the centre with 21 story boards along the
We reconfirmed many of the existing committees way, new kerb and channelling, plantings and reshaping
focusing on local amenities, local reserves and water of grass and treed verges. The look of the design is to
schemes to continue to encourage and enable significant emphasise the rural and rustic nature of the Amberley
involvement by local community representatives in their Township as the gateway to the Hurunui. The planned
own local issues. We reviewed the effectiveness of the northern access sign has not proceeded yet and has been
new committees in June 2011 and there was agreement delayed by the difficult “frangibility” requirements of the
that the new structure was working well. No changes were New Zealand Transport Agency (which controls signage
made.
regulations for State Highways). We were disappointed
with New Zealand Transport Agency for not providing
Significant Achievements
funding to complete the upgrade with drainage and kerb
and channelling on the west side of the main street. The
New Amuri Health Centre
upgrade project was ‘dogged’ by several delays caused
through contractors’ availability for a number of reasons,
A new one million dollar medical centre was built and but particularly the earthquakes.
completed in Rotherham on a new site to replace the
former medical centre, which was inadequate to provide Community Development Programme
modern health services. The new centre was opened in Through a community driven proposal to the Council,
an official ceremony on 26 June 2011. The project was a we applied for funding from the Department of Internal
great example of a community and the Council working in Affairs to fund a community development programme
partnership to realise a shared vision and make something for the Hurunui district. The application was successful
very worthwhile happen. The centre serves the former and we employed a Community Development Advisor in
Amuri Ward.
November 2010. A number of programmes have been set
Hanmer Springs Thermal Pools & Spa Development up or initiated since that time. Some examples include:
driving courses for the elderly; an oral history project
The Hanmer Springs Thermal Pools and Spa is a major between school students and our elderly people; elderly
asset for the Council, and a significant strength for the and youth forums to identify needs for both groups;
district in terms of its international recognition and as a community data base; and the investigation of a Hurunui
tourist attraction, and for the revenue it produces annually. community trust. The programme is funded for three years
The HLTCP 2009-19 outlined a $7.5m expansion project and we are pleased with the interest in the programme and
for the Pools and Spa. The completion of the new the range of initiatives that have been undertaken within a
development which included new and upgraded pools very short time.
and facilities occurred on time and resulted in the complex
opening on 20 December 2010. The projected surplus Other Key Project Updates
from the thermal pools and spa (before interest and In the 2010/11 Annual Plan, there were other projects we
6
Annual Report - 1 July 2010 to 30 June 2011
asked for public feedback on prior to finalising the Plan. prepared to pay. It was decided not to proceed with the
Over the past year, this is where we have got to with these scheme at this time due to the issue of affordability and
projects:
lack of community support.
N
IO
T
Roading
Culverden Sewerage Scheme
T
CUIN
D
Funding for our roading operating budget from New $25,000 was budgeted to investigate the feasibility of
O
R
Zealand Transport Agency (NZTA) was substantially a sewerage scheme for the Culverden Township. The
T
reduced for 2010/11. Our reduction for Hurunui amounted investigation was undertaken in early 2011 and concluded
IN
to approximately $250,000 from what had been planned the capital cost to be $3.9 million. Assuming that this
through the HLTCP 2009 – 19 and Regional Land would be loan funded over 25 years, the operating costs
Transport Programme 2009/12. NZTA funding reductions (including loan repayments) was estimated to be $400,000
will continue to challenge us into the years ahead and we per annum, which worked out to be $1,840 per annum for
promised we would pursue smarter procurement and new developed sections and $920 per annum for vacant or
contract initiatives. Our roading maintenance programme undeveloped sections. The Amuri Community Committee
was on track for the year with only 3.7% carried over considered the proposal but decided that this was an
into the following year as a result of work commitments unfair burden on ratepayers and rejected the proposal. No
ES
through the rainfall emergency events early in the year. further work is proposed at this time.
M
O
Major achievements included the Amberley Beach Road
C
T
Intersection improvement, bridge renewal works to nine Hanmer Springs Water Pump & Pipe Renewals
U
structures including five bridge deck replacements,
O
Y
remedial works caused by unseasonably high rainfall in July $243,000 was budgeted for pump and pipe renewals in
IT
N
and August 2010, five sections of pavement construction Hanmer Springs. We did indicate that the work would not
U
M
treatment, resealing of over 40 kilometres of sealed road take place if the components were found to still be in good
M
O
infrastructure with long-lasting, high-quality two coat seals condition. On assessing these asset components, the
C
and finally, safety improvements to the Hurunui Bluffs Road majority were found to still have at least ten years useful
(rock scaling), Amuri Avenue intersection improvements life left in them. Thus only minor works were carried out
(Hanmer Springs) and Campbell Terrace embankment under pipe renewals. This pipe replacement programme
stabilization (Motunau Beach).
has been deferred and pushed out to 2021/2022.
Water Management
Cheviot Water Treatment Plant
S
Water management is a big issue in our district. Our The Cheviot, Gore Bay and Port Robinson areas have had
T
community supported the Hurunui district being the first water supplied by a Miox treatment plant since early 2008.
EN
of the ten ‘zone’ committees to be set up to support the This is a temporary measure as it does not fully comply
EM
T
Canterbury Water Management Strategy, which calls for a with the drinking water standards and we have until 2014
collaborative and integrated approach to the management to fully upgrade the scheme. We had $579,000 in the
L STA
IA
of water. The Hurunui Waiau Zone Committee was budget carried over from the 2009/10 year to fund a new
C
successfully formed in July 2010 and has undertaken an
N
water source or a new treatment plant. We decided not
A
exhaustive programme of meetings and public consultation to build a new water scheme this year, and instead have
FIN
to form a Zone Implementation Programme (commonly been monitoring and assessing two alternative sources for
known as the ‘ZIP’). The ZIP was formally received by the quality and quantity for a water supply to Cheviot. This was
Hurunui District Council and Canterbury Regional Council an action agreed upon with the Cheviot Ward Committee,
in August 2011 and it has provided the basis for the Hurunui that it was advantageous to look at other alternative
Waiau Regional Plan, a statutory planning document, and intakes before making a final decision. The funds have
S
N
made public by the Canterbury Regional Council, which is been carried over into the 2011/12 year until it is agreed
IO
T
responsible for the implementation of the ZIP.
on the best option for the township.
ISA
N
A
Waipara Sewerage Scheme
Amberley Infrastructure Upgrade
G
R
O
In response to a request from residents, the Council Due to projected growth in the Amberley Township, $406,000
commissioned consultants to investigate a sewerage was budgeted to upgrade the water scheme. We decided to
LLED
scheme for the Waipara Township in the 2009/10 year. The defer an extensive pipe renewal programme to 2014/2015
RO
T
consultants found that a scheme to service the community as assessments of our current infrastructure confirmed
N
O
would cost approximately $1.64 million which would be they could last a few more years without compromising
funded by those properties that would benefit from the the scheme. Two new bores have been drilled to secure
IL C
C
scheme. A public poll was conducted in early 2011 with reliable water supplies for Amberley. The first bore in
N
U
the 110 property owners in the township. The cost per
O
C
property worked out to be more than the community was
7
Hurunui District Council
the Amberley Domain was unsuccessful, with the water retains concession rights and income for any other use
intake unsuitable. The second bore replaces an existing of the reserve. We have not had a need to spend the
bore, located alongside State Highway 1 and is capable $15,000 yet and a final decision has not been made on the
of providing good quantity and quality water for domestic future management of the land.
use. The Canterbury Regional Council (ECan) needs to
approve the resource consent before this new intake can Business Recycling Collection Rate
be used to supply water to the Amberley scheme.
We introduced a mandatory business rate of $240 per year
$110,000 was budgeted for the installation of a duplicate for a recycling collection service from 1 July 2010. This
bore for the Leithfield Beach Township. This has not yet was to counter concern that businesses previously were
eventuated and alternative options to secure water supply able to opt out of contributing to the cost of recycling which
to the Leithfield Beach scheme are being considered placed an unfair burden on those who did pay.
before we take the drilling option. Delays have occurred
because of difficulties in obtaining resources as a result of Tsunami Warning System
demand on these due to the Canterbury earthquakes. The
project will continue into the 2011/12 year.
Tsunami disasters highlighted from around the world
in recent years have heightened people’s awareness of
The Amberley stormwater mitigation proposals were this potential hazard when living in coastal settlements.
consented in January 2011 but appeals lodged against Following public concern that there were no local tsunami
them were only resolved through Environment Court warning systems in place, we agreed to trial some at
mediation in September 2011, so no physical works (except Amberley Beach and Leithfield Beach. The systems
Lawcocks Road diversion) have as yet been carried out. were installed and have been tested. Further tests and
The delays caused by the consent process, coupled with evaluation will be done before installing more at other
the huge cost of that process has left Amberley exposed beach areas.
to further floods. We are addressing this issue urgently.
The Leithfield outfall pipeline was successfully completed Community Arts Councils’ Grant
to help with flooding prevention.
A new annual sum of $5,000 ($2,500 each) to the Amuri
Waitohi Reserve
and Hurunui Arts Councils to support their ongoing cultural
and arts activities was introduced and paid in July 2010.
We had planned to upgrade the Waitohi Reserve and put We are keen to support our local artists and promote the
aside $30,000 to do so, however, this has not yet occurred. continuation and growth of arts and culture in our district.
We received an application from a prospective lessee and
had advertised this intention as per the Reserves Act. Queen Mary Hospital Historic Reserve
This long process is nearing its conclusion and will enable
development of the site to continue with the construction An agreement with the Crown to vest approximately 5.5
of cabins and ablution facilities, over the next 12 months. hectares of the former Queen Mary Hospital site, with
The $30,000 has been carried over to the next financial three historic buildings, (Soldiers Block, Nurses Block and
year.
the Chisholm Block) in the Council as an historic reserve
was confirmed in June 2010. Part of the agreement was to
Woodlands Reserve
perform essential building refurbishment to prevent further
deterioration and undertake the necessary planning for
The Department of Conservation (DOC) offered to vest the buildings to be developed and made available for
the Woodlands Reserve in Jollies Pass Road, Hanmer appropriate commercial and community use. We spent
Springs in the Council for management purposes. $342,709 (of government funding) refurbishing the
Because this area is widely used by the community and Nurses Block; $228,946 refurbishing the Soldiers Block;
visitors, it is considered to be an asset to the district. We and $170,669 refurbishing the Chisholm Block. $39,695
put aside $15,000 for the maintenance of the old field was spent on the grounds maintenance and $36,450 on
office building in anticipation of agreeing to the vesting. planning related matters.
However, DOC has been unable to vest the land in Council
due to the value of assets on the property that they would In addition, the stakeholder group formed by the Council
have to write-off. Instead they signed a memorandum assisted with preparing the Draft Queen Mary Hospital
of understanding for joint management with the Council. Historic Reserve Management Plan which was notified on
6 August 2011. This Plan sets out the overall management
A management plan that sets out the responsibilities of goals of the reserve which aim to preserve and enhance
each agency has been developed but not finalised yet. The the special nature of this site. We aim to finalise the Plan
plan proposes joint use of the building with DOC retaining by the end of December 2011. We are currently looking to
a portion for their office and leasing the rest to Council for employ a consultant to market the three buildings for us.
a ‘peppercorn’. This could be sublet to generate some
income or retained for community purposes. DOC still
8
Annual Report - 1 July 2010 to 30 June 2011
School Active Warning Signs
We have been installing school active warning signs the water proportion of rates directly to us.
throughout the district. This year we installed four sets in
Cheviot, Culverden, Leithfield and Waiau. These have been Solid Waste
N
popular with teachers and parents as children often have to
IO
T
cross state highways to get to school. We are also working The Kate Valley Landfill is situated in the Hurunui
T
C
district but is a joint venture between Canterbury Waste
U
with schools to assist with alternative safety solutions
IN
D
through our road safety programme.
Services Limited and five Councils (Waimakariri, Selwyn,
O
R
Christchurch, Ashburton and Hurunui). The councils’
T
collective share is 50% and the company is called
IN
Shared Services
Transwaste Canterbury Limited.
Affordability and financial responsibility cuts across
everything we do to ensure we get maximum value for Rates
every dollar spent. At times, the most efficient way to
deliver services is through sharing with other Councils or We collect rates on behalf of the Canterbury Regional
organisations. Here are some examples of the shared Council (ECan) and in return, they pay us a fee and a
services we were involved with during the year:
proportion of the rating valuation cost. This income is
used to offset the cost of running our rates department.
ES
M
School and Community Libraries
O
Building Consents
C
T
For a number of years now, the Council has worked with
U
We have been working with the Selwyn District Council
O
the district’s three Area schools to share the school libraries
Y
to manage building consent applications and inspections
IT
with the community libraries. Through this joint effort,
N
between the two districts. This has enabled us to manage
U
the community has not had to pay for library buildings
M
and upkeep, and both the schools and community have when we have had more building consents than staff to
M
do the work, and vice versa. Whereas this started as an
O
benefited through having access to a larger collection of
C
books and other items, and having libraries open longer informal arrangement, we have since formalised this to
than they might if run individually. In the Amuri Area School, strengthen both building teams and enable a speedier
we also run our Council service centre from the library.
response.
MainPower Hurunui Natural Environment Fund
Last Words
The Council and Mainpower collaborate to provide an Each year we also face significant compliance costs. In
S
environment fund to encourage and reward people to the 2010/11 year we paid $89,000 to Audit New Zealand
T
alone, to audit this required Annual Report. Canterbury
EN
undertake projects to enhance and protect the natural
EM
environment. This fund has been awarded annually for Regional Council consent and monitoring charges, water
T
several years now and both parties contribute $4,000 each. quality monitoring costs, National Dog Database fees,
Remuneration Authority fees, and even music licence
L STA
IA
Economic Development
fees all add to the overall cost. The cost is growing and
C
N
unfortunately, as a result of adverse events, such as the
A
Our Council and the Waimakariri District Council jointly nationwide leaky buildings issue and the Canterbury
FIN
support and fund Enterprise North Canterbury (ENC) to earthquakes of 4 September 2010 and 22 February 2011,
help boost economic development in North Canterbury. We we expect even higher compliance costs next year. (The
contribute $50,000 per year to ENC to provide services in cost of compliance is discussed further in this Annual
our district. ENC work with businesses in both districts to Report.)
provide business support, development and training, and
S
N
run special projects with an economic focus.
Another significant cost during the year was for legal fees
IO
T
for advice and to defend or appeal plan change decisions
ISA
Roading
and resource consents and for Environment Court
N
A
costs. Examples where Council was forced to appear
G
R
We have an agreement with Waimakariri District Council for in the Environment Court to deal with appeals included
O
our respective roading contractors to maintain sections of the proposed Mt Cass wind farm and the Amberley
road in each others district where our common boundary stormwater consents. We spent $116,659 on legal fees
LLED
bisects the road. This is to avoid duplication and ensures plus a further $794,420 on other consultants during the
RO
T
efficiencies.
year. We were also involved in several complex planning
N
O
issues including: the Regional Policy Statement; the
Natural Resources Regional Plan, a submission to the
IL C
Water Supply
C
proposed National Policy Statement for Indigenous
N
U
We supply water from our Ashley Rural Water Scheme to Biodiversity (to protect the Council’s position); the
O
C
parts of the Waimakariri District including the towns of Ashley Meridian Wind Farm consent; the Hurunui Water Project
and Sefton. Approximately 1,650 Waimakariri ratepayers pay (the ‘no damming of the Hurunui River’ issue); the Hanmer
9


Hurunui District Council
Springs Plan Change regarding business and town centre Another area where we have been committed to improving
development; the Hanmer Springs Urban Growth Strategy our performance has been in developing a strong working
(including carparking and multiple dwelling units); and the relationship with Ngai Tahu, which includes Kaikoura
proposed Amberley shopping complex. In August 2010 Runanga, Tuahuriri Runanga, Te Runanga o Ngai Tahu
we granted a non-notified consent for variations for an (TRONT), and Ngai Tahu Holdings Ltd. During the year,
expanded supermarket in Amberley (first consented in we have met with Ngai Tahu representatives through
Febuary 2010). By the end of June 2011, the developers Council meetings or the Hurunui Waiau Zone Committee
still had not confirmed a supermarket tenant and had not meetings. We are working on communicating better on an
applied for building consents.
ongoing basis so that issues of mutual interest are known
and understood, which ultimately contributes to better
During the year we made organisational changes in our decision making.
engineering services department to refocus resources
on improving our performance, particularly in the utilities Finally, we hope you find the information in this end of year
and roading areas. We split the engineering functions report useful and informative. It has been a unique year
into two distinct areas so that now there is a separate and our sincere thanks go out to our elected members and
Roading and Utilities Department and an Amenities and members of our many committees, and to staff for their
Special Projects Department. Both are managed by dedicated commitment to their tasks and the district. Also,
separate senior managers who report directly to the Chief our heartfelt condolences to those of you who lost family
Executive Officer. This has provided us with the ability to members or friends during the earthquakes, or suffered
more closely scrutinise our roading contracts and apply serious property or business damage as a result.
more attention to water quality, stormwater assets, bridge
repairs and amenity needs throughout the district.
Winton Dalley
Andrew Dalziel
Mayor
Chief Executive Officer
10
Annual Report - 1 July 2010 to 30 June 2011
The Planning Cycle
The annual report is an important aspect of our planning
process. At the conclusion of each year, we are required to
account for how that year’s revenue was spent and to align
N
that with what we said we would do. The diagram below
IO
T
shows the various stages of our planning framework. The
T
C
annual report ‘reports’ on the year’s annual plan. The
UIN
D
annual plan comes from the ‘long term plan’ of which
O
R
community outcomes are an important aspect.
T
IN
ES
M
O
C
T
U
O
Y
Hurunui
IT
N
U
Long Term
M
M
O
C
Community Plan
Knowing what the Council is
doing to meet Community
Annual
Outcomes
Repor t
Knowing what the
S
T
Council achieved
EN
EM
T
L STA
IA
C
N
A
Community
FIN
Outcomes
Knowing what is important
Annual
for the future wellbeing of
S
Plan
our community
N
IO
T
Knowing how it
ISA
N
A
is going to be
G
R
paid for
O
LLED
RO
T
N
O
IL C
C
N
U
O
C
11
Hurunui District Council
How the Canterbury Earthquakes Affected Us
The Canterbury earthquakes on 4 September 2010, local initiatives to organise food, water and other local
22 February 2011 and 13 June 2011, and the ongoing resources to go into Christchurch. Our Communications
aftershocks, impacted on the Hurunui district in a variety Advisor worked in both the Christchurch and Waimakariri
of ways. Although the district did not suffer the severe Emergency Operation Centres to assist with media and
infrastructure damage experienced in Christchurch and public information.
the Waimakariri and Selwyn districts, there was still a
substantial amount of damage to buildings and property Our rural fire volunteers provided two crews on a rotating
throughout Hurunui. Most of this was damage to private shift pattern over a seven day period to assist with
assets rather than damage to Council’s public infrastructure. pumping operations for water and wastewater processes
Incredibly, we appeared to have no damage to our utilities in Christchurch. We offered the services of our roading and
infrastructure and experienced no disruption to our water utility engineers and water/ wastewater officers to assist
or sewer services. Similarly with our roads and bridges, with the initial response phase to the earthquakes, as well
we escaped relatively damage free.
as the start-up recovery process. We had two crews with
excavators working with the Waimakariri District Council.
Our building officers have been very involved in local Our administrative staff helped with telephone queries.
property inspections. Two houses in the district suffered
irreparable damage and needed to be replaced. We Our libraries experienced a huge increase of foot traffic
inspected approximately 30 to 40 chimneys with our and temporary borrowers. In response, we: increased
free earthquake chimney check offer. Most had damage our staffing at the Hanmer Springs library/service centre;
which ranged from minor cracking to major damage where used our libraries as collection points for Christchurch City
removal was required. There have been several building libraries items and then returned them to Christchurch;
consents to replace brick chimneys with lightweight made available a collection of cell-phone chargers and
structures and many consents to replace them entirely with multi-plugs (including international options) for customers;
new wood burners. The Earthquake Commission (EQC) waived overdue charges; assisted people affected by the
reported many more claims in our district than we had been earthquakes with their Red Cross application forms and
aware of. There have been aproximately 1000 claims in photocopied them for no charge; set up a collection point at
the Hurunui district. Several Council owned buildings Hanmer Springs for food donations for the North Brighton
received damage; the most serious being the Kowhai and Bexley suburbs of Christchurch; used community
Archives Society building (formerly the Balcairn County notice boards to post messages and information regarding
Council). Our building officers assisted in Christchurch where to access donated clothing, accommodation and
and Waimakariri in a number of other ways: involved in the food; provided free music and DVD loans to displaced
Christchurch ‘Operation Suburb’ project after the February persons; waived the temporary membership bond required
earthquake; house evaluation inspections in Waimakariri; by those who were not resident in the Hurunui; and we
and helped building officials to support the Christchurch waived hall charges for a Hanmer Springs fund raising
City Council and the recovery effort.
event for the earthquake.
We experienced a temporary influx in population following While most of our staff (82%) live inside the district, a
the September and then the February earthquakes with number do reside in Christchurch or have close relatives
people from Christchurch looking for refuge. Hanmer living there and were personally effected. We ensured
Springs was particularly busy with many holiday homes these people took care of their families and homes before
owned by Christchurch families. There was also a returning to work.
consistently high number of Christchurch residents staying
for short holidays or day trips. The Hanmer Springs library/ Impacts and Delays
service centre and the thermal pools and spa experienced
a significant increase in people using these facilities. Other As highlighted through this report, we experienced a
visitors stayed with family or friends throughout the district. number of delays to several services and to contracted
arrangements because of the extreme disruption caused
Our Emergency Management Officer assisted with by the earthquakes. A reoccurring theme has been the
emergency response duties in the Christchurch inability to access information still in the Christchurch
emergency operation centre for several weeks, including central business district ‘red zone’. Examples of services
assisting residents into the Christchurch city centre ‘red that were significantly delayed include:
zone’ to recover possessions from buildings. A number
of staff and volunteers from the district did shifts in both • The completion of the resident satisfaction survey by
the Christchurch and Waimakariri Emergency Operation
Opinions Market Research. This had commenced
Centres and Welfare Centres. We managed shift rosters
just prior to the 22 February 2011 earthquake and
for the Burnside Welfare Centre from Hurunui and
could not be resumed until April due to their office and
sent teams of people for various welfare duties. Our
associated work being in the red zone.
volunteers provided a Welfare Team for just over a week
as part of the 24 hour shift rosters for the Welfare Centres • Civil defence training exercises throughout the
in Christchurch. Volunteers also helped coordinate
district could not take place because our Emergency
Management Officer was involved in the real life
12
Annual Report - 1 July 2010 to 30 June 2011
earthquake emergencies. For the same reason, our
local civil defence plans have not been reviewed as
we had aimed to do.
N
IO
• Our ability to process all of our building consents within
T
20 working days was thwarted due to our building
T
CU
officers’ involvement in the earthquake aftermath.
IN
DORT
• We had great difficulty in recruiting building officers to
IN
the Hurunui because of the new work created through
extensive building damage in Canterbury. We had
two of our experienced small building team resign to
take up positions with the earthquake response. The
sudden demand for more building officers, particularly
in the Waimakariri district and Christchurch City limited
our ability to recruit replacement staff.
• We had more reported dog complaints than previous
years with excessive barking and dogs roaming the
Hurunui Memorial Library
ES
M
streets. We feel there was a strong correlation to the
O
earthquakes.
C
T
U
O
• The number of international and national visitors to
Y
the Hanmer Springs thermal pools and spa was well
IT
N
below our goal. This has been a trend felt by the
U
M
tourist sector in Canterbury since September 2010
M
(and also noted by the rest of the South Island). The
O
C
Christchurch Airport noted significantly less visitor
arrivals, and as the gateway to our district, had directly
impacted on us. A similar decline occurred with the
Hanmer Springs visitor information centre, with fewer
people seeking accommodation and tourism related
information.
• A number of contracted services were significantly
S
delayed, as we gave priority on our contractors
T
responding to emergency earthquake repairs in
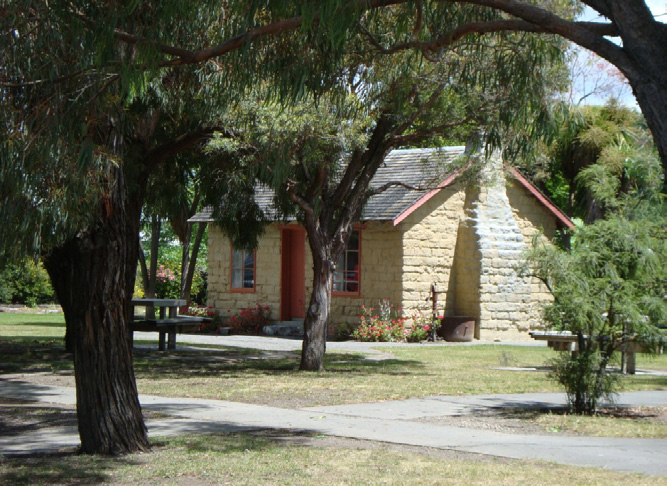
Cob Cottage
EN
Christchurch. For example, contractors were
EM
T
unavailable to complete work on the Amberley
Township and Hanmer Springs Township upgrades
L STA
according to previously agreed schedules.
IA
C
N
•
A
Some of our library initiatives were delayed or ceased
because the Christchurch City and the Waimakariri
FIN
District Councils libraries were either adversely
affected, or their resources reallocated to earthquake
work.
S
Financial cost
N
IO
T
There will be an ongoing financial impact because of the
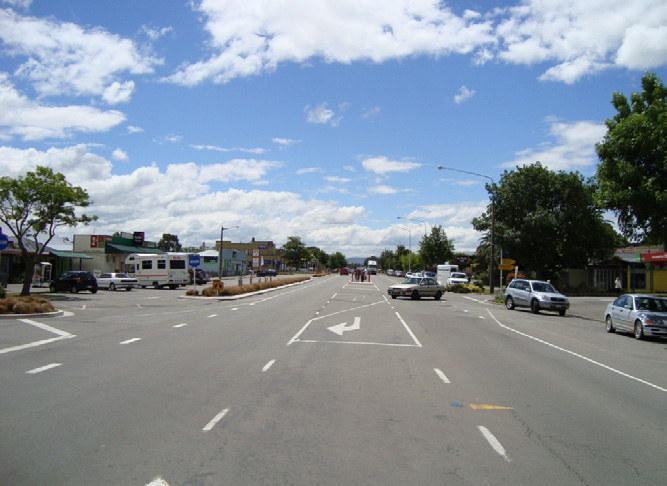
SH 1 looking North
ISA
N
severity of the damage caused by the earthquakes. We
A
G
now know that the cost of insurance has significantly
R
increased for the next financial year. However, we are a
O
Council that is comprehensively insured. We expect a
LLED
range of other services to increase in cost in the coming
RO
year due to the rebuild of Christchurch and other affected
T
N
towns. This will create demand in our sector for key
O
services such as building and engineering.
IL C
C
N
U
O
C
13
Hurunui District Council
Cost of Compliance
A significant amount of Council’s costs are attributable to Remuneration Authority
compliance with legislation and consent conditions. The
following is a listing of only some of the costs that Council The Remuneration Authority is responsible for determining
has incurred during the 2010/2011 financial year that relate the level of remuneration paid to the elected members
to compliance.
of the Council. The cost of the authority doing this is
apportioned to each Local Authority. For the 2010/2011
Compliance with the Local Government year, the cost to Council was $2,507.
Act 2002
Other Internal Costs
1. Costs in preparation of the Council’s 2011/2012
Annual Plan:
Each year, the Council is asked to complete numerous
surveys for Government Departments such as the Ministry
• External costs in developing and reporting
of the Environment, the Department of Internal Affairs,
on the community outcomes through an
Statistics New Zealand, NZTA and Archives New Zealand.
annual residents survey $20,715
In addition, the Council is required to supply information
when requests are received under the Local Government
• Staff and Councillor’s time in preparing and
Official Information and Meetings Act (LGOIMA). This
consulting on the Annual Plan estimated to be
normally involves staff time in researching issues relating
in excess of $250,000.
to the requests and preparing responses.
• As Council did not prepare any amendments
to the 2009-2019 LTCCP, there were no
additional auditing costs incurred.
2. Costs in preparation of the Council’s 2010/2011
Annual Report:
• Audit fees $89,000
• Staff time in preparing the Annual Report
estimated to be in excess of $120,000.
• In addition to the direct audit costs of Council,
the audit fees for Enterprise North Canterbury,
which Council holds a 50% investment, was
$6,639.
Compliance with Canterbury Regional
Council Resource Consents
Council has approximately 101 separate Resource
Consents with the Canterbury Regional Council with over
700 separate conditions to be complied with. During the
2010/2011 year the external costs were as follows:
• Environment Canterbury Consent Charges
$182,711
• Water Quality Testing Costs $74,418
National Dog Database
The Council is required to pay a share of the National Dog
Database to the Department of Internal Affairs. For the
2010/2011, the Council’s share was $2,344.
14

Annual Report - 1 July 2010 to 30 June 2011
Māori Decision Making
The Council and Ngāi Tahu, including our local Rūnanga*
*The Rūnanga are Te Rūnanga O Ngāi Tahu, Te Ngāi
representatives have been actively seeking ways to
Tūāhuriri Rūnanga and Te Rūnanga o Kaikōura.
improve our working relationship. Over the past year, we
N
have met with Ngāi Tahu representatives in our Council
IO
T
meetings and during Hurunui Waiau Zone Committee
T
CU
meetings. The experience of the Hurunui-Waiau Zone
IN
D
Committee, where Rūnanga representatives are members
O
R
of the committee, has shown the value of working together
T
on specific issues, water management in this case. At
IN
a recent meeting together, the Council and Rūnanga
agreed to look for similar opportunities to develop stronger
relationships by working together on other important
issues facing the community, rather than simply meeting
for the sake of it.
In July 2004, the Council entered into a memorandum of
Understanding (MOU) with Te Rūnanga O Ngāi Tahu, Te
ES
Ngāi Tūāhuriri Rūnanga and Te Rūnanga o Kaikōura. The
M
O
MOU was an agreement for us to work together to develop
C
T
appropriate processes that will allow Council to fulfil its
U
statutory responsibilities whilst recognising Ngāi Tahu
O
Y
as the tangata whenua. All parties to the MOU are very
IT
N
keen to find practical ways to keep each other informed on
U
M
issues of mutual interest. We have agreed that the MOU
M
O
is still a very valid document (with a few minor tweaks).
C
One of the main challenges the parties to the MOU have
is having enough resources to have meaningful dialogue
and input into projects of shared relevance. Rūnanga
have capacity limitations which restricts what they are
able to be involved in, and therefore, have to prioritise their
resources. Ultimately what we are aiming to do is to work
together for greater understanding and better decision
S
making for the good of the district.
T
EN
EM
T
L STA
IA
C
N
A
FIN
S
N
IO
T
ISA
N
A
G
R
O
LLED
RO
T
N
O
IL C
C
N
U
O
Mount Dunblane, Hanmer Springs
C
15


Hurunui District Council
Statement of Compliance and Responsibility
Compliance
The Council and management of the Hurunui District Council
hereby confirms that all the statutory requirements in relation
to the annual report, as outlined in the Local Government Act
2002, have been complied with, with the exception that the
Annual Report was not adopted by 31 October 2011 as per
section 98 of the Local Government Act 2002.
Responsibility
The Council and management of the Hurunui District Council
accept responsibility for the preparation of the annual Financial
Statements and the judgments used in them.
The Council and management of the Hurunui District Council
accept responsibility establishing and maintaining a system of
internal controls designed to provide reasonable assurance as
to the integrity and reliability of financial reporting.
In the opinion of the Council and management of Hurunui District
Council, the Annual Report for the year ended 30 June 2011
fairly reflects the financial position and operations of Hurunui
District Council.
Mayor
Chief Executive Officer
Financial Services Manager
Winton Dalley
Andrew Dalziel
Jason Beck
16
Annual Report - 1 July 2010 to 30 June 2011
Groups of Council Activities
Introduction
For each group of activities, the following information is
provided:
This section reports on the services (or activities) that the • A summary for the group of activities on its overall
N
Council provides. In other words, what the Council actually
IO
performance.
T
does. All of the services are summarised and assigned to • The Community Outcomes to which the group of T
C
groups of Council activities. The groups of activities are as
U
activities primarily contributes.
IN
D
follows:
O
• Performance measures and results for each of the
R
T
(1) Community Services and Facilities
services within the groups of activities.
IN
1.1 Library
• An explanation for any significant variations or
deviations from the intended levels of service or
1.2 Township Facilities
acquisitions or replacements of assets as set out in
1.3 Property
the 2010/11 Annual Plan.
• Financial summaries for each group of activities
1.4 Public Toilets
and the individual services within the groups. The
1.5 Cemeteries
summaries compare the actual and the budgeted
revenue, expenditure and capital as projected in the
1.6 District Parks and Reserves
2010/11 Annual Plan.
ES
M
1.7 Grants and Service Awards
O
C
T
U
(2) Environment and Safety
O
Y
2.1 Resource Management / Planning
IT
N
U
2.2 Civil Defence
M
M
O
2.3 Rural Fire
C
2.4 Building Compliance
2.5 Public Health and Liquor Licensing
2.6 Animal Control
(3) Growth and Development
3.1 Tourism
S
T
EN
3.2 Visitor Information Centre
EM
T
3.3 Economic Development
L STA
(4) Utility Services / Infrastructure
IA
C
N
4.1 Roading Network
A
4.2 Waste Minimisation
FIN
4.3 Sewerage
4.4 Stormwater / Drainage
4.5 Water Supplies
S
N
IO
(5) Hanmer Springs Thermal Pools and
T
ISA
N
Spa
A
G
R
5.1 Hanmer Springs Thermal Pools and Spa
O
(6) Governance
LLED
RO
T
6.1 Governance
N
O
IL C
C
N
U
O
C
17
Hurunui District Council
Overall Comparison with the 2010/2011
Annual Plan
Performance:
No major variance from the strategic directions from
the Hurunui Long Term Community Plan. The Council
recorded a Net Surplus after Tax of $6,292,000 whereas
the budgeted surplus after tax for the 2010/2011 year in
the Annual Plan was $1,131,000.
Revenue:
Operating Revenue was $6,578,000 greater than predicted
in the Annual Plan due to the value of Vested Asset Income
resulting from the vesting of the Queen Mary Hospital land
and buildings, which was $6,298,000.
Operating Expenditure:
Operating Expenditure was $1,510,000 greater than was
predicted in the Annual Plan, the key variances being:
• Additional costs of $514,000 in Utility Services and
Infrastructure due to emergency reinstatement of
areas of the roading network affected by the significant
rain events in July and August 2010. In addition, an
extra $181,000 was spent on consultants relating to
stormwater resource consents.
• Additional costs of $243,000 were incurred in Council
defending the appeal made by Mainpower on the
declined resource consent for a windfarm on Mt Cass.
• Additional operating costs of $282,000 incurred at the
Hanmer Springs Thermal Pools and Spa as a result
of the expansion work completed prior to Christmas
2010, which was offset by the additional revenue
earned.
Capital Expenditure
Total Capital Expenditure for the year was $24.8 million
as opposed to the budget of only $12.4 million. The keys
reasons for this result are:
• The $6.3 million of land and buildings from the former
Queen Mary Hospital site that were vested in Council
were not budgeted for.
• The expansion of the Hanmer Springs Thermal Pools
and Spa was completed during the 2010/2011 financial
year. The additional $3.2 million of costs recognised
over budget was for part of the project that was carried
forward from the prior year.
• The new Medical Centre at Rotherham was completed
during the 2010/2011 year. The capital expenditure of
$1.2 million was budgeted for in the prior year and
the funds had been carried forward to complete the
project.
• Town centre upgrades in Amberley and Hanmer
Springs were undertaken during the year. Both
projects used funds that were budgeted for in the prior
year and carried forward into the 2010/2011.
18
Annual Report - 1 July 2010 to 30 June 2011
1. Community Services and Facilities
The individual activities (services)
are: the $91,000 paid to NZTA as a contribution towards
within this section include:
the maintenance of the Waiau Ferry Bridge and the loss on
sale of $151,000 recognised for the sale of the Rotherham
N
Medical Centre. This is offset by the full budget from the
IO
1.1
Library
T
C
1.2
Township Facilities
contestable funding for reserves being under spent by
U
$89,000 at year end.
D
1.3
Property
RO
1.4
Public Toilets
T
1.5
Cemeteries
Capital Expenditure ended the year $9.5 million ahead
IN
1.6
Reserves
of the budget. The key variances are: the value of the
1.7
Grants and Service Awards
land and buildings vested to Council as a result of the
vesting from the Queen Mary Hospital site, along with
Achievement of Levels of Service
the urgent upgrade work, which was carried forward from
the 2009/2010 year. In addition, the Council completed
Each of the activities listed above have a range of the Medical Centre and Rotherham and the Town Centre
performance measures to describe the service targets we Upgrades of Amberley and Hanmer Springs, all of which
were aiming for. These are set out in the following pages were budgeted for in previous years and carried forward.
with a commentary on how we had performed at the end There was also an additional $118,000 spent on Public
ES
S
M
Toilets in Culverden that was not previously budgeted for.
IE
of year (the result).
O
C
IT
T
U
IVT
Significant Acquisitions or Replacement
Community Outcomes to which this Group O
CY
A
of Activities Primarily Contribute
IT
of Assets
N
IL
U
C
M
N
Town Centre upgrades in both Amberley (total cost this A Desirable Place to Live, Work and Play:
M
U
O
O
year of $584,358) and Hanmer Springs (total cost this year
C
C
• strong sense of community that gives people a sense
of $1,744,638) were completed during the financial year.
of belonging and encourages them to take part in local
In addition, the new Medical Centre at Rotherham was
activities, to support essential volunteer services,
completed at a total cost this year of $1,104,790 and also
and to be involved in local consultation and decision
the land and buildings from the Queen Mary Hospital site
making
were formally vested in Council in August 2010, the value
of the asset vested was determined at $6,298,000, with a • attractive, well designed villages that present a positive
further $742,000 of capital expenditure recognised during
image encouraging people to live in and visit the area
S
the year.
T
• opportunities in leisure, art and cultural activities
EN
• effective planning for future development but ensuring
EM
The significant variation from the Annual Plan was
T
that Queen Mary Hospital land and buildings vested of
the preservation of local heritage and rural uniqueness
$6,298,000 were not identified, however the Town Centre
L STA
IA
Upgrades and the new Medical Centre at Rotherham were
C
N
budgeted for in prior years, with those funds being carried
A
forward for the completion of the projects in the 2010/2011
FIN
year.
S
Significant Variations between Actual
N
IO
Result and Annual Plan 2010/11
T
ISA
Projections
N
A
G
R
Total revenue was $6,384,000 higher than the budget for
O
the year. The key reason is the value of the Vested Assets
resulting from the vesting of the land and buildings from the
LLED
Queen Mary Hospital site of $6,298,000.
RO
T
N
O
Total Operating Expenditure was up on the budget by
IL C
$149,000 for the year. The key reasons for the variance
C
N
U
O
C
19
Hurunui District Council
Financial Detail:
2010/2011
2010/2011
2009/2010
Actual
Budget
Actual
Community Services & Facilities (Summary)
Operating Statement
OPERATING REVENUE
Rates
1,576,221
1,547,094
1,541,428
Other Income
838,444
637,086
2,200,787
Internal Interest Received
108,864
92,619
78,659
Development Contributions
172,265
331,972
157,595
Vested Assets
6,297,580
0
0
Council Overheads (Income)
51,838
51,938
51,838
Total Operating Revenue
9,045,212
2,660,709
4,030,307
OPERATING EXPENDITURE
Employment Costs
616,359
661,222
579,910
Other Direct Expenditure
2,043,636
1,783,166
1,850,007
Internal Interest Paid
179,311
264,302
94,087
Council Overheads
800,648
800,638
595,601
Depreciation
353,342
334,470
346,032
Total Operating Expenditure
3,993,298
3,843,798
3,465,637
Operating Surplus (Deficit)
$5,051,914
($1,183,089)
$564,670
CAPITAL EXPENDITURE
Library
61,944
61,107
58,859
Township Facilities
3,786,596
1,120,582
1,112,521
Property
23,576
51,350
318,196
Public Toilets
117,838
0
88,834
Cemeteries
8,267
5,135
0
District Reserves
6,900,000
188,187
227,248
Grants & Service Awards
0
0
0
Total Capital Expenditure
$10,898,222
$1,426,361
$1,805,657
20
Annual Report - 1 July 2010 to 30 June 2011
1.1 Library
Goal:
To provide a service that will support the community to meet and extend their educational,
recreational, cultural and information needs.
N
Performance Measures
IO
T
C
U
How Council Wil
D
Target
What we wil do towards
Know we have met
End of year result
RO
achieving the target
T
our target
IN
Customers
Undertake an annual
At least 90% of
The annual residents’ satisfaction survey was undertaken by
are satisfied
residents satisfaction
residents are
Opinions Market Research and commenced in February 2011.
with the library survey
satisfied with the
The completion was delayed due to the Canterbury earthquake
service
library service
and ended in May. The survey results confirmed that there is a
growing trend of increased satisfaction with the library service.
In 2011 the result was 84% satisfaction over all (96% from those
who use the library). In previous years, the overall result has
been 81% in 2010 and 77% in 2009.
ES
S
Ensure the library
A minimum of
We do not have the means to measure the number of times our
M
IEO
collection meets
85% of customers
customers have used their library card as the current Library
C
IT
T
the needs of the
have used their
Management System is not able to provide these numbers. We
U
IVT
community
library card at least have undertaken a project of deleting our “Gone No Address”
O
C
Y
biannually
borrowers and this has resulted in a decrease in borrower
AIT
numbers overall. Our current library membership throughout the
N
IL
U
C
Hurunui district is 8,171. (This number is a little inflated as school
M
N
M
U
children with both a library and school library card are counted
O
O
twice.) The new library management system to be installed in
C
C
2012 will be able to produce better information about borrowers.
Audio (talking)
We have worked with other libraries throughout NZ to assess
books-investigate
pricing and purchasing options to enable us to offer this service
options for
to Hurunui customers. Through a joint purchase consortium with
customers to
other libraries, from September 2011, library customers are able
download talking
to download e-books or audio books at no charge. Although
books to MP3
we were aiming to have this type of service available earlier, it
S
T
players or other
made economic sense to work with the other libraries to get price
EN
technology
advantage rather than go alone and to spend more. At this stage,
EM
this free electronic collection is predominately adult fiction, but
T
next year we will purchase children and young adult fiction, and
continue to grow the collection thereafter.
L STA
IA
C
N
Library
Join with other NZ
System installed
The investigation into purchasing a modern library management
A
technology is libraries to purchase
(dependent on
programme with other libraries throughout New Zealand has
FIN
available in
a new NZ based
affordability and
been successfully completed. Through a joint purchase, we have
our libraries
Library Management
availability)
been able to purchase a system at a significantly reduced price
to support
Software programme
than if we had purchased this alone. The new programme will
a relevant
to replace the current
be rolled out to the libraries involved in the joint purchase and
service
outdated programme
Hurunui should receive it in the first half of 2012. This will enable
S
for our
better management and information about borrowing, customer
N
communities
preferences and a host of information that will enable us to better
IO
T
manage our library resources. $30,000 has been put into the
ISA
2011/12 library budget for the purchase of this software which
N
A
meets what we planned to do if the purchase could not be made
G
out of the existing library budget.
R
O
LLED
RO
T
N
O
IL C
C
N
U
O
C
Achieved
Almost Achieved or not measured
Not Achieved
21
Hurunui District Council
Target
What we wil do towards
How Council Wil Know
achieving the target
we have met our target
End of year result
Enhanced
Library customers are able to do a range of actions on line
interactive online
from their own homes through the library website. Of note, is
features for
access to community information through a programme called
customers
CINCH (Community Information Christchurch). This programme,
established by the Christchurch libraries, was extended to
Hurunui in 2010 and it contains information about all known
groups and organisations within the district. This is easily
accessed for free and the community is encouraged to add new
information and updates.
Online forms
Completed as part of the new Hurunui District Council website
available for
which became ‘live’ in the latter half of 2010. Customers are able
customers
to make requests, order books, and make any suggestions online.
Reciprocal
Work with other
Hurunui library
We have an agreement with Selwyn and Waimate Libraries for
borrowing
libraries in the
card holders
our customers to borrow from them at no charge. Discussions
privileges
Canterbury region
can borrow from
have been held with other libraries, but progress has not occurred
with other
to enable reciprocal
other Canterbury
at the speed we had hoped for, largely due to disruption on
libraries
borrower rights to
libraries
account of the Canterbury earthquakes in 2010/11. We have
their libraries for
offered free library membership to Christchurch city residents
Hurunui library
who are temporarily relocated in the Hurunui due to the February
customers
earthquake. Normally, there would be a fee for people who are
not normally resident.
To have
Collaborate with
Local history items We undertook a digital project called the “Kete” which is a web
access to
organisations and
are digitised and
based programme to store photos and stories electronically. To
local history
groups involved in
available to all
get the project up and going, we received funding from Work and
resources
collecting and storing
(subject to external Income to fund a temporary employee for 6 months. Work was
within the
local history items
funding)
undertaken with Cheviot Museum, Waipara Historical Society,
Hurunui
Hanmer Springs Archives and Kowai Archives to load historical
District
information onto the Kete. Over the 6 months, 69 topics, 1,310
images, 14 documents, 5 web links and 7 audio files were added.
This tool is now available to anyone who wants to add information.
Part of the project included training others how to use and load
information onto the programme. The link to this programme is
http://ketehurunui.peoplesnetworknz.info/.
Volunteers
Volunteers are
No less than one
One of our librarians is assigned to training and providing
continue to
encouraged and
training/information information to our volunteers in each of our libraries. This
be involved
provided with training
session is held
generally takes place through volunteer meetings held monthly
in the
each year
throughout the district. Volunteers are either briefed or trained at
Hurunui
these meetings, on new services being offered through the library.
District
New volunteers are provided with on the job training. An example
libraries
of a new service is the Kete and CINCH.
Volunteer numbers Volunteer numbers have remained fairly constant throughout the
remain constant
district, with variations occurring within certain locations. Despite
in each of the 8
these small variations, over the past 5 years, there has been little
libraries in the
change in that time. The current number of our volunteers, which
District
are consistent with previous years, are 160 district wide (Amberley
= 44, Amuri = 17, Cheviot = 15, Hanmer Springs = 16, Waiau = 17,
Leithfield = 12, Greta Valley = 18, and Hawarden = 21).
Achieved
Almost Achieved or not measured
Not Achieved
22
Annual Report - 1 July 2010 to 30 June 2011
Financial Detail:
2010/2011
2010/2011
2009/2010
N
IO
Actual
Budget
Actual
T
C
U
D
Library
RO
T
Operating Statement
IN
OPERATING REVENUE
Rates
35,206
29,775
34,200
Other Income
54,611
50,528
51,919
Development Contributions
25,246
43,374
23,361
Total Operating Revenue
115,063
123,677
109,479
OPERATING EXPENDITURE
Employment Costs
345,450
324,518
339,158
Other Direct Expenditure
103,961
132,531
139,962
Internal Interest Paid
19,637
21,535
22,432
Council Overheads
269,235
269,233
160,219
ES
S
M
IE
Depreciation
97,108
106,665
97,281
O
Total Operating Expenditure
835,391
854,482
759,052
C
IT
T
Operating Surplus (Deficit)
($720,328)
($730,805)
($649,573)
U
IVT
O
C
Y
A
CAPITAL EXPENDITURE
IT
Library
61,944
61,107
58,859
N
IL
U
C
Total Capital Expenditure
$61,944
$61,107
$58,859
M
N
M
U
O
O
C
C
S
T
EN
EM
T
L STA
IA
C
N
A
FIN
S
N
IO
T
ISA
N
A
G
R
O
LLED
RO
T
N
O
IL C
C
N
U
O
C
23
Hurunui District Council
1.2 Township Facilities
Goal:
To ensure that local communities have suitable amenities and that townships are well-maintained.
Performance Measures
Target
What we wil do towards How Council Wil Know we
achieving the target
have met our target
End of Year Result
Provide and
Provide medical
Each rural medical
General practitioners are employed at each of the rural
maintain buildings buildings to at ract
practice has a
medical centres in the District. Buildings to accommodate
to support
primary health
practising general
medical practices are owned by the Council in Cheviot,
activities and
professionals in rural
practitioner
Rotherham, Hanmer Springs and Waikari. A new medical
recreational
areas
centre was completed in June 2011 in Rotherham to replace
needs for local
the former medical centre there.
communities
Upgrade hals in
Upgrade the Amberley The first stage of the upgrade was completed during the 09/10
response to community Domain Pavilion
year, with new and improved kitchen and ablution facilities. A
needs
tender was accepted in May 2011 and the second stage of
the upgrade to extend the hall to accommodate a permanent
stage has commenced after essential roof strengthening
was undertaken. It had been hoped to have fully completed
the upgrade by the end of June 2011, however this was not
possible. It will be done by the end of the 2011 calendar year.
Undertake an annual
90% of residents
The annual residents’ satisfaction survey results confirmed
residents satisfaction
surveyed consider the that there is a 90% level of satisfaction with the standard
survey
standard of hals to be of local halls from those who use the halls. Using levels of
satisfactory
satisfaction results for the halls overall (including those who
do not use them), there is a 78% result. This figure is showing
an upward trend compared with previous years (2010 76%,
2008 68%, 2007 67%).
Maintain the
Employ staf and
Contracts monitoring
General maintenance, gardening, cleaning and mowing work
townships to
contractors to
records confirm work
was carried out in every urban area and monthly claims by
ensure they
undertake cleaning,
done as per contract
contractors were reviewed and processed as appropriate.
appear neat and
gardening and
specifications
Checks on contracts confirmed work is being done as per the
tidy
maintenance work
contract specifications.
Undertake an annual
90% of residents
The annual residents’ satisfaction survey results confirmed
residents satisfaction
surveyed consider the that there is a 66% level of satisfaction with the standard of
survey
standard of footpaths
public footpaths. This is slightly lower when compared with
to be satisfactory
previous years (2010 74%, 2009 68%, 2008 65%). This result
will be considered to decide whether there needs to be a
higher level of service and possibly a larger budget assigned
to footpaths in the Council’s Long Term Plan 2012/22.
Achieved
Almost Achieved or not measured
Not Achieved
24
Annual Report - 1 July 2010 to 30 June 2011
N
Financial Detail:
IO
T
C
U
D
2010/2011
2010/2011
2009/2010
RO
Actual
Budget
Actual
T
IN
Township Facilities
Operating Statement
OPERATING REVENUE
Rates
1,420,466
1,397,004
1,375,672
Other Income
414,600
203,539
241,450
Internal Interest Received
31,837
31,458
51,966
Development Contributions
103,956
208,023
113,296
Total Operating Revenue
1,970,859
1,840,024
1,782,385
ES
S
M
OPERATING EXPENDITURE
IEO
Employment Costs
185,872
210,913
180,746
C
IT
T
Other Direct Expenditure
966,587
733,991
821,321
U
IVT
Internal Interest Paid
159,674
242,767
71,655
O
C
Y
Council Overheads
130,023
130,008
145,274
AIT
Depreciation
131,003
114,792
129,593
N
IL
Total Operating Expenditure
1,573,160
1,432,471
1,348,590
U
C
M
N
Operating Surplus (Deficit)
$397,700
$407,553
$433,795
M
U
O
O
C
C
CAPITAL EXPENDITURE
Amberley Ward
706,745
369,720
533,240
Amuri Ward
5,384
49,013
98,162
Cheviot Ward
0
20,000
15,228
Glenmark Ward
39,070
0
28,177
Hanmer Springs Ward
1,816,638
665,849
311,742
Hurunui Ward
5,499
16,000
25,525
Medical Centres
1,213,259
0
100,447
Total Capital Expenditure
$3,786,596
$1,120,582
$1,112,521
S
T
EN
EM
T
L STA
IA
C
N
A
FIN
S
N
IO
T
ISA
N
A
G
R
O
LLED
RO
T
N
O
IL C
C
N
U
O
C
25
Hurunui District Council
1.3 Property
Goal:
To ensure that venues meet social, recreational, economic and cultural needs of the local community.
Performance Measures
Target
What we wil do towards How Council Wil Know we
End of Year Result
achieving the target
have met our target
Maintain
Council owned
Undertake a property
Fulton Hogan Property Division was engaged to undertake
Council owned
premises have a 95%
review on Council
inspections and establish a maintenance programme for al Council
properties so
occupancy rate
owned properties
owned buildings/property. Council staf are working through and
that they are
to establish a
organising work to be completed as per the report for district rated
safe and fit for
maintenance
building and some localy rated building. Reserve and Hal commit ees
purpose
programme
are working through the schedule of repairs as recommended in the
report and reporting back to Council on progress.
Improved heating
A budget provision was put aside to install heat pumps,
and insulation in older
ceiling insulation and double glazing into all of the Council’s
Pensioner Units
pensioner housing units. Following installation of heat pumps
and ceiling insulation, double glazing was investigated but no
progress was made because the original quote was in excess
of the budget allocated. Consideration was then given to
double glazing just the main living areas of units i.e.: lounge
and bedroom. A revised quote was received, but was still
higher than the allocated budget, so further quotations are
being obtained and the budget will be carried over into the
next financial year.
Council owned
The council pensioner units currently have an occupancy
premises have a 95%
rate of 100%. All other Council owned buildings/houses that
occupancy rate
can be let are fully occupied, hence they also have a 100%
occupancy rate.
To ensure that
Regularly review leases Al buildings not
All surplus land and building are leased out. No buildings are
al Council
and property portfolios
required by Council or
vacant.
owned property
the public are leased
not required for
out within 6 months of
Council or public
being vacant
use is leased out
2010/2011
2010/2011
2009/2010
Financial Detail:
Actual
Budget
Actual
Property
Operating Statement
OPERATING REVENUE
Rates
13,469
13,421
36,712
Other Income
292,971
275,319
317,675
Council Overheads (Income)
51,838
51,938
51,838
Total Operating Revenue
358,278
340,678
406,224
OPERATING EXPENDITURE
Employment Costs
30,516
17,442
17,152
Other Direct Expenditure
302,971
183,385
191,050
Council Overheads
54,462
54,463
42,059
Depreciation
94,336
85,388
89,242
Total Operating Expenditure
482,285
340,678
339,504
Operating Surplus (Deficit)
($124,006)
$0
$66,721
CAPITAL EXPENDITURE
Pensioner Housing
0
51,350
293,053
Residential Housing
0
0
0
Other Property
23,576
0
23,576
Depots
0
0
1,567
Total Capital Expenditure
$23,576
$51,350
$318,196
26
Annual Report - 1 July 2010 to 30 June 2011
1.4 Public Toilets
Goal:
To provide and maintain public toilets at strategic localities throughout the District
N
Performance Measures
IO
T
C
U
How Council Wil Know we
D
Target
What we wil do towards
achieving the target
have met our target
End of Year Result
RO
T
IN
To have wel
Employ staf and
Contracts monitoring
Contracts are regularly monitored by Council officers to ensure that
maintained
contractors to maintain
records confirm work
the conditions of the contracts are adhered to. There were no issues
public toilets
and clean the Districts
done as per contract
of non compliance.
located in each
public toilets
specifications
of the main
townships
Investigate complaints
Al complaints are
The Council’s “customer service request system” logs all
about the standard of
folowed up within 48
complaints and ensures rapid response. All complaints are
the toilets
hours
acted on immediately and mostly resolved within the 48 hours.
At times, delays occur when we require a particular type of skill
ES
S
to do a job. For example, the hand dryer in the Gore Bay toilets
M
IE
was not fixed for three days as we could not get an electrician
O
C
IT
earlier than that. This type of situation is rare.
T
U
IVT
O
C
Y
Undertake an annual
85% of residents who
The annual residents’ satisfaction survey results confirmed
AIT
residents satisfaction
have used the public
that there is a 90% level of satisfaction with the standard of
N
IL
U
C
survey
toilets are satisfied
public toilets from those who use them. When using overall
M
N
levels of satisfaction (which includes those who do not use
M
U
O
O
local public toilets), the level of satisfaction is lower at 80%.
C
C
This is a consistent result when compared with previous years
(2010 78%, 2009 78%, 2008 82%).
Financial Detail:
S
2010/2011
2010/2011
2009/2010
T
Actual
Budget
Actual
EN
EM
T
Public Toilets
L STA
Operating Statement
IA
C
N
OPERATING REVENUE
A
Rates
0
0
0
FIN
Other Income
0
0
0
Total Operating Revenue
0
0
0
OPERATING EXPENDITURE
Employment Costs
3,928
0
3,522
Other Direct Expenditure
251,954
252,158
269,611
S
Council Overheads
44,250
44,248
28,626
N
Depreciation
30,729
27,425
29,748
IO
T
Total Operating Expenditure
330,861
323,831
331,507
ISA
Operating Surplus (Deficit)
($330,861)
($323,831)
($331,507)
N
A
G
CAPITAL EXPENDITURE
R
Public Toilets
117,838
0
88,834
O
Total Capital Expenditure
$117,838
$0
$88,834
LLED
RO
T
N
O
IL C
C
N
U
O
C
Achieved
Almost Achieved or not measured
Not Achieved
27
Hurunui District Council
1.5 Cemeteries
Goal:
To provide peaceful, aesthetically pleasing and accessible cemeteries within the Hurunui District.
Performance Measures:
Target
What we wil do towards How Council Wil Know we
achieving the target
have met our target
End of Year Result
To have
Plan and assess for
Cemetery records
Plot availability is keeping up with demand. 48 plots were sold over
sufficient plots
plot demand and
verify availability
the year to 30 June 2011. Available plots and the number sold over
available in al
acquire and designate
keeping up with
the past year are detailed in the table below.
wards to meet
land accordingly
demand
Cemetery
Cremation
Burial
Plots to be
Plots
current and
name
plots available
plots
developed
sold
future demands
available
Balcairn
6
256
508
17
Hanmer
Springs
10
85
451
5
Culverden
30
299
0
4
Glenmark
7
42
945
7
Waiau
11
53
280
1
Homeview
7
72
134
7
Horsley
Down
0*
163
285
4
Waikari
21
848
0
2
Rotherham
0*
380
0
1
* there is no provision for separate cremation plots at Horsley Down
and Rotherham, but people can stil buy regular plots for cremation
purposes.
To ensure that
Contract gardeners,
Contracts monitoring
General maintenance, gardening, and mowing work was
cemeteries are
ground-keepers and
records confirm work
carried out in every cemetery and monthly claims by contractors
wel-maintained
sextons to maintain
done as per contract
were reviewed and processed as appropriate. There were no
and aestheticaly cemeteries
specifications
issues of non compliance with contracts.
pleasing
Undertake an annual
90% of residents
The annual residents’ satisfaction survey results confirmed that
residents satisfaction
surveyed who have
there is a 93% level of satisfaction with the standard of the district’s
survey
visited a cemetery
cemeteries from those who visit the local cemeteries, but 68% overal
consider the standard
(including those who do not visit the cemeteries). The overal result
to be satisfactory
has fluctuated over the past years (2010 60%, 2009 76%, 2008 76%).
Achieved
Almost Achieved or not measured
Not Achieved
28
Annual Report - 1 July 2010 to 30 June 2011
N
Financial Detail:
IO
T
C
U
D
2010/2011
2010/2011
2009/2010
RO
Actual
Budget
Actual
T
IN
Cemeteries
Operating Statement
OPERATING REVENUE
Rates
0
0
0
Other Income
39,692
51,350
55,873
Total Operating Revenue
39,692
51,350
55,873
OPERATING EXPENDITURE
Employment Costs
17,174
33,109
13,141
ES
S
M
Other Direct Expenditure
78,842
84,625
73,907
IEO
Council Overheads
57,300
57,302
41,585
C
IT
T
Depreciation
167
200
167
U
IVT
Total Operating Expenditure
153,483
175,236
128,800
O
C
Y
Operating Surplus (Deficit)
($113,791)
($123,886)
($72,927)
AITN
ILU
C
CAPITAL EXPENDITURE
M
N
Cemeteries
8,267
5,135
0
M
U
Total Capital Expenditure
$8,267
$5,135
$0
O
O
C
C
S
T
EN
EM
T
L STA
IA
C
N
A
FIN
S
N
IO
T
ISA
N
A
G
R
O
LLED
RO
T
N
O
IL C
C
N
U
O
C
29
Hurunui District Council
1.6
Reserves
Goal:
To ensure the District’s Reserve network is well maintained and developed to a standard and purpose
that people can enjoy
Performance Measures
Target
What we wil do towards How Council Wil Know we
achieving the target
have met our target
End of Year Result
To care for parks Working toward
Projects are
There were no major projects planned for 2010/11, but minor work,
and reserves for achieving the actions
undertaken annualy
such as routine maintenance was done in accordance with the
residents and
set out in the Reserves
in accordance with the Reserve Management Plan.
visitors to enjoy
Management Plan
Plan
Involve local
Contestable funding
The Council allocated $50,000 for reserve improvements in
communities and
is spent each year on
the 2010/11 year budget and called it a ‘contestable fund’.
reserve commit ees
reserve improvements
The fund was split equally between 6 communities of interest
in the planning and
(included the five Wards with the Amuri – Hurunui Ward being
developing of their
treated as two communities). Therefore, each area had
reserves
$8,333 to allocate to projects at their discretion. The relevant
committees decide on how the funds are to be allocated and
if it is not spent, it is carried forward to following years to
complement future years funding. There was $80,658 carried
forward from the 2009/2010 and was added to the $50,000
allocation for the 2010/2011 year. A total of $49,851 was spent
in the 2010/2011 year, leaving $80,807 to be carried forward
into the 2011/2012 year. To prepare for next year, consultation
with Ward and Reserve Committees is being carried out
to review the District Reserves Management Plan. Each
committee has been asked to set priorities for improvements
and plans to spend their share of the fund.
Undertake an annual
The standard of
The annual residents’ satisfaction survey results confirmed a
residents satisfaction
parks and reserves
very high level of satisfaction for those who use local parks and
survey
is considered to be
reserves at 94%, and 91% satisfaction overall including those
satisfactory by 85% of who do not use these facilities. This is showing an upward
residents
trend compared with previous years (2010 85%, 2009 83%,
2008 80%).
To have plans
Develop a strategy
A management plan A stakeholder group was established to prepare a draft
in place for the for the management
is in place
management plan for the reserve on the ex Queen Mary
development
and development of
land. The Council’s Ward and Reserve Committees have had
of new and
the ex Queen Mary
the opportunity to provide feedback on the draft Plan before
existing
reserve in Hanmer
it was released for public consultation. The reserve is now
reserves
Springs Reserve
formally known as the Queen Mary Hospital Historic Reserve.
The Draft Management Plan has been publically notified and
submissions close in October. Although the draft plan is in
place, we did not met the target of completing the final plan
within the 2010/11 year, but are on track for completing this
before the end of the 2011 calendar year.
Achieved
Almost Achieved or not measured
Not Achieved
30
Annual Report - 1 July 2010 to 30 June 2011
N
IO
T
Financial Detail:
C
U
2010/2011
2010/2011
2009/2010
D
Actual
Budget
Actual
RO
T
IN
Reserves
Operating Statement
OPERATING REVENUE
Rates
0
0
0
Other Income
15,789
30,810
1,513,083
Internal Interest Received
77,027
61,161
26,693
Development Contributions
43,063
85,575
20,939
Vested Assets
6,297,580
0
0
ES
S
Total Operating Revenue
6,433,459
177,546
1,560,714
M
IEOC
IT
OPERATING EXPENDITURE
T
Employment Costs
33,166
71,480
26,061
U
IVT
Other Direct Expenditure
239,820
289,704
263,650
O
C
Y
A
Council Overheads
228,478
228,482
158,262
IT
N
IL
Total Operating Expenditure
501,464
589,666
447,973
U
C
Operating Surplus (Deficit)
$5,931,995
($412,120)
$1,112,742
M
N
M
U
O
O
CAPITAL EXPENDITURE
C
C
District Reserves
6,900,000
188,187
227,248
Total Capital Expenditure
$6,900,000
$188,187
$227,248
S
T
EN
EM
T
L STA
IA
C
N
A
FIN
S
N
IO
T
ISA
N
A
G
R
O
LLED
RO
T
N
O
IL C
C
N
U
O
C
Achieved
Almost Achieved or not measured
Not Achieved
31
Hurunui District Council
1.7 Grants and Service Awards
Goal:
To encourage individuals to realise their potential and to reward voluntary work that benefits the
community and/or the natural environment
Performance Measures
Target
What we wil do towards
How Council Wil Know
End of Year Result
achieving the target
we have met our target
To reward
Advertise and promote
Grants are awarded in al categories:
and recognise
the availability of grants
outstanding
and awards
Secondary Education
This award was presented in December 2010. There were 13
contribution
School Achievers
applications and 7 were successful recipients of grants totaling
and initiatives
$10,000. This is the ful alocation of funding for the year.
from individuals
and community
members
Community Service
Community Service awards were presented in June 2011 by the
Council. There were 7 recipients from throughout the district in total.
This award is to acknowledge outstanding community service and
recipients do not receive a monetary reward.
MainPower Hurunui
The MainPower and Natural Environmental Fund were distributed
Natural Environment
at a Council ceremony in June 2011. There were 8 recipients from
Fund
various parts of the district who received grants from a total pool of
$10,000.
Hurunui Heritage
The Hurunui Heritage Fund was distributed at a Council ceremony in
Fund
June 2011. There were 2 recipients from various parts of the district
who received grants totaling $3,000.
Advertise and promote
Al funding is awarded There have been two rounds of funding for the Creative NZ funding
the availability of
to applicants
this year. A total of $10,859 has been paid out of the $13,453 available
funding on behalf of
to a total of 7 applicants. Almost $2,000 was carried over from the
Sport and Recreation
previous year. The remainder of the funds from the 2010/11 year wil
New Zealand (SPARC)
be carried into the first round of the 2011/12 year. 10 applications
and Creative New
were received for SPARC funding and paid out a total of $14,500 in
Zealand
grants. This was the total fund and included a $5,000 contribution
from the Council.
Achieved
Almost Achieved or not measured
Not Achieved
Financial Detail:
2010/2011
2010/2011
2009/2010
Actual
Budget
Actual
Grants & Services Awards
Operating Statement
OPERATING REVENUE
Rates
107,079
106,894
94,844
Other Income
20,781
20,540
20,786
Total Operating Revenue
127,860
127,434
115,631
OPERATING EXPENDITURE
Employment Costs
253
3,760
129
Other Direct Expenditure
99,501
106,772
90,506
Council Overheads
16,900
16,902
19,576
Total Operating Expenditure
116,654
127,434
110,211
Operating Surplus (Deficit)
$11,206
$0
$5,420
CAPITAL EXPENDITURE
Grants & Service Awards
0
0
0
Total Capital Expenditure
$0
$0
$0
32
Annual Report - 1 July 2010 to 30 June 2011
2. Environment and Safety
The individual activities (services) within this
Environmental Responsibility:
N
section include:
• clean and plentiful water in our rivers, lakes and
IO
T
2.1
Resource Management and Planning
streams
C
• beaches/ocean in a healthy condition
U
2.2
Civil Defence
D
2.3
Rural Fire Control
• an effective recycling service and to be actively
RO
T
2.4
Building Compliance
working towards the target of zero waste
IN
2.5
Public Health and Liquor Licensing
• environmental safeguards and protection for natural
2.6
Animal Control
assets balanced with property owner’s rights
Achievement of Levels of Service
• clean, healthy air quality
A Healthy, Safe Place to Live:
Each of the activities listed above have a range of
performance measures to describe the service targets
• good, affordable health care services available for
we were aiming for. These are set out in the following
all.
pages with a commentary on how we had performed at
• Adequate emergency services including fire, police
and ambulance
ES
S
the end of year (the result).
M
IE
• good quality, affordable accommodation available to
O
C
IT
meet the community’s needs
T
U
IVT
Significant Acquisitions or Replacement of • affordable and accessible community and social
O
C
Y
services particularly for the elderly and young
A
Assets
IT
families
N
IL
U
C
• management systems and resources to deal with
M
N
Vehicles for the building control department ($32,765)
M
U
and rural fire ($16,108) were purchased during the year.
civil defence emergency situations
O
O
C
C
These were identified in the Annual Plan or carried
forward from prior year’s budgets; therefore there are
no significant variances in acquisitions or replacement of
assets.
Significant Variations between Actual Results
and Annual Plan 2010/11 Projections
S
T
EN
Total revenue was $163,000 lower than the budget for the
EM
year. As a result of the recession, income from Resource
T
Consents processing, Subdivision Inspections, Building
Achieved
Almost Achieved or not measured
Not Achieved
L STA
Consents and Private Plan Changes are all significant
IA
C
lower than the level budgeted for.
N
A
Total Operating Expenditure was up on the budget
FIN
by $329,000. The key variance was in Resource
Management & Planning where the Council incurred
$243,000 of external costs relating to the Mainpower
appeal on the declined resource consent for a windfarm
S
on Mt Cass and there were $44,000 of costs incurred in
N
fighting the fire at Ashworths prior to Christmas 2010 that
IO
T
could not be recovered.
ISA
N
A
Capital Expenditure ended the year $25,000 down on
G
R
the budget set. This was mainly due to the Rural Fire
O
Appliance purchased being less than budgeted and also
LLED
a small number of Civil Defence projects being deferred
RO
until the next year.
T
N
O
Community Outcomes to Which This Group of
IL C
C
Activities Primarily Contribute
N
U
O
C
33
Hurunui District Council
Financial Detail:
2010/2011
2010/2011
2009/2010
Actual
Budget
Actual
Environment and Safety (Summary)
Operating Statement
OPERATING REVENUE
Rates
1,215,106
1,224,450
1,160,655
Other Income
939,701
1,097,249
1,038,137
Internal Interest Received
5,917
1,906
4,979
Total Operating Revenue
2,160,724
2,323,605
2,203,771
OPERATING EXPENDITURE
Employment Costs
1,056,900
1,014,453
1,103,001
Other Direct Expenditure
990,142
668,448
925,180
Internal Interest Paid
4,970
875
3,147
Council Overheads
585,503
585,526
665,143
Depreciation
43,006
82,610
51,305
Total Operating Expenditure
2,680,520
2,351,912
2,747,776
Operating Surplus (Deficit)
($519,796)
($28,307)
($544,005)
CAPITAL EXPENDITURE
Resource Management & Planning
0
25,695
0
Civil Defence
4,843
17,459
24,265
Rural Fire
16,108
35,303
148,609
Building Compliance
32,765
0
0
Public Health & Liquor Licensing
0
0
0
Total Capital Expenditure
$53,717
$78,457
$172,874
34
Annual Report - 1 July 2010 to 30 June 2011
2.1 Resource Management / Planning
Goal:
To promote the sustainable management of the District’s natural and physical resources
Performance Measures
N
IO
T
How Council Wil Know we
C
Target
What we wil do towards achieving
the target
have met our target
End of Year Result
U
D
RO
Have a current
Undertake a review of the
3 sections of the
Under the Resource Management Act we are required to
T
IN
District Plan in
District Plan annualy to
District Plan are
review our District Plan every 10 years. The Council has
place
consider appropriateness
reviewed per annum
initiated the review and confirmed that it wil be undertaking a
of current management
ful review of the District Plan. The review has to be completed
and policy direction
by June 2013. The District Plan is an interwoven document that
cross references between sections. Our target of reviewing
three sections of the Plan per year is, in hind sight, not the best
way to review it. Instead, we have chosen to review topics
or areas of the Plan. These areas impact on more than one
section. Six topics of the Plan have been reviewed. These
include: Urban subdivision; independent senior living units;
rural subdivision; Hanmer Springs car parking; Hanmer
ES
S
M
IE
Springs multiple dweling units; and minor dweling units. We
O
C
IT
are on track to complete the review by 2013.
T
U
IVT
O
C
Manage
To decide on al resource
Al resource consent
109 resource consents were processed within the
Y
AIT
applications for
consent applications within applications are
statutory timeframe and 2 were processed outside the
N
IL
U
C
services and
statutory timeframes
decided within the
statutory timeframe set by the Resource Management
M
N
town planning
statutory timeframes
Act 1991 due to the complex nature of the applications.
M
U
O
O
ef ectively
11 resource consents were extended under Section 37
C
C
of the Resource Management Act 1991 which allows the
Council to extend to timeframes in special circumstances.
This equates to 98% of all resource consents having
been processed within the statutory timeframe.
To be within the
The Resource Management Act Survey of Local
top 10% of al
Authorities 2010-2011 survey was recently conducted.
territorial authorities
In the 2007/08 year, this survey rated Hurunui District
S
in the Resource
Council in the top 35% of territorial authorities for
T
Management Act
resource consent applications processed on time. The
EN
Biennial Survey of
survey has now broken up the territorial authorities into
EM
T
Local Authorities
four seperate categories and as such the overall analysis
of all territorial authorities is not available.
L STA
IA
C
Monitor terms of con-
50% of land use
106 land use consents required monitoring over the year.
N
A
sents issued to those
consents are
134 consents were monitored which equates to 71% of
FIN
operating land use
checked for compli-
land use consents being checked for compliance. Most
consents to ensure they ance with the terms
consents were found to comply with only a small number
comply
of the consent
requiring further work. Additional monitoring has been
scheduled for those consents with on-going works.
S
Process Project
All PIM’s have
320 planning checks on building consents were
N
Information
planning checks
completed over the past year. 317 planning checks were
IO
T
Memorandum’s (PIM’s)
completed within 8
processed within 8 working days after been received. 3
ISA
in a timely manner
working days of a
planning checks were processed outside the timeframe
N
complete application due to complex nature of the applications. This equates
A
G
being received
to 99% of planning checks being completed within the 8
R
working days.
O
LLED
RO
T
N
O
IL C
C
N
U
O
C
Achieved
Almost Achieved or not measured
Not Achieved
35
Hurunui District Council
Minimise
Work with Canterbury
Rangers are in place
Canterbury Regional Council rangers patrol the beach
the rate of
Regional Council to
to safeguard the
areas during the main Christmas holiday period,
environmental
implement the Northern
beach areas
weekends and 2 half days during the week. Generally
damage
Pegasus Bay Coastal
few problems were encountered on most patrols with
between the
Management Plan.
fewer vehicles on beaches than last summer.
Waipara Rocks
and Ashworths
Al break in areas
Some signage and bollards have been deliberately
Beach
fenced of from
damaged in the beach areas between Waipara Rocks
vehicles are repaired
and Ashworths Beach. These were all repaired with only
within 3 days
minor damage occurring since. The repairs were not done
within 3 days due to there being shared responsibilities
for payment with other parties. Earthquake damage has
occurred to Department of Conservation fenced areas at
Ashworths beach which has yet to be repaired. A contract
is to be put in place with Canterbury Regional Council to
repair damage to fenced off areas within 3 days.
Provide initiatives to
Review the
An operating group has been established to implement
restrict vehicle access to effectiveness of the
the outcomes of the Northern Pegasus Bay Coastal
these beach areas
Northern Pegasus
Management Plan and this group last meet in January.
Bay Coastal
At a meeting held in August with representatives of the
Management Plan
HDC, Wamakariri District Council, Canterbury Regional
Council and Te Kohaka o Tuhaitara Trust to asses the
effectiveness of the Management Plan, it was agreed
that it was too difficult to enforce unregistered vehicles
on the beach but to continue with the education through
the rangers and pamphlets.
Achieved
Almost Achieved or not measured
Not Achieved
36
Annual Report - 1 July 2010 to 30 June 2011
Financial Detail:
2010/2011
2010/2011
2009/2010
N
IO
Actual
Budget
Actual
T
C
U
D
Resource Management & Planning
RO
T
Operating Statement
IN
OPERATING REVENUE
Rates
636,765
662,625
640,668
Other Income
269,751
387,956
295,490
Total Operating Revenue
906,516
1,050,581
936,158
OPERATING EXPENDITURE
Employment Costs
513,526
498,121
563,978
Other Direct Expenditure
540,682
270,758
506,660
Council Overheads
271,068
271,073
318,210
Depreciation
11,446
10,629
11,446
Total Operating Expenditure
1,336,722
1,050,581
1,400,294
ES
S
M
Operating Surplus (Deficit)
($430,206)
$0
($464,136)
IEOC
ITT
CAPITAL EXPENDITURE
U
IVT
RMA Implementation
0
0
0
O
C
Y
RMA Admin/Compliance
0
0
0
AIT
Subdivision Inspections
0
25,695
0
N
IL
U
C
RMA Policy Development
0
0
0
M
N
Total Capital Expenditure
$0
$25,695
$0
M
U
O
O
C
C
S
T
EN
EM
T
L STA
IA
C
N
A
FIN
S
N
IO
T
ISA
N
A
G
R
O
LLED
RO
T
N
O
IL C
C
N
U
O
C
Achieved
Almost Achieved or not measured
Not Achieved
37
Hurunui District Council
2.2 Civil Defence
Goal:
To be prepared for and have the ability to respond to and recover from any Civil Defence emergency
Performance Measures
Target
What we wil do towards
How Council Wil Know
achieving the target
we have met our target
End of Year Result
To be prepared Have relevant and
Plans and SOPs
The current plans and standard operating procedures have not
for emergency
current plans and
are reviewed
been reviewed in the past year. They will be used for staff
situations
standard operating
annually
training and a Civil Defence Exercise in September and then
which have
procedures (SOPs)
reviewed following this activity. The impact of the Canterbury
widespread
in place
earthquakes and other emergency situations have affected
implications for
resourcing and our ability to review civil defence plans over
the District
the past year.
Ensure there are
New sector posts
A number of changes have taken place with the district’s sector
sufficient civil
are established at
posts to strengthen our ability to respond in an emergency
defence sector posts
Motunau Beach &
situation. Motunau Beach now has an established and trained
throughout the district Scargil-Omihi
and equipped Civil Defence Sector Post team. The Cheviot
Sector Team has been restructured, with training being
delivered to bring the new volunteers up to date. The Amberley
Sector has a newly formed Welfare team that has received
training. Planning is in progress to create a Sector Post team in
the Glenmark area, and also rejuvenate the Culverden sector
team before the end of 2011.
Educate the public
At least one public
The new Emergency Planning Guide was published and delivered
how to prepare
promotion is
throughout the Hurunui District in April 2011. This provided the public
themselves for a
undertaken annualy
with the information they require to prepare themselves for a disaster.
civil defence type
The Canterbury earthquakes have significantly increased public
emergency
interest in emergency preparedness compared with previous years.
Train staf and
Staf training is
Staf training is an ongoing practice to ensure new staf have
volunteers to meet their delivered at least
adequate Civil Defence skils, and other staf have practice using
CDEM responsibilities
twice per year to
what they have been taught. Staf wil have at ended from two to four
EOC staf
training sessions by the end of 2011. The training plan for staf in the
2010/11 year was delayed because of the real emergency situations
in Canterbury. The earthquake response in Canterbury provided
many staf with real life Civil Defence activities. Actual experience is
generaly bet er than training when it comes to emergency situations.
50% Sector Post
Most of the Sector Post teams have had training every two months,
(volunteer) staff
with more than 50% of volunteer staf participating. Most teams are
participate in
currently experiencing an increase in volunteers due to the interest
training annually
driven from the earthquakes in Canterbury.
The EOC
Due to staff availability and the effects of the Christchurch
participates in the
September 2010 earthquake, Exercise Pandora, due to
Canterbury regional have taken place in September 2010, was downgraded to a
Exercise Pandora
tabletop exercise. The Hurunui District Council participated
annually
in this exercise. The next Exercise Pandora was completed
on 23 September 2011 as a locally run exercise with support
provided from the Canterbury Group Civil Defence.
Achieved
Almost Achieved or not measured
Not Achieved
38
Annual Report - 1 July 2010 to 30 June 2011
N
IO
Financial Detail:
T
C
U
D
2010/2011
2010/2011
2009/2010
RO
Actual
Budget
Actual
T
IN
Civil Defence
Operating Statement
OPERATING REVENUE
Rates
152,835
152,315
150,070
Other Income
0
2,362
13,623
Total Operating Revenue
152,835
154,677
163,693
OPERATING EXPENDITURE
Employment Costs
63,818
52,766
58,262
ES
S
M
Other Direct Expenditure
28,638
47,873
30,106
IEO
Council Overheads
39,150
39,157
45,547
C
IT
T
Depreciation
14,244
14,881
16,775
U
IVT
Total Operating Expenditure
145,849
154,677
150,690
O
C
Y
Operating Surplus (Deficit)
$6,985
$0
$13,003
AITN
ILU
C
CAPITAL EXPENDITURE
M
N
Civil Defence
4,843
17,459
24,265
M
U
Total Capital Expenditure
$4,843
$17,459
$24,265
O
O
C
C
S
T
EN
EM
T
L STA
IA
C
N
A
FIN
S
N
IO
T
ISA
N
A
G
R
O
LLED
RO
T
N
O
IL C
C
N
U
O
C
Achieved
Almost Achieved or not measured
Not Achieved
39
Hurunui District Council
2.3 Rural Fire
Goal:
To safeguard life and property from fire in forest and rural areas and other areas of vegetation
Performance Measures
Target
What we wil do towards How Council Wil Know we
achieving the target
have met our target
End of Year Result
To respond to
Train, equip and
Train 50% of each
All fire forces receive training at least monthly. In addition
rural fires in
prepare volunteer
volunteer rural fire
all 26 Volunteer Rural Fire-fighters assisted with pumping
time to prevent rural fire force teams
force teams per
operations, search and rescue and logistical support during the
loss of life and
to extinguish fires
year
Christchurch earthquake response in February.
property
and save life and
property from fire risk
Heli bucket
Helicopter companies supply and maintain their own buckets
purchased for
when called upon to fight a fire, therefore a heli bucket was
Hawarden Waikari
deemed unviable and unnecessary and therefore has not been
team
purchased.
Replacement fire
Cheviot Fire Brigade recently received their replacement fire
tankers purchased
tanker, significantly strengthening the reliability and capability
of our fire fighting resources in the north east part of our
district. Hanmer Springs now have an operational fire tanker
located in the township, although this tanker is near the end
of its operational life. It is intended to upgrade the cab and
chassis once a suitably priced and adequate replacement
is located. A new micro droplet system is currently being
investigated. If it fulfils its promoted capability it may well be
a viable and cost effective alternative to large fire appliances.
This will be considered in the next year if investigations support
this approach. No other fire tankers require replacement at
this stage.
Recruit volunteers
Each rural fire team All teams have good membership and at least at 80% full
for Council Volunteer will be at least
strength, although further membership will be needed in the
Rural Fire Force
80% full strength
coming years due to the numbers of older fire fighters in teams
teams
(i.e. enough
and who are looking at retiring from this work.
members for an
uncompromised
level of response).
Educate the
Provide up to date
The number of
The number of fires has decreased from those in recent
public of fire
information to the
fires in the district
years (47 in the 2008/09 fire season; 24 in 2009/2010; and
risks and
public through media, decreases annually
20 fires in the 2010/2011 fire season). This represents a 17%
mitigation
website and fire
by 10%
decrease from last year. Although fire numbers are at a lower
strategies
signage
rate this past year, this includes a significant fire near Leithfield
directly prior to Christmas 2010. Hurunui District Council
participates in the Regional Rural Fire Committee publicity
initiatives. This allows us to pool our resources and also
ensure public information messages are consistent across the
Canterbury region. The public has also had access to Rural
Fire articles and information, both in the local newspapers and
on the Hurunui District Council website – www.hurunui.govt.
nz. There is also an information page in the new Emergency
planning guide dedicated to Rural Fire. We have joined forces
with the other Rural Fire Authorities in Canterbury to develop
a Wildfire Threat Analysis tool. This three year project will
enable us to comply with newly introduced national standards
and support a thorough understanding of the various wildfire
threats throughout the Hurunui. The outcomes will be an ability
to target tactical plans for high risk areas, including targeted
public information for identified high risk areas.
Achieved
Almost Achieved or not measured
Not Achieved
40
Annual Report - 1 July 2010 to 30 June 2011
N
IO
Financial Detail:
T
C
U
D
2010/2011
2010/2011
2009/2010
RO
T
Actual
Budget
Actual
IN
Rural Fire
Operating Statement
OPERATING REVENUE
Rates
215,967
213,027
220,052
Other Income
3,420
44,446
20,798
Internal Interest Received
0
0
0
Total Operating Revenue
219,387
257,473
240,850
ES
S
OPERATING EXPENDITURE
M
IE
Employment Costs
41,026
41,294
54,591
O
C
IT
Other Direct Expenditure
199,577
132,026
165,239
T
U
IV
Internal Interest Paid
4,970
875
3,147
T O
C
Council Overheads
47,975
47,975
45,591
Y
A
Depreciation
6,208
35,303
6,792
IT
N
IL
Total Operating Expenditure
299,756
257,473
275,360
U
C
Operating Surplus (Deficit)
($80,370)
$0
($34,509)
M
N
M
U
O
O
CAPITAL EXPENDITURE
C
C
Rural Fire
16,108
35,303
148,609
Total Capital Expenditure
$16,108
$35,303
$148,609
S
T
EN
EM
T
L STA
IA
C
N
A
FIN
S
N
IO
T
ISA
N
A
G
R
O
LLED
RO
T
N
O
IL C
C
N
U
O
C
Achieved
Almost Achieved or not measured
Not Achieved
41
Hurunui District Council
2.4
Building Compliance
Goal:
To ensure buildings and structures are safe and not harmful to the public.
Performance Measures
Target
What we wil do towards
How Council Wil Know
achieving the target
we have met our target
End of Year Result
Ensure
Process and decide
100% of all
371 building consents were received in the past 12 months
buildings and
on building consent
building consent
to 30 June 2011. Of these, 348 were processed within 20
swimming
applications within
applications are
working days which equates to 94%. The reason for the delay
pools are safe
statutory timeframes
decided within 20
in processing a small number of building consents was due to
for the public
working days
resourcing difficulties. We had difficulty in filling a building officer
and fit for
vacancy and our contractor (Selwyn District Council) could not
purpose
meet all of our work requests. The primary reason for these
resourcing difficulties was due to the Canterbury earthquake
response as the majority of people with building consent skills
were committed to this priority work.
Make sure that all
No less than 30% of
Audit Inspections for the 2010/11 financial year were al undertaken in
public buildings have al registered public
March and April 2011. The contractor reported disappointing results as
a current Building
buildings with a
many owners have made no improvement in their compliance since
Warrant of Fitness
compliance schedule the last audit. Of the 33 inspections undertaken (31% of al registered
are inspected each
public buildings), 5 were deemed to be unsatisfactory and of those that
year
were satisfactory, 9 were not undertaking owners’ inspections. Notices
to owners to remedy the issues were sent to 3 owners as a result of
this report. The remaining non complying properties have been added
to the next year’s audit list for a re-check.
Make sure that all
No less than a third Swimming pool inspections were undertaken from December
registered private
of all registered
through to April 2011. Of the 357 swimming pools known to
swimming pools
private swimming
exist in the Hurunui District, 158 inspections were undertaken
comply with the
pools are inspected (44%). Of those; 93 passed; 65 failed (23 of those were
Fencing of Swimming each year
empty, which means they comply as there is no risk); 8 have
Pools Act
been removed and no longer exist; 16 passed on the second
inspection. Follow up inspections are continuing to take place
on non-complying pools.
Council will
All Council building
All building staff were trained to building accreditation standards
maintain its Building
inspections
as at the end of July 2011. International Accreditation New
Consent Authority
staff are trained
Zealand (IANZ) completed the 3rd phase of the building
accreditation
to building
accreditation standards, which was an onsite assessment. We
accreditation
received only 3 corrective action requests which were cleared
standards
by December 2010. Hurunui District Council was the first in
New Zealand to achieve the third stage of accreditation.
Achieved
Almost Achieved or not measured
Not Achieved
42
Annual Report - 1 July 2010 to 30 June 2011
N
IO
Financial Detail:
T
C
U
2010/2011
2010/2011
2009/2010
D
RO
Actual
Budget
Actual
T
IN
Building Compliance
Operating Statement
OPERATING REVENUE
Rates
72,779
60,186
14,571
Other Income
412,976
434,697
465,038
Total Operating Revenue
485,755
494,883
479,608
OPERATING EXPENDITURE
Employment Costs
286,937
285,108
306,421
ES
S
M
Other Direct Expenditure
90,306
66,267
90,359
IEO
Council Overheads
141,252
141,257
165,848
C
IT
T
Depreciation
6,989
16,251
12,174
U
IVT
Total Operating Expenditure
525,484
508,883
574,803
O
C
Operating Surplus (Deficit)
($39,729)
($14,000)
($95,194)
Y
AITN
IL
CAPITAL EXPENDITURE
U
C
M
N
Building Services Consents
32,765
0
0
M
U
Total Capital Expenditure
$32,765
$0
$0
O
O
C
C
S
T
EN
EM
T
L STA
IA
C
N
A
FIN
S
N
IO
T
ISA
N
A
G
R
O
LLED
RO
T
N
O
IL C
C
N
U
O
C
Achieved
Almost Achieved or not measured
Not Achieved
43
Hurunui District Council
2.5 Public Health and Liquor Licensing
Goal
:
To improve, promote, and protect public health.
Performance Measures
Target
What we wil do
How Council Wil
End of Year Result
towards achieving
Know we have met
the target
our target
Encourage
Undertake
All licensed
By 30 June 2011 all licensed premises in the Hurunui district
compliance so
inspections on
premises are
had been inspected; a total of 225 inspections undertaken.
that all food,
licensed premises
inspected at least
This was a busy year with new premises opening and existing
liquor and
annually
premises changing operators. This required multiple visits to
other licensed
some premises and provided an opportunity to establish a
premises
working relationship with the new operators that supports the
comply with
joint aim of providing safe food, clean and well maintained
the relevant
premises and facilities. There was an increase in registrations
legislation
from people preparing food for local markets. Compliance at
premises was generally very good with significant upgrades
made on some premises.
Investigate
There were no complaints of poor food safety practices during
complaints about
this year.
poor food handling
and unsanitary
conditions in any
food premise within
3 working days
Promote the New
There are 10 eligible
Al food premise operators were advised of the current progress of the
Zealand Food Safety food premises that are new Food Bil and the likely implications for their type of business. The
Authority’s Voluntary
involved in the VIP per food service sector (e.g. café, restaurants, hotel, takeaways, caterers)
Implementation
annum
were advised Food Control Plans (FCPs) were currently voluntary but
Programme (VIP)
would become mandatory when the new law was enacted. They were
to all licensed food
advised to start adopting elements of the FCP so the transition would
premises during the
be more gradual. Mentoring was provided to food sector operators
annual inspection
who expressed interest in developing and/or adopting FCPs, i.e. 53%
of FCP eligible premises. At 31 June 2011 there were 77 premises
eligible to register FCPs. Sixteen premises have approved FCPs,
including two food operators with approved FCPs for seling red meat
at stals or markets, i.e. 21% of eligible premises have FCPs. The
Environmental Health Officer at ended Food Safety Cluster meetings
held in Ashburton on 20/10/10 and Roleston on 7/12/10, 22/2/11
and 31/5/11. These provide professional peer support and establish
consistency of approach across the region.
Achieved
Almost Achieved or not measured
Not Achieved
44
Annual Report - 1 July 2010 to 30 June 2011
Target
What we wil do
How Council Wil
End of Year Result
towards achieving
Know we have met
the target
our target
N
IO
T
C
Work with
Regular liaison
Quarterly meetings
Al three Tri-Agency Group meetings set up during the year were
U
other partners
meetings are
are held
at ended (August 2010, November 2010 and April 2011). Tri-Agency
D
on liquor to
held between
meetings include Hurunui District Licensing Agency officers, Police
RO
T
reduce the
representatives of
and District Health Board liquor licensing officers. Four meetings did
IN
negative
the District Licensing
not occur but the Tri-Agency Group worked together to undertake
impact of
Agency (DLA), Police
two ‘Controled Purchase Operations’ (in July and December 2010)
alcohol abuse
and Community and
to check on the sale of liquor in the Hurunui district. Twenty six
Public Health (CPH)
premises were visited and four sales of liquor to minors were made.
This resulted in the suspension of premise licences and in the case
of the seler, either the suspension of their duty manager’s licence
or a court appearance. Since May 2011 night time monitoring of
licensed premises has been undertaken by Tri-Agency Group
members. These visits were to check compliance with the Sale of
Liquor Act 1989 and also to provide advice to licensees and duty
ES
S
managers. Generaly compliance was very good with minor issues
M
IEO
addressed at the time of the visit. Two premises received warning/
C
IT
T
advisory let ers from Police folowing these visits. One of the CPOs
U
IVT
and the monitoring in May 2011 were part of the Australian/New
O
C
Y
A
Zealand joint initiative ‘Operation Unite’ to reduce alcohol abuse. Two
IT
licence applications were referred to the Liquor Licensing Authority;
N
IL
U
C
a grocery store with low turnover of foodstuf s and an on licence
M
N
M
U
application which received an objection from a neighbour. Neither
O
O
had hearings during this year. Two applications were heard before
C
C
the Hurunui District Licensing Agency; a Special Licence which was
granted with conditions and a Temporary Authority was declined due
the unsuitability of the applicant.
Achieved
Almost Achieved or not measured
Not Achieved
Financial Detail:
S
T
EN
2010/2011
2010/2011
2009/2010
EM
T
Actual
Budget
Actual
L STA
Public Health & Liquor Licensing
IA
C
N
Operating Statement
A
FIN
OPERATING REVENUE
Rates
101,240
100,896
100,806
Other Income
96,389
99,105
102,084
Total Operating Revenue
197,629
200,001
202,890
OPERATING EXPENDITURE
S
Employment Costs
120,894
117,793
108,061
N
Other Direct Expenditure
31,207
33,470
29,892
IO
T
Council Overheads
43,188
43,192
50,737
ISA
Depreciation
4,118
5,546
4,118
N
Total Operating Expenditure
199,408
200,001
192,809
A
G
Operating Surplus (Deficit)
($1,779)
$0
$10,081
R
O
CAPITAL EXPENDITURE
Health Inspection
0
0
0
LLED
Liquor Licensing
0
0
0
RO
Total Capital Expenditure
$0
$0
$0
T
N
O
IL C
C
N
U
O
C
Achieved
Almost Achieved or not measured
Not Achieved
45
Hurunui District Council
2.6 Animal Control
Goal
:
To protect people and animals through the proper care and control of dogs and stock.
Performance Measures
Target
What we wil do towards
How Council Wil Know we
achieving the target
have met our target
End of Year Result
Ensure that
Investigate and
There is no significant
We received 355 complaints about dogs during the year which
dogs and other respond to all
increase in the overall
is 57 up on the same period last year (total for 2009/10 = 298).
animals do
complaints of
number of complaints
Of those complaints, 24 were about aggressive dogs, (25 last
not cause a
dangerous animal
or in any particular
year), 60 concerned excessive barking, (50 last year), 245 were
nuisance or
behaviour or
category of dog control either lost or found or were roaming, (207 last year), 19 were
hazard
wandering animals
complaints.
stock worrying, (11 last year), and 7 concerned dog welfare, (5 last
and stock
year). We received 76 cals about animal stock, (78 last year).
Our contractors have noted an increase in barking and roaming
dog complaints and believed this to be a result of the Canterbury
earthquakes.
Encourage
Administer dog
Al dogs the Council has
Al dogs that we have a record of are registered in accordance with
voluntary dog
registrations and take
a record of are registered the Dog Control Act. We have 5,313 recorded dogs in the Hurunui
registration
compliance action
in accordance with the
district compared with 5,126 last year. Unregistered dogs continue
and increase
where necessary
Dog Control Act 1996
to be found through the complaints system and are then folowed
owner
up and processed in accordance with the Dog Control Act.
esponsibility
The number of dogs
The number of dogs impounded this year at 19 was less than the
impounded decreases
previous year (25), which amounts to a 20% reduction.
annualy by 5%
Achieved
Almost Achieved or not measured
Not Achieved
Financial Detail:
2010/2011
2010/2011
2009/2010
Actual
Budget
Actual
Animal Control
Operating Statement
OPERATING REVENUE
Rates
35,522
35,401
34,488
Other Income
157,165
128,683
141,105
Internal Interest Received
5,917
1,906
4,979
Total Operating Revenue
198,603
165,990
180,572
OPERATING EXPENDITURE
Employment Costs
30,699
19,371
11,687
Other Direct Expenditure
99,732
118,054
102,924
Council Overheads
42,870
42,872
39,210
Total Operating Expenditure
173,301
180,297
153,821
Operating Surplus (Deficit)
$25,303
($14,307)
$26,751
CAPITAL EXPENDITURE
Ranging & Impounding
0
0
0
Animal Control
0
0
0
Total Capital Expenditure
$0
$0
$0
46
Annual Report - 1 July 2010 to 30 June 2011
3. Growth and Development
The individual activities (services) within this
Annual Plan budget due to signage work that was carried
forward from previous years being paid for.
section include:
N
IO
3.1
Tourism
T
C
3.2
Visitor Information Centre
U
Community Outcomes to which this Group of
D
3.3
Economic Development
RO
Activities Primarily Contribute
T
IN
Achievement of Levels of Service
A thriving local economy:
Each of the activities listed above have a range of
performance measures to describe the service targets we • be a place where business development is encouraged
were aiming for. These are set out in the following pages
but in a way that preserves the community and the
with a commentary on how we had performed at the end
environment
of year (the result).
• have new and diverse businesses which will provide
Significant Acquisitions or Replacement of Assets
local services and employment opportunities for
ES
S
attracting and retaining residents
M
IEOC
IT
There are no significant acquisitions or replacement of • have equity of access to quality and affordable
T
U
IV
assets during the year and no significant variances from
T
telecommunication services including broadband
O
C
the Annual Plan.
Y
A
availability and adequate cell phone coverage
IT
N
IL
U
C
M
N
Significant Variations between Actual Results and
M
U
O
O
Annual Plan 2010/11 Projections
C
C
Total revenue was $342,000 lower than the budget for
the year. The effects of the recession in the retail area
had meant that gross income from the Visitor Information
Centre was $421,000 lower than budgeted for when
preparing the Annual Plan. This has been offset by Third
Achieved
Almost Achieved or not measured
Not Achieved
Party funding for Tourism projects was up on budget by
S
$70,000.
T
EN
Total Operating Expenditure was down on the budget
EM
T
by $218,000. Operating Expenditure for the Visitor
Information Centre was $264,000 down on budget for
L STA
IA
the year, which complemented the downwards trend
C
N
in income. With the additional third party funding, the
A
Hurunui Tourism Board able to spend $55,000 more than
FIN
was budgeted on specific projects.
Capital Expenditure ended the year $32,000 ahead of the
S
N
IO
T
ISA
N
A
G
R
O
LLED
RO
T
N
O
IL C
C
N
U
O
C
47
Hurunui District Council
Financial Detail:
2010/2011
2010/2011
2009/2010
Actual
Budget
Actual
Growth and Development (Summary)
Operating Statement
OPERATING REVENUE
Rates
338,337
325,127
331,900
Other Income
548,430
903,760
642,125
Total Operating Revenue
886,767
1,228,887
974,025
OPERATING EXPENDITURE
Employment Costs
323,314
337,979
333,500
Other Direct Expenditure
664,583
837,095
691,908
Council Overheads
54,355
54,355
64,198
Depreciation
12,032
42,718
9,017
Total Operating Expenditure
1,054,284
1,272,147
1,098,623
Operating Surplus (Deficit)
($167,517)
($43,260)
($124,598)
CAPITAL EXPENDITURE
Tourism
52,164
20,000
0
Visitor Information Centre
0
0
5,262
Economic Development
5,231
15,405
7,276
Total Capital Expenditure
$57,395
$35,405
$12,538
48
Annual Report - 1 July 2010 to 30 June 2011
3.1 Tourism
Goal:
To have a profitable visitor industry that is aligned to our community’s social, cultural and environmental
needs - ‘Hurunui Wellness’.
N
IO
Performance Measures
T
C
U
D
Target
What we wil do towards
How Council Wil Know
End of Year Result
RO
achieving the target
we have met our target
T
IN
To grow visitor
Carry out destination
Number of visitors
The number of visitors who stayed overnight in the Hurunui
numbers to the
marketing and destination to the district who
District for the year end June 2011 totalled 320,837. Up
Hurunui District
management to promote
stay overnight wil be
27,639 on the previous year’s result of 293,198 nights.
and at ract visitors to the
maintained at or grow
The source of this information is Statistics New Zealand
District. Establish and
above 320,000.
(www.stats.govt.nz).
maintain relationships
with tourism operators
(This figure is set as
and clients. Assess
desired outcome but
needs and plan for future consideration should
ES
S
demands.
be given to the current
M
IE
global recession).
O
C
IT
T
U
IVT
O
C
To increase
The growth in the
The growth of 27,639 additional guest (visitor) nights to the
Y
AIT
the number of
number of overnight
district represents an annual growth of 9.4%. This is better
N
IL
U
C
overnight visitors
guests to the Hurunui
than the national result which was a 1.6% decrease in guest
M
N
to the Hurunui
District at least
nights.
M
U
O
O
District
matches the average
C
C
for NZ
Achieved
Almost Achieved or not measured
Not Achieved
S
T
Financial Detail:
EN
EM
T
2010/2011
2010/2011
2009/2010
L STA
IA
Actual
Budget
Actual
C
N
A
Tourism
FIN
Operating Statement
OPERATING REVENUE
Rates
278,011
265,000
255,817
Other Income
70,324
0
22,568
S
Total Operating Revenue
348,335
265,000
278,385
N
IO
T
OPERATING EXPENDITURE
ISA
Employment Costs
48,910
36,000
47,605
N
Other Direct Expenditure
304,432
258,260
276,444
A
G
Council Overheads
10,000
10,000
10,000
R
Depreciation
0
4,000
0
O
Total Operating Expenditure
363,342
308,260
334,049
Operating Surplus (Deficit)
($15,007)
($43,260)
($55,664)
LLED
RO
CAPITAL EXPENDITURE
T
N
Tourism
52,164
20,000
0
O
Total Capital Expenditure
$52,164
$20,000
$0
IL C
C
N
U
O
C
49
Hurunui District Council
3.2 Visitor Information Centre
Goal:
To promote the highest quality of visitor information services to local communities, visitors, the wider
tourism industry and consumers as they make their travel decisions
Performance Measures
Target
What we wil do towards
How Council Wil Know
End of Year Result
achieving the target
we have met our target
Provide visitors
Of er assistance with
Bookings for
Bookings for the year were 4% down on last year as a result of
and tourists
itinerary planning
accommodation and
increased competition to book accommodation and other itinerary
with excelent
as wel as providing
services wil increase
needs in Hanmer Springs, increased bookings through the internet,
customers
information and
by 3%
and a decrease in tourism. The Canterbury earthquakes had a major
service and
arranging bookings for
impact on tourist numbers in the South Island, particularly with the
information
accommodation, travel,
main international airport being in Christchurch.
tours, sightseeing and
at ractions
Undertake customers
90% of customers
No results are available regarding the customer satisfaction survey as
satisfaction surveys
are satisfied with the
this has not been completed. Since April 2011, customer satisfaction
service and information survey forms have been available for customer feedback. This is
they receive
done on a voluntary basis but there have been too few survey forms
completed to provide reliable information. Once there are sufficient
numbers, they are sent to a research company (caled Datapro) for
analysis.
Manage the
Ensure that the range
Generate an annual The Visitor Information Centre at Hanmer Springs recorded a
centre so that it
and diversity of retail
surpluses of $21,000
deficit of $123,932 which was wel below our target. Retail sales
is not a financial
products of ered for
were significantly lower than was budgeted for and we believe the
cost to the
sale is optimised for
Canterbury earthquakes and the ef ects of the global recession were
ratepayer
generating profits
the main contributing reasons. We are reviewing our retail products
and the role they have in the visitor centre for future.
Achieved
Almost Achieved or not measured
Not Achieved
Financial Detail:
2010/2011
2010/2011
2009/2010
Actual
Budget
Actual
Visitor Information Centre
Operating Statement
OPERATING REVENUE
Rates
(32,623)
(32,512)
(21,253)
Other Income
477,837
898,625
619,472
Total Operating Revenue
445,215
866,113
598,220
OPERATING EXPENDITURE
Employment Costs
274,404
301,979
285,895
Other Direct Expenditure
276,757
486,677
318,291
Council Overheads
41,820
41,820
51,187
Depreciation
8,789
35,637
8,627
Total Operating Expenditure
601,770
866,113
664,000
Operating Surplus (Deficit)
($156,555)
$0
($65,780)
CAPITAL EXPENDITURE
Visitor Information Centre
0
0
5,262
Total Capital Expenditure
$0
$0
$5,262
50
Annual Report - 1 July 2010 to 30 June 2010
3.3 Economic Development
Goal:
To at ract investment and new businesses which are aligned to and compatible with the principles of ‘Hurunui
Wel ness’ to improve the local economy and the wel being of the community.
N
IO
T
Performance Measures
C
U
D
How Council Wil Know
RO
Target
What we wil do towards
T
achieving the target
we have met our target
End of Year Result
IN
To attract new
Strengthen the
The number of new
We did better than the national growth, as our decrease of
businesses,
capabilities of
businesses in the
4 businesses, or -0.15%, compared to a national decrease
visitors and
businesses to
Hurunui is not less
of -1.7. The Hurunui business geographic units* slightly
people to
assist them to be
than the national
decreased from 2,538 in the 2009 calendar year to 2,534 in
the Hurunui
sustainable.
growth.
the 2010 calendar year.
District.
The number of
The number of visitors to the Hurunui Distrcit who stayed
visitors to the
overnight increased to 320,837 (up from 293,198 the previous
Hurunui who stay
year).
IES
overnight will not be
IT
less than 310,000.
IV
T
C
(These figures are
IL A
set lower than last
C
N
year in order to take
U
O
into account the
C
current recession).
To have high
Encourage
The total number
Employees in the Hurunui District decreased from 4,080 in the
employment
employment
of employees in
2009 calendar year to 3,970 in the 2010 calendar year. This is
growth in
opportunities for
the Hurunui District
a decrease of 110 or -2.69% compared to a national decrease
the Hurunui
people in the District.
is no less than the
of -1.9%.
District.
national average.
Achieved
Almost Achieved or not measured
Not Achieved
S
* Statistics NZ criteria go beyond simple “GST registration” in that they only include businesses with GST turnover greater than $30,000 per
T
year. Data is given on “Geographic Units”, which are defined as a separate operating units engaged in one, or predominately one, kind
EN
of economic activity from a single physical location or base.
EM
T
Achieved
Almost Achieved or not measured
Not Achieved
L STA
Financial Detail:
IA
C
N
A
2010/2011
2010/2011
2009/2010
FIN
Actual
Budget
Actual
Economic Development
Operating Statement
S
OPERATING REVENUE
N
Rates
92,949
92,639
97,336
IO
T
Other Income
269
5,135
84
A
IS
Total Operating Revenue
93,218
97,774
97,420
IES
N
IT
AG
OPERATING EXPENDITURE
IV
R
T
Other Direct Expenditure
83,395
92,158
97,173
C
OD
Council Overheads
2,535
2,535
3,011
F A
EL
Depreciation
3,244
3,081
390
L
O
Total Operating Expenditure
89,173
97,774
100,574
PS O
R
Operating Surplus (Deficit)
$4,045
$0
($3,154)
U
TN
RO
O
G
CAPITAL EXPENDITURE
C
IL
Economic Development
5,231
15,405
7,276
C
Total Capital Expenditure
$5,231
$15,405
$7,276
N
U
O
C
51
Hurunui District Council
4. Utility Services and Infrastructure
The individual activities (services) within this
Significant Variations between Actual Result and
section include:
Annual Plan 2010/11 Projections
4.1
Roading Network
Total revenue was $97,000 greater than the budget set for
4.2
Waste Minimisation
the year. Roading Subsidies were greater than budgeted
by $635,000 largely due to funding towards emergency
4.3
Sewerage
reinstatement work carried out as a result of the damage
4.4
Stormwater / Drainage
caused by the rain events in July and August 2010.
$708,000 was budgeted for Vested Assets for the year,
4.5
Water Supplies
however the level recognised during the year was only
Achievement of Levels of Service
$52,000. This has been due to the lower than expected
level of development during the year Income for the Water
Supplies was greater than budget due to the higher level
Each of the activities listed above have a range of of connection fees received.
performance measures to describe the service targets we
were aiming for. These are set out in the following pages Total Operating Expenditure was up on the budget by
with a commentary on how we had performed at the end $760,000. Roading costs were $567,238 greater than the
of year (the result).
budget due to emergency reinstatement of areas of the
roading network affected by the significant rain events in
July and August 2010. The operating costs for stormwater
Significant Acquisitions or Replacement of Assets was $248,000 higher than predicted in the budget due
consultant work relating to stormwater resource consents.
Under the Roading Network, a total of $3,999,957 was
spent on Roading Capital during the year. In Solid Waste,
Capital Expenditure ended the year $439,000 lower than
planning work was carried out on the relocation of the
the level budgeted for in the Annual Plan Roading Capital
Amberley Transfer Station of $141,974. In the Sewer
was $394,000 lower than the Annual Plan due to a lower
activity, a total of $970,471 was spent with $670,481
level of Subsidised and Unsubsidised capital work being
spent in Amberley on further work on the sewer ponds
carried out. Only $30,000 was allowed for as a capital
and $277,607 in Hanmer Springs, which was relating to
budget for Solid Waste in the Annual Plan, however further
meeting resource consent conditions on the new sewer
costs of $118,391 carried forward from prior years were
ponds. Under Stormwater, a total of $245,111 was spent
incurred relating to the relocation of the Amberley Transfer
with $111,656 in the Amberley Ward, which included
Station. Work was carried out on the Amberley ($670,481)
the completion of the Leithfield Outfall Drain and some
and Hanmer Springs ($277,607) sewerage systems, which
physical works on the Lawcocks Road diversion, and a
had been budgeted for in previous years. For Stormwater,
further $133,366 in Hanmer Springs relating to the Town
the amount of capital incurred was $245,000, which was
Centre Upgrade. The key items for the Water supplies
relating to all items that had been carried forward from
capital expenditure of $931,201were: $209,672 spent on
prior years. The capital budget for Water was $2,003,000;
the Amberley Supply, the majority of which was drilling
however, only $931,000 was spent during the year, with
for a new source; and replacement work on existing
the key variances being the deferment of work for both
infrastructure was carried out on the Ashley Rural Supply
Amberley and Cheviot, the balance of which has been
($196,687), the Cheviot Supply ($102,777) and the
carried forward into the 2011/2012 year.
Hurunui Rural Supply ($246,245).
Community Outcomes to Which This
The significant variations to the Hurunui Long Term
Group of Activities Primarily Contribute
Community Plan are: Roading Capital is $774,000
lower than the level allowed for in the HLTCP due to the
Essential Infrastructure:
change to the funding from NZTA; Solid Waste Capital
is $192,000 greater than the level budgeted for in the
• water quality and quantity management systems that
HLTCP due to work relating to the Amberley Transfer
provide good, clean household drinking water and
Station being carried over from prior years; Sewerage
continuity of supply for agriculture, horticulture and in
Capital expenditure is $591,000 greater than budgeted
the event of an emergency
for in the HLTCP due to further work required on the
• a safe, quality roading network that is well maintained
Amberley Sewer Ponds and completion the work on the
Hanmer Springs Sewer Ponds; $245,000 was spent on
• sewerage systems that support the development of
Stormwater capital, whereas there was no budget in the
the district and protects the physical environment and
HLTCP, the work carried out being items that had been
health of the community
carried forward from prior years; and Water Capital was
• public toilets that meet the expectations of visitors
only $31,000 lower than was budgeted for in the HLTCP.
and residents, and also provide an environmental and
public health service
52
Annual Report - 1 July 2010 to 30 June 2011
Environmental Responsibility:
• clean and plentiful water in our rivers, lakes and
streams
N
IO
T
• beaches/ocean in a healthy condition
C
U
D
• an effective recycling service and to be actively
RO
working towards the target of zero waste
T
IN
• environmental safeguards and protection for natural
assets balanced with property owner’s rights
• clean, healthy air quality
Financial Detail:
ES
S
M
IE
2010/2011
2010/2011
2009/2010
O
C
IT
T
Actual
Budget
Actual
U
IVT
O
C
Y
A
Utility Services and Infrastructure (Summary)
IT
N
IL
U
C
Operating Statement
M
N
M
U
O
O
OPERATING REVENUE
C
C
Rates
8,855,873
8,742,105
8,385,034
Other Income
4,669,748
3,895,526
3,900,023
Internal Interest Received
727,128
719,014
671,625
Vested Assets
51,767
707,994
562,380
Development Contributions
347,261
489,723
308,813
Council Overheads (Income)
623,876
623,851
333,347
Total Operating Revenue
15,275,653
15,178,213
14,161,221
OPERATING EXPENDITURE
S
Employment Costs
1,073,414
997,252
1,041,468
T
Other Direct Expenditure
6,908,373
6,001,305
5,897,985
EN
Internal Interest Paid
626,012
694,016
475,860
EM
Council Overheads
1,926,439
1,926,558
1,622,949
T
Depreciation
4,178,996
4,334,128
3,946,458
Total Operating Expenditure
14,713,234
13,953,259
12,984,721
L STA
Operating Surplus (Deficit)
$562,419
$1,224,954
$1,176,500
IA
C
N
A
CAPITAL EXPENDITURE
Roading Network
3,999,957
4,393,583
3,742,035
FIN
Solid Waste
191,904
30,000
146,308
Sewerage
970,471
351,301
1,094,572
Stormwater/Drainage/Land Protection
245,111
0
762,462
Water Supplies
931,201
2,003,198
1,214,330
Total Capital Expenditure
$6,338,645
$6,778,082
$6,959,706
S
N
IO
T
ISA
N
A
G
R
O
LLED
RO
T
N
O
IL C
C
N
U
O
C
53
Hurunui District Council
4.1 Roading Network
Goal:
To provide a transport network that is safe and accessible for all people throughout the District.
Performance Measures
Target
What we wil do towards How Council Wil Know we
achieving the target
have met our target
End of Year Result
Maintain the
Assess roads and
Roading (RAMM)
Our sealed roads compare favourably with national averages on the
District’s roads bridges, plan for their
survey data for Hurunui whole. The folowing indicators are measured across New Zealand for
to a standard
maintenance and
roads compares
comparison purposes and for funding approvals.
appropriate to
upgrade, and contract
favourably with other
their use and
out the work and
rural Councils similar to •
The smooth travel exposure for Hurunui’s roads is 97%. The
traffic volume
monitor performance
Hurunui District
national average is 86% (a higher value is bet er). Smooth
accordingly
Travel Exposure is an index which takes into account both the
roughness and average daily traffic that are measured each year.
•
The percentage of ‘rough’ roads in the Hurunui is 4.6%. The
national average is 9.1% (a lower value is bet er).
•
The pavement integrity index (PI ) measures the health of the
pavements and is generated from the RAMM condition data.
The network average of the PI is reported for historical and future
performance. The PI for Hurunui’s sealed roads is 96.0%. The
national average is 94.1% (a higher value is bet er).
•
The surface condition index (SCI) is a composite index that
describes the network surface condition and alows easy
comparison of historical and future surface conditions. SCI has
two key components: 1.the Condition Index (CI) which is based
on RAMM condition rating data; and 2.the Age Factor Index (AI)
of the surface which uses the surfacing remaining life held in
RAMM. The SCI for Hurunui is 96.1% compared to the national
average of 97.7% (a higher value is bet er).
For further information, refer to www.smartmovz.org.nz/references/
refs/data/road_network_condition.
This provides the latest review data and was produced in November
2010. The new figures are due in November 2011.
Audits of the roading
A technical audit review was completed with NZTA in June 2011. The
network undertaken by auditor’s draft executive summary stated: - “New Zealand Transport
New Zealand Transport Agency’s (NZTA’s) investment in Council’s Land Transport Programme
Agency confirm that
(LTP) is being wel used in maintaining the existing assets. Council has
the roading network
a sound Road Asset Maintenance Management (RAMM) database.
is of a satisfactory
Reports and treatment recommendations based on this are reliable.
condition
Council has been catching up smal maintenance arrears. The local
road network is in generaly good order consistent with the overal
standard of local roads at the national level. The programme of bridges
inspection, repairs and renewals is wel founded.” This indicates that
the audits of our roads have confirmed the roading network is in a
satisfactory condition.
40 Kilometres of
40.4 kilometres of roads were resealed to waterproof them in the
sealed roads have
2010/2011 financial year. This met our target for the year.
waterproof sealing
applied per year
Achieved
Almost Achieved or not measured
Not Achieved
54
Annual Report - 1 July 2010 to 30 June 2011
Target
What we wil do towards How Council Wil Know we
achieving the target
have met our target
End of Year Result
N
IO
T
Undertake an annual 75% of residents
The annual residents’ satisfaction survey results are consistent with
C
residents satisfaction surveyed consider
a smal upward trend overal with the level of satisfaction with the
U
D
survey
the standard of
standard of our sealed local roads with 71% level of satisfaction.
RO
sealed roads to be
Previous year’s results are similar (2010 74%, 2009 69%, 2008 67%).
T
satisfactory
We are keen to improve this satisfaction result and working with
IN
contractors to identify improvements.
55% of residents
The annual residents’ satisfaction survey results show a similar slight
surveyed consider
trending up overal with the level of satisfaction with the standard of our
the standard of
unsealed local roads with 49% level of satisfaction. Previous year’s
unsealed roads to be results are similar (2010 53%, 2009 47%, 2008 42%, 2007 41%).
satisfactory
High levels of satisfaction are more difficult to achieve with unsealed
roads.
ES
S
Increase the amount
An additional
Just over 1 kilometre (1.15km) seal extension was completed
M
IE
of sealed roads
1 kilometre of
in Woodbank Road, Hanmer Springs by Ferguson Brothers Ltd.
O
C
IT
within the total
unsealed roads are
This was achieved through our Seal Extension Policy with the
T
U
IVT
network (currently
sealed each year
cost being the met by the property owners in Woodbank Road
O
C
Y
597 km)
and the Council, rather than through NZTA.
AITN
ILU
C
To provide
Assess streetlights,
Reduce the
8% of street lights are currently “substandard” compared with
M
N
M
U
good quality
plan for their
percentage of sub-
13.1% last year, therefore, a reduction of 5.1% (slightly under
O
O
streetlights
maintenance and
standard streetlights
target). These lights do not necessarily provide poor light but
C
C
upgrade, and
by 6%
are mercury vapour or fluorescent lights that are inefficient
contract out the
to operate. The number of substandard streetlights will be
work and monitor
reassessed again in December 2011. A programme for the
performance
replacement of the remaining Mercury Vapour lights has been
accordingly
established with MainPower for completion (no later than the
end of January 2015).
To provide
Assess kerb and
Reduce the
Our kerb and channel stock currently has 10.2% of its length
S
T
good quality
channel stock, plan
percentage of
with more than 10 deficiencies per 100 metres (down from
EN
kerb and
for its maintenance
deficiencies in the
23.4% two years ago). We have not done any work to address
EM
channel in
and upgrade, and
kerb and channel
this in this financial year because of reduced resourcing on
T
urban areas
contract out the
stock to 4%
account of the Canterbury earthquakes and urgent repairs
work and monitor
being done elsewhere. We will measure the percentage of
L STA
IA
performance
deficiencies again at the end of 2011 to reassess the situation,
C
accordingly
and are making budget provision in the LTP to fund the required
N
A
upgrades.
FIN
To provide
Assess footpaths,
The percentage
The footpath stock in the district had 0.2% of its length with more
good quality
plan for their
of deficiencies in
than 10 deficiencies per 100 metres when it was last measured
footpaths
maintenance and
footpath surfaces
in 2001. No condition rating has been carried out since as there
in all urban
upgrade, and
does not increase
is no budget to do so. However, visual monitoring of footpaths
S
areas
contract out the
is regularly carried out by Council officers or elected reps for
N
work and monitor
safety, particularly trip hazards. Every township maintenance
IO
T
performance
budget has an allowance for footpath repairs to allow for these
ISA
accordingly
hazards to be urgently repaired
N
A
G
R
To provide at least
The percentage of
Throughout the District, there are 43.5 kms of footpaths. 27.9
O
one smooth footpath
urban streets without kms of urban streets have a footpath on only one side of the
in every urban street.
smooth footpaths
street. 7.8 kms of urban streets have footpaths on both sides.
LLED
reduces to 14%
This leaves 39.4 kms or 52% of urban streets without any
RO
footpath at all. Ward committees are continually reassessing
T
N
their priorities and will continue to do so in the LTP, but there
O
is little demand from residents for footpaths in many of the
IL C
District’s villages in order to preserve their rural character.
C
N
U
O
C
Achieved
Almost Achieved or not measured
Not Achieved
Achieved
Almost Achieved or not measured
Not Achieved
55
Hurunui District Council
Target
What we wil do towards How Council Wil Know we
achieving the target
have met our target
End of Year Result
Ensure that
Assess bridges, plan
All bridges are
12 out of the district’s 278 bridges currently have weight
all bridges
for their maintenance capable of carrying
restrictions limiting their load carrying capacity to below Class
are safe
and upgrade, and
class 1 loads
1. This includes a further three sub-standard bridges that were
and well
contract out the
identified as Council assets on paper roads and added to the full
maintained
work and monitor
network assets. A paper road is a road that is legally established
performance
and recorded in survey plans but which hasn’t necessarily been
accordingly
pegged out, formed or maintained by Council. However, in
practical terms, the Council should maintain all road bridges for
the protection of all road users in the district, hence an increase
in asset stock not previously maintained. These are currently
being assessed by our consultants for condition rating and
forward works programme to Class 1. One bridge has been
replaced and another two have been strengthened to enable
them to carry Class 1 loads.
The bridge structure
Calcon Ltd won the Bridging Renewal and Repair Works
component
Contract (Contract No.10/30) and commenced the work in
replacement priority
January 2011. 8 of the 19 bridge structures requiring works
programme will be
have been completed. This contract is on-going and is on target
implemented
for cost and time outcomes.
Records are
In the latest bridge inspection report from Opus International
monitored to ensure
Consultants, they rated the condition of our bridging stock as
all bridge structures
‘good’. Opus said that the bridging stock is consistent with
are regularly
similar networks that have been inspected and maintained on
inspected for future
a regular basis. The road maintenance contractors continue to
works maintenance
undertake bridge inspections monthly in order to identify any
under the road
maintenance works that may be required for prioritised redress.
maintenance
contracts
Do what can
Support the Hurunui
The number of road
In the last year, road crash data revealed no change in our fatal
be done to
District Road Safety
crash fatalities and
crash statistics. There was 1 fatal crash on local roads in 2010
reduce injury
Co-ordinating
injuries on local
and 1 fatal crash in 2009. Our serious injuries on local roads
and fatal
Committee to
roads reduces each
increased in 2010 with 8 serious injuries compared to 3 in 2009.
crashes on
promote a positive
year by 10%
Again, there was an increase in minor injuries in 2010 on local
local roads
road safety culture
roads with19 minor injuries compared with 10 in 2009. This
data is available at the end of each year hence we are using
2010 figures. (These statistics come from the Crash Accident
Statistics for the Hurunui (local roads) database at NZTA.)
The situation in 2011 will be monitored to establish if this trend
continues. In the interim, improvement works will continue on
roads where there are safety issues for our road users. It should
be noted that the funding programme for ‘Demand Management
and Community Programmes’ has been reduced since 2009,
with even further reductions imposed through the new funding
assistance rates in the 2012/15 road maintenance programme
from NZTA.
Achieved
Almost Achieved or not measured
Not Achieved
56
Annual Report - 1 July 2010 to 30 June 2011
N
IO
Financial Detail:
T
C
U
2010/2011
2010/2011
2009/2010
D
Actual
Budget
Actual
RO
T
IN
Roading Network
Operating Statement
OPERATING REVENUE
Rates
2,622,567
2,613,441
2,476,099
Other Income
4,279,699
3,645,788
3,588,197
Internal Interest Received
708,300
708,305
650,435
Vested Assets
32,247
495,886
552,051
Council Overheads (Income)
623,876
623,851
333,347
Total Operating Revenue
8,266,688
8,087,271
7,600,129
ES
S
M
IEO
OPERATING EXPENDITURE
C
IT
Employment Costs
392,860
351,718
353,412
T
U
IV
Other Direct Expenditure
3,230,984
2,609,094
2,601,088
T O
C
Council Overheads
889,061
889,061
633,835
Y
A
Depreciation
2,981,331
3,029,845
2,774,729
IT
N
IL
Total Operating Expenditure
7,494,236
6,879,718
6,363,064
U
C
Operating Surplus (Deficit)
$772,453
$1,207,553
$1,237,064
M
N
M
U
O
O
CAPITAL EXPENDITURE
C
C
Subsidised Roading
3,784,150
4,042,360
3,608,729
Special Purpose Roading
210,945
6,573
130,514
Unsubsidised Roading
0
305,675
0
Road Safety Programme
0
0
0
Technical Services Business Unit
4,862
38,975
2,793
Total Capital Expenditure
$3,999,957
$4,393,583
$3,742,035
S
T
EN
EM
T
L STA
IA
C
N
A
FIN
S
N
IO
T
ISA
N
A
G
R
O
LLED
RO
T
N
O
IL C
C
N
U
O
C
Achieved
Almost Achieved or not measured
Not Achieved
57
Hurunui District Council
4.2 Waste Minimisation
Goal:
To ensure there are opportunities to maximise recycling and minimise residual waste disposed of to
landfill
Performance Measures
Target
What we wil do towards
How Council Wil Know
achieving the target
we have met our target
End of Year Result
To reduce and
Provide a weekly
Household waste
Al urban areas in Hurunui receive a weekly kerbside colection of
process waste
household waste
is colected from
domestic and commercial refuse. In Hanmer Springs, to ensure
and recyclables
colection service in
residents in urban
environmental and economic efficiencies, domestic and commercial
urban areas
areas each week
refuse and recycling is now colected by one vehicle (instead of two as
done in the past). Household glass is also colected from the kerbside
in Hanmer Springs only.
Undertake an annual
90% of urban
The annual residents’ satisfaction survey results show
residents satisfaction
residents (who get
consistent high levels of satisfaction with the standard of
survey
rubbish colected)
our household waste collection service with 95% level of
are satisfied with the
satisfaction. Previous year’s results are also high (2010
household colection
91%, 2009 92%, 2008 93%, 2007 94%). Satisfaction with our
service
household recycling service was measured for the first time
this year and rated 86% satisfaction levels. Of that result, 60%
stated they were ‘very’ satisfied.
Continue to seek
The ‘Solid Waste
We did not meet the end of year target to review and revise the Solid
efficient and ef ective
Management Plan’
Waste Management Plan, but the Plan is now in its draft form for
ways to manage and
is reviewed and
public consultation. The Waste Assessment had to be completed
reduce waste and
revised
prior to reviewing the Waste Management and Minimisation Plan
recyclables
(as now caled). This was done in July 2011. Both the Assessment
and Plan must be completed and submit ed to the Ministry for the
Environment by July 2012.
The Amberley
Regular inspections and checks are undertaken to ensure
Recycling Depot
the consent conditions are met. No issues have emerged and
complies with the
inspections have confirmed that the recycling depot has been
resource consent
compliant with the conditions.
conditions
Develop incentives
Residual waste to
We will continue to maximise the waste diverted from landfill
to reduce residual
landfill reduces by
providing it is affordable for HDC to do so. Due to the
waste to landfill
10%
contractual changes carried out last year, it is not possible for
us to measure the exact reduction in terms of percentages.
Achieved
Almost Achieved or not measured
Not Achieved
58
Annual Report - 1 July 2010 to 30 June 2010
N
IO
Financial Detail:
T
C
U
D
RO
2010/2011
2010/2011
2009/2010
T
IN
Actual
Budget
Actual
Waste Minimisation
Operating Statement
OPERATING REVENUE
Rates
1,686,439
1,691,322
1,725,389
Other Income
189,029
173,500
117,930
Total Operating Revenue
1,875,468
1,864,822
1,843,319
OPERATING EXPENDITURE
IES
Employment Costs
82,298
73,754
72,990
IT
Other Direct Expenditure
1,567,615
1,632,687
1,586,418
IV
T
Internal Interest Paid
9,049
7,572
9,701
C
Council Overheads
125,613
125,615
142,532
IL A
Depreciation
19,418
25,000
15,544
C
Total Operating Expenditure
1,803,993
1,864,628
1,827,185
N
U
Operating Surplus (Deficit)
$71,475
$194
$16,135
O
C
CAPITAL EXPENDITURE
Transfer Stations
191,904
30,000
146,308
Litter Bin Col ection
0
0
0
Refuse Col ection
0
0
0
Total Capital Expenditure
$191,904
$30,000
$146,308
S
T
EN
EM
T
L STA
IA
C
N
A
FIN
S
N
IO
T
A
ISIES
NIT
AGIV
RTC
ODF A
ELLOPS O
RU
TNRO
OG
CILCNUOC
Achieved
Almost Achieved or not measured
Not Achieved
59
Hurunui District Council
4.3 Sewerage
Goal:
To provide proficient, cost-effective sewage disposal schemes relevant to the needs of the community
Performance Measures
Target
What we wil do towards
How Council Wil Know
achieving the target
we have met our target
End of Year Result
Protect public
Maintain sewerage
Sewerage disposal
Al non-compliance issues are folowed up immediately on receipt
health through
disposal and treatment
complies with
of notice from ECan. Steps are taken to mitigate or eliminate repeat
ensuring
facilities in most urban
sanitary standards.
non-compliance orders. Regular monitoring reports are received from
good sanitary
areas of the district
ECan notices of
ECan and any issues of concern are actioned immediately. Latest
standards are in
non-compliance are
summary report from ECan shows that we are fuly compliant with
place
folowed up upon
65% of our resource consent conditions. Of the remainder, 14% had
receipt.
a minor non-compliance, 3% were significantly non-compliant and
18% were not monitored. The non-compliances are largely a result
of the very wet winter and these issues have been largely addressed
for improved outcomes this year. The significant non-compliance
issue relates to the measurement of flows of the river at the point
of discharge. ECan has conceded that this could be too difficult to
measure without an expensive weir structure placed in the river bed
(impediment to natural river flow). The quality of the river’s water is
now measured 200 metres downstream of the discharge point.
This wil negate further significant non-compliance orders – now
only perceived as minor non-compliance until further notice of how
to meet the resource consent condition. This data is captured from
our annual report from Environment Canterbury. Data expressed
above is up to December 2010. Subsequent monitoring has been
interrupted through the Christchurch earthquake incident with ECan’s
focus drawn to the city.
Al shutdowns and
There were no recorded pipe breaks or shut-downs for the financial
pipe breaks are
year 2010/2011. This has been captured from our Customer Service
repaired within 12
Request system.
hours of notification
Achieved
Almost Achieved or not measured
Not Achieved
60
Annual Report - 1 July 2010 to 30 June 2010
N
Financial Detail:
IO
T
C
U
D
2010/2011
2010/2011
2009/2010
RO
Actual
Budget
Actual
T
IN
Sewerage
Operating Statement
OPERATING REVENUE
Rates
553,511
544,634
534,271
Other Income
9,314
307
3,336
Internal Interest Received
4,389
2,884
3,089
Vested Assets
9,240
106,054
0
Development Contributions
89,242
87,640
45,884
Total Operating Revenue
665,695
741,519
586,580
IES
OPERATING EXPENDITURE
IT
IV
Employment Costs
63,142
45,670
80,635
T
Other Direct Expenditure
200,625
183,688
210,809
C
Internal Interest Paid
252,673
188,016
164,704
IL A
Council Overheads
114,001
114,111
106,343
C
N
Depreciation
308,838
356,103
316,965
U
Total Operating Expenditure
939,279
887,588
879,457
O
C
Operating Surplus (Deficit)
($273,584)
($146,069)
($292,877)
CAPITAL EXPENDITURE
District Wide Sewerage
0
106,054
0
Amberley
670,481
223,247
948,098
Cheviot
1,582
0
43,413
Greta Val ey
0
0
4,413
Motunau Beach
2,192
0
1,413
Hanmer Springs
277,607
22,000
73,541
Hawarden
14,432
0
10,470
S
Waikari
4,178
0
13,223
T
Total Capital Expenditure
$970,471
$351,301
$1,094,572
EN
EM
T
L STA
IA
C
N
A
FIN
S
N
IO
T
A
ISIES
NIT
AGIV
RTC
ODF A
ELLOPS O
RU
TNRO
OG
CILCNUOC
Achieved
Almost Achieved or not measured
Not Achieved
61
Hurunui District Council
4.4 Stormwater / Drainage
Goal:
To prevent or minimise adverse ef ects of surface flooding and stormwater discharge
Performance Measures
Target
What we wil do
How Council Wil
End of Year Result
towards achieving
Know we have met
the target
our target
Maintain
Assess, grant and
Al drainage systems
We have 15 resource consent conditions for stormwater systems in
drainage
monitor each drainage
comply with resource
the Hurunui. Of those, 4 fuly comply; 4 have minor non-compliance
systems in
systems resource
consents
issues, and 7 are not monitored (as at September 2010). Two
accordance
consent
of the non-compliant consents are associated with the scour to
with resource
the newly constructed waterway at Lawcocks Road, Amberley,
consents
and the potential of cut debris get ing into the waterway at the
Leithfield Beach Outfal. Al non-compliance works have associated
improvement work programmes to remedy the consent issues.
Those resource consents not monitored in September 2010 are
associated with low risk resource consent conditions and are
subsequently not monitored regularly by the Canterbury Regional
Council (ECan). Information about al of these consents can be
obtained through the Canterbury Regional Council’s customer
services team.
Financial Detail:
2010/2011
2010/2011
2009/2010
Actual
Budget
Actual
Stormwater, Drainage & Land Protection
Operating Statement
OPERATING REVENUE
Rates
254,741
215,419
135,818
Other Income
954
0
0
Internal Interest Received
3,076
3,315
2,772
Development Contributions
34,429
43,634
22,738
Total Operating Revenue
293,200
262,368
161,327
OPERATING EXPENDITURE
Employment Costs
448
0
0
Other Direct Expenditure
306,791
18,963
138,251
Internal Interest Paid
79,544
144,266
22,047
Council Overheads
11,421
11,416
11,883
Depreciation
41,706
17,241
0
Total Operating Expenditure
439,911
191,886
172,181
Operating Surplus (Deficit)
($146,711)
$70,482
($10,854)
CAPITAL EXPENDITURE
Leithfield Outfal
45,547
0
404,218
Amberley
66,199
0
354,860
Hanmer Springs
133,366
0
3,383
Total Capital Expenditure
$245,111
$0
$762,462
Achieved
Almost Achieved or not measured
Not Achieved
62
Annual Report - 1 July 2010 to 30 June 2010
4.5 Water Supply
Goal:
To provide a sustainable supply of water that meets the needs of present and future domestic and
agricultural/horticultural consumers, and complies with the New Zealand Water Standards (2005).
N
IO
Performance Measures
T
C
U
D
What we wil do
How Council Wil
RO
T
Target
towards achieving
Know we have met
End of Year Result
IN
the target
our target
Supply water to
To provide a continuous Major faults to
No faults affecting more than 100 consumers have occurred
consumers to
‘on-demand’ supply of
water supplies that
during the reporting period. This is tracked through our
meet their needs potable water to urban
af ect more than
Customer Service Request (CSR) system for users on a
areas and a restricted
100 consumers are
pipeline greater than 100mm diameter. All after–hours customer
supply of water to rural
repaired within 24
calls go through to our after hours telephone answering service
areas
hours
(Call Care) and requests are logged from the date and time the
call is received from Call Care to ensure enable us to measure
our performance.
IES
No water restrictions
No water restrictions were imposed this year on any of our
IT
IV
are imposed during
schemes.
T
C
periods of high
demand
IL A
C
N
U
Provide safe,
Have an Asset
Asset Management
Our current Asset Management Plan for water was endorsed
O
C
potable water to
Management Plan that
Plan is up to date
by the Council in 2009 and is due to be updated in 2012.
consumers
can be reliably used to
predict future work and
maintenance
Maintain and build
A new water scheme
A new water scheme was not built for Cheviot this year. Two
water schemes to
is built for Cheviot
alternative sources for a water supply to Cheviot have been
comply
monitored and assessed for quality and quantity. In working
with the Cheviot Ward Committee, it was decided to undertake
S
further assessments of other alternative intakes before making
T
a final recommendation to the Council. On-going investigations
EN
are on track for a final resolution for input into the Public Health
EM
T
Risk Management Plan before July 2014, with Canterbury
District Health Board.
L STA
IA
C
Develop and
A water quality
This has not yet been actioned. This is a high priority on our
N
implement the
improvement
forward works programme for 2011/2012. The programme
A
Hurunui Water
programme has
is under investigation and will be finalised with a Water
FIN
Management
been developed
Conservation Strategy associated with each scheme’s review.
Strategy
Water is tested for
Potable water meets Water standards are being monitored either weekly or monthly
quality
safety standards in
(depending on number of consumers) in all schemes. Boil water
S
80% of the District
notices remain in place in some schemes where source water
N
is from shallow intakes and is untreated (risk management
IO
T
approach for contaminated water supply). Our potable water
A
IS
meets safety standards in 85% of the Hurunui District which
IES
N
exceeds our target of 80%.
IT
AGIV
RTC
ODF A
ELLOPS O
RU
TNRO
OG
CILCNUOC
Achieved
Almost Achieved or not measured
Not Achieved
Achieved
Almost Achieved or not measured
Not Achieved
63
Hurunui District Council
What we wil do
How Council Wil
Target
towards achieving
Know we have met
End of Year Result
the target
our target
Undertake an annual 80% of residents
We use two indicators to measure levels of satisfaction with
residents satisfaction consider the quality
the quality of ‘on demand’ water – appearance and taste; and
survey
of ‘on demand’
pressure and flow. The combined satisfaction rating for these
water to be
two indicators equated to 82.5%. The 2011 annual residents’
satisfactory
satisfaction survey shows 79% of residents are satisfied with
the appearance and taste of water. This is an improvement
over last year’s result of 77% (and 62% in 2009). The pressure
and flow results also show an improvement at 86% satisfaction
compared with 84% in 2010 and 79% in 2009.
80% of residents
The quantity of water is measured for our rural water schemes
consider the
in our annual residents’ satisfaction survey. The 2011 results
quantity of water to
are at 86% satisfaction which is an upward trend from previous
be satisfactory
years (84% in 2010 and 64% in 2009).
Financial Detail:
2010/2011
2010/2011
2009/2010
Actual
Budget
Actual
Water Supplies
Operating Statement
OPERATING REVENUE
Rates
3,738,615
3,677,289
3,513,457
Other Income
190,753
75,931
190,560
Internal Interest Received
11,364
4,510
15,329
Vested Assets
10,280
106,054
10,329
Development Contributions
223,589
358,449
240,191
Total Operating Revenue
4,174,601
4,222,233
3,969,865
OPERATING EXPENDITURE
Employment Costs
534,666
526,110
534,431
Other Direct Expenditure
1,602,357
1,556,873
1,361,419
Internal Interest Paid
284,746
354,162
279,407
Council Overheads
786,343
786,355
728,356
Depreciation
827,703
905,939
839,220
Total Operating Expenditure
4,035,815
4,129,439
3,742,834
Operating Surplus (Deficit)
$138,786
$92,794
$227,032
CAPITAL EXPENDITURE
District Wide
0
106,054
0
Amberley
209,672
406,105
308,756
Leithfield Beach
0
110,393
10,174
Ashley Rural
196,687
189,865
279,659
Culverden
2,078
5,125
15,040
Waiau Town
3,167
27,625
1,613
Amuri Plains
12,534
18,500
5,524
Balmoral
1,917
4,115
11,688
Waiau Rural
81,613
25,500
26,518
Cheviot
102,777
664,481
207,116
Waipara
8,433
2,050
25,215
Hanmer Springs
61,166
247,515
131,299
Hawarden - Waikari
4,912
12,920
17,778
Hurunui Rural
246,245
182,950
173,949
Total Capital Expenditure
$931,201
$2,003,198
$1,214,330
Achieved
Almost Achieved or not measured
Not Achieved
64


Annual Report - 1 July 2010 to 30 June 2011
5. Hanmer Springs Thermal Pools and Spa
The individual activity (service) within
this section includes:
N
5.1
Hanmer Springs Thermal Pools and Spa
IO
T
C
U
Achievement of Levels of Service
D
RO
T
The activity listed above has a range of performance
IN
measures to describe the service targets we were
aiming for. These are set out in the following page with a
commentary on how we had performed at the end of year
(the result).
Significant Acquisitions or Replacement
of Assets
ES
S
The full expansion project for the Hanmer Springs Thermal
M
IEO
Pools and Spa was completed prior to Christmas 2010,
C
IT
which was allowed for over a period of three years in the
T
U
IVT
Hurunui Long Term Community Plan
O
C
Y
AITN
IL
Significant Variations between Actual
U
C
M
N
M
U
Result and Annual Plan 2010/11
O
O
C
C
Projections
Total revenue was $293,000 greater than was budgeted
for the year due to increased visitor numbers attracted to
the new facility.
Total Operating Expenditure was up on budget by
$277,000, again due to increased costs associated with
S
the expanded facility. The increased costs included
T
$132,000 in employment costs and $150,000 in other
EN
direct expenditure.
EM
T
Capital Expenditure ended the year $3,236,000 greater
L STA
than the level budgeted for in the Annual Plan due to the
IA
C
majority of the expenditure on the expansion project being
N
A
completed in the 2010/2011 year rather than being spread
over a three year period. The key reason was that due to
FIN
resource consent delays, the construction of a significant
portion of the project was deferred from the 2009/2010 to
the 2010/2011 year.
S
Community Outcomes to Which This
N
IO
T
Group of Activities Primarily Contribute
ISA
N
A Desirable Place to Live, Work and Play:
A
G
R
• strong sense of community that gives people a sense
O
of belonging and encourages them to take part in local
activities, to support essential volunteer services,
LLED
and to be involved in local consultation and decision
RO
T
making
N
O
• attractive, well designed villages that present a positive
IL C
image encouraging people to live in and visit the area
C
N
• opportunities in leisure, art and cultural activities
U
O
C
• effective planning for future development but ensuring
Achieved
Almost Achieved or not measured
Not Achieved
the preservation of local heritage and rural uniqueness
65
Hurunui District Council
5.1 Hanmer Springs Thermal Springs & Spa
Goal: To be a nationally and internationally recognised quality visitor destination
Performance Measures
What we wil do towards
How Council Wil Know we have
Target
End of Year Result
achieving the target
met our target
Manage and
Advertise, market
National and international
The thermal pools and spa expansion program, which
operate the
and promote the
customer numbers to the
included new pools and water features, has resulted
thermal pools
thermal pools and
pool will have increased by
in significant growth over the last five months which
and spa
spa complex
2% per annum
has enabled us to capture the ground lost last year.
complex to
Customer growth was 4% over the year.
attract local,
national and
Ensure the pools and 16,000 local people utilise
Over the year, local residents have used the pool and
international
spa are accessible
the thermal pools and spa
spa facilities 27,004 times. Hurunui residents have
visitors
and affordable to
annually
access to heavily discounted rates for the use of the
people within the
pool facilities. Ratepayers receive 50% off the retail
Hurunui District
prices. In addition, there is an annual family pass for
2 adults and 3 children to use the pool as many times
as they can in a year for $209.
Survey customers to
90% of customers are
A satisfaction survey was conducted and produced
assess their levels of satisfied with the thermal
the following results:
satisfaction with the
pools and spa facilities
complex
91% were satisfied with the cleanliness of the
complex.
91% were satisfied with the water temperature.
92% were satisfied with the friendliness and
helpfulness of staff
Continue to develop
The new development is
The completion of the new development which
and upgrade the
completed
included new and upgraded pools and facilities
thermal pools and
occurred on time and resulted in an official opening
spa facilities
of the complex on 20 December 2010.
Manage the
Operate the complex The thermal complex
Cash surplus (before interest and depreciation)
pools and spa
to an approved
achieves an annual cash
for the pools and spa over the year is on budget at
profitably
business plan
surplus (before interest &
$2.76 million. compared to the cash surplus (before
depreciation) of $2.77 million
interest and depreciation) for 2009/10 of $2.29 million.
Protect the
Monitor and test
Bore water consumption
Bore consumption which now includes two bores
thermal water
the water and take
levels are within consent
averaged 18.72 litres per second. This is within the
for future use
appropriate remedial
parameters at no more than
new consent parameters.
to ensure
action if necessary
11 litres per second
ongoing supply
Water quality is better than
Water quality has exceeded national water standard
the national water standard
of 95% throughout the year.
(which is NZS 5826 2000)
Achieved
Almost Achieved or not measured
Not Achieved
66
Annual Report - 1 July 2010 to 30 June 2010
Financial Detail:
N
2010/2011
2010/2011
2009/2010
IO
T
Actual
Budget
Actual
C
U
D
Hanmer Springs Thermal Pools & Spa (Summary)
RO
T
IN
Operating Statement
OPERATING REVENUE
Other Income
7,700,202
7,407,401
6,768,463
Total Operating Revenue
7,700,202
7,407,401
6,768,463
OPERATING EXPENDITURE
Employment Costs
2,749,880
2,617,818
2,366,473
Other Direct Expenditure
2,223,177
2,073,293
2,134,415
Internal Interest Paid
723,013
723,013
420,416
Council Overheads
71,795
71,796
42,459
Depreciation
722,542
728,000
490,221
Total Operating Expenditure
6,490,407
6,213,920
5,453,984
IES
Operating Surplus (Deficit)
$1,209,795
$1,193,481
$1,314,479
IT
IV
T
C
CAPITAL EXPENDITURE
Hanmer Springs Thermal Pools & Spa
6,894,040
3,658,250
1,983,711
IL A
Total Capital Expenditure
$6,894,040
$3,658,250
$1,983,711
C
N
U
O
C
S
T
EN
EM
T
L STA
IA
C
N
A
FIN
S
N
IO
T
A
ISIES
NIT
AGIV
RTC
ODF A
ELLOPS O
RU
TNRO
OG
CILCNUOC
Achieved
Almost Achieved or not measured
Not Achieved
67
Hurunui District Council
6.
Governance
The individual activity (service) within
this section includes:
6.1
Governance
Achievement of Levels of Service
The activity listed above has a range of performance
measures to describe the service targets we were
aiming for. These are set out in the following page with a
commentary on how we had performed at the end of year
(the result).
Significant Acquisitions or Replacement
of Assets
The only capital expenditure item for the year was the purchase
of a mayoral car. This was not al owed for in the Annual Plan.
Significant Variations between Actual
Result and Annual Plan 2010/11
Projections
Total revenue was $57,000 higher than budget for the
year due reallocating some general rates and funding
from Environment Canterbury to fund the Hurunui-Waiau
Water Zone Committee.
Total Operating Expenditure was up on budget by
$74,000 due to costs associated with the Hurunui-Waiau
Water Zone Committee.
The purchase of the mayoral car was not budgeted for.
Community Outcomes to Which This
Group of Activities Primarily Contribute
A Desirable Place to Live, Work and Play:
• strong sense of community that gives people a sense
of belonging and encourages them to take part in local
activities, to support essential volunteer services,
and to be involved in local consultation and decision
making
• attractive, well designed villages that present a positive
image encouraging people to live in and visit the area
• opportunities in leisure, art and cultural activities
• effective planning for future development but ensuring
the preservation of local heritage and rural uniqueness
68
Annual Report - 1 July 2010 to 30 June 2011
6.1 Governance
Goal: To provide support and leadership to the Hurunui community and to ensure that the interests of residents and
communities are advanced by Council taking a role as 'advocate' on their behalf
N
IO
T
Performance Measures
C
U
D
What we wil do towards How Council Wil Know
RO
T
Target
End of Year Result
IN
achieving the target
we have met our target
Ensure that
Encourage voter
At least 65% of
The triennial local government election was held on 9 October
Council’s
turnout for the
those enrolled; do
2010. The voter turnout was 53% of the voting population in
representation
triennial local
vote in the Hurunui
the Hurunui District. This is slightly higher than the previous
arrangements
government elections
local government
election 3 years ago which had a 50% voter turnout.
are fair and
elections.
ef ective
Represent the
Provide information
75% of residents
The annual residents’ satisfaction survey results confirmed
ES
S
interests of the to the public on key
report confidence in
that there is a 76% level of satisfaction with the Mayor and
M
IEO
Hurunui district issues and invite
Council’s decision
Councillors performance. This is showing an upward trend
C
IT
T
communities
feedback
making
compared with previous years (2010 76%, 2009 75%, 2008
U
IVT
70%).
O
C
Y
AITN
IL
Undertake an annual 80% of residents
The annual residents’ satisfaction survey results confirmed that
U
C
residents satisfaction are satisfied with the there is an 87% level of satisfaction with the Council. This is
M
N
M
U
survey
overall performance showing an upward trend compared with previous years (2010
O
O
C
C
of the Council
83%, 2009 79%, 2008 78%).
Prepare and remit
At the end of each
An analysis of the Council’s submissions has not been
written submissions
year, Council will
undertaken. Many submissions, feedback and survey
to other organisations review the number
responses have been completed on behalf of the Council in
proposals to
of submissions and
the 2010/11 year to a large number of organisations, but due
encourage good
remits it has made
to the range of remits and the number of staff involved, the
outcomes for the
on behalf of the
data has not been collated into one place.
Hurunui District
District and consider
Examples of submissions made include:
S
T
the impact
•
Canterbury Museum to encourage a prudent approach
EN
to spending and for the regulations to be reviewed. This
EM
resulted in a positive response.
T
•
Canterbury Regional Council to support their work but
L STA
to also question spending on projects. Resulted in a
IA
positive response.
C
N
•
Canterbury Regional Policy Statement 2011 of which the
A
outcome is yet to be decided.
FIN
•
National Policy Statement on Indigenous Biodiversity of
which the outcome is yet to be decided.
•
Government’s Alcohol Reform Bill to support a national
submission making recommendations around definitions,
local alcohol polices, licensing processes, and fees.
S
•
State Highway Classification System
N
•
National Environmental Standard Plantation Forestry
IO
T
ISA
N
A
G
R
O
LLED
RO
T
N
O
IL C
C
N
U
O
C
Achieved
Almost Achieved or not measured
Not Achieved
69
Hurunui District Council
Financial Detail:
2010/2011
2010/2011
2009/2010
Actual
Budget
Actual
Governance (Summary)
Operating Statement
OPERATING REVENUE
Rates
678,978
648,595
730,843
Other Income
26,354
0
(720)
Internal Interest Received
70,836
70,831
57,973
Total Operating Revenue
776,168
719,426
788,096
OPERATING EXPENDITURE
Employment Costs
323,986
285,057
282,433
Other Direct Expenditure
231,252
195,687
186,707
Council Overheads
240,060
240,061
347,827
Total Operating Expenditure
795,298
720,805
816,966
Operating Surplus (Deficit)
($19,130)
($1,379)
($28,870)
CAPITAL EXPENDITURE
Governance
28,168
0
0
Total Capital Expenditure
$28,168
$0
$0
70
Annual Report - 1 July 2010 to 30 June 2011
Financial Statements
STATEMENT OF COMPREHENSIVE INCOME
N
FOR THE YEAR ENDED 30 JUNE 2011
IO
T
C
Group
Council
U
Actual
Actual
Actual
Budget
Actual
D
Notes
2011
2010
2011
2011
2010
RO
T
$000's
$000's
$000's
$000's
$000's
IN
Revenue
District Wide Rates & Rate Penalties
3
5,198
5,185
5,198
5,111
5,185
Targeted Rates
3
7,273
6,778
7,273
7,122
6,778
Development Contributions
3
509
456
509
822
456
Interest Received
3
53
146
53
10
145
NZTA Subsidies
3
3,989
3,436
3,989
3,354
3,436
Hanmer Springs Thermal Pools & Spa
3
7,700
6,768
7,700
7,549
6,768
Vested Asset Income
3
6,349
562
6,349
708
562
Other Income
3
3,457
4,586
3,457
3,304
4,586
Gains/(Losses) on Forestry Revaluation
30
503
30
0
503
Gains/(Losses) on Sale of Investments
0
73
0
0
73
34,558
28,493
34,558
27,980
28,492
IES
IT
IV
Less Expenditure
T
C
Employee Benefits
4
8,110
7,573
8,110
7,887
7,573
IL A
Direct Expenditure
5
14,278
12,722
14,278
12,539
12,721
C
Finance Expenses
5
448
0
448
625
0
N
U
Depreciation & Amortisation
5
5,522
5,122
5,522
5,798
5,122
O
C
Total Operating Expenditure
28,358
25,417
28,358
26,849
25,416
Operating Surplus/(Deficit) before tax
6,200
3,076
6,200
1,131
3,076
Share of associates surplus/(deficit)
15
39
5
0
0
0
Net Surplus/(Deficit) before tax
6,239
3,081
6,200
1,131
3,076
Tax Expense
6
0
0
0
0
0
Net Surplus/(Deficit) after tax
6,239
3,081
6,200
1,131
3,076
Add Other Comprehensive Income
Gains/(Losses) on Asset Revaluation
10
4,688
33,432
4,688
0
33,432
S
Gains/(Losses) in Fair Value of Shares
14
0
14
0
0
S
TT
4,702
33,432
4,702
0
33,432
NEN
E
Total Compehensive Income
10,941
36,513
10,902
1,131
36,508
MEM
ET
TAT
L STA
SLIAC
IAN
CA
NAFIN
INF
S
N
IO
T
ISA
N
A
G
R
O
LLED
RO
T
N
O
IL C
C
N
U
O
C
The accompanying notes form part of the financial statements
The accompanying note
71
s from part of the financial statements
Hurunui District Council
STATEMENT OF FINANCIAL POSITION
AS AT 30 JUNE 2011
Group
Council
Actual
Actual
Actual
Budget
Actual
Notes
2011
2010
2011
2011
2010
$000's
$000's
$000's
$000's
$000's
Assets
Current Assets
Cash and cash equivalents
7
1,839
2,326
1,839
86
2,326
Trade and other receivables
8
1,762
1,455
1,762
4,723
1,455
Inventories
162
171
162
110
171
Non-current assets held for sale
9
372
470
372
440
470
Total current assets
4,135
4,422
4,135
5,359
4,422
Non-current assets
Property, plant and equipment
- Operational
10
41,301
30,647
41,301
29,002
30,647
- Restricted
10
35,136
27,441
35,136
38,240
27,441
- Infrastructure
10
252,599
247,944
252,599
219,773
247,944
Intangible assets
11
122
93
122
21
93
Forestry assets
12
2,212
2,182
2,212
1,679
2,182
Other financial assets
14
330
325
330
332
325
Investments in associates
15
207
168
0
0
0
Total non-current assets
331,907
308,800
331,700
289,047
308,632
Total assets
336,042
313,222
335,835
294,406
313,054
Liabilities
Current liabilities
Trade and other payables
17
3,000
2,900
3,000
5,929
2,900
Landfill aftercare provision
18
8
8
8
8
8
Employee benefits
19
881
763
881
0
763
Income in advance
908
841
908
0
841
Total current liabilities
4,797
4,512
4,797
5,937
4,512
Non-current liabilities
Term debt
20
11,402
0
11,402
13,200
0
Landfill aftercare provision
18
221
151
221
167
151
Derivative financial instruments
13
122
0
122
0
0
Total non-current liabilities
11,745
151
11,745
13,367
151
Total liabilities
16,542
4,663
16,542
19,304
4,663
Net assets
319,500
308,559
319,293
275,102
308,391
Equity
Asset revaluation reserve
21
163,659
159,204
163,659
144,220
159,204
AFS investments revaluation reserve
21
92
78
92
0
78
Other reserves
21
278
1,970
278
4,698
1,970
Retained earnings
21
155,471
147,307
155,264
126,184
147,139
Total Equity
319,500
308,559
319,293
275,102
308,391
The accompanying notes from part of the financial statements
The accompanying notes form part of the financial statements
72
Annual Report - 1 July 2010 to 30 June 2011
STATEMENT OF CHANGES IN EQUITY
FOR THE YEAR ENDED 30 JUNE 2011
N
Group
Council
IO
T
Actual
Actual
Actual
Budget
Actual
C
Notes
2011
2010
2011
2011
2009
U
D
$000's
$000's
$000's
$000's
$000's
RO
T
Equity at Start of Year
308,559
272,046
308,391
273,970
271,883
IN
Add Total Comprehensive Income for Year
10,941
36,513
10,902
1,132
36,508
Equity at End of Year
21
319,500
308,559
319,293
275,102
308,391
IES
IT
IV
T
C
IL A
C
N
U
O
C
SS
TT
NEN
EMEM
ET
TAT
L STA
SLIAC
IAN
CA
NAFIN
INF
S
N
IO
T
ISA
N
A
G
R
O
LLED
RO
T
N
O
IL C
C
N
U
O
C
The accompanying notes form part of the financial statements
73
The accompanying notes from part of the financial statements
Hurunui District Council
STATEMENT OF CASH FLOWS
FOR THE YEAR ENDED 30 JUNE 2011
Group
Council
Actual
Actual
Actual
Budget
Actual
Notes
2011
2010
2011
2011
2010
$000's
$000's
$000's
$000's
$000's
Cash flows from operating activities
Revenue
27,830
29,993
27,830
27,263
29,993
Agency receipts
2,637
2,436
2,637
2,243
2,436
Interest received
137
138
137
10
138
Dividends received
69
33
69
0
33
Payments to suppliers and employees
(21,067)
(22,581)
(21,067)
(20,426)
(22,581)
Interest and other costs of finance paid
(283)
0
(283)
(625)
0
Agency payments
(2,637)
(2,436)
(2,637)
(2,243)
(2,436)
Net GST Movement
(64)
175
(64)
0
175
Net cash from operating activities
22
6,622
7,758
6,622
6,222
7,758
Cash flows from investing activities
Payment on Loan
9
0
9
0
0
Proceeds from the sale of plant, property & equipment
308
0
308
0
0
Proceeds on sale of investments
0
2,112
0
0
2,424
Payment for plant, property & equipment
(18,828)
(10,186)
(18,828)
(11,599)
(10,186)
Net cash from investing activities
(18,511)
(8,074)
(18,511)
(11,599)
(7,762)
Cash flows from financing activities
Proceeds from the issue of debt securities
11,402
0
11,402
5,700
0
Net cash from financing activities
11,402
0
11,402
5,700
0
Increase/(decrease) in cash & cash equivalents
(487)
(316)
(487)
323
(4)
Cash and cash equivalents as 1 July
2,326
2,642
2,326
(237)
2,330
Cash and cash equivalents as 30 June
1,839
2,326
1,839
86
2,326
The GST (net) component of operating activities reflect the net GST paid and received with the Inland Revenue Department.
The GST (net) component has been presented on a net basis, as the gross amounts do not provide meaningful information
for financial statement purposes.
The accompanying notes from part of the financial statements
The accompanying notes form part of the financial statements
74
Annual Report - 1 July 2010 to 30 June 2011
Notes to the Financial Statements
1. Statement of Accounting Policies for the year ended 30 June 2011
Reporting Entity
consistently to all periods presented in these financial
N
statements.
IO
T
Hurunui District Council is a territorial local authority as
C
U
governed by the Local Government Act 2002 and is Standards, amendments and
D
domiciled in New Zealand.
RO
interpretations
T
IN
The Hurunui District Council group consists of the ultimate Standards, amendments and interpretations issued but
parent Hurunui District Council (HDC) and its subsidiary not yet effective that have not been early adopted, and
Hurunui Holdings Limited (HHL) (100% owned), associate which are relevant to the HDC include:
Enterprise North Canterbury (50% equity share), • NZ IAS 24 Related Parties (revised 2009) is effective for
Canterbury Economic Development Company Limited
reporting periods beginning on or after 1 January 2011.
(10%) and Transwaste Canterbury Limited (1.2%). All
The standard has been revised to simplify the definition
HDC subsidiaries and associates are incorporated and
of a related party, clarifying its intended meaning and
domiciled in New Zealand.
eliminating inconsistencies from the definition and
providing a partial exemption from the disclosure
The primary objective of HDC is to provide goods and
requirements for government-related entities.
IES
services for the community or social benefit rather
IT
IV
than making a financial return. Accordingly, HDC has • NZ IFRS 9 Financial Instruments (issued 2009) is
T
C
designated itself and the group as public benefit entities for
effective for annual periods beginning on or after 1
the purposes of New Zealand equivalents to International
IL A
January 2013. The standard will eventually replace
C
Financial Reporting Standards (“NZ IFRS”).
N
NZ IAS 39 Financial Instruments: Recognition and
U
Measurement. NZ IAS 39 is being replaced through
O
C
The administrative seat of HDC is situated at Amberley.
the following 3 main phases: Phase 1 Classification
The financial statements of HDC are for the year ended
and Measurement, Phase 2 Impairment Methodology,
30 June 2011 and were authorised for issue by HDC on 24
and Phase 3 Hedge Accounting. Phase 1 on the
November 2011.
classification and measurement of financial assets
has been completed and has been published in the
Basis of Preparation
new financial instrument standard NZ IFRS 9. NZ
IFRS 9 uses a single approach to determine whether
Statement of compliance
a financial asset is measured at amortised cost or fair
SS
T
value, replacing the many different rules in NZ IAS
T
N
The financial statements for HDC have been prepared in
39. The approach in NZ IFRS 9 is based on how an
EN
EMEM
E
accordance with the requirements of the Local Government
entity manages its financial instruments (its business
T
TA
Act 2002, which includes the requirement to comply with
model) and the contractual cash flow characteristics of
T
New Zealand generally accepted accounting practice (“NZ
the financial assets. The new standard also requires
L STA
SLIA
GAAP”).
a single impairment method to be used, replacing the
C
IA
N
C
many different impairment methods in NZ IAS 39.
A
NA
The financial statements have been prepared in
FIN
IN
accordance with NZ GAAP. They comply with NZ IFRS • FRS-44 New Zealand Additional Disclosures and
F
and other applicable financial reporting standards as
Amendments to NZ IFRS to harmonise with IFRS
appropriate for public benefit entities.
and Australian Accounting Standards (Harmonisation
Amendments) – These were issued in May 2011
Measurement base
with the purpose of harmonising Australia and New
S
N
Zealand’s accounting standards with source IFRS
IO
The financial statements have been prepared on the
T
and to eliminate many of the differences between
ISA
historical cost basis, modified by the revaluation of certain
the accounting standards in each jurisdiction. The
N
assets.
A
amendments must first be adopted for the year ended
G
R
30 June 2012. HDC has not yet assessed the effects
O
Functional and presentation currency
of FRS-44 and the Harmonisation Amendments.
LLED
The financial statements are presented in New Zealand Significant Accounting Policies
RO
T
dollars and all values are rounded to the nearest thousand
N
dollars ($’000). The functional currency of the HDC is New
O
Basis of Consolidation
Zealand dollars.
IL C
C
The purchase method is used to prepare the consolidated
N
U
Changes in accounting policies
financial statements, which involves adding together like
O
C
items of assets, liabilities, equity, income and expenses
The accounting policies set out below have been applied on a line-by-line basis. All significant intragroup balances,
75
Hurunui District Council
transactions, income and expenses are eliminated on HDC’s share in the associate’s surplus or deficits resulting
consolidation.
from unrealised gains on transactions between the HDC
and its associates is eliminated. HDC’s investments in
Subsidiaries
associates are carried at cost in HDC’s own “parent entity”
financial statements.
HDC consolidates its subsidiaries in the group financial
statements all entities where HDC has the capacity Revenue
to control their financing and operating policies so as
to obtain benefits from the activities of the entity. This Revenue is measured at the fair value of consideration
power exists where HDC controls the majority voting received.
power on the governing body or where such policies
have been irreversibly predetermined by HDC or where Rates revenue
the determination of such policies is unable to materially
impact the level of potential ownership benefits that arise Rates are set annually by a resolution from HDC and
from the activities of the subsidiary.
relate to a financial year. All ratepayers are invoiced within
the financial year to which the rates have been set. Rates
HDC measures the cost of a business combination as the revenue is recognised when payable. Rates collected on
aggregate of the fair values, at the date of exchange, of behalf of the Canterbury Regional Council (ECan) are not
assets given, liabilities incurred or assumed, in exchange recognised in the financial statements as HDC is acting as
for control of the subsidiary plus any costs directly an agent for ECan.
attributable to the business combination.
Water revenue
Any excess of the cost of the business combination over
HDC’s interest in the net fair value of the identifiable Water Billing is recognised on volumes delivered on
assets, liabilities and contingent liabilities is recognised accrual basis.
as goodwill. If HDC’s interest in the net fair value of the
identifiable assets, liabilities and contingent liabilities Land Transport New Zealand subsidies
recognised exceeds the cost of the business combination,
the difference will be recognised immediately in the Land Transport New Zealand roading subsidies are
statement of comprehensive income.
recognised as revenue upon entitlement which is when
conditions pertaining to eligible expenditure have been
Investments in subsidiaries are valued as available for fulfilled.
sale investments in HDC’s own “parent entity” financial
statements.
Contract revenue
Associates
Revenue from a contract to provide services is recognised
by reference to the stage of completion of the contract
HDC accounts for an investment in an associate in the at the balance sheet date based on the actual service
group financial statements using the equity method. An provided as a percentage of total services to be provided.
associate is an entity over which the HDC has significant
influence and that is neither a subsidiary nor an interest in User charges
a joint venture. The investment in an associate is initially
recognised at cost and the carrying amount is increased Sales of goods are recognised when the significant
or decreased to recognise HDC’s share of the surplus risks and rewards of ownership of the assets have been
or deficit of the associate after the date of acquisition. transferred to the buyer which is usually when the goods
HDC’s share of the surplus or deficit of the associate is are delivered and title has passed.
recognised in HDC’s statement of comprehensive income.
Distributions received from an associate reduce the Interest revenue
carrying amount of the investment.
Interest income is accrued on a time basis, by reference to
If HDC’s share of an associate’s deficit equals or exceeds the principal outstanding and at the effective interest rate
its interest in the associate, HDC discontinues recognising applicable.
its share of further deficits. After HDC’s interest is reduced
to zero, additional deficits are provided for, and a liability is Dividend revenue
recognised, only to the extent that HDC has incurred legal
or constructive obligations or made payments on behalf Dividend income from investments is recognised as
of the associate. If the associate subsequently reports revenue, net of imputation credits, when the shareholders’
surpluses, HDC will resume recognising its share of those rights to receive payment have been established.
surpluses only after its share of surpluses equals the share
of deficits not recognised.
76
Annual Report - 1 July 2010 to 30 June 2011
Other revenue
Deferred tax is calculated at the tax rates that are expected
to apply in the period when the liability is settled or the
Other revenue including assets vested in HDC, with or asset is realised, using tax rates that have been enacted
N
without restrictions, is recognised as revenue when control or substantially enacted by balance date.
IO
over the assets is obtained.
T
C
Current tax and deferred tax is charged or credited to
U
D
Development contributions
the statement of comprehensive income, except when it
RO
relates to items charged or credited directly to equity, in
T
IN
Development contributions are recognised as revenue which case the tax is dealt with in equity.
when the HDC provides, or is able to provide, the service
for which the contribution was charged. Otherwise Leases
development contributions are recognized as liabilities until
such time the HDC provides, or is able to provide, the service.
Operational leases
Development contributions are classified as part of “Other
Revenue”.
An operating lease is a lease that does not transfer
substantially all the risks and rewards incidental to
Borrowing costs
ownership of an asset. Lease payments under an operating
lease are recognised on a straight-line basis over the lease
IES
IT
term.
IV
All borrowing costs are recognised as expenses in the
T
C
statement of comprehensive income in the period in which
they are incurred.
Cash and cash equivalents
IL A
C
N
Cash and cash equivalents comprise cash in hand, demand
U
O
Income tax
deposits and other short-term highly liquid investments
C
that are readily convertible to a known amount of cash and
Income tax in relation to the surplus or deficit for the period are subject to an insignificant risk of changes in value, and
comprises current tax and deferred tax.
with original maturities of three months or less.
Current tax is the amount of income tax payable on the
taxable profit for the current year, plus any adjustments Trade and other receivables
to income tax payable in respect of prior years. Current
tax is calculated using rates that have been enacted or Trade and other receivables are initially measured at fair
S
value and subsequently measured at amortised cost using
S
T
substantively enacted at balance date.
T
N
the effective interest rate method, less any provision for
EN
EM
impairment.
EM
E
Deferred tax is the amount of income tax payable or
T
TA
recoverable in future periods in respect of temporary
T
differences and unused tax losses. Temporary differences Inventories
L STA
SLIA
are differences between the carrying amount of assets and
C
IA
Inventories are stated at the lower of cost and net
N
C
liabilities in the financial statements and the corresponding
A
N
realisable value. Cost comprises direct materials and,
A
tax bases in the computation of taxable profit.
FIN
IN
where applicable, direct labour costs and those overheads
F
Deferred tax liabilities are generally recognised for that have been incurred in bringing the inventories to their
taxable temporary differences and deferred tax assets are present location and condition. Cost is calculated using
recognised to the extent that it is probable that taxable the weighted average method.
profits will be available against which deductible temporary
S
N
differences can be utilised.
Net realisable value represents the estimated selling price
IO
less all estimated costs of completion and costs to be
T
incurred in marketing, selling and distribution.
ISA
Deferred tax is not recognised if the temporary difference
N
A
arises from the initial recognition of goodwill or from the
G
R
initial recognition of an asset and liability in a transaction Financial Assets
O
that is not a business combination, and at the time of
the transaction, affects neither the accounting profit nor The Group classifies its financial assets into the following
LLED
taxable profit.
four categories: financial assets at fair value through profit
RO
T
or loss, held to maturity investments, loans and receivables
N
O
Deferred tax is recognised on taxable temporary differences and financial assets at fair value through equity.
arising on investments in subsidiaries and associates, and
IL C
C
interests in joint ventures, except where the company can The classification depends on the purpose for which the
N
U
control the reversal of the temporary difference and it is investments were acquired. Management determines the
O
C
probable that the temporary difference will not reverse in classification of its investments at initial recognition and re-
the foreseeable future.
evaluates the designation every reporting date.
77
Hurunui District Council
Financial assets and liabilities are initially measured at fair Such derivatives are initially recorded at fair value on
value plus transaction costs unless they are carried at fair contract date and are adjusted to fair value at subsequent
value through profit and loss in which case transaction reporting dates. Changes in the fair value of derivative
costs are recognised in the statement of comprehensive financial instruments are recognised in the statement of
income.
comprehensive income as they arise.
Investments
Non-current assets held for sale
Investments are recognised on a trade-date basis and Non-current assets are classified as held for sale if their
are initially measured at fair value, including transaction carrying amount will be recovered principally through a
costs. At subsequent reporting dates, debt securities that sale transaction, not through continuing use. Non-current
the Group has the expressed intention and ability to hold assets held for sale are measured at the lower of their
to maturity (held-to-maturity debt securities) are measured carrying amount and fair value less costs to sell.
at amortised cost using the effective interest rate method,
less any impairment loss recognised to reflect irrecoverable Any impairment losses for write downs or non-current
amounts.
assets held for sale are recognised in the statement
of comprehensive income. Any increase in fair value
Investments other than held-to-maturity debt securities are (less costs to sell) are recognised up to the level of any
classified as either held-for-trading or available-for sale, impairment losses that have been previously recognised.
and are measured at subsequent reporting dates at fair
value.
Non-current assets (including those that are part of a
disposal group) are not depreciated or amortised while
Where securities are held for trading purposes, gains and they are classified as held for sale. Interest and other
losses arising from changes in fair value are included in expenses attributable to the liabilities of a disposal group
the statement of comprehensive income for the period.
classified as held for sale continue to be recognised.
For available-for-sale investments, gains and losses Property, plant & equipment
arising from changes in fair value are recognised directly
in equity, until the security is disposed of or is determined
to be impaired, at which time the cumulative gain or loss Property, plant and equipment consists of:
previously recognised in equity is included in the statement
• Operational assets — These include land, buildings,
of comprehensive income for the period.
landfill post closure, library books, plant and equipment,
and motor vehicles.
Impairment of investments
• Restricted assets — Restricted assets are parks and
An impairment loss is recognised in the statement of
reserves owned by HDC which provide a benefit or
comprehensive income when there is objective evidence
service to the community and cannot be disposed of
that the asset is impaired, and is measured as the
because of legal or other restrictions.
difference between the investment’s carrying amount
and the present value of estimated future cash flows
• Infrastructure assets — Infrastructure assets are the
discounted at the effective interest rate computed at initial
fixed utility systems owned by HDC. Each asset class
recognition. Impairment losses are reversed in subsequent
includes all items that are required for the network.
periods when an increase in the investment’s recoverable
amount can be related objectively to an event occurring Property, Plant and Equipment are at stated values less
after the impairment was recognised, subject to the accumulated depreciation and impairment losses.
restriction that the carrying amount of the investment at
the date the impairment is reversed shall not exceed what Fixtures and Fittings, Motor Vehicles, Plant and Equipment,
the amortised cost would have been had the impairment and Library Books are stated at cost less accumulated
not been recognised.
depreciation and impairment losses.
Derivative financial instruments
Additions
The Group uses derivative financial instruments (primarily The cost of an item of property, plant and equipment is
interest rate hedges) to hedge the risks associated with recognised as an asset if, and only if, it is probable that
interest rate movements. The use of financial derivatives future economic benefits or service potential associated
is governed by the Group’s policies approved by the HDC with the item will flow to the Group and the cost of the item
which provide written principles on the use of financial can be measured reliably.
derivatives consistent with the Group’s risk management
strategy. The Group does not use derivative financial In most instances, an item of property, plant and equipment
instruments for speculative purposes.
is recognised at its cost. Where an asset is acquired at no
78
Annual Report - 1 July 2010 to 30 June 2011
cost, or for a nominal cost, it is recognised at fair value as Vested infrastructure assets have been valued based on
at the date of acquisition.
the estimated quantities of infrastructure components
vested and the current “in the ground” cost of providing
N
Disposals
identical services.
IO
T
C
Gains and losses on disposals are determined by Infrastructural asset classes; roads, water reticulation,
U
D
comparing the proceeds with the carrying amount of the sewerage reticulation and stormwater systems
RO
asset. Gains and losses on disposals are recognised in
T
IN
the statement of comprehensive income. When revalued Infrastructural assets are recorded at valuation established
assets are sold, the amounts included in asset revaluation using depreciated replacement cost, plus additions at
reserves in respect of those assets are transferred to cost less accumulated depreciation and accumulated
retained earnings.
impairment losses. The revaluation of infrastructural
assets is carried out on a three yearly cycle or as required.
Revaluation
The roading valuation includes land under the roading
An assets fair value at the date of revaluation is equal to network. The valuation of this land is based on the
the revalued amount. Revaluations are performed with average rateable value of land in the associated ward as
sufficient regularity such that the carrying amount does determined by QV Valuations (Registered Valuers) as at
IES
not differ materially from that which would be determined 30 June 2005. Under NZ IFRS HDC has elected to use
IT
using fair values at balance date and this is generally the fair value of the land under roads as at 30 June 2005
IV
T
every three years.
at deemed cost. Land under roads is no longer revalued.
C
IL A
C
Revaluation increments and decrements are credited or Roading assets have been valued at depreciated
N
U
debited to the asset revaluation reserve for that class of replacement cost as at 30 June 2010. The valuation was
O
asset. Where this results in a debit balance in the asset performed internally by HDC’s Roading Engineer – Asset
C
revaluation reserve, this balance is expensed in the Management, J Whyte and peer reviewed by George
statement of comprehensive income. Any subsequent JasonSmith, BE(NSW), MIPENZ(Civil), CPEng, Principal
increase on revaluation that offsets a previous decrease Asset Management Consultants for AECOM New Zealand
in value is recognised in the statement of comprehensive Limited. Additions and disposals after the date of valuation
income. Any increase will be recognised up to the amount will be recorded at cost.
previously expensed, and then credited to the revaluation
reserve for that class of asset.
Water and Sewage Assets have been valued at
S
depreciated replacement cost as at 1 July 2009. The
S
TT
N
Operational Land, Buildings and Pools
valuation was performed internally by the Manager of
EN
EM
Engineering Services, B M Yates, Registered Engineer
EM
E
Land, Buildings and Pools were valued by Darroch Limited
T
T
and peer reviewed by M Clough, Registered Valuer of
A
T
(Registered Valuers) as at 30 June 2011. The basis of Beca Valuations Limited. Additions and disposals since
L STA
S
valuation is fair value with reference to highest and best
L
the date of valuation have been recorded at cost.
IA
C
IA
use, as at 30 June 2011. They are stated at valuation less
N
C
A
accumulated depreciation and accumulated impairment.
N
Stormwater and Drainage Assets have been valued at
A
depreciated replacement cost as at 30 June 2011. The
FIN
INF
Properties in the course of construction for production, valuation was performed internally by HDC’s Technical
rental or administrative purposes, or for purposes not Officer - Utilities, D Perry and peer reviewed by M Clough,
yet determined, are carried at cost, less any recognised Registered Valuer of Beca Valuations Limited. Additions
impairment loss. Cost includes professional fees.
and disposals since the date of valuation have been
S
recorded at cost.
N
Subsequent costs are included in the asset’s carrying
IO
T
amount or recognised as a separate asset, as appropriate, Certain infrastructural assets have been vested in HDC
ISA
only when it is probable that future economic benefits as part of the subdivision consent process. Vested
N
A
associated with the item will flow to HDC and the cost infrastructure assets have been valued based on the
G
R
of the item can be measured reliably. All other repairs estimated quantities of the components vested in HDC.
O
and maintenance are charged to the statement of
comprehensive income during the financial period in which
LLED
Depreciation
RO
they are incurred.
T
N
Depreciation is provided on a straight line basis on all
O
Restricted Assets
property, plant and equipment and intangible assets other
IL C
than land and heritage assets, at rates which will write
C
Certain infrastructure assets and land have been vested
N
off the cost (or valuation) of the assets to their estimated
U
in HDC as part of the subdivisional consent process. The
O
residual values over their useful lives. Depreciation of
C
vested reserve land has been initially recognised at the these assets commences when the assets are ready for
most recent appropriately certified government valuation. their intended use.
79
Hurunui District Council
Depreciation on revalued assets is charged to the
statement of comprehensive income. On the subsequent
sale or retirement of a revalued asset, the attributable
Useful Life
Depreciation Rate
revaluation surplus remaining in the properties revaluation
reserve is transferred directly to retained earnings.
Buildings - wooden (excluding
properties intended for sale)
50 years
2%
The gain or loss arising on the disposal or retirement of an
Buildings - concrete (excluding
asset is determined as the difference between the sales
properties intended for sale)
100 years
1%
Furniture and fittings:
proceeds and the carrying amount of the asset and is
administration
5 years
20%
recognised in the statement of comprehensive income.
Furniture and fittings:
pensioner flats
10 years
10%
The useful lives and associated depreciation rates of major
Library books
3 – 8 years
12.5 – 33.33%
classes of assets have been estimated in the table to the
Computer hardware
3 – 4 years
25 – 33.33%
right.
Motor vehicles
5 years
20%
Thermal pools - plant
5 years
20%
Thermal pools – development
expenditure
20 – 100 years
1% - 5%
Intangible assets
Plant and machinery (excluding
HDC’s infrastructural assets)
10 years
10%
Small plant and machines
3 - 10 years
10 - 33.33%
Software acquisition and development
Car parks
20 – 25 years
4 – 5%
Landscaping
10 – 50 years
2 – 10%
Acquired computer software licenses are capitalised on
Roads, Streets and Bridges
the basis of the costs incurred to acquire and bring to use
- Land under roads
Not depreciated
0%
the specific software.
- Pavement formation
Not depreciated
0%
- Pavement layers (sealed)
100 years
1%
- Pavement layers (unsealed)
Not depreciated
0%
Costs associated with maintaining computer software are
- Pavement surface (sealed)
Average 16 years
6.25%
recognised as an expense when incurred. Costs that are
- Pavement surface (unsealed)
12 years
8.33%
directly associated with the development of software for
- Culverts
25 – 50 years
2 – 4%
internal use by the Group are recognised as an intangible
- Kerb and channel
50 – 80 years
1.25 – 2%
- Footpaths
20 – 75 years
1.33 – 5%
asset. Direct costs include the software development
- Bridges – timber
70 years
1.43%
employee costs and an appropriate portion of the relevant
- Bridges – concrete and other
100 years
1%
overheads.
- Retaining walls
50 years
2%
- Traffic signs
12 years
8.33%
- Street lighting
15 – 25 years
4 – 6.67%
Amortisation
Sewerage
- Pipes
50 – 80 years
1.25 – 2%
The carrying value of intangible assets with a finite life
- Pipes other
40 years
2.5%
is amortised on a straight-line basis over its useful life.
- Pumps and controls
10 – 25 years
4 – 10%
Amortisation begins when the assets is available for use
- Manholes
50 – 80 years
1.25 – 2%
- Treatment plant
25 – 60 years
1.67 – 4%
and ceases at the date that the asset is derecognised.
Water
The amortisation charge for each period is recognised in
- Pipes
50 – 80 years
1.25 – 2%
the statement of comprehensive income.
- Pipes other
50 – 80 years
1.25 – 2%
- Reservoir and tanks
80 years
1.25%
- Pumps and controls
10 – 25 years
4 – 10%
The useful lives and associated amortisation rates of
- Pump stations/intakes
20 – 60 years
1.67 – 5%
major classes of intangible assets have been estimated
- Treatment plant
10 – 80 years
1.25 – 10%
as follows:
Drainage
• Computer software 3 – 4 years 25 – 33%
- Points
80 years
1.25%
• Aerial Photos
10 years
10%
- Lines
50 - 80 years
1.25 – 2%
Forestry assets
Forestry and other biological assets are stated at fair value
less estimated point-of-sale costs, with any resultant gain
or loss recognised in the statement of comprehensive
income. Point-of-sale costs include all costs that would be
necessary to sell the assets, excluding costs necessary to
transport the assets to market.
The fair value of standing timber older than 10 years, being
the age at which it becomes marketable, is based on the
market price of the estimated recoverable wood volumes,
80
Annual Report - 1 July 2010 to 30 June 2011
net of harvesting costs. The fair value of younger standing losses had been previously charged to comprehensive
timber is based on the present value of the net cash flows income.
expected to be generated by the plantation at maturity. The
N
present values are calculated using a pre-tax discount rate Creditors and other payables
IO
that reflects current market assessments of the time value
T
C
of money and the risks specific to the asset.
U
Creditors and other payables are initially measured at fair
D
value and subsequently measured at amortised cost.
RO
Forests are valued annually by Laurie Forestry Ltd. Any
T
IN
increase or decrease in the valuation is reflected in the
statement of comprehensive income
Borrowings
Impairment of non-financial assets
Borrowings are initially measured at fair value of net
transaction costs and subsequently measured at amortised
cost using the effective interest method.
At each reporting date, the Group reviews the carrying
amounts of its tangible and intangible assets to determine Borrowings are classified as current liabilities unless HDC
whether there is any indication that those assets have or group has an unconditional right to defer settlement of
suffered an impairment loss. If any such indication exists the liability for at least 12 months after balance date.
and for indefinite life intangibles, the recoverable amount
IES
of the asset is estimated in order to determine the extent
IT
Employee Entitlements
IV
of the impairment loss (if any). Where it is not possible to
T
C
estimate the recoverable amount of an individual asset, Provision is made in respect of HDC’s liability for retiring IL A
the Group estimates the recoverable amount of the cash
C
gratuity allowances, annual and long service leave, and
N
generating unit to which the asset belongs. Recoverable
U
amount is the greater of market value less costs to sell and sick leave.
O
C
value in use.
Short-term benefits - Employee benefits that HDC expects
The Group measures the value in use of assets whose to be settled within 12 months of balance date are measured
future economic benefits are not directly related to their at nominal values based on accrued entitlements at current
ability to generate net cash inflows held, at depreciated rates of pay.
replacement cost.
These include salaries and wages accrued up to balance
In assessing value in use for other assets, the estimated date, annual leave earned to, but not yet taken at balance
S
date, retiring and long service leave entitlements expected
S
T
future cash flows are discounted to their present value
T
N
using a pre-tax discount rate that reflects current market to be settled within 12 months, and sick leave.
EN
EM
assessments of the time value of money and the risks
EM
E
HDC recognises a liability for sick leave to the extent that
T
T
specific to the asset.
A
T
absences in the coming year are expected to be greater
L STA
S
than the sick leave entitlements earned in the coming year.
LIA
If the recoverable amount of an asset (or cash-generating
C
IA
unit) is estimated to be less than its carrying amount, the The amount is calculated based on the unused sick leave
N
C
A
N
carrying amount of the asset (cash-generating unit) is entitlement that can be carried forward at balance date, to
A
the extent that HDC anticipates it will be used by staff to
FIN
IN
reduced to its recoverable amount.
F
cover those future absences.
For non-revalued assets, impairment losses are recognised
as an expense immediately.
HDC recognises a liability and an expense for bonuses
where contractually obliged or where there is a past
S
practice that has created a constructive obligation.
N
For revalued assets, other than investment property, the
IO
impairment loss is treated as a revaluation decrease to
T
the extent it reverses previous accumulated revaluation Long service leave and retiring gratuity - The retiring
ISA
gratuity and long service leave liability is assessed on
N
increments for that asset class.
A
an actuarial basis using current rates of pay taking into
G
R
account years of service, years to entitlement and the
O
Where an impairment loss subsequently reverses, the
carrying amount of the asset (cash-generating unit) is likelihood staff will reach the point of entitlement.
LLED
increased to the revised estimate of its recoverable amount,
RO
but so that the increased carrying amount does not exceed Provisions
T
N
the carrying amount that would have been determined had
O
no impairment loss been recognised for the asset (cash- Provisions are recognised when HDC has a present
IL C
obligation as a result of a past event (either legal or
C
generating unit) in prior years. A reversal of an impairment
N
loss is recognised as income immediately, unless the constructive), and it is probable that HDC will be required
U
O
relevant asset is carried at a revalued amount, in which to settle that obligation. Provisions are measured at
C
revaluation increase to the extent that any impairment management’s best estimate of the expenditure required
81
Hurunui District Council
to settle the obligation at balance date, and are discounted The costs of internal services not directly charged to
to present value where the effect is material. Provisions activities are allocated as overheads using appropriate
are not recognised for future operating losses.
cost drivers such as actual usage, staff numbers and the
like.
As operator of the Waikari Landfill, HDC has a legal
obligation under the resource consent to provide ongoing Critical accounting estimates and
maintenance and monitoring services at the landfill site after
closure. A provision for post-closure costs is recognised as assumptions
a liability when the obligation for post-closure costs arises. The preparation of financial statements in conformity
The provision is measured based on the present value with NZ IFRS requires management to make judgments,
of future cash flows expected to be incurred, taking into estimates and assumptions that affect the application of
account future events including new legal requirements, policies and reported amounts of assets and liabilities,
and known improvements in technology, where there income and expenses. The estimates and associated
is sufficient evidence that these events will occur. The assumptions are based on historical experience and
provision includes all other costs associated with landfill various other factors that are believed to be reasonable
post-closure.
under the circumstances, the results of which form the
basis of making the judgments about carrying values of
Amounts provided for landfill post-closure are capitalised assets and liabilities that are not readily apparent from
to the landfill asset where they give rise to future economic other sources.
benefits to be obtained. Components of the capitalised
landfill asset are depreciated over their useful lives. The Critical judgments in applying accounting
discount rate used is a rate that reflects current market policies
assessments of the time value of money and the risks
specific to the liability.
Management has exercised the following critical judgments
Goods and Services Tax
in applying the accounting policies for the period ended
30 June 2011. Judgments have been made over useful
lives of property, plant and equipment and intangible
These financial statements have been prepared exclusive assets, landfill aftercare provision, probability of reaching
of GST, except for receivables and payables, which are vesting date for long service liability, sick leave provisions,
GST inclusive. Where GST is not recoverable as an input valuations of infrastructural assets and the long term
tax, it is recognised as part of the related asset or expense. effects on HDC’s assets as a result of the Canterbury
earthquakes. Therefore, actual results may differ from
Budget Figures
these estimates.
The budget figures are those approved by HDC at the The judgments and underlying assumptions are reviewed
beginning of the year after a period of consultation with on an ongoing basis. Revisions to accounting estimates
the public as part of the Long Term Council Community are recognised in the period to which the estimate is
Plan (LTCCP) or Annual Plan process. The budget figures revised if the revision affects only that period or the period
have been prepared in accordance NZ GAAP and are of the revision and future periods if the revision affects
consistent with the accounting policies adopted by HDC both current and future periods.
for the preparation of the financial statements.
Landfill aftercare provisions
Cost Allocation
Note 18 discloses an analysis of the exposure of HDC in
HDC has derived the net cost of service for each significant relation to the estimates and uncertainties surrounding the
activity of HDC using a system of cost allocation.
landfill aftercare provisions.
• Direct Costs are charged directly to significant
activities.
• Indirect costs are charged to significant activities based
on cost drivers and related activity/usage information.
• ‘Direct’ costs are those costs directly attributable to a
significant activity.
• ‘Indirect costs’ are those costs, which cannot be
identified in an economically feasible manner with a
specific significant activity.
82
Annual Report - 1 July 2010 to 30 June 2011
2 - Summary of cost of services
Council
Actual
Budget
Actual
N
IO
2011
2011
2010
T
$000's
$000's
$000's
C
U
Page Activities Revenue
D
20
Community Services & Facilities
9,045
2,661
4,030
RO
34
Environment & Safety
2,161
2,324
2,204
T
IN
48
Growth & Development
887
1,229
974
53
Utility Services & Insfractructure
15,276
15,178
14,161
67
Hanmer Springs Thermal Pools & Spa
7,700
7,407
6,768
70
Governance
776
719
788
Commercial Actvities
1,614
1,527
988
Corporate Services
4,061
4,043
3,990
Total activity income
41,520
35,089
33,903
Less internal income
6,992
7,109
5,987
Total Activities Revenue
34,528
27,980
27,916
Gains/(Losses) on Forestry Revaluation
30
0
503
Gains/(Losses) on Sale of Investments
0
0
73
IES
Total Activities Revenue
34,558
27,980
28,492
IT
IV
T
Page Less Activities Expenditure
C
20
Community Services & Facilities
3,993
3,844
3,469
IL A
34
Environment & Safety
2,681
2,352
2,748
C
48
Growth & Development
1,054
1,272
1,099
N
U
53
Utility Services & Insfractructure
14,713
13,953
12,985
O
67
Hanmer Springs Thermal Pools & Spa
6,490
6,214
5,454
C
70
Governance
795
719
817
Commercial Actvities
1,468
1,558
889
Corporate Services
4,156
4,046
3,942
Total activity income
35,350
33,958
31,403
Less internal expenditure
6,992
7,109
5,987
Total Activities Expenditure
28,358
26,849
25,416
Net Surplus/(Deficit) before tax
6,200
1,131
3,076
Tax Expense
0
0
0
SS
Net Surplus/(Deficit) after tax
6,200
1,131
3,076
TT
N
Add Other Comprehensive Income
EN
E
(not recognised in Activities Revenue or Expenditure)
MEM
E
Gains/(Losses) on Asset Revaluation
4,688
0
33,432
T
TA
Gains/(Losses) in Fair Value of Shares
14
0
0
T
Total Comprehensive Income
10,902
1,131
36,508
L STA
SLIAC
IAN
CA
NAFIN
INF
S
N
IO
T
ISA
N
A
G
R
O
LLED
RO
T
N
O
IL C
C
N
U
O
C
83
Hurunui District Council
3 - Revenue
Group
Council
Actual
Actual
Actual
Actual
2011
2010
2011
2010
$000's
$000's
$000's
$000's
Rates revenue
District wide rates
5,127
5,125
5,127
5,125
Rate penalties
71
60
71
60
Targeted rates
- Refuse
751
685
751
685
- Stormwater/Drainage
256
136
256
136
- Rural Fire
216
220
216
220
- Tourism
278
256
278
256
- Pool Inspections
25
24
25
24
- Medical Centres
164
167
164
167
- Amberley Library Rate
35
34
35
34
- Amenities
1,255
1,209
1,255
1,209
- Sewerage
554
534
554
534
- Water
3,739
3,513
3,739
3,513
12,471
11,963
12,471
11,963
Other revenue
Gains/(Losses) in Forestry Valuation
30
503
30
503
Gains/(Losses) on Sale of Investments
0
73
0
73
Vested Asset Income
6,349
562
6,349
562
Interest
53
146
53
145
Dividends
83
33
83
33
Donations and Grants
175
1,527
175
1,527
Other Government Subsidies
0
78
0
78
Petrol Tax
129
120
129
120
Hanmer Springs Thermal Pools & Spa Receipts
7,700
6,768
7,700
6,768
Visitor Centre Retail Sales
351
619
351
619
User Charges
1,429
826
1,429
826
Rental
386
358
386
358
New Zealand Transport Authority subsidies
3,989
3,436
3,989
3,436
Regulatory revenue
904
1,025
904
1,025
Development contributions
509
456
509
456
22,087
16,530
22,087
16,529
Total revenue
34,558
28,493
34,558
28,492
Rate Remissions
Rates revenue is shown gross of any rate remission, which are recorded as an expense. The Council's rates
remission policy allows the Council to remit rates on condition of a ratepayers' extreme financial hardship, land
used for sport, and land protected for historical or cultural purposes. During the 2010/2011 financial year, The
Council provided remissions totalling $22,567 (2010: $20,921).
Non-rateable land
Under the Local Government (Rating) Act 2002, certain properties cannot be rated for general rates. These
properties include schools, places of religious worship, public gardens and reserves. These non-ratebable
properties may be subject to targeted rates in respect of sewerage, water and refuse collection. Non-rateable
land does not constitute a remission under the Council's rate remission policy.
Government grants and subsidies
There are no unfulfilled conditions and other contigencies attached to New Zealand Transport Agency subsidies recognised.
In 2010, the Council was provided a grant of $1.5 million from the Ministry of Culture and Heritage in 2010 towards urgent
maintenance and earthquake strengthening of the Nurses Block, which was one of the key buildings vested to Council from
the former Queen Mary Hospital site. Council has undertaken part of this work, with the earthquake strengthening still to be
carried out. There were no fixed timeframes around the earthquake strengthening work but the Council has budgeted for it
to be carried out in 2016.
As part of the vesting process, the Council has committed setting aside $3.4 million for the conservation, development
and maintenance of the Soldiers' Block and Chisholm Ward and surrounding land area. The expenditure is at the discretion
of the Council and subject to the Long Term Planning process.
84
Annual Report - 1 July 2010 to 30 June 2011
4 - Employee benefit expense
Group
Council
Actual
Actual
Actual
Actual
N
2011
2010
2011
2010
IO
T
$000's
$000's
$000's
$000's
C
U
D
Salary and wages
7,992
7,525
7,992
7,525
RO
Employer contribution to super
0
0
0
0
T
Increase/(decrease) in employee benefit liabilities (Note 19)
118
48
118
48
IN
Total employee benefit expenses
8,110
7,573
8,110
7,573
5 - Other expenses
Group
Council
Actual
Actual
Actual
Actual
2011
2010
2011
2010
$000's
$000's
$000's
$000's
IES
IT
Fees paid to principal auditor
IV
- audit fees for financial statement audit
89
86
89
85
T
C
- audit fees for additional work
8
0
8
0
- disbursements charged
3
4
3
4
IL A
C
Finance costs
N
- interest expense on bank borrowings
326
0
326
0
U
O
- fair value movement of derivatives
122
0
122
0
C
Depreciation of non-current assets
5,480
5,096
5,480
5,096
Amortisation of non-current assets
42
26
42
26
Loss on disposal of assets
280
0
280
0
Expenses from other activities
13,898
12,632
13,898
12,632
Total other expenses
20,248
17,844
20,248
17,843
Audit New Zealand has been appointed as the audit service provider on behalf of the Auditor-General for the
Council and the Group.
SS
TT
NEN
EMEM
E
6 - Tax
T
TAT
Group
Council
L STA
SLIA
Actual
Actual
Actual
Actual
C
IA
2011
2010
2011
2010
N
C
A
N
$000's
$000's
$000's
$000's
A
Components of tax expense
FIN
INF
Current tax expense
0
0
0
0
Adjustment to current tax in prior years
0
0
0
0
Deferred tax expense
0
0
0
0
0
0
0
0
S
N
Relationship between tax expense and accounting profit
IO
Surplus/(deficit) before tax
6,239
3,081
6,200
3,076
T
ISA
Tax at 30%
1,872
924
1,860
923
N
A
Non-taxable income
(1,872)
(924)
(1,860)
(923)
G
R
Non-taxable expenditure
0
0
0
0
O
Deferred tax expense
0
0
0
0
Prior year adjustments
0
0
0
0
LLED
0
0
0
0
RO
T
N
Imputation credit account
O
Opening balance
295
295
0
0
IL C
Movements for the year
0
0
0
0
C
N
Closing balance
295
295
0
0
U
O
C
85
Hurunui District Council
7 - Cash and cash equivalents
Group
Council
Actual
Actual
Actual
Actual
2011
2010
2011
2010
$000's
$000's
$000's
$000's
Cash at bank or in hand
1,839
2,326
1,839
2,326
1,839
2,326
1,839
2,326
Cash at bank has maturity of less than three months.
8 - Trade and other receivables
Group
Council
Actual
Actual
Actual
Actual
2011
2010
2011
2010
$000's
$000's
$000's
$000's
Trade and other receivables
1,499
1,253
1,499
1,253
Goods and services tax (GST) receivable
268
208
268
208
Provision for impairment
(5)
(5)
(5)
(5)
1,762
1,456
1,762
1,456
The average credit period on sale of goods and services is 30 days as services are paid for at the start of the process.
An allowance has been made for estimated irrecoverable amounts from the sale of services, determined by
reference to past default experience. There was no movement in the allowance for the current or previous
financial year.
Rates are paid in quarterly instalments and 10% penalty is added on any rates unpaid at the end of the quarter.
A further additional 10% is added to all rates and additional charges from the previous year remaining unpaid
at 1 July. A further additional charge of 10% is added to all rates and additional charges remaining unpaid at 1 January.
The status of receivables as at 30 June 2011 and 2010 are detailed below:
2011
2010
Gross
Impairment
Net
Gross
Impairment
Net
$000's
$000's
$000's
$000's
$000's
$000's
Council
Not past due
1,249
0
1,249
1,035
0
1,035
Past due 1-60 days
228
0
228
124
0
124
Past due 61-120 days
2
0
2
82
0
82
Past due >120 days
288
(5)
283
220
(5)
215
Total
1,767
(5)
1,762
1,461
(5)
1,456
Group
Not past due
1,249
0
1,249
1,035
0
1,035
Past due 1-60 days
228
0
228
124
0
124
Past due 61-120 days
2
0
2
82
0
82
Past due >120 days
288
(5)
283
220
(5)
215
Total
1,767
(5)
1,762
1,461
(5)
1,456
9 - Non-current assets held for sale
Group
Council
Actual
Actual
Actual
Actual
2011
2010
2011
2010
$000's
$000's
$000's
$000's
Land classified as held for sale
372
470
372
470
372
470
372
470
The Council intends to dispose of parcels of land it no longer needs for its operations. Negotiations are
being pursued with potential buyers.
86
Annual Report - 1 July 2010 to 30 June 2011
10 - Property, plant and equipment
Freehold Land, Buildings and Pools Carried at Fair Value
An independent valuation of the consolidated entity’s land, buildings and pools was performed by Darroch
N
Limited, registered independent valuers not related to the consolidated entity, to determine the fair value of
IO
T
land, buildings and pools at 30 June 2011. The valuation, which conforms to New Zealand Property Institute
C
Practice Standard 3 - Valuations for Financial Reporting Purposes, was determined by using standard and
U
D
recognised valuation methods depending upon the type of property. Under the New Zealand Property
RO
Institute Practice Standard 1, which came into force from 1 May, 2004, all valuations must be assessed as at
T
the date of inspection of the property, except where the valuation instructions are to assess the value at a
IN
retrospective date.
Land under road
The valuation of this land is based on the average rateable value of land in the associated ward as
determined by QV Valuations (Registered Valuers) as at 30 June 2005. Under NZ IFRS HDC has elected to
use the fair value of the land under roads as at 30 June 2005 as deemed cost. Land under roads is no longer
revalued.
Roading assets
Roading assets have been valued at depreciated replacement costs as at 30 June 2010. The valuation was
performed internally by the Council's Roading Engineer - Asset Management, J Whyte, and peer reviewed by
George JasonSmith, BE(NSW), MIPENZ(Civil), CPEng, Principal Asset Management Consultant for AECOM
IES
New Zealand Limited.
IT
IV
T
Water and sewer assets
C
Water and sewer assets have been valued at depreciated replacement cost as at 1 July 2009. The valuation
was performed internally by the Council's Manager of Amenities and Special Projects, B M Yates, Registered
IL A
C
Engineer and peer reviewed by M Clough, Registered Valuer of Beca Valuations Limited.
N
U
O
Drainage and stormwater assets
C
Drainage and stromwater assets have been valued at depreciated replacement cost as at 30 June 2011.
The valuation was performed internally by the Council's Technical Officer for Utilities, David Perry and peer
reviewed by M Clough, Registered Valuer of Beca Valuations Limited.
Work in Progess
The total amount of property, plant and equipment in the course of construction is $6,064,257 (2010: $6,949,410).
Impairment
The Council's property, plant and equipment incurred a limited amount of damage as a result of the Canterbury
S
earthquakes in September 2010, February 2011 and June 2011. A claim has been filed with the Council's
S
T
insurers amounting to approximately $220,000 in repair work to some buildings, however, as the damage was
T
N
not considered to be significant, no assessment of impairment has been deemed necessary.
EN
EM
In July and August 2010, the District experienced significant rain events which resulted in some damage to the
EM
E
T
T
Council's roading network. Emergency reinstatement work was carried out to bring the roads to the same
A
T
condition as they were prior to the damage.
L STA
SLIA
Restrictions on plant, property and equipment
C
IA
The Council agreed as part of the vesting agreement for the former Queen Mary Hospital site in Hanmer Springs,
N
C
A
N
that it accepts responsibility for and maintain the integrity of the heritage site. The Council is committed to carrying
A
out earthquake strengthening work on the Nurse's Hostel and conserve, develop and maintain the Soldiers'
FIN
IN
Block and Chisholm Ward and the surrounding land area. It is also committed to ensure the history of Hanmer
F
Springs will be promoted to the community and visitors thorugh heritage interpretation of the Queen Mary Hospital
Heriage Site.
S
N
IO
T
ISA
N
A
G
R
O
LLED
RO
T
N
O
IL C
C
N
U
O
C
87
Hurunui District Council
g 0
in
42 39 61
87 09 47
87 17 01
67 18 00
53 88 41
30 06 36
50 77 58 09 20
44
03 24 90 07 20 55 99
32
35
June
209
210
830
8,3 8,0 1,7
6,8 5,4
8,1 9,6 2,2
7,7
8,2
2,0
2,3
3,3
arry
30,6
13,3
41,3
19,1
27,4
22,3 12,8 35,1
12,0 27,6 15,1
11,7 27,7 15,4
C
190,2
247,9
192,0
252,5
306,0
329,0
ount 3
Am
d n
0
0 0
0
0
0 0 0
0 0
0 0
0 0
0
te
03
66 86
91
29 88
54
64
66
56
tio une
537
807 773
868
759 759
837 317
626
99
44
ula
2,6
4,3 9,0
3,0
4,7 8,6
1,1
1,6
2,9
5,2
cia 30 J
10,9
13,9
epre
Accum D
0
ost/
42 76 64 16 60 75 33
87 17 92 78 67 47 88
53 47 00
30 06 36
50 77 95 26 20 830 98
03 24 54 33 86 55 55
31
79
C n 3 June
8,3 8,5 4,3 1,0 7,6 9,7 39,7
8,1 9,6 5,2 1,0 13,3 12,4 49,9
19,1 9,0 28,2
22,3 12,8 35,1
2,0 12,0 28,4 15,4
2,3 11,7 29,4 16,0
3,3
atio
190,2
249,0
194,9
257,8
317,0
342,9
evalu
R
d n r d
0 0
0 0 0
0 )
0
0 0 0
0
0
0 0 0 0 0 0 0
0 0 0 0 0 0 0
te
(8
6) 16
n o o
06)
06)
04)
(1
12)
06)
12)
ula
(2
(2
(1
(1
(2
(1
tio old ssifie
S
cia
ecla
Accum
R
epre
D Assets
ar n
0
62
34
0
61
98
0
0
0 0
54 0 08
0 0
66 42 44
tio
130 352
180 310
157 384
217 379
154 154
138 138
837 317
827 309
96
80
1,0
1,1
2,7
3,9
2,9
4,1
5,0
5,4
nt Ye cia
urre epre
C D
f
0 0 0 0 0 0 0
0 0 0 0
0
0 0 0
0 0 0
0 0 0 0 0 0 0
0 0 0 0 0 0 0
0
0
ssif- n o
38) 138
(1
Assets
ecla atio
R ic
rs
0 0 0 0 0 0 0
0 0 0 0 0
0 0 0
0
0 0 0 0 0 0 0
0 0 0 0 0 0 0
0
eld ale
118
118
49
49
167
nsfe hm r sfo
Tra /froto
n s
0 0 0 0 0 0 0
0 0
0
0 0 0
0 0 0 0
0
0 0 0 0
lu
74) 1)
22
97
30) 00 470
32
32
19)
40 21
32
88
atio
(2 (5
2,6
2,2
,2 1,7
(1
2,0 1,9
4,6
sed.
Surp
(1
33,4
33,4
33,4
clo
evalu
is
R
een d
nt ar
0 0
0 0
0
0
0 0 0
0
0 0 0 0 0 0 0
0
0 0 0 0
24)
4) 88)
21) 73) 18)
27)
39)
1)
1)
53)
53)
as b
Ye
(6
(6
(6
88)
53)
h
urre
(2
(2
(1 (2 (1
(1
(6
(3
(3
(2
,0
C
posals
(1
is
D
chedule
nt ar
ne s
ns
0
58 10 38 66
67 46 62 56 34 87
19 56 75
0
25 95 53
87
0
66
31
04
93
o
Ye
399 461
122
271 680 951
552
762
372
959 607
527
urre
2,0 2,9
2,0 1,0
4,3 2,5
4,4 2,9 7,3
1,2 1,0 4,2
7,8
4,7
7,2
nly
C
10,1
11,8
24,7
o
Additio
fore
ere
g
in
42 70 70
57 45 97
42 39 61
87 09 47
82 62 44
53 88 41
50 25 70 31 35 68 79
50 77 58 09 20
44
20
32
, th
July
213
209
830
8,3 7,7 1,6
7,0 3,7
8,3 8,0 1,7
6,8 5,4
7,7
8,2
2,0
2,0
arry
28,7
30,6
18,8
26,6
19,1
27,4
11,5 27,2 14,3
12,0 27,6 15,1
ame
C
152,5
207,7
190,2
247,9
263,2
306,0
ount 1
e s
Am
th
re
d
0
0
0
0
0 0 0 0 0 0 0
0 0
0 0
te
up a
n 1
57
56 58
03
66 86
54
63
99
July
407
745 593
537
807 773
605 605
759 759
837 317
ro
ula tio
2,4
4,0 8,2
2,6
4,3 9,0
1,1
8,8
10,9
cia
nd G
Accum epreD
ouncil a
n
e C
ost/
uly
42 77 27 958 50 01 55
42 76 64 16 60 75 33
82 67 49
53 47 00
50 25 70 31 35 68 79
50 77 95 26 20 830 98
83
31
C atio 1 J
8,3 8,1 4,1
7,6 7,8
or th
37,0
8,3 8,5 4,3 1,0 7,6 9,7 39,7
18,8 8,3 27,2
19,1 9,0 28,2
2,0 11,5 27,2 14,3
2,0
152,5
207,7
12,0 28,4 15,4 190,2
249,0
272,0
317,0
nt f
evalu
R
me
quip
nd e
nt
nt
a
ools me
ools me
P
P
perty
quip
quip
ro
, plant and equipment
nt
gs & E
nt
gs & E
nt, p
me
in
in
nt &
me
nt &
la
uild la
uild la
f p
quip
quip
ssets
ssets
gs E
e B e P
gs E
e B e P
gs
gs
in
in
ssets
in
in
l A
nce o
ra
and
nt &
and
nt &
and
and
and
and
ala
nal A
eserv eserv
eserv eserv
L uild la ooks
l
L uild la ooks
l
d A L uild l
L uild l
ctu L and
l
L and
l
tio
B l R l R ota
B l R l R ota
te
ota
ota
g L
ge g
ota
g L
ge g
ota
010
011
e b
ry
ry
r
age
r
age
ehold
ehold
ehold
ehold
stru ehold
era
in
ehold
era
in
l 2
l 2
: th
10 Property
pera
ouncil B ouncil P ra
ouncil B ouncil P ra
estric
ouncil B
ouncil B
fra
oadin ate ew oadin ra
oadin ate ew oadin ra
ta
ta
ote
O Fre C C Lib Therma Therma 2010 T
Fre C C Lib Therma Therma 2011 T
R Fre C 2010 T
Fre C 2011 T
In Fre R W S R D 2010 T
Fre R W S R D 2011 T
To
To
N
88
Annual Report - 1 July 2010 to 30 June 2011
11 - Intangible assets
Group
Council
Actual
Actual
Actual
Actual
N
2011
2010
2011
2010
IO
T
$000's
$000's
$000's
$000's
C
U
D
Cost
RO
Balance at 1 July
465
394
465
394
T
Additions
71
71
71
71
IN
Disposals
0
0
0
0
Balance at 30 June
536
465
536
465
Accumulated amortisation and impairment
Balance at 1 July
372
346
372
346
Amortisation charge
42
26
42
26
Disposals
0
0
0
0
Balance at 30 June
414
372
414
372
Carrying amount at 30 June
122
93
122
93
IES
IT
IV
T
C
IL A
12 - Forestry assets
C
N
U
Group
Council
O
Actual
Actual
Actual
Actual
C
2011
2010
2011
2010
$000's
$000's
$000's
$000's
Balance at 1 July
2,182
1,679
2,182
1,679
Gain/(losses) arising from changes in fair value
30
503
30
503
Balance at 30 June
2,212
2,182
2,212
2,182
The Council owns 234.8 hectares of predominantly radiata pine forestry, which are at varying stages of maturity
S
ranging from 3 to 33 years.
S
TT
N
Valuation Assumptions
EN
EM
Independent registered forestry consultants, Laurie Forestry Limited, have valued the forestry stands as
EM
E
T
T
at 30 June 2011. The following valuation assumptions have been adopted in determining the fair value
A
T
of forestry assets:
L STA
S
- a pre-tax discount rate of 8.5% (2010: 8.5%) has been used in discounting the present value of expected
LIA
cash flows;
C
IA
N
C
- the value of the underlying land has not been included in the valuation;
A
N
- the valuation assumes that the current tree crop will be grown for one rotation only, and that no new planting
AFIN
will be undertaken or charged against the existing crop.
IN
F
- time conventions used in the valuation are that the valuation year commences at 1st July and ends 30th June
the next calendar year. This convention applies to all costs, prices, yields and age of trees although it may
need to be adjusted for any significant price movements during the valuation year.
- the valuation uses current and actual prevailing industry costs. The costs have been expressed in real terms,
and no adjustment has been made for any possible changes in prices relative to cost.
S
N
IO
Financial risk management strategies
T
The Council is exposed to financial risks arising from changes in timber prices. The Council is a long-term
ISA
investor in forestry and does not expect timber prices to change significantly into the foreseeable future,
N
A
therefore, has not taken any measures to manage the risks of a decline in timber prices.
G
R
O
Emmisions Trading Scheme
As Council holds greater than 50 hectares of pre-1990 forests, it has registered under the New Zealand
LLED
Emmissions Units Register.
RO
T
N
O
IL C
C
N
U
O
C
89
Hurunui District Council
13 - Derivative Financial Instruments
Group
Council
Actual
Actual
Actual
Actual
2011
2010
2011
2010
$000's
$000's
$000's
$000's
Non-current liability portion
Interest rate swaps
122
0
122
0
Total derivative financial instruments liability
122
0
122
0
Fair Value
Interest rate swaps
The fair values of interest rate swaps have been determined by calculating the expected cash flows under the terms of
the swaps and discounting these to present value. The inputs into the valuation model are from independently sourced
market parameters such as interest rate yield curves. Most market parameters are implied from instrument prices.
Interest rate swaps
The notional principal amounts of the outstanding interest rate swap contracts for the Council were $9.5 million
(2010: Nil). At 30 June 2011, the fixed interest rates of cash flows hedge interest rate swaps varied from 3.65% to 5.30%.
(2010: Not applicable)
Changes in the fair value of interest rate swaps are recognised in the statement of comprehensive income.
14 - Other financial assets
Group
Council
Actual
Actual
Actual
Actual
2011
2010
2011
2010
$000's
$000's
$000's
$000's
Environment Canterbury - Waiau River Loan
59
68
59
68
Shares carrying amount
271
257
271
257
Fair value amount
330
325
330
325
The financial statements include holdings in unlisted shares. Fair value is estimated using a combination of
estimated future discounted cash flows and asset backing per share. The discounted cash flow approach
includes some assumptions that are not supportable by observable market prices or rates. Changes in these
assumptions do not significantly change the fair value recognised.
Changes in the fair value of unlisted shares are recognised through comprehensive income using the available
for sale approach. The fair value movement recognised in compehensive income for the period was a gain of
$14,208 (2010: Nil). There were no impairments or realised gains or losses recognised in the statement of
comprehensive for the period (2010: $73,250).
15 - Investments in associates
Group
Actual
Actual
2011
2010
$000's
$000's
Movements in the carrying amount of investment in
Enterprise North Canterbury
Balance at 1 July
168
163
Share of total recognised revenues and expenses
39
5
Balance at 30 June
207
168
Summarised financial information of
Enterprise North Canterbury
Assets
869
548
Liabilities
455
211
Revenues
1,035
849
Surplus/(deficit)
77
10
Group's interest
50%
50%
Enterprise North Canterbury recorded no contingent assets or contingent liabilities as
at 30 June 2011 (2010: Nil).
90
Annual Report - 1 July 2010 to 30 June 2011
16 - Financial Instruments
16 A - Financial instrument categories
N
The accounting policies have been applied to the line items listed below:
IO
T
C
U
Group
Council
D
Actual
Actual
Actual
Actual
RO
2011
2010
2011
2010
T
$000's
$000's
$000's
$000's
IN
Financial assets
Fair value through surplus or deficit
Interest rate swaps
0
0
0
0
Unlisted shares
271
257
271
257
Total fair value through surplus or deficit
271
257
271
257
Loans and Receivables
Cash and cash equivalents
1,839
2,326
1,839
2,326
Debtors and other receivables
1,762
1,456
1,762
1,456
Non interest bearing loans
59
67
59
67
IES
Total loans and receivables
3,660
3,849
3,660
3,849
IT
IV
T
Financial liabilities
C
Fair value through surplus or deficit
IL A
Interest rate swaps
122
0
122
0
C
Unlisted shares
0
0
0
0
N
U
Total fair value through surplus or deficit
122
0
122
0
O
C
Financial liabilities at amortised cost
Borrowings
- secured loans
11,402
0
11,402
0
Creditors and other payables
3,000
2,900
3,000
2,900
Total financial liabilities at amortised cost
14,402
2,900
14,402
2,900
SS
TT
NEN
EMEM
ET
TAT
L STA
SLIAC
IAN
CA
NAFIN
INF
S
N
IO
T
ISA
N
A
G
R
O
LLED
RO
T
N
O
IL C
C
N
U
O
C
91
Hurunui District Council
16B - Fair value hierarchy disclosures
For those instruments recognised at fair value in the statement of financial position, fair values are determined according to the
following hierarchy:
- Quoted market price - financial instruments with quoted prices for identical instruments in active markets.
- Valuation technique using observable inputs - financial instruments with quoted prices for similar instruments in active
markets or quoted prices for identical or similar instruments in inactive markets and financial instruments valued using models
where all significant inputs are observable.
- Valuation techniques with significant non-observable inputs - financial instruments valued using models where one or more
significant inputs are not observable.
The following table analyses the basis of the valuation of classes of financial instruments measured at fair value in the
statement of financial position.
Significant
Quoted
Observable
non-observable
Total Market Price
Inputs
inputs
$000's
$000's
$000's
$000's
Council 2011
Financial assets
Unlisted shares
271
0
0
271
Financial liabilities
Interest rate swaps
122
0
122
0
Group 2011
Financial assets
Unlisted shares
271
0
0
271
Financial liabilities
Interest rate swaps
122
0
122
0
Council 2010
Financial assets
Unlisted shares
257
0
0
257
Financial liabilities
Interest rate swaps
0
0
0
0
Group 2010
Financial assets
Unlisted shares
257
0
0
257
Financial liabilities
Interest rate swaps
0
0
0
0
There were no transfers between the different levels of the fair value hierarchy.
Valuation techniques with significant non-observable inputs
The table below provide a reconciliation from the opening balance to the closing balance for the financial assets and liabilities
measured using valuation techniques with significant non-observable inputs.
Group
Council
Actual
Actual
Actual
Actual
2011
2010
2011
2010
$000's
$000's
$000's
$000's
Balance as at 1 July
257
257
257
257
Gains/(losses recognised in surplus/(deficit)
14
0
14
0
Balance at 30 June
271
257
271
257
92
Annual Report - 1 July 2010 to 30 June 2011
16 C - Financial instrument risks
The Council has a series of policies to manage the risks associated with financial instruments. The Council is risk adverse and
seeks to minimise exposure from its treasury activities. The Council has established and approved a Treasury Risk Management
policy.
N
IO
T
Market Risk
C
Currency risk
U
D
Currency risk is the risk that the value of a financial instrument will fluctuate due to changes in foreign exchange rates. The
RO
Council is not exposed to currency risk.
T
IN
Fair value interest rate risk
Fair value interest rate risk is the risk that the value of a financial instrument will fluctuate due to changes in market interest
rates. Borrowings and investment held at fixed interest rates expose the Council to fair value interest rate risks.
The Council's policy is to maintain between 50% and 95% of its borrowings in fixed rate instruments. The Council is subject to
fair value interest rate risk on its deposits but the risk is minimised as the deposits are for a maturity period of less than one
year.
Cash flow interest rate risk
Cash flow interest rate risk is the risk that cash flows from a financial instrument will fluctuate due to changes in market interest
rates. Borrowings and investment held at variable interest rates expose the Council to cash flow interest rate risks.
IES
The Council's policy is to maintain between 50% and 95% of its borrowings in fixed rate instruments and uses interest rate
IT
IV
swaps to convert floating rate borrowing to fixed rate borrowing to manage interest rate risk. Under the interest rate swaps,
T
the Council agrees with other parties to exchange, as specific intervals, the difference between fixed contract rates and
C
floating rate interest amounts calculated by reference to the agreed notional principal amounts.
IL A
C
N
Credit risk
U
Credit risk is the risk that a third party will default on its obligations to the Council causing a loss. In the normal course of its
O
C
business, credit risks arises from debtors, deposits with banks, bond investments and derivative financial instruments. The
Council's investment policy limits the amount of credit exposure to any one financial institution.
Maximum exposure to credit risk
The Council's maximum exposure to credit risk for each class of financial instrument is set out below.
Group
Council
Actual
Actual
Actual
Actual
2011
2010
2011
2010
S
$000's
$000's
$000's
$000's
S
TT
N
Cash and cash equivalents
1,839
2,326
1,839
2,326
EN
EM
Debtors and other receivables
1,762
1,456
1,762
1,456
EM
E
T
T
Non interest bearing loans
59
67
59
67
A
T
Total credit risk
3,660
3,849
3,660
3,849
L STA
SLIAC
IAN
CA
NAFIN
INF
S
N
IO
T
ISA
N
A
G
R
O
LLED
RO
T
N
O
IL C
C
N
U
O
C
93
Hurunui District Council
Credit quality of financial assets
The Council only deposits funds with entities that have a high credit rating. Cash and cash equivalents are with registered
banks that have high credit ratings. For other financial instruments, the Council does not have high concentrations of credit
risk. No collateral is held as security against these financial instruments including those that are overdue or impaired.
The credit quality of financial assets that are neither past due nor impaired can be assessed by reference to Standard and
Poor's credit rating (if available) or to historic information about counterparty default rates.
Group
Council
Actual
Actual
Actual
Actual
2011
2010
2011
2010
$000's
$000's
$000's
$000's
Counterparties with credit ratings:
Cash and cash equivalents
AA
1,839
2,326
1,839
2,326
Total cash and cash equivalents
1,839
2,326
1,839
2,326
Counterparties without credit ratings:
Non interest bearing loans
Existing counterparty with no defaults in the past
59
67
59
67
Total Non interest bearing loans
59
67
59
67
Shares in unlisted companies
Unlisted shares
271
257
271
257
Total shares in unlisted companies
271
257
271
257
Debtors and other receivables arise mainly from the Council's statutory functions. Therefore, there are no procedures in place
to monitor or report the credit quality of debtors and receivables with reference to internal or external credit ratings. The
Council has no significant concentration of credit risk in relation to debtors and other receivables as it has a large number of
customers, primarily ratepayers, and the Council has powers under the Local Government (Rating) Act 2002 to recover
outstanding debts from ratepayers.
94
Annual Report - 1 July 2010 to 30 June 2011
Liquidity risk
Liquidity risk is the extent to which the Council will encounter difficulty in raising liquid funds to meet commitments as they fall
due.
Prudent liquidity risk management implies maintaining sufficient cash, the availability of funding through an adequate amount
N
of committed credit facilities and ability to close out market positions. The Council aims to maintain flexibilty in funding by
IO
T
keeping committed credit lines available.
C
U
D
As at 30 June 2011, the Council has a credit facility of $13 million (2010: $10 million) against which it had drawn $11.4 million
RO
(2010: nil).
T
IN
Maturity analysis on financial liabilities
The table below analyses the Council's financial liabilities into relevant maturity groupings based on the remaining period at the
balance date to the contractual maturity date.
Liability Contractual
Carrying
Cash
Less than
More than
Amount
Flows
1 year
1-5 years
5 years
$000's
$000's
$000's
$000's
$000's
Council 2011
Creditors and other payables
3,000
3,000
3,000
0
0
Secured loans
11,402
11,402
0
11,402
0
IES
Interest rate swaps
122
122
0
122
0
IT
IV
T
Group 2011
C
Creditors and other payables
3,000
3,000
3,000
0
0
IL A
Secured loans
11,402
11,402
0
11,402
0
C
N
Interest rate swaps
122
122
0
122
0
U
O
C
Council 2010
Creditors and other payables
2,900
2,900
2,900
0
0
Secured loans
0
0
0
0
0
Interest rate swaps
0
0
0
0
0
Group 2010
Creditors and other payables
2,900
2,900
2,900
0
0
Secured loans
0
0
0
0
0
Interest rate swaps
0
0
0
0
0
SS
TT
N
Maturity analysis on financial liabilities
EN
EM
The table below analyses the Council's financial assets into relevant maturity groupings based on the remaining period at the
EM
E
T
T
balance date to the contractual maturity date.
A
T
L STA
S
Asset Contractual
LIA
Carrying
Cash
Less than
More than
C
IA
N
C
Amount
Flows
1 year
1-5 years
5 years
A
N
$000's
$000's
$000's
$000's
$000's
AFIN
INF
Council 2011
Cash and cash equivalents
1,839
1,839
1,839
0
0
Debtors and other receivables
1,762
1,762
1,762
0
0
Non interest bearing loans
59
59
7
28
24
S
Group 2011
N
Cash and cash equivalents
1,839
1,839
1,839
0
0
IO
T
Debtors and other receivables
1,762
1,762
1,762
0
0
ISA
Non interest bearing loans
59
59
7
28
24
N
A
G
Council 2010
R
Cash and cash equivalents
1,456
1,456
1,456
0
0
O
Debtors and other receivables
0
0
0
0
0
Non interest bearing loans
68
68
7
28
33
LLED
RO
T
Group 2010
N
Cash and cash equivalents
1,456
1,456
1,456
0
0
O
Debtors and other receivables
0
0
0
0
0
IL C
Non interest bearing loans
68
68
7
28
33
C
N
U
O
C
95
Hurunui District Council
Sensitivity analysis for interest rate risk
The table below illustrates the potential effect on the surplus or deficit for reasonably possible market movements, with all other
variables held constant, based on the Council's financial instrument exposures at balance date.
Council
2011
2010
$000
$000
-100bps
+100bps
-100bps
+100bps
Financial assets
Cash and cash equivalents
(7)
7
0
0
Interest rate swaps
0
0
0
0
Financial liabilities
Secured loans
63
(63)
0
0
Interest rate swaps
(351)
332
0
0
Total sensitivity
(295)
276
0
0
Group
2011
2010
$000
$000
-100bps
+100bps
-100bps
+100bps
Financial assets
Cash and cash equivalents
(7)
7
0
0
Interest rate swaps
0
0
0
0
Financial liabilities
Secured loans
63
(63)
0
0
Interest rate swaps
(351)
332
0
0
Total sensitivity
(295)
276
0
0
Explanation of interest rate sensitivity
The interest rate sensitivity is based on a reasonably possible movement in interest rates, with all other variable held constant,
measured as a basis point movement (bps). For example, an interest of 100bps is equivalent to an increase in interest rates of
1%.
The sensitivity for interest rate swaps has been calculated using a derivative valuation model based on parallel shift in interest
rates of +/- 100bps.
17 - Trade and other payables
Group
Council
Actual
Actual
Actual
Actual
2011
2010
2011
2010
$000's
$000's
$000's
$000's
Trade payables
2,969
2,899
2,969
2,899
Goods and services tax (GST) payable
31
1
31
1
3,000
2,900
3,000
2,900
The Group has a policy to pay payables within the credit timeframe and therefore does not incur interest
charges on its payables.
96
Annual Report - 1 July 2010 to 30 June 2011
18 - Landfill aftercare provision
Group
Council
Actual
Actual
Actual
Actual
N
2011
2010
2011
2010
IO
T
$000's
$000's
$000's
$000's
C
U
D
Balance at 1 July
159
175
159
175
RO
Additional provisions
78
0
78
0
T
Amount of provision used
(8)
(16)
(8)
(16)
IN
Balance at 30 June
229
159
229
159
Disclosed as:
Current
8
8
8
8
Non-current
221
151
221
151
229
159
229
159
The provision for Landfill Aftercare costs represents the present value of the Council’s best estimate of the
future sacrifice of economic benefits that will be required to provide ongoing maintenance and monitoring of
the closed Waikari Landfill.
IES
IT
IV
T
C
19 - Employee benefit liability
IL A
C
N
U
Group
Council
O
Actual
Actual
Actual
Actual
C
2011
2010
2011
2010
$000's
$000's
$000's
$000's
Balance at 1 July
763
715
763
715
Provisions added during year
810
512
810
512
Provisions used during year
(692)
(464)
(692)
(464)
Balance at 30 June
881
763
881
763
SS
TT
NEN
EMEM
ET
TAT
L STA
SLIAC
IAN
CA
NAFIN
INF
20 - Borrowings
Group
Council
Actual
Actual
Actual
Actual
2011
2010
2011
2010
S
$000's
$000's
$000's
$000's
N
IO
Secured Loans
T
Current
0
0
0
0
ISA
Non-current
11,402
0
11,402
0
N
A
Balance
11,402
0
11,402
0
G
R
O
The Council's borrowing of $11.4 million (2010: nil) on a floating rate reset quarterly based on the 90 day bank bill
rate plus a margin for credit risk. The Council uses interest rate swaps to provide for a fixed rate portion of the
LLED
borrowings of 83%. The effective fixed rates for this portion range from 3.65% to 5.30% plus a margin for credit
RO
risk.
T
N
O
The borrowings are secured against rates of the Council under a debenture trust deed.
IL C
C
The total amount of the borrowings approximates its fair value.
N
U
O
C
97
Hurunui District Council
21 - Equity
Group
Council
Actual
Actual
Actual
Actual
2011
2010
2011
2010
$000's
$000's
$000's
$000's
Asset revaluation reserve
Balance at 1 July
159,204
125,781
159,204
125,781
Revaluation increments/(decrements)
4,688
33,432
4,688
33,432
Plant, property and equipment disposed
(233)
(9)
(233)
(9)
Balance at 30 June
163,659
159,204
163,659
159,204
The asset revaluation reserve arises on the revaluation of land and buildings, and infrastructural assets. Where
a revalued land, building or infrastructural assets is sold that portion of the asset revaluation reserve which relates
to that asset, and is effectively realised, is transferred directly to retained earnings.
Available for sale reserve
Balance at 1 July
78
78
78
78
Valuation gain/(loss) recognised
14
0
14
0
Balance at 30 June
92
78
92
78
The available-for-sale revaluation reserve arises on the revaluation of available-for-sale financial assets. Where
a revalued financial asset is sold that portion of the reserve which relates to that financial asset, and is effectively
realised, is recognised in profit or loss. Where a revalued financial asset is impaired that portion of the reserve
which relates to that financial asset is recognised in profit or loss.
Special fund reserves
Balance at 1 July
1,970
4,699
1,970
4,699
Transfers in
259
2,216
259
2,216
Transfers out
(1,951)
(4,945)
(1,951)
(4,945)
Balance at 30 June
278
1,970
278
1,970
Retained earnings
Balance at 1 July
147,307
141,488
147,139
141,325
Surplus/(deficit) after tax
6,239
3,081
6,200
3,076
Plant, property and equipment disposed
233
9
233
9
Other appropriations
0
0
0
0
Net special fund appropriations
1,692
2,729
1,692
2,729
Balance at 30 June
155,471
147,307
155,264
147,139
Summary of equity accounts
Asset revaluation reserve
163,659
159,204
163,659
159,204
Available-for-sale revaluation reserve
92
78
92
78
Special fund reserves
278
1,970
278
1,970
Retained earnings
155,471
147,307
155,264
147,139
319,500
308,559
319,293
308,391
98
Annual Report - 1 July 2010 to 30 June 2011
22 - Statement of cash flow reconciliation
Group
Council
Actual
Actual
Actual
Actual
N
2011
2010
2011
2010
IO
T
$000's
$000's
$000's
$000's
C
U
D
Reconciliation of surplus for the period to net cash flows from
operating activities
RO
T
Net Surplus/(Deficit) after tax
6,239
3,008
6,200
3,003
IN
Non Cash Items
Vested assets
(6,349)
(562)
(6,349)
(562)
Movement in Derivatives
122
0
122
0
Gain/Loss on Fair Value of Forestry
(30)
(503)
(30)
(503)
Movement in Landfil Aftercare Liability
70
(16)
70
(16)
Depreciation and amortisation
5,522
5,122
5,522
5,122
(665)
4,041
(665)
4,041
Movements in working capital
(Increase)/decrease in Inventory
9
(61)
9
(61)
(Increase)/decrease in Receivables
(307)
2,889
(307)
2,889
IES
Increase/(decrease) in Payables
920
(2,079)
920
(2,079)
IT
Increase/(decrease) in Current Employee Entitlements
118
(97)
118
(97)
IV
Increase/(decrease) in Income in Advance
67
(113)
67
(113)
T
C
807
539
807
539
IL A
C
Other Movements
N
Gain on Sale of Plant, Property & Equipment
280
0
280
0
U
O
Purchase of Investments
(39)
(5)
0
0
C
Other Movements
0
0
0
0
Net GST
0
175
0
175
241
170
280
175
Net Cash Flow from Operating Activities
(as per Statement of Cash Flows)
6,622
7,758
6,622
7,758
SS
TT
NEN
EMEM
ET
TAT
L STA
SLIAC
IAN
CA
NAFIN
INF
S
N
IO
T
ISA
N
A
G
R
O
LLED
RO
T
N
O
IL C
C
N
U
O
C
99
Hurunui District Council
23 - Capital commitments and operating leases
Capital Commitments
Group
Council
Actual
Actual
Actual
Actual
2011
2010
2011
2010
$000's
$000's
$000's
$000's
Property, plant and equipment
186
5,600
186
5,600
186
5,600
186
5,600
Operating leases as lessee
The Council and group does have an operating lease for photocopier equipment. The lease payments are based on
usage and as such, due to the variable nature of the lease agreement, the future value of the lease payments cannot
be reliably estimated.
Operating leases as lessor
Property is leased under operating leases. The majority of the leases have non-cancellable terms of either three or five
years.
The future aggregate minimum lease payments to be collectedunder non-cancellable leases are as follows:
Group
Council
Actual
Actual
Actual
Actual
2011
2010
2011
2010
$000's
$000's
$000's
$000's
Not later than one year
146
148
146
148
Later than one year and not later than five years
138
256
138
256
Later than five years
19
24
19
24
303
428
303
428
No contingent rents have been recognised during the period.
24 - Contingent assets and liabilities
As at 30 June 2011, the group has an insurance claim for damage to buildings resulting from the
Canterbury earthquakes which have been estimated at $220,000. In addition, there is a dipsute relating to
illegal felling of a block of Council's plantation, with settlement being pursued.
The Council has been given advance notice from the Board of New Zealand Mutual Libility RiskPool that
a call will be made on the Council for a share of the shortfall in the mutual pool's funds. The shortfall in the
mutual pool's funds have been derived by the impact of the Leaky Building issue. The Council has been
advised that the amount of the call is $25,663 (2010: $25,663).
There will be further calls on any shortfalls on the mutual pool's funds in the future, but the full extent of these calls
have yet to be ascertained.
Council has received notice that there are two active claims under Weathertight Homes Resolution Service.
The Council has assessed the the potential liability to Council arises from these claims is minimal.
100
Annual Report - 1 July 2010 to 30 June 2011
25 - Related party disclosures
The parent entity in the consolidated entity is the Council.
N
IO
Equity interests in subsidiaries
T
The Council holds interests in the following entities:
C
U
- Hurunui Holdings Limited 100% (2010: 100%)
D
- Enterprise North Canterbury 50% (2010: 50%)
RO
- Canterbury Economic Development Company Limited 10% (2010: 10%)
T
IN
- Transwaste Canterbury Limited 1.2% (2010: 1.2%)
Transactions involving the parent entity
During the year, Councillors and key management, as part of a normal customer relationship, were involved in
minor transactions with the Hurunui District Council (such as payment of rates, use of transfer stations etc)
Andrew Smart, a Councillor from 1 July 2010 to 13 October 2011 owns the Amberley Mobil Service Station that
has a contract for services with Mobil New Zealand Limited for fuel. Mr Smart sells fuel under a franchise
agreement with Mobil New Zealand Limited, and although his service station is not a party to the Council’s contract
with Mobil New Zealand Limited, it is a beneficiary of the arrangement. The contract for services was established
prior to Mr Smart being elected a Hurunui District Councillor.
The purchases for the period from 1 July 2010 to 13 October 2010 from Mobil New Zealand Limited and Amberley Mobil
IES
amounted to $73,096. It has been assessed that 60% of this amount was spent at the Amberley Mobil Service Station.
IT
The Office of the Auditor-General has approved this arrangement under section 3 (3) (a) of the Local Authorities
IV
(Members’ Interests) Act 1968.
T
C
As at 30 June 2011, Mr Smart was not a Councillor, therefore as of that date, there was no related party balance
owing. (2010: $23,122).
IL A
C
N
U
Other than the above, no Councillors or senior management have entered into related party transactions with the Group.
O
No amounts were provided for doubtful debts relating to debts due from related parties as at 30 June 2011 (2010: nil).
C
Hurunui Holdings Limited
As Hurunui Holding Limited is now no longer trading, there are no transactions between Council and the Company for
the current or prior year.
Enterprise North Canterbury
During the financial year, the Council paid $50,000 (2010: $50,000) to Enterprise North Canterbury as a grant
for it general purposes. In addition, the Council paid a further $6,350 ($1,150) for other services.
SS
Canterbury Economic Development Company Limited
TT
N
During the financial year, the Council paid $2,400 (2010: $2,400) to Canterbury Economic Development Company
EN
E
Limited as an adminstration contribution.
MEM
ET
TA
Key management personnel compensation
T
The compensation of the Mayor, Councillors CEO and other senior management is set out below:
L STA
SLIAC
IA
Council
N
C
A
N
Actual
Actual
A
2011
2010
FIN
IN
$000's
$000's
F
Salary
1
,077
9
95
Other benefits
4
4
3
8
1
,121
1
,033
S
N
IO
T
ISA
N
A
G
R
O
LLED
RO
T
N
O
IL C
C
N
U
O
C
101
Hurunui District Council
26 - Remuneration
Remuneration of the Chief Executive Officer
The Chief Executive Officer is employed on a five-year contract which will expire on 31 October 2012.
Council
Actual
Actual
2011
2010
$
$
Andrew Dalziel
- Salary
225,381
218,990
- Benefits
5,636
5,510
231,017
224,500
Remuneration of Mayor, Councillors and Board Members
Council
Actual
Actual
2011
2010
$
$
Marie Black (elected 9 October 2010)
10,763
0
Russell Black (full year - re-elected 9 October 2010)
15,015
14,508
Gary Cooper (elected 9 October 2010)
10,763
0
Julie Coster (completed term 9 October 2010)
4,000
14,508
Winton Dalley (full year - elected as Mayor 9 October 2010)
50,850
21,868
Vincent Daly (full year - re-elected 9 October 2010)
15,015
14,508
Richard Davison (elected 9 October 2010)
12,508
0
Wendy Doody (completed term 9 October 2010)
4,000
14,508
Jim Harre (elected 9 October 2010)
10,763
0
Garry Jackson (completed term 9 October 2010)
16,062
49,268
Ross Little (elected 9 October 2010)
12,508
0
Michael Malthus (full year - re-elected 9 October 2010)
24,174
28,245
Judith McKendry (elected 9 October 2010)
10,763
0
Judy Meikle (completed term 9 October 2010)
6,029
21,868
Kerry Prenter (completed term 9 October 2010)
4,000
14,508
Andrew Smart (completed term 9 October 2010)
4,000
14,508
211,213
208,297
27 - Severance Payments
Schedule 10(19) of the Local Government Act 2002 requires any severance including the tax liability to be disclosed.
For the year ended 30 June 2011, no severance payments were made (2010: Nil).
28 - Subsequent Events
Subsequent to 30 June 2011, there have been no events which would affect the readers' assessment of the financial
performance and position of the Hurunui District Council.
29 - Statutory Deadline
Section 98 of the Local Government Act 2002 requires that Council adopts its annual report within four months after
the end of the financial year. Council was not able to comply with this requirement for the year ended 30 June 2011
and this annual report was not adopted until 24 November 2011.
102
Annual Report - 1 July 2010 to 30 June 2011
30 - Capital management
The Council's capital is its equity (or ratepayers' funds), which comprise retained earnings and reserve. Equity is
represented by net assets.
N
IO
T
The Local Government Act 2002 (the Act) requires the Council to manage its revenues, expenses, assets, liabilities,
C
investments, and general financial dealings prudently and in a manner that promotes the current and future interests of the
U
D
community. Ratepayer’s funds are largely managed as a by-product of managing revenues, expenses, assets, liabilities,
RO
investments, and general financial dealings.
T
IN
The objective of managing these items is to achieve intergenerational equity, which is a principle promoted in the Act and
applied by Council. Intergenerational equity requires today’s ratepayers to meet the costs of utilising the Council’s assets
and not expecting them to meet the full cost of long term assets that will benefit ratepayers in future generations. Additionally,
the Council has in place asset management plans for major classes of assets detailing renewal and maintenance
programmes, to ensure ratepayers in future generations are not required to meet the costs of deferred renewals and
maintenance.
The Act requires the council to make adequate and effective provision in its Long Term Community Plan (LTCCP) and in its
annual plans (where applicable) to meet the expenditure needs identified in those plans. The Act sets out the factors that the
Council is required to consider when determining the most appropriate sources of funding for each of its activities. The
sources and levels of funding are set out in the funding and financial policies in the Council’s LTCCP.
IES
The Council has created reserves for different areas of benefit which are used where there is a discrete set of rate or levy
IT
payers as distinct from the general rate. Any surplus or deficit relating to these separate areas of benefit is applied to the
IV
T
specific reserves.
C
IL A
Special Funds
C
Opening
Appropriations
Closing
N
U
Balance
Surplus/
Transfers
Balance
O
1 July 2010
(Deficit)
Out
30 June 2011
C
$
$
$
$
Amberley Beach Reserve Fund
7,171
329
0
7,500
Amberley Township Reserves Development Fund
0
6,796
0
6,796
Amberley Walking & Cycling Routes Development Fund
0
3,904
0
3,904
Amberley Ward Reserves Development Fund
0
21,127
0
21,127
Amberley Reserve Pavilion Development Fund
420
1,538
21,164
(19,206)
Amberley Sewer Pipes Upgrade Development Reserve
14,600
(48)
0
14,552
Amberley Sewer Pond Upgrade Development Reserve
(106,786)
10,230
0
(96,556)
S
Amberley Water Development Reserve
(4,626)
2,361
0
(2,265)
S
TT
N
Amberley Stormwater Development Reserve
(130,089)
(2,758)
0
(132,847)
EN
E
Amuri Ward Land Subdivision Reserve
18,482
847
0
19,329
MEM
E
Amuri Community Centre
38,792
338
0
39,130
T
TA
Amuri Sports Facilities Fund
0
7,159
0
7,159
T
Cheviot Ward Land Subdivision Reserve
4,548
208
0
4,756
L STA
SL
Cheviot RSA Fund
3,678
343
0
4,021
IA
C
IA
Glenmark Ward Land Subdivision Reserve
6,815
284
5,000
2,099
N
C
Waipara Pavilion Fund
36,031
15,649
39,070
12,610
A
NA
Omihi Reserve Development
(14,607)
2,144
0
(12,463)
FIN
IN
Hanmer Springs Hall Development Reserve
(47,922)
4,952
0
(42,970)
F
Hanmer Springs Township Development Reserve
310,650
14,906
1,046,782
(721,226)
Hanmer Springs Conical Hill
20,162
3,814
0
23,976
Hurunui Ward Land Subdivision Reserve
8,674
228
5,560
3,342
Waiau Gorge Ferry Bridge Preservation
91,136
2,975
91,136
2,975
Hanmer Springs Tourism Promotion
33,527
1,536
0
35,063
S
N
Queen Mary Development Reserve
425,000
56,728
399,616
82,112
IO
Queen Mary Nurses Block Govt Grant Fund
1,508,443
63,362
342,709
1,229,096
T
District Library - Amberley Ward
(123,563)
27,279
0
(96,284)
ISA
N
District Library
(169,427)
13,536
0
(155,891)
A
Chamberlain Bros Trust
15,271
700
0
15,971
G
R
Graves Maintenance Trust
1,758
80
0
1,838
O
Culverden Domain Gates
510
23
0
533
Busch Legacy Trust
155
7
0
162
LLED
Hawarden Memorial Park
5,609
(1,623)
0
3,986
RO
Bridson Trust
925
42
0
967
T
N
Forrester Trust
990
45
0
1,035
O
Adverse Events Rescue
13,114
0
0
13,114
1,969,441
259,041
1,951,037
277,445
IL C
C
N
U
O
C
103
Hurunui District Council
Council Controlled Organisations
Enterprise North Canterbury
Background
4
Town Support
Enterprise North Canterbury (ENC) is a charitable trust which
provides promotions and economic development services for the 4.1 ENC wil assist town development as and when invited
North Canterbury region. On behalf of Waimakariri and Hurunui
District Councils its activities are focussed on developing existing 1.1. 2010/2011 Achievements
businesses and promoting new businesses within the region. 1.1. ENC has a pivotal role in the enhancement of business
The Trust also promotes the region as a visitor destination.
capability through training, coaching and mentoring of the
The Mayors of the two Councils are trustees and the two SME sector. It is a significant opportunity for engagement
Chief Executive Officers are advisory trustees. Other trustees with the region’s businesses through:
are appointed jointly by the Hurunui and Waimakariri District • Business Assistance
Councils.
• Mentoring
2010/2011 Objectives
• The Sustainable Tourism Adviser in Region (STAR)
• The North Canterbury Job Vacancy Website.
1. Retain and support existing Smal /Medium Enterprises
• Three issues of Business Gems (ENC’s newslet er) were
1.1 ENC wil support existing businesses by the provision of
produced.
training, coaching, and mentoring services and networking
opportunities
1.2. The celebration of business achievements within the region
1.2 ENC wil celebrate and recognise business leaders and
is an important stimulus for entrepreneurs through the 2010
business successes
North Canterbury Exceptional Business Awards held on 3
1.3 ENC wil promote Waimakariri District in accordance with
September.
the annual y approved WDC/ENC promotion business 1.3. ENC has a service contract with the Waimakariri District
plan. Hurunui District Council did not contract ENC to carry
Council to promote that District in accordance with the
out this function.
Promotion Plan approved by the Council. No similar
1.4 ENC wil facilitate the establishment of industry groupings
contract exists with Hurunui District Council.
where these are sought by the sector, to achieve efficiencies 1.4. Often smal and medium businesses wil benefit from a
in marketing, product development and the securing of
col aborative approach to achieve superior results than is
resources
possible by each business acting independently, and ENC
1.5 Undertake research to identify gaps, opportunities and track
is wel placed to facilitate such sector groupings in particular
business issues and trends
The North Canterbury Food and Wine Trail and the
partnership between ENC, Amuri Dairy Employers Group
2 Large Businesses and New Projects
and DairyNZ.
2.1 ENC wil promote the development of “business to business” 1.5. ENC undertook their six monthly business confidence and
networks within the region
labour needs survey in November 2010. However in April
2.2 Where planning and/or regulatory barriers unreasonably
2011 a greater level of information was gathered from large
restrict the growth of businesses, ENC wil advocate to
employers as part of the DOL Pathway to Peers Programme.
Councils and government for the relaxation of such
barriers.
2 ENC achieved this through networking functions,
2. 3 ENC wil assist new businesses looking to establish in the Canterbury Food & Wine Trails and Pathway to
region.
Peers Programme.
2.4 ENC wil be proactive in searching for and supporting 2.2 ENC is working with the two Councils in the
new initiatives that wil create substantial wealth for the development of a Local Economic Development
region. Particular emphasis wil be given to the primary Strategy which among other things will assist in the
sector and its related servicing industries
identification on barriers to growth. Understandably
action on this objective was compromised by the
3 Infrastructure
earthquakes.
3.1 When ENC identifies infrastructural gaps that may impact 2.3 The earthquakes have had a significant impact with
on the creation of wealth in the region it wil lobby
many local businesses having to relocate and some
appropriate agencies for the provision of such facilities and
from outside the region looking to establish in the
services.
region. ENC focused on the needs of local
businesses in the first instance. ENC also
104
Annual Report - 1 July 2010 to 30 June 2010
N
developed a register of commercial premises Key Performance Measures
IO
available to lease or rent in North Canterbury and
T
C
promoted it on ENC’s website and to Christchurch 1. Facilitate project proposals in the region.
U
D
businesses through Canterbury Development 2. Provide leadership to stimulate and transform the RO
Corporation and Canterbury Employers Chamber of
T
Canterbury economy.
IN
Commerce.
3. Communicate national shifts to regional economic
2.4 The rural sector is the backbone of the region’s
development role players.
economy and will be the basis for future wealth
creation in the region in particular through the Rural Results
Technology Transfer Project.
The Canterbury Economic Development Company Limited
was successful in having six projects approved for funding
3.1 ENC has remained engaged in the Government by New Zealand Trade and Enterprise (NZTE). These
rollout of a series of policy initiatives relating to projects were:
broadband.
• Canterbury Regional Water Infrastructure
IES
IT
4.1 The key Town Support role undertaken by ENC • Canterbury Food & Wine Trial
IV
T
was to assist with business recovery in the
C
decimated business centre of Kaiapoi following • Canterbury Rural Broadband Project
IL A
C
the September earthquake. The task dominated • Rural Technology Transfer Project
N
U
ENC activity for many months. While full reports
O
• Canterbury Regional Innovation System Project
C
have been provided to the many agencies involved
in the funding and management of the recovery • The Blueprint Farm Business Plan Project
programme, key highlights involving ENC were:
Due to the earthquakes and extensions to all six projects,
• Liaison and engagement with Kaiapoi businesses to income has been delayed. All projects will be completed
assess needs and provide recovery information
by the end of December 2011.
• Coordination of business support initiatives and
securing of funding for same
Transwaste Canterbury Limited
• Running business recovery workshops and sector Background
S
cluster meetings
T
• Running Shop Kaiapoi Campaign
Transwaste Canterbury Limited operates a regional landfill
EN
at Kate Valley and associated transport services in a joint
EM
• Secured Business Recovery Coordinator (seconded
T
from Ministry of Social Development) for full time venture with Canterbury Waste Services.
engagement with Kaiapoi businesses
L STA
The Hurunui District Council is one of the councils in the
IA
• Capability Assessments for 108 businesses resulting
C
Canterbury region which between them own 50% of the
N
in 40 individual action plans for recovery
A
shares in Transwaste Canterbury Limited. Hurunui’s share
FIN
of the Company amounts to 1.2%.
Canterbury Economic Development
The council shareholders appoint representatives to a
Company Limited
joint committee which in turn appoints four of the eight
directors.
S
Background
Key Performance Measures
N
IO
1. To ensure that Transwaste performs in accordance with
T
The Canterbury Economic Development Company is a
A
its Statement of Intent.
IS
new Council Controlled Organisation (CCO) that enables
IES
N
Results
IT
A
the allocation of regional partnership funding for economic
GIV
R
development from Central Government for the Canterbury
T
Council has not formally reviewed the Company’s Annual
C
OD
Region. Two of the ten Company Directors represent Report to measure performance against the Statement of
F A
ELL
North Canterbury; one was nominated by the three Intent.
OPS O
R
Councils (Kaikoura, Hurunui and Waimakariri District’s)
U
TN
and the other is an industry representative endorsed by
RO
O
the Councils.
G
CILC
These directors will represent North Canterbury during the
N
U
contestable funding allocation processes to be undertaken
O
C
by this CCO.
105
 Independent Auditor’s Report
To the readers of
Hurunui District Council and group’s
Annual report
for the year ended 30 June 2011
Independent Auditor’s Report
To the readers of
Hurunui District Council and group’s
Annual report
for the year ended 30 June 2011
The Auditor-General is the auditor of Hurunui District Council (the District Council) and group.
The Auditor-General has appointed me, Andy Burns, using the staff and resources of Audit
New Zealand, to carry out the audit of the financial statements, groups of council activities
information and compliance with the other requirements of Schedule 10 of the Local
Government Act 2002 that apply to the annual report of the District Council and group on her
behalf.
We have audited:
the financial statements of the District Council and group on pages 71 to 103, that
comprise the statement of financial position as at 30 June 2011, the statement of
comprehensive income, statement of changes in equity and statement of cash flows for
the year ended on that date and the notes to the financial statements that include
accounting policies and other explanatory information;
the groups of council activities information of the District Council and group on pages
17 to 70; and
the District Council’s compliance with the other requirements of Schedule 10 of the
Local Government Act 2002 that apply to the annual report (other Schedule 10
information).
Opinion on the financial statements, non-financial performance information
and other Schedule 10 information
In our opinion:
The financial statements of the District Council and group on pages 71 to 103:
comply with generally accepted accounting practice in New Zealand; and
fairly reflect:
the District Council and group’s financial position as at 30 June
2011; and
the financial performance and cash flows for the year ended on
that date.
The groups of council activities information of the District Council and group on pages
17 to 70:
comply with generally accepted accounting practice in New Zealand; and
fairly reflect the District Council and group’s levels of service for the year
ended 30 June 2011, including:
the levels of service as measured against the intended levels of
service adopted in the long-term council community plan; and
the reasons for any significant variances between the actual service
and the expected service.
The District Council has complied with the other requirements of Schedule 10 of the
Local Government Act 2002 that apply to the annual report.
Our audit was completed on 24 November 2011. This is the date at which our opinion is
expressed.
The basis of our opinion is explained below. In addition, we outline the responsibilities of the
Council and our responsibilities, and explain our independence.
Basis of opinion
We carried out our audit in accordance with the Auditor-General’s Auditing Standards, which
incorporate the International Standards on Auditing (New Zealand). Those standards require
that we comply with ethical requirements and plan and carry out our audit to obtain
reasonable assurance about whether the financial statements, groups of council activities
information and other Schedule 10 information are free from material misstatement.
Material misstatements are differences or omissions of amounts and disclosures that would
affect a reader’s overall understanding of the financial statements, groups of council activities
information and other Schedule 10 information. If we had found material misstatements that
were not corrected, we would have referred to them in our opinion.
An audit involves carrying out procedures to obtain audit evidence about the amounts and
disclosures in the financial statements, groups of council activities information and other
Schedule 10 information. The procedures selected depend on our judgement, including our
assessment of risks of material misstatement of the financial statements, groups of council
activities information and other Schedule 10 information whether due to fraud or error. In
making those risk assessments, we consider internal control relevant to the preparation of the
District Council and group’s financial statements, groups of council activities information and
other Schedule 10 information that fairly reflect the matters to which they relate. We consider
internal control in order to design audit procedures that are appropriate in the circumstances
but not for the purpose of expressing an opinion on the effectiveness of the District Council and
group’s internal control.
An audit also involves evaluating:
the appropriateness of accounting policies used and whether they have been
consistently applied;
the reasonableness of the significant accounting estimates and judgements made by
the Council;
the adequacy of all disclosures in the financial statements and non-financial
performance information;
determining the appropriateness of the reported non-financial performance
information within the Council’s framework for reporting performance; and
the overall presentation of the financial statements, non-financial performance
information and other Schedule 10 information.
We did not examine every transaction, nor do we guarantee complete accuracy of the
financial statements, groups of council activities information and other Schedule 10 information.
We have obtained all the information and explanations we have required and we believe we
have obtained sufficient and appropriate audit evidence to provide a basis for our audit
opinion.
Responsibilities of the Council
The Council is responsible for preparing:
financial statements and groups of council activities information that:
comply with generally accepted accounting practice in New Zealand;
fairly reflect the District Council and group’s financial position, financial
performance and cash flows;
fairly reflect its service performance, including achievements compared to its
forecast; and
other information required by Schedule 10 of the Local Government Act 2002.
The Council is responsible for such internal control as it determines is necessary to enable the
preparation of financial statements, groups of council activities information and other Schedule
10 information that are free from material misstatement, whether due to fraud or error.
The Council’s responsibilities arise from the Local Government Act 2002.
Responsibilities of the Auditor
We are responsible for expressing an independent opinion on the financial statements, groups
of council activities information and compliance with the other Schedule 10 information and
reporting that opinion to you based on our audit. Our responsibility arises from section 15 of
the Public Audit Act 2001 and section 99 of the Local Government Act 2002.
Independence
When carrying out the audit, we fol owed the independence requirements of the
Auditor-General, which incorporate the independence requirements of the New Zealand Institute
of Chartered Accountants.

Other than the audit, we have no relationship with or interests in the District Council or any of
its subsidiaries.
Andy Burns
Audit New Zealand
On behalf of the Auditor-General
Christchurch, New Zealand