


 2013/14
Annual Plan
2013/14
Annual Report 2013/14
Contents
Introduction .......................................................................................................................................................................1
Foreword .. .. .. .. .. .. .. .. .. .. .. .. .. .. .. .. .. .. .. .. .. .. .. .. .. .. .. .. .. .. .. .. .. .. .. .. .. .. .. .. .. .. .. .. .. .. .. .. .. .. .. .. .. .. .. .. .. .. .. .. .. .. .. .. .. .. .. .. .. .. .. .. .. .. .. .. .. .. .. .. .. .. .. .. .. .. .. .. .. .. 2
Introduction from the Mayor and Chief Executive Officer .. .. .. .. .. .. .. .. .. .. .. .. .. .. .. .. .. .. .. .. .. .. .. .. .. .. .. .. .. .. .. .. .. .. .. .. .. .. .. .. .. .. .. .. .. .. .. .. .. .. .. .. .. 3
Purpose of the Council .. .. .. .. .. .. .. .. .. .. .. .. .. .. .. .. .. .. .. .. .. .. .. .. .. .. .. .. .. .. .. .. .. .. .. .. .. .. .. .. .. .. .. .. .. .. .. .. .. .. .. .. .. .. .. .. .. .. .. .. .. .. .. .. .. .. .. .. .. .. .. .. .. .. .. .. .. .. .. 6
The planning cycle .. .. .. .. .. .. .. .. .. .. .. .. .. .. .. .. .. .. .. .. .. .. .. .. .. .. .. .. .. .. .. .. .. .. .. .. .. .. .. .. .. .. .. .. .. .. .. .. .. .. .. .. .. .. .. .. .. .. .. .. .. .. .. .. .. .. .. .. .. .. .. .. .. .. .. .. .. .. .. .. .. .. 7
Shared services and partnerships .. .. .. .. .. .. .. .. .. .. .. .. .. .. .. .. .. .. .. .. .. .. .. .. .. .. .. .. .. .. .. .. .. .. .. .. .. .. .. .. .. .. .. .. .. .. .. .. .. .. .. .. .. .. .. .. .. .. .. .. .. .. .. .. .. .. .. .. .. .. 8
Māori decision making .. .. .. .. .. .. .. .. .. .. .. .. .. .. .. .. .. .. .. .. .. .. .. .. .. .. .. .. .. .. .. .. .. .. .. .. .. .. .. .. .. .. .. .. .. .. .. .. .. .. .. .. .. .. .. .. .. .. .. .. .. .. .. .. .. .. .. .. .. .. .. .. .. .. .. .. .. .. 10
Statement of compliance and responsibility .. .. .. .. .. .. .. .. .. .. .. .. .. .. .. .. .. .. .. .. .. .. .. .. .. .. .. .. .. .. .. .. .. .. .. .. .. .. .. .. .. .. .. .. .. .. .. .. .. .. .. .. .. .. .. .. .. .. .. .. .. .. 11
Groups of Council Activities ..........................................................................................................................................13
Introduction .. .. .. .. .. .. .. .. .. .. .. .. .. .. .. .. .. .. .. .. .. .. .. .. .. .. .. .. .. .. .. .. .. .. .. .. .. .. .. .. .. .. .. .. .. .. .. .. .. .. .. .. .. .. .. .. .. .. .. .. .. .. .. .. .. .. .. .. .. .. .. .. .. .. .. .. .. .. .. .. .. .. .. .. .. .. .. 14
Overall comparison with the 2013/14 Annual Plan .. .. .. .. .. .. .. .. .. .. .. .. .. .. .. .. .. .. .. .. .. .. .. .. .. .. .. .. .. .. .. .. .. .. .. .. .. .. .. .. .. .. .. .. .. .. .. .. .. .. .. .. .. .. .. .. .. 14
Water supply .. .. .. .. .. .. .. .. .. .. .. .. .. .. .. .. .. .. .. .. .. .. .. .. .. .. .. .. .. .. .. .. .. .. .. .. .. .. .. .. .. .. .. .. .. .. .. .. .. .. .. .. .. .. .. .. .. .. .. .. .. .. .. .. .. .. .. .. .. .. .. .. .. .. .. .. .. .. .. .. .. .. .. .. .. .. 16
Sewerage .. .. .. .. .. .. .. .. .. .. .. .. .. .. .. .. .. .. .. .. .. .. .. .. .. .. .. .. .. .. .. .. .. .. .. .. .. .. .. .. .. .. .. .. .. .. .. .. .. .. .. .. .. .. .. .. .. .. .. .. .. .. .. .. .. .. .. .. .. .. .. .. .. .. .. .. .. .. .. .. .. .. .. .. .. .. .. .. 21
Roads and footpaths .. .. .. .. .. .. .. .. .. .. .. .. .. .. .. .. .. .. .. .. .. .. .. .. .. .. .. .. .. .. .. .. .. .. .. .. .. .. .. .. .. .. .. .. .. .. .. .. .. .. .. .. .. .. .. .. .. .. .. .. .. .. .. .. .. .. .. .. .. .. .. .. .. .. .. .. .. .. .. .. 24
Stormwater and drainage .. .. .. .. .. .. .. .. .. .. .. .. .. .. .. .. .. .. .. .. .. .. .. .. .. .. .. .. .. .. .. .. .. .. .. .. .. .. .. .. .. .. .. .. .. .. .. .. .. .. .. .. .. .. .. .. .. .. .. .. .. .. .. .. .. .. .. .. .. .. .. .. .. .. .. .. 27
Community services and facilities.. .. .. .. .. .. .. .. .. .. .. .. .. .. .. .. .. .. .. .. .. .. .. .. .. .. .. .. .. .. .. .. .. .. .. .. .. .. .. .. .. .. .. .. .. .. .. .. .. .. .. .. .. .. .. .. .. .. .. .. .. .. .. .. .. .. .. .. .. .. 29
Community services .. .. .. .. .. .. .. .. .. .. .. .. .. .. .. .. .. .. .. .. .. .. .. .. .. .. .. .. .. .. .. .. .. .. .. .. .. .. .. .. .. .. .. .. .. .. .. .. .. .. .. .. .. .. .. .. .. .. .. .. .. .. .. .. .. .. .. .. .. .. .. .. .. .. .. .. .. .. .. .. .. .. .. .. .. .. 31
Property.. .. .. .. .. .. .. .. .. .. .. .. .. .. .. .. .. .. .. .. .. .. .. .. .. .. .. .. .. .. .. .. .. .. .. .. .. .. .. .. .. .. .. .. .. .. .. .. .. .. .. .. .. .. .. .. .. .. .. .. .. .. .. .. .. .. .. .. .. .. .. .. .. .. .. .. .. .. .. .. .. .. .. .. .. .. .. .. .. .. .. .. .. .. .. .. 34
Reserves .. .. .. .. .. .. .. .. .. .. .. .. .. .. .. .. .. .. .. .. .. .. .. .. .. .. .. .. .. .. .. .. .. .. .. .. .. .. .. .. .. .. .. .. .. .. .. .. .. .. .. .. .. .. .. .. .. .. .. .. .. .. .. .. .. .. .. .. .. .. .. .. .. .. .. .. .. .. .. .. .. .. .. .. .. .. .. .. .. .. .. .. .. .. .. 36
Environment and safety.. .. .. .. .. .. .. .. .. .. .. .. .. .. .. .. .. .. .. .. .. .. .. .. .. .. .. .. .. .. .. .. .. .. .. .. .. .. .. .. .. .. .. .. .. .. .. .. .. .. .. .. .. .. .. .. .. .. .. .. .. .. .. .. .. .. .. .. .. .. .. .. .. .. .. .. .. .. 37
Emergency services .. .. .. .. .. .. .. .. .. .. .. .. .. .. .. .. .. .. .. .. .. .. .. .. .. .. .. .. .. .. .. .. .. .. .. .. .. .. .. .. .. .. .. .. .. .. .. .. .. .. .. .. .. .. .. .. .. .. .. .. .. .. .. .. .. .. .. .. .. .. .. .. .. .. .. .. .. .. .. .. .. .. .. .. .. .. 40
Resource management .. .. .. .. .. .. .. .. .. .. .. .. .. .. .. .. .. .. .. .. .. .. .. .. .. .. .. .. .. .. .. .. .. .. .. .. .. .. .. .. .. .. .. .. .. .. .. .. .. .. .. .. .. .. .. .. .. .. .. .. .. .. .. .. .. .. .. .. .. .. .. .. .. .. .. .. .. .. .. .. .. .. .. .. 41
Compliance and regulatory functions .. .. .. .. .. .. .. .. .. .. .. .. .. .. .. .. .. .. .. .. .. .. .. .. .. .. .. .. .. .. .. .. .. .. .. .. .. .. .. .. .. .. .. .. .. .. .. .. .. .. .. .. .. .. .. .. .. .. .. .. .. .. .. .. .. .. .. .. .. .. .. .. .. 44
Waste minimisation .. .. .. .. .. .. .. .. .. .. .. .. .. .. .. .. .. .. .. .. .. .. .. .. .. .. .. .. .. .. .. .. .. .. .. .. .. .. .. .. .. .. .. .. .. .. .. .. .. .. .. .. .. .. .. .. .. .. .. .. .. .. .. .. .. .. .. .. .. .. .. .. .. .. .. .. .. .. .. .. .. .. .. .. .. .. .. 47
District promotion .. .. .. .. .. .. .. .. .. .. .. .. .. .. .. .. .. .. .. .. .. .. .. .. .. .. .. .. .. .. .. .. .. .. .. .. .. .. .. .. .. .. .. .. .. .. .. .. .. .. .. .. .. .. .. .. .. .. .. .. .. .. .. .. .. .. .. .. .. .. .. .. .. .. .. .. .. .. .. .. .. .. 49
Hanmer Springs Thermal Pools and Spa .. .. .. .. .. .. .. .. .. .. .. .. .. .. .. .. .. .. .. .. .. .. .. .. .. .. .. .. .. .. .. .. .. .. .. .. .. .. .. .. .. .. .. .. .. .. .. .. .. .. .. .. .. .. .. .. .. .. .. .. .. .. .. .. 51
Governance.. .. .. .. .. .. .. .. .. .. .. .. .. .. .. .. .. .. .. .. .. .. .. .. .. .. .. .. .. .. .. .. .. .. .. .. .. .. .. .. .. .. .. .. .. .. .. .. .. .. .. .. .. .. .. .. .. .. .. .. .. .. .. .. .. .. .. .. .. .. .. .. .. .. .. .. .. .. .. .. .. .. .. .. .. .. .. 54
Financial Statements.......................................................................................................................................................57
Statement of comprehensive income .. .. .. .. .. .. .. .. .. .. .. .. .. .. .. .. .. .. .. .. .. .. .. .. .. .. .. .. .. .. .. .. .. .. .. .. .. .. .. .. .. .. .. .. .. .. .. .. .. .. .. .. .. .. .. .. .. .. .. .. .. .. .. .. .. .. .. 58
Statement of changes in equity.. .. .. .. .. .. .. .. .. .. .. .. .. .. .. .. .. .. .. .. .. .. .. .. .. .. .. .. .. .. .. .. .. .. .. .. .. .. .. .. .. .. .. .. .. .. .. .. .. .. .. .. .. .. .. .. .. .. .. .. .. .. .. .. .. .. .. .. .. .. .. .. 59
Statement of financial position .. .. .. .. .. .. .. .. .. .. .. .. .. .. .. .. .. .. .. .. .. .. .. .. .. .. .. .. .. .. .. .. .. .. .. .. .. .. .. .. .. .. .. .. .. .. .. .. .. .. .. .. .. .. .. .. .. .. .. .. .. .. .. .. .. .. .. .. .. .. .. .. 60
Statement of cash flows .. .. .. .. .. .. .. .. .. .. .. .. .. .. .. .. .. .. .. .. .. .. .. .. .. .. .. .. .. .. .. .. .. .. .. .. .. .. .. .. .. .. .. .. .. .. .. .. .. .. .. .. .. .. .. .. .. .. .. .. .. .. .. .. .. .. .. .. .. .. .. .. .. .. .. .. .. 61
Notes to the financial statements .. .. .. .. .. .. .. .. .. .. .. .. .. .. .. .. .. .. .. .. .. .. .. .. .. .. .. .. .. .. .. .. .. .. .. .. .. .. .. .. .. .. .. .. .. .. .. .. .. .. .. .. .. .. .. .. .. .. .. .. .. .. .. .. .. .. .. .. .. .. 62
Funding impact statements .. .. .. .. .. .. .. .. .. .. .. .. .. .. .. .. .. .. .. .. .. .. .. .. .. .. .. .. .. .. .. .. .. .. .. .. .. .. .. .. .. .. .. .. .. .. .. .. .. .. .. .. .. .. .. .. .. .. .. .. .. .. .. .. .. .. .. .. .. .. .. .. .. .. 100
Benchmarking................................................................................................................................................................ 111
Introduction .. .. .. .. .. .. .. .. .. .. .. .. .. .. .. .. .. .. .. .. .. .. .. .. .. .. .. .. .. .. .. .. .. .. .. .. .. .. .. .. .. .. .. .. .. .. .. .. .. .. .. .. .. .. .. .. .. .. .. .. .. .. .. .. .. .. .. .. .. .. .. .. .. .. .. .. .. .. .. .. .. .. .. .. .. .. 112
The benchmarks .. .. .. .. .. .. .. .. .. .. .. .. .. .. .. .. .. .. .. .. .. .. .. .. .. .. .. .. .. .. .. .. .. .. .. .. .. .. .. .. .. .. .. .. .. .. .. .. .. .. .. .. .. .. .. .. .. .. .. .. .. .. .. .. .. .. .. .. .. .. .. .. .. .. .. .. .. .. .. .. .. .. 113
Council Contol ed Organisations ................................................................................................................................. 119
Enterprise North Canterbury.. .. .. .. .. .. .. .. .. .. .. .. .. .. .. .. .. .. .. .. .. .. .. .. .. .. .. .. .. .. .. .. .. .. .. .. .. .. .. .. .. .. .. .. .. .. .. .. .. .. .. .. .. .. .. .. .. .. .. .. .. .. .. .. .. .. .. .. .. .. .. .. .. 120
Transwaste Canterbury Limited.. .. .. .. .. .. .. .. .. .. .. .. .. .. .. .. .. .. .. .. .. .. .. .. .. .. .. .. .. .. .. .. .. .. .. .. .. .. .. .. .. .. .. .. .. .. .. .. .. .. .. .. .. .. .. .. .. .. .. .. .. .. .. .. .. .. .. .. .. .. .. 122
Independent Auditor’s Report ...................................................................................................................................... 123
Appendices ....................................................................................................................................................................129
Council commit ee structure .. .. .. .. .. .. .. .. .. .. .. .. .. .. .. .. .. .. .. .. .. .. .. .. .. .. .. .. .. .. .. .. .. .. .. .. .. .. .. .. .. .. .. .. .. .. .. .. .. .. .. .. .. .. .. .. .. .. .. .. .. .. .. .. .. .. .. .. .. .. .. .. .. 130
Organisational structure .. .. .. .. .. .. .. .. .. .. .. .. .. .. .. .. .. .. .. .. .. .. .. .. .. .. .. .. .. .. .. .. .. .. .. .. .. .. .. .. .. .. .. .. .. .. .. .. .. .. .. .. .. .. .. .. .. .. .. .. .. .. .. .. .. .. .. .. .. .. .. .. .. .. .. .. 131
i
⌂
Hurunui District Council
⌂
ii
Annual Report 2013/14
Introduction
Foreword .. .. .. .. .. .. .. .. .. .. .. .. .. .. .. .. .. .. .. .. .. .. .. .. .. .. .. .. .. .. .. .. .. .. .. .. .. .. .. .. .. .. .. .. .. .. .. .. .. .. .. .. .. .. .. .. .. .. .. .. .. .. .. .. 2
Introduction from the Mayor and Chief Executive Officer .. .. .. .. .. .. .. .. .. .. .. .. .. .. .. .. .. .. .. .. .. .. .. .. .. .. .. 3
Purpose of the Council .. .. .. .. .. .. .. .. .. .. .. .. .. .. .. .. .. .. .. .. .. .. .. .. .. .. .. .. .. .. .. .. .. .. .. .. .. .. .. .. .. .. .. .. .. .. .. .. .. .. .. .. .. 6
The planning cycle .. .. .. .. .. .. .. .. .. .. .. .. .. .. .. .. .. .. .. .. .. .. .. .. .. .. .. .. .. .. .. .. .. .. .. .. .. .. .. .. .. .. .. .. .. .. .. .. .. .. .. .. .. .. .. .. 7
Shared services and partnerships .. .. .. .. .. .. .. .. .. .. .. .. .. .. .. .. .. .. .. .. .. .. .. .. .. .. .. .. .. .. .. .. .. .. .. .. .. .. .. .. .. .. .. .. 8
Māori decision making .. .. .. .. .. .. .. .. .. .. .. .. .. .. .. .. .. .. .. .. .. .. .. .. .. .. .. .. .. .. .. .. .. .. .. .. .. .. .. .. .. .. .. .. .. .. .. .. .. .. .. .. 10
Statement of compliance and responsibility .. .. .. .. .. .. .. .. .. .. .. .. .. .. .. .. .. .. .. .. .. .. .. .. .. .. .. .. .. .. .. .. .. .. .. .. 11
1
⌂
Hurunui District Council
Foreword
This Annual Report provides information about our per-
formance during the 2013/14 financial year.
The report outlines how the Council has performed both
overall and in respect of 14 specific activities, including
roads, water supply, sewers, and the Hanmer Springs
Thermal Pools and Spa (see the contents page for a com-
plete list of the 14 activities).
While a large part of this report is financial information,
we also provide information about the performance
measures original y identified in the 2012/22 Hurunui
Community Long Term Plan. In this report we summa-
rise our position against each of the measures and show
whether they have been “Met”, “Mostly Met”, or “Not
Met”. A measure that was ‘Mostly Met’ is one which fal s
short of being met by such a narrow margin that it would
be unreasonable to call it ‘not met’.
⌂
2
Annual Report 2013/14
Introduction from the Mayor and Chief Executive Officer
This Annual Report summarises our performance for
Capital Expenditure was $8.7 mil ion, which was $1.5
the financial year from 1 July 2013 to 30 June 2014. Our
mil ion up on the level budgeted for. The key variances
programme of activities was based on the second year
being the completion of some projects that were car-
of our 10 year plan (Hurunui Community Long Term Plan
ried forward from the 2012/2013 year, principal y the
2012/22).
completion of the Amberley Transfer Station Project and
some pipe upgrade work for Amberley Sewer. Included in
For the most part, the 2013/14 year has been business
the capital expenditure is $1,010,000 of assets that were
as usual but with some changes to our governance and
vested in the Council during the year.
leadership. The triennial local government election in
October 2013 brought about changes to our Council
The Council now owns $379 mil ion of assets on behalf of
with three new councillors and six returning. The Han-
our residents and ratepayers. At 30 June 2014, Council’s
mer Springs Community Board had a substantial change
debt was $16.2 mil ion. We have debt because of two
with four new members and one returning member. In
main reasons:
addition, Hamish Dobbie joined the Council as our new
1. We borrowed in recent years to fund capital im-
Chief Executive Officer in September 2013. Despite this
provements at the Hanmer Springs Thermal Pools
level of change to our council, we have continued to
and Spa complex which is owned by the Council. It is
make steady progress with minimal disruption to our
important to make sure the complex is refreshed and
programme.
is in top condition to continue to attract visitors from
around New Zealand and other countries, and con-
Financial Performance
tinues to generate a revenue stream for the benefit
We are committed to managing Council funds and your
of the district. The complex generated a $2.4 mil ion
rates responsibly and affordability is a primary focus
surplus in 2013/14, which was $188,000 greater than
when it comes to deciding what we do and don’t do. The
was budgeted for.
detail about our financial performance is contained with- 2. We took on debt to build and redevelop core in-
in this document, but here are some brief facts about
frastructure to meet higher standards mandated
our financial performance in the past year.
by the Regional Council and Central Government
regulations (for example; the first stage of meet-
Council recorded a net deficit after tax of $1,858,000.
ing full compliance with the New Zealand Drinking
This was $379,000 lower than the budgeted net deficit
Water Standards across the district and upgrading of
of $1,479,000. Council has recognised a further increase
effluent infrastructure to meet the increased dis-
in the valuation of its assets for the year of $4,163,000,
charge standards driven by the implementation of
and $121,000 increase to the value of its equity shares
the National Policy Statement for Freshwater Man-
bringing the total comprehensive income up to a total of
agement).
$2,426,000.
Service Performance
Our operating revenue was $36.9 mil ion which was $5.5 Since 2007, we have undertaken a resident satisfaction
mil ion greater than what we predicted in our annual
survey each year. The most recent survey was undertak-
plan. The key variances were due to roading subsidies re- en in February 2014 and pleasingly, it shows that most
ceived in relation to the emergency reinstatement work
people are reasonably satisfied with the Council’s perfor-
that was required after the July 2013 storm event. In ad-
mance overall.
dition, Council received $3.8 mil ion is forestry proceeds
as the result of harvesting the Ashworths Forestry block
This year’s survey showed that:
after the wind event of October 2013.
• 75% of residents were satisfied (or highly satisfied)
over all with the Council
Operating expenditure was $38.7 mil ion which was $5.9 • 74% had trust in Council’s decision making
mil ion greater than predicted in the annual plan. The
• 73% had trust in Council staff to do a good job
key variances were costs in relation to harvesting the
• 75% had trust in Council to do a good job
forestry block of $2.0 mil ion, the additional $1.8 mil ion
• 81% had trust in Council to manage its debt level
spent on emergency reinstatement work for roading and • 77% were satisfied with the performance of the May-
$1.9 mil ion more in depreciation costs.
or and Councillors
• 71% were satisfied with the level of service received
at council offices
3
⌂
Hurunui District Council
Most of our services such as libraries, public toilets,
reconsider. With the endorsement of our local ward
cemeteries, community hal s, etc, have consistently
committees and board, we have since increased our risk
received high satisfaction. Roading on the other hand is
on some Council owned assets and reduced our insur-
the Council’s largest spending area and the most visible
ance bill by $217,000.
asset we have, but overal , results tend not to be as high.
Residents satisfied with the maintenance on the roads
Sewer Improvements
was 70% compared to 65% last year. Sealed roads rated We had a number of costly sewer projects to undertake
at 69% satisfaction, lower than the 76% scored last year, including desludging of some of our sewer plants. We
but unsealed roads continued to receive a low satisfac-
decided not to do Hanmer Springs in 2013/14 after our
tion rating with the last two years scoring around 50%.
engineers assessed that this could be deferred until
Roading has caused us concern for some time now with
2017/2018, subject to a further survey assessment closer
increased costs to maintain, increased public expecta-
to the time. However, the ponds of Hawarden and Wai-
tions, and less government assistance to financial y con-
kari cannot wait that long and have been re-prioritised
tribute. Whilst we will continue to try to more with less
for completion within the next two years. A new innova-
and work on improving our overall performance, we are
tive methodology for desludging is being considered to
rapidly approaching a point where we have to choose
reduce costs substantial y. Hopeful y this method will be
between reduced levels of service or increased cost to
able to be used for other larger ponds if found successful
our ratepayers. This will be a future discussion with our
and applicable.
residents through our long term planning process.
Drinking Water
District Changes
The Kaiwara water intake was substantial y damaged
There has been noticeable growth in the Amberley
during a storm in October 2012 and had been main-
Ward, and few of our people would not have discovered tained by a temporary supply. The new intake serving
the new retail complex which opened in May 2014, by
the Kaiwara rural water scheme has been completed,
now. Building consent applications have continued to be including new routed pipelines. We consider the new
steady although have dropped slightly from the previous location to have considerable less risk associated with it
year. The population for the Hurunui district has now
compared to the last intake placement, as well as pro-
been confirmed at 12,000 (2013 Census data), compared viding a good supply of water for this scheme into the
with 10,750 in 2006 (the previous Census). Most of our
future. Insurance cover paid for most of the new intake
townships are not growing and the main increase in pop- costs.
ulation has been due to the growth in the southern end
Hanmer Springs Doctor’s Residence
of the district. It is important for us to understand how
Finding qualified medical staff prepared to work and
population growth (and decline) impacts on our levels of live in rural New Zealand is a problem our district
service into the future.
shares with others in the country and the availability
Key Projects
of good quality accommodation is a very important
We undertook or commenced a number of projects
factor when recruiting GP’s. With suitable quality
during the year. In the ‘Council Activities’ section of this
rental accommodation in Hanmer Springs expensive
Annual Report, we have rated ourselves against a range
and scarce, it was sensible for the Practice to own
of performance measures. This is where we report how
its own GP residence. The Council owns the medical
well we did against what we said we were going to do.
centre in Hanmer Springs and now owns a resi-
All in al , we mainly achieved what we set out to do. In
dence, purchased in 2013.
the 2013/14 Annual Plan, we discussed a number of key
Cheviot Library/Service Centre
projects that we intended to do. This is a brief summary The Cheviot service centre renovations were finalised
on how we did:
during the year. The community library, which had been
Insurance premium reduction
based at the Cheviot Area School, moved into the build-
Up until 2012/13, the Council has ful y insured all of its
ing and has been up and running since October 2013.
assets. However the cost of doing so reached almost
District Plan Review
three times the cost it had been in 2010 (pre Canterbury This is a major project for the Council and one that will
earthquakes). Whereas the Council had agreed in 2012
take several years to complete. We have done a sub-
to remain ful y insured, the reality of that caused us to
⌂
4


Annual Report 2013/14
stantial amount of work on the District Plan over the
for our district including infrastructure affordability in
past year, inviting community and Ngai Tahu feedback on relation to demographic changes, ensuring a vibrant
several aspects of this as we have gone along. It will still framework for economic development and managing
be some months before it is finalised given the complex-
overall debt in the face of higher regulatory compliance
ities of this task, but we are satisfied with the progress
burdens coupled with reduced funding from central
we have been making. The District Plan is a key planning government. We are fortunate that we enjoy living and
and strategy document for us and the community and
working in one of New Zealand’s most wonderful dis-
we are keen to see that it reflects community desires,
tricts, with resilient and innovative people who will work
environmental responsibility and encourages develop-
with us to overcome future chal enges and firmly grasp
ment and growth.
the opportunities that eventuate.
Conclusion
I hope you enjoy reading this annual report.
The Council is focussed on delivering infrastructure,
regulatory and public services in a manner that is effec-
tive, efficient and appropriate to meet both our current
and future needs. The development of our Long Term
Plan for the 2015 to 2025 period, is already engaging the
minds of the Council and the people of the Hurunui. The
future holds a number of chal enges and opportunities
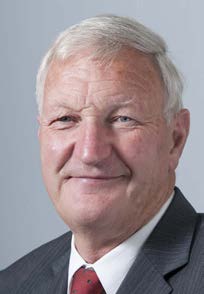
Winton Dalley
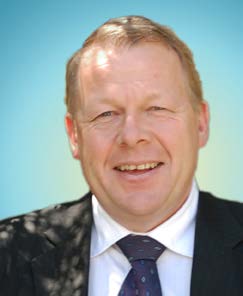
Hamish Dobbie
Mayor
Chief Executive Officer
5
⌂
Hurunui District Council
Purpose of the Council
The Council’s Vision
Community partnership in growth and wel being
The Council’s Core Principles
• Focus on core services
• Financial responsibility and affordability
• Continuous improvement in service to everyone in
our district
• Facilitate appropriate growth in the district
⌂
6
Annual Report 2013/14
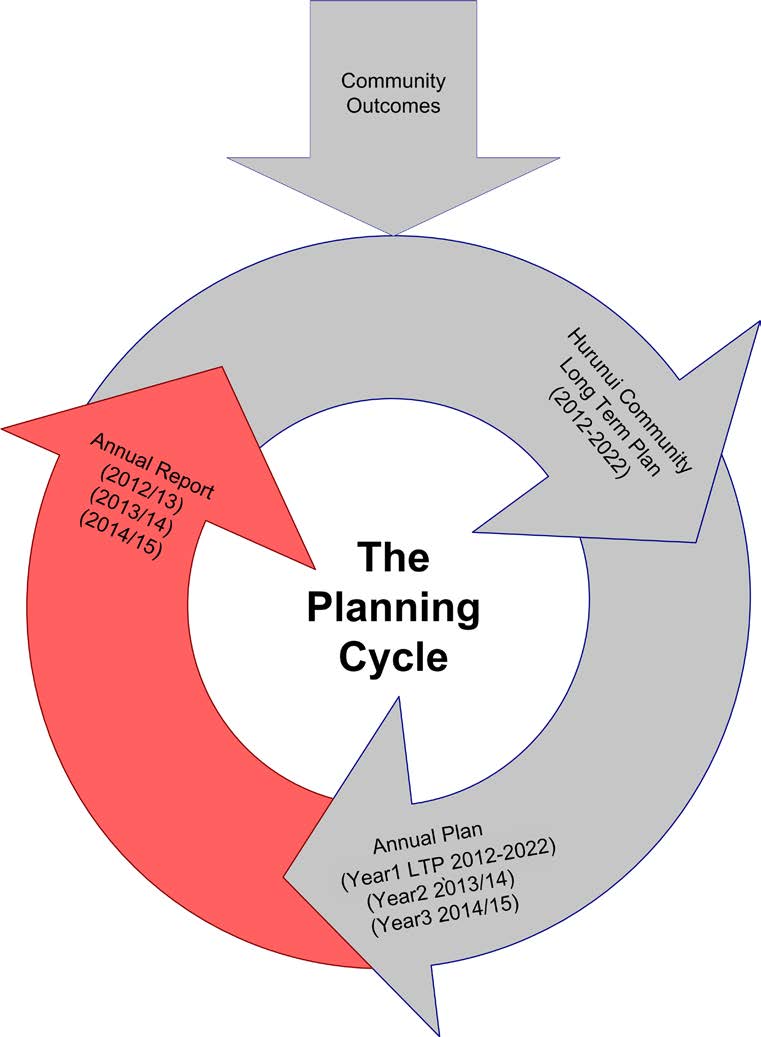
The planning cycle
This Annual Report is one product of a three-phase
achieve during the twelve months of the plan, what it will
“planning cycle”.
cost and where the funding will come from.
The planning cycle starts with the development of a
Both the Long Term Plan and the Annual Plan are pro-
“Long Term Plan”. In the Long Term Plan, we set out what duced first in draft form. The public are then invited to
we expect to be doing for the next ten years and how we make formal submissions about the draft plan which are
expect to pay for it. Although the Long Term Plan covers then considered by Council prior to the production of the
10 years, it is reviewed and revised every three years to
final plan document.
ensure that it is updated to reflect changes to the district
and community expectations.
The final part of the planning cycle is the Annual Report
(this document). The Annual Report looks back on the ac-
The Long Term Plan becomes the basis for the Annual
tivities of the past year and assesses how they compare
Plan produced every financial year (1 July - 31 June).
against the Plan for that year.
Except that in the year that the Long Term Plan is pro-
duced, the Long Term Plan becomes the Annual Plan for
that year. The Annual Plan details what we expect to
7
⌂
Hurunui District Council
Shared services and partnerships
Introduction
are evaluating the feasibility of an enlarged district from
Wherever possible the Council looks for the most cost
Selwyn in the south to Hurunui.
effective way to deliver services without compromising
service standards. One way of achieving this is by sharing Building
services with other bodies and engaging in partnerships
We have been working closely with our neighbouring
for service delivery. Some areas where we work in this
Councils to share our building officers and resources
way are:
to manage this area more efficiently. Skil ed building
officers are in high demand and expected to be for some
School and Community Libraries
years in the aftermath of the 2010/11 Canterbury Earth-
We operate shared libraries in two of the District’s three quakes.
Area Schools (Amuri and Hurunui). In each case, the
Council runs its community libraries in conjunction with
We currently have shared service agreements with
the school libraries. Hurunui Libraries are part of the
Waimakariri District Council, Kaikoura District Council,
Kotui consortium of 23 libraries from around the country Selwyn District Council, Timaru District Council and
which have purchased Library Management software to
Christchurch City Council.
reduce cost and include a shared help-desk model. We
are a member of two consortiums for the provision of
Economic Development
downloadable e and audio books. These are Overdrive
Our Council and Waimakariri District Council jointly
(South Island wide) and Borrow Box from Bolinda (Can-
support and fund Enterprise North Canterbury (ENC) to
terbury Libraries). We purchase electronic databases
help boost economic development in North Canterbury.
through the NZ wide EPIC service that provides a consor-
We contributed $51,565 for the 2013/14 year. ENC work
tium model to all public libraries in NZ. Hurunui Librar-
with businesses in both districts, providing business
ies is a foundation member of a proposed book buying
support, development and training, and special projects
consortium currently working with a preferred supplier
with an economic focus.
regarding shared book purchasing.
Roads
Mainpower Hurunui Natural Environment
We have a number of shared service agreements for our
Fund
roads. They include:
• Okuku Pass Road - shared maintenance agreement
Mainpower and the Council each contribute $5,000 per
with Waimakariri District Council (WDC) through
year toward a shared annual contestable fund. The
Sicon, their road maintenance contractor.
fund is to encourage people in the community to under-
• Shared maintenance agreement with WDC to all
take initiatives which restore natural plants and animal
shared local boundary roads. Sicon undertakes
life. The $10,000 fund is awarded in June each year to
the maintenance of all the shared sealed roads and
the successful recipients.
Downer (our road maintenance contractor) under-
Canterbury Museum
takes the maintenance of all the shared unsealed
Hurunui, Waimakariri and Selwyn District Councils along
roads).
with Christchurch City Council are the contributing
• Street lighting contract with Mainpower as a shared
authorities who fund the costs relating to the Canter-
service contract between us, WDC and NZ Transport
bury Museum. For the 2013/14 year, the Council con-
Agency for economy of scale.
tributed $63,226 of the total operating levies charge of
• Network Assessment Contract with BECA as a shared
$7,473,897.
service contract with us and WDC for economy of
scale.
Rural Fire Control
Kate Valley Landfill
To assist our rural fire forces, we bring in teams from
neighbouring authorities in the event of a major fire, and The Kate Val ey Landfill is situated within the Hurunui
reciprocate where required. We have also been actively
District but is a joint venture between Transpacific Indus-
involved for some years with all the territorial authorities tries Group (NZ) Limited and five local authorities in Can-
in Canterbury to evaluate a possible enlarged rural fire
terbury, including our Council. The councils col ective
district for the whole of Canterbury, and at present we
share is 50% with 1.2% of that belonging to the Hurunui
District Council. The company name is Transwaste Can-
terbury Ltd.
⌂
8
Annual Report 2013/14
Water
Because of our historical and on-going knowledge and
experience of operating and maintaining the Ashley
Rural water scheme, we continue to provide stock and
drinking water to a large part of the Waimakariri District,
including the townships of Sefton and Ashley. Approxi-
mately 1,400 Waimakariri residents pay the water pro-
portion of rates directly to our Council.
Rates Department
We col ect rates on behalf of the Canterbury Regional
Council and in return, they pay us a fee and a portion of
the rating valuation cost. This income is used to offset
the cost of running our rates department.
Information Technology
We work in col aboration with others through the Can-
terbury IT Managers Forum (projects and procurement),
the Canterbury Local Authorities GIS group (all of Canter-
bury GIS viewer) and Canterbury GIS Consortium (aerial
imagery procurement).
In January 2014, the Council entered into an agreement
to provide full information technology services to Kaik-
oura District Council.
9
⌂
Hurunui District Council
Māori decision making
We work hard to ensure that Māori perspectives are an
• Meetings between the Council and Ngāi Tahu.
integral part of our decision making processes. We do
• Providing runanga with a copy of the weekly report
this through having policies that include Māori perspec-
of new resource consents applications.
tives, including Māori in our committees, and working
• Consulting runanga on notified consents, or Statuto-
together with Māori on specific issues of common in-
ry Acknowledgment Areas, or quarrying and mining
terest. Below we have noted some of the arrangements
activities.
we have in place to ensure that Māori are included and
• Runanga are consulted on any governance matters
consulted in the work of Council.
that shape the district including; long term and annu-
al plans, representation reviews, district plan chang-
Policies
es and relevant resource consents.
Central to our working with Māori is a Memorandum
• Joint policy/planning meetings with Council and Ngāi
of Understanding (MoU) between Te Rünanga o Ngāi
Tahu planning staff.
Tahu, Te Ngāi Tüahuriri Rünanga, Te Rünanga o Kaikoura
and the Council. This MoU has been in place since 2004
and is an agreement for us to work together to develop
appropriate processes that will allow Council to fulfil its
statutory responsibilities while recognising Ngāi Tahu as
the tangata whenua.
In addition to the MoU, Council has also developed poli-
cies covering Māori Contribution to Decision Making and
protocols covering the accidental discovery of human
remains. Accidental discovery protocols cover artefacts
as well as koiwi.
Committees
While having policies in place provides a foundation for
Māori decision making, it is in the work of committees
that the intent of policy becomes reality. Māori are
currently represented on the Hurunui – Waiau Zone
Committee and the Hanmer Recreational Track Network
Group.
Working Together
Council work together with Māori and encourage consid-
eration of Māori issues in a number of areas including:
• Involving Māori in the District Plan Review – Invita-
tion to attend all District Plan Councillor workshops
to develop draft provisions
• Working together with Ngai Tahu and the rūnanga to
develop the introductory chapter to the District Plan
that embeds maori values throughout the plan and
promotes greater cross-cultural understanding and
collaborative action.
• Encouraging resource consent applicants to include
cultural impact assessments in their assessment of
environmental effects where relevant.
• Ensuring infrastructure projects consider the values,
issues, objectives and policies of Ngāti Kurī and Ngāi
Tūāhuriri through reference to their respective envi-
ronmental management plans
⌂
10


Annual Report 2013/14
Statement of compliance and responsibility
Compliance
The Council and management of Hurunui District Council
confirms that all the statutory requirements in relation
to the Annual Report, as outlined in the Local Govern-
ment Act 2002 (and Amendment Act 2010), have been
complied with.
Responsibility
The Council and management of Hurunui District Council
accept responsibility for the preparation of the Annual
Financial Statements and the judgements used in them.
The Council and management of Hurunui District Council
accept responsibility for establishing and maintaining a
system of internal controls designed to provide reasona-
ble assurance as to the integrity and reliability of finan-
cial reporting.
In the opinion of the Council and management of
Hurunui District Council, the Annual Report for the year
ended 30 June 2014 fairly reflects the financial position
and operations of Hurunui District Council.
Dated 30 October 2014.
Mayor
Chief Executive Officer
Financial Services Manager
Winton Dalley
Hamish Dobbie
Jason Beck
11
⌂
Hurunui District Council
⌂
12
Annual Report 2013/14
Groups of Council Activities
Introduction .. .. .. .. .. .. .. .. .. .. .. .. .. .. .. .. .. .. .. .. .. .. .. .. .. .. .. .. .. .. .. .. .. .. .. .. .. .. .. .. .. .. .. .. .. .. .. .. .. .. .. .. .. .. .. .. .. .. .. .. .. 14
Overall comparison with the 2013/14 Annual Plan .. .. .. .. .. .. .. .. .. .. .. .. .. .. .. .. .. .. .. .. .. .. .. .. .. .. .. .. .. .. .. 14
Water supply .. .. .. .. .. .. .. .. .. .. .. .. .. .. .. .. .. .. .. .. .. .. .. .. .. .. .. .. .. .. .. .. .. .. .. .. .. .. .. .. .. .. .. .. .. .. .. .. .. .. .. .. .. .. .. .. .. .. .. .. 16
Sewerage .. .. .. .. .. .. .. .. .. .. .. .. .. .. .. .. .. .. .. .. .. .. .. .. .. .. .. .. .. .. .. .. .. .. .. .. .. .. .. .. .. .. .. .. .. .. .. .. .. .. .. .. .. .. .. .. .. .. .. .. .. .. 21
Roads and footpaths .. .. .. .. .. .. .. .. .. .. .. .. .. .. .. .. .. .. .. .. .. .. .. .. .. .. .. .. .. .. .. .. .. .. .. .. .. .. .. .. .. .. .. .. .. .. .. .. .. .. .. .. .. .. 24
Stormwater and drainage .. .. .. .. .. .. .. .. .. .. .. .. .. .. .. .. .. .. .. .. .. .. .. .. .. .. .. .. .. .. .. .. .. .. .. .. .. .. .. .. .. .. .. .. .. .. .. .. .. .. 27
Community services and facilities.. .. .. .. .. .. .. .. .. .. .. .. .. .. .. .. .. .. .. .. .. .. .. .. .. .. .. .. .. .. .. .. .. .. .. .. .. .. .. .. .. .. .. .. 29
Community services .. .. .. .. .. .. .. .. .. .. .. .. .. .. .. .. .. .. .. .. .. .. .. .. .. .. .. .. .. .. .. .. .. .. .. .. .. .. .. .. .. .. .. .. .. .. .. .. .. .. .. .. .. .. .. .. .. .. 31
Property.. .. .. .. .. .. .. .. .. .. .. .. .. .. .. .. .. .. .. .. .. .. .. .. .. .. .. .. .. .. .. .. .. .. .. .. .. .. .. .. .. .. .. .. .. .. .. .. .. .. .. .. .. .. .. .. .. .. .. .. .. .. .. .. .. .. .. .. 34
Reserves .. .. .. .. .. .. .. .. .. .. .. .. .. .. .. .. .. .. .. .. .. .. .. .. .. .. .. .. .. .. .. .. .. .. .. .. .. .. .. .. .. .. .. .. .. .. .. .. .. .. .. .. .. .. .. .. .. .. .. .. .. .. .. .. .. .. .. 36
Environment and safety.. .. .. .. .. .. .. .. .. .. .. .. .. .. .. .. .. .. .. .. .. .. .. .. .. .. .. .. .. .. .. .. .. .. .. .. .. .. .. .. .. .. .. .. .. .. .. .. .. .. .. .. 37
Emergency services .. .. .. .. .. .. .. .. .. .. .. .. .. .. .. .. .. .. .. .. .. .. .. .. .. .. .. .. .. .. .. .. .. .. .. .. .. .. .. .. .. .. .. .. .. .. .. .. .. .. .. .. .. .. .. .. .. .. 40
Resource management .. .. .. .. .. .. .. .. .. .. .. .. .. .. .. .. .. .. .. .. .. .. .. .. .. .. .. .. .. .. .. .. .. .. .. .. .. .. .. .. .. .. .. .. .. .. .. .. .. .. .. .. .. .. .. .. 41
Compliance and regulatory functions .. .. .. .. .. .. .. .. .. .. .. .. .. .. .. .. .. .. .. .. .. .. .. .. .. .. .. .. .. .. .. .. .. .. .. .. .. .. .. .. .. .. .. .. .. 44
Waste minimisation .. .. .. .. .. .. .. .. .. .. .. .. .. .. .. .. .. .. .. .. .. .. .. .. .. .. .. .. .. .. .. .. .. .. .. .. .. .. .. .. .. .. .. .. .. .. .. .. .. .. .. .. .. .. .. .. .. .. .. 47
District promotion .. .. .. .. .. .. .. .. .. .. .. .. .. .. .. .. .. .. .. .. .. .. .. .. .. .. .. .. .. .. .. .. .. .. .. .. .. .. .. .. .. .. .. .. .. .. .. .. .. .. .. .. .. .. .. .. 49
Hanmer Springs Thermal Pools and Spa .. .. .. .. .. .. .. .. .. .. .. .. .. .. .. .. .. .. .. .. .. .. .. .. .. .. .. .. .. .. .. .. .. .. .. .. .. .. 51
Governance.. .. .. .. .. .. .. .. .. .. .. .. .. .. .. .. .. .. .. .. .. .. .. .. .. .. .. .. .. .. .. .. .. .. .. .. .. .. .. .. .. .. .. .. .. .. .. .. .. .. .. .. .. .. .. .. .. .. .. .. .. 54
13
⌂
Hurunui District Council
Introduction
Overal comparison with
the 2013/14 Annual Plan
This section of the Annual Report covers the services (or
Performance:
activities) that Council provides - what we actual y
do.
There was no major variance from the strategic direc-
tions outlined in Year 2 of the 2012/2022 Long Term Plan.
Services are assigned to activity groups as shown on
The Council recorded a net deficit after tax of $1,858,000
the preceding index page. Six services are in groups of
whereas the Council budgeted to record a deficit after
their own only having the one activity; Water supply,
tax for the 2013/2014 year $1,479,000. In addition, the
Sewerage, Stormwater and drainage, District promotion, Council recorded a gain on the value of its assets of
Hanmer Springs Thermal Pools and Spa, and Governance. $4,163,000 and recognised a $121,000 increase in its eq-
Two groups, ‘Community services and facilities’, and ‘En-
uity shares which brought the total comprehensive defi-
vironment and safety’ each have a number of separate
cit recorded for the Council for the year to $2,426,000.
activities.
Revenue:
For each group of activities the following information is
Operating Revenue for the year was $36,854,000 which
provided:
was $5,487,000 greater than predicted in the Annual
• A summary for the group of activities on the overall
Plan. The key variances being:
performance of the group.
• Rates received (excluding rates for metered water
• The community outcomes to which the group of
supply) were $467,000 greater than allowed for in
activities primarily contributes. Each community
the Annual Plan. This was due to there being a great-
outcome is aligned to our services which contribute
er number of properties being rated for than was
towards their achievement. How well we are doing
anticipated when the budgets were prepared.
with each of our service performance measures will
• Subsidies and Grants were higher than budgeted
give a good indication of how we are doing overall in
for as a result of the increased level of New Zea-
achieving the community outcomes. See the end of
land Transport Agency subsidies received from the
the year results alongside the performance measures
significant amount of emergency reinstatement work
in each section of the report.
required after the storm events of July 2013
• Performance measures and results for each of the
• A very successful trading year for the Hanmer
services within the group of activities.
Springs Thermal Pools and Spa resulted in the in-
• An explanation for any significant variations or
come being $166,000 greater than was budgeted for.
deviations from the intended levels of service or ac-
• Other Income was boosted by Forestry Proceeds of
quisitions or replacement of assets as set out in the
$3.8 mil ion, well up on the $330,000 budget for. This
Hurunui Community Long Term Plan - 2012-2022.
was the result of the wind event form October 2013
• Financial summaries for each group of activities
which necessitated the harvesting of the Ashworth
and the individual services within the groups. The
Forestry Block ahead of schedule. The harvest of the
summaries compare the actual and the budgeted
block had meant that the end of year valuation of
revenue, expenditure and capital as projected in the
the Council forest estate has reduced by $1,788,000.
Annual Plan.
Operating Expenditure:
Operating Expenditure was $38,712,000 for the year,
$5,886,000 greater than was predicted in the Annual
Plan, the key variances being:
• Costs associated with forestry were $2,052,000
greater than budget. This represents the unbudgeted
costs associated with harvesting the forestry blocks
ahead of schedule.
• The costs associated with the Emergency Reinstate-
ment work on the Council’s Roading Network were
$1,827,000, which was not specifical y budgeted for.
⌂
14
Annual Report 2013/14
• A fire at the Ashley Forest resulted in an unbudgeted
the year. In addition, total of $278,159 was spent on
$189,000 in suppression costs, which the Council is
various Footpath projects during the year.
pursuing reimbursement for.
• Stormwater - the Council had spent a total of
• The costs associated with the District Plan Review
$11,780 on Stormwater Capital Works compared
were $139,000 greater than budget.
with the budget of $62,000. The key reason was that
• Depreciation was $1,669,000 greater than was budg-
key projects budgeted for Hanmer Springs did not
eted for. This was due to the fact that the deprecia-
proceed, with the amounts being carried forward
tion budgets for Utilities and Roading were prepared
into the 2014/2015 year. In addition, Council rec-
before the completion of end of year valuations.
ognised a further $141,586 for vested stormwater
• Council also recognised the decommissioning of
assets during the year.
$246,000 of Utility Assets during the year.
• Community Services and Facilities – the Council
• These major increases on budget were offset by the
spent $637,352 on Capital Expenditure for Commu-
deferring of $575,000 of operating costs relating to
nity Services and Facilities during the year. This was
the desludging of the Waikari and Hanmer Springs
$290,000 less than was budgeted for. There were a
Sewer Ponds.
number of reserve projects that were continued to
• In addition, after accounting for the increase in the
be deferred 2014/2015 year. The key project under-
value of Council’s derivatives, the external finance
taken was the purchase of the Doctor’s House in
costs were $714,000 lower than was budgeted for.
Hanmer Springs of $500,000.
• Environment and Safety – the Council spent
Capital Expenditure
$1,252,902 on Capital Expenditure for Environment
Total Capital Expenditure for the year was $8.7 mil ion as
and Safety during the year. This was $1,045,000
opposed to the budget of $7.2 mil ion. The key reasons
greater than was budgeted for. The major reason
for this result are:
was that there was $1,154,658 spent on the Am-
• Water Supplies – the Council had spent a total of
berley Transfer Station, the budget for which was
$1,112,393 on Water Capital Works compared with
carried forward from previous years.
the budget of $760,609. The budget for the year was • Hanmer Springs Thermal Pools and Spa – the Council
bolstered by a number of projects that were sched-
spent $813,632 on Capital Expenditure for the Han-
uled in the 2012/2013 being carried forward to the
mer Springs Thermal Pools and Spa during the year.
2013/2014 year. Key projects carried out were: the
This was $156,000 less than was budgeted for. Costs
upgrade of the Rising Main in Amberley; the com-
were incurred on the Discharge Bore and the new
pletion of the Miox instal ations through the District;
Chlorine Gas Shed and planning work was undertak-
and the first stage of the new water main on Marsh-
en on the upgrade of the changing rooms, which was
mans Road on the Ashley Rural Water Supply.
a project that was budgeted for in the 2012/2013
• Sewerage - the Council had spent a total of $583,485
year but final y underway in July 2014.
on Sewer Capital Works compared with the budget
of $64,246 – again, a number of projects were
carried forward from the previous year. Work was
undertaken on the key pipe upgrade works for Am-
berley and the resource consent renewal process for
the Cheviot Scheme. Council also received $222,891
in vested assets during the year from a key subdivi-
sion in Hanmer Springs and work associated with the
supermarket in Amberley.
• Roads and Footpaths – the Council has spent
$2,752,167 on Capital Expenditure for Roading dur-
ing the year. The key projects for the year were Un-
sealed Road Metal ing, Sealed Road Resurfacing and
Area Wide Pavement Rehabilitation. Council also
received a total of $549,488 in vested assets during
15
⌂
Hurunui District Council
Water supply
Financial Commentary – 2013/14 Actual
compared with 2012/13 Actual
Water Supply covers one activity:
This year’s operating deficit of $663,268 was $566,692
1. Water Supply (township supply and rural water
lower than the operating surplus recorded for the
schemes
2012/2013 year of $96,576.
• Rates – as flagged in the 2012/2013 Annual Plan,
Our aim
rates have increased for all supplies as well as the
To provide a sustainable supply of water that meets the
second stage of the increase in rates for the instal a-
needs of present and future domestic and agricultural/
tion of Miox Plants throughout the District.
horticultural consumers and complies with the New Zea-
• Other Income – there was a significant amount of
land Drinking Water Standards.
development in the 2012/2013 year and the level
of connection fees and development contributions
Achievement of levels of service
(particularly for Ashley Rural and Amberley Town-
This activity has performance measures to describe the
ship). In addition, an insurance claim of $107,049 re-
service targets we were aiming for. These are set out in
lating to the Kaiwara Intake washout was recognised
the following pages with a commentary on how we had
in the 2012/2013 year.
performed at the end of the year (end of year results).
• Vested Asset Income – The level of development
in the 2012/2013 year had resulted in $386,613
Financial Commentary – 2013/14 Actual
of assets being vested in Council. The subdivision
compared with 2013/14 Budget
development has been considerably lighter in the
Overal , an operating deficit of $663,268 was recorded
2013/2014 year and as a result, the amount of vested
against a budgeted operating deficit of $276,214. The
assets has been lower.
key variances from budget have been:
• Other Direct Expenditure – Electricity costs on
• Rates – this is higher than budget due to the in-
most supplies were higher than was incurred in the
creased level of connections to the supplies than was
2012/2013 year.
anticipated when the budgets for the Annual Plan
• Loss on Disposal of Assets – The level of assets
were prepared.
disposed during the year was $198,272 lower than in
• Other Income – Connection fees for the Ashley
the 2012/2013 year.
Rural, Cheviot and Hurunui Rural Water supplies are
ahead of budget for the year due to the greater level Significant Capital Expenditure
of development and requirement for water.
Overal , $1,112,393 was recognised as Capital Expendi-
• Vested Asset Income – The amount recognised as
ture for the 2013/2014. This was $351,784 greater than
vested assets for the year was $95,798, which was
was budgeted for.
up on the budget of $33,996. The vested assets were • District Wide Water – The amount of assets vested in
associated with the subdivision on Rippingale Road
Council for the year was $95,798. This was due to a
in Hanmer Springs.
key subdivision in Hanmer Springs.
• Development Contributions – A total of $154,355
• Interim Treatment for Water – during the year, the
was received from development contributions as op-
Council finalised the instal ations of the Miox plants
posed to a budget of $85,828. The key developments
on Water Supplies that either had no treatment did
have occurred in the Ashley Rural Water area.
not have a deep well source. The amount recognised
• Depreciation – The cost of depreciation was
for the year was $42,951, to which there was no
$1,411,820. This was $444,495 higher than the
budget allowed for in the Annual Plan, however, the
budget due to the budget being set prior to the last
funding was carried over from the 2012/2013 year.
revaluation process undertaken for utilities.
• Amberley Water – $282,202 was recognised for Capi-
• Loss on Disposal of Assets – Council had identified a
tal for the year, which was $226,892 greater than the
series of lines and points, particularly on the Ashley
Annual Plan budget. The key item of expenditure was
Rural Water Supply area that have since been re-
the upgrade of the Rising Main, the funding of which
placed and now no longer provide any service for the
was carried over from the 2012/2013 year.
relevant water supplies. The total of these amounts
• Ashley Rural Water - $392,682 was recognised for
to $189,713.
Capital for the year, which was $210,206 great-
er than the Annual Plan budget. The key items of
expenditure were the Generator, the new pump
⌂
16
Annual Report 2013/14
shed on Station Road and the first stage of the new
that held funds (rather than being in debt) receiving
watermain on Marshmans Road
an amount of internal interest total ing $11,418.
• Waiau Township Water – Further work was car-
ried out on the project treatment project that was
Community outcomes to which this group of
partial y funded with a subsidy from the Ministry
activities primarily contribute
of Health. The total cost incurred in 2013/2014 was
A desirable and safe place to live:
$70,128 which is an overspend of the $520 budget.
• We have attractive well designed townships
• Hurunui Rural Water – a range of pipe replace-
• Communities have access to adequate health and
ment work was carried out during the year total ing
emergency services and systems and resources are
$86,815 which was $33,185 greater than was budg-
available to meet civil defence emergencies
eted for.
• Risks to public health are identified and appropriate-
ly managed
Internal Borrowing
• At the start of the financial year, the level of internal
A place with essential infrastructure:
borrowing for Water Supplies was $3,697,985.
• We have a strong emphasis on service delivery
• Operating surpluses recorded by the individual Wa-
across all infrastructure including roading, water (for
ter Supplies total ing $856,892 were used to offset
drinking and development), waste water, stormwa-
the borrowings, with a further $1,016,595 of Capital
ter and solid waste
Expenditure (excluding Vested Assets) incurred re-
sulting in the balance of the internal borrowings for
Water Supplies sitting at $3,857,688 as at the end of
the year – an overall increase of $159,703.
• The amount of Internal Interest charged to the Wa-
ter Supplies for the year was $279,440, with those
Goal
How we will achieve our goals
Performance measures
Supply water to meet consumer needs
Provide a continuous ‘on demand’ sup-
Major faults to
ply of potable water to urban areas and water supply pipelines greater than
a ‘restricted’ supply of water to rural
250mm diameter that affect customers
areas
are repaired within 24 hours
End of year result - Met
No major faults on pipelines greater than 250mm diameter (critical pipeline supply) were reported for the 2013/14 financial
year. This figure is extracted from the tracked Customer Services Request system in HDC’s data base.
It is worthy of note that this is the same figure that we had in the 2012/2013 financial year
Goal
How we will achieve our goals
Performance measures
Supply water to meet consumer needs
Undertake a resident satisfaction sur-
Resident satisfaction will continue to
vey.
improve over the coming years.
End of year result - Not met
In our annual resident satisfaction survey, we ask a number of questions to gage how our consumers would rate our water
supply. Of those on a township supply, we ask how satisfied they are with the ‘appearance and taste’ and ‘pressure and flow’.
For those on rural schemes, we ask is they are satisfied with the ‘amount of water available’.
Unfortunately, our results for the appearance and taste question were lower than in previous years at 56%, down from 71%
in 2012. One of the biggest areas of dissatisfaction has come from Amberley Township residents with only 37% satisfied. This
is mostly due to the significant increase in iron content coming from the deep bore water supply. Treatment options are being
discussed, but due to the high cost of the various options, no decision has yet been made to treat this nuisance value. While
100% of Glenmark residents were satisfied in 2012, only 38% reported being satisfied in 2013/14. To meet the new drinking
water requirements, the water has been treated which has meant a change in taste from the original untreated water that
was being previously supplied.
Satisfaction among residents with the pressure and flow of the town water supply has remained relatively consistent since
2007 with a slight decrease overall this year to 79% from 81% in 2012. A substantial improvement was shown in Glenmark
from 50% in 2012 to 88% in 2014.
Satisfaction among residents for the amount of water available on rural water schemes has remained reasonably constant
over the years with 79% in 2013/14. Glenmark’s satisfaction increased markedly from 68% in 2012 to 85% in 2014. Other ar-
eas showing an improvement were Amberley - 77% in 2012 to 82% in 2014, Amuri - 78% in 2012 to 81% in 2014 and Hurunui
- 74% in 2012 to 76% in 2014.
Information source is the 2014 resident satisfaction survey.
17
⌂
Hurunui District Council
Goal
How we will achieve our goals
Performance measures
Supply water to meet consumer needs
Water tested for quality.
The safety standard for potable water
improves each year.
End of year result - Not met
In 2013/2014, we did 1,358 water safety tests in total on our 13 water schemes. The water tests highlight whether or not
there is the presence of e-coli in the drinking water that would make it unsafe to drink. During the year, we found e-coli levels
greater than acceptable (0 per 100ml of water) as follows:
• Amberley Township – 3 transgressions
• Waiau Township – 7 transgressions
• Cheviot and Rural – 8 transgressions
• Hurunui Rural – 34 transgressions
This resulted in Temporary Boil Water Notices being issued to the schemes affected. Despite installing new treatment plants
to improve the quality of the water, we have experienced several failures of this equipment. Most of the problems were with
the Hurunui Rural Water Scheme, where we have had recurring problems with the new plant and the old chlorinator. Most of
the issues have been resolved but there are still some problems with the new mixed oxidant (MIOX) treatment plants.
In 2012/2013, we had 3.7% transgressions and sought to reduce this in 2013/2014. In 2013/2014 we had 52 failures out of
the 1,358 tests done (3.8% transgressions) - a similar result to the previous year. We will continue to focus on eliminate these
problems so that transgressions for e-coli become a thing of the past.
Water testing results are logged and tracked in the Water Information New Zealand (WINZ) database. Further information on
this database can be viewed at Council offices on request.
Source http://www.drinkingwater.esr.cri.nz/default.asp.
Satisfaction with the Town Water Supply:
Appearance and Taste
Satisfaction with the appearance and taste of the town water supply has decreased dramatical y
since 2012 from 71% to just over half (56%) this year.
Don't know/NA
Not at al satisfied
Not very satisfied
%
%
Mean score (4=
Quite satisfied
Very satisfied
dissatisfied
satisfied
very satisfied, 1=
not at all satisfied)
2014 1%
28%
16%
29%
27%
43
56
2.55
2012
14%
14%
40%
31%
28
71
2.89
2011
7%
14%
34%
45%
21
79
3.16
2010
7%
16%
45%
32%
23
77
3.02
2009 1% 12%
24%
35%
27%
36
62
2.80
2008
12%
22%
42%
25%
34
67
2.78
2007 3% 2% 7%
46%
41%
34
64
2.71
Base: Those on town water supply: 2007: 192, 2008: 204, 2009: 234, 2010: 215, 2011: 229, 2012: 239, 2014:245
1
⌂
18
Annual Report 2013/14
Satisfaction with the Town Water Supply:
Pressure and Flow
Whilst satisfaction with appearance and taste has decreased, satisfaction among residents with the
pressure and flow of the town water supply has remained relatively consistent since 2007. This year
79% of residents reported being satisfied.
Don't know/NA
Not at al satisfied
Not very satisfied
%
%
Mean score (4=
dissatisfied
satisfied
very satisfied, 1=
Quite satisfied
Very satisfied
not at all satisfied)
2014 1% 9%
10%
41%
38%
19
79
3.10
2012 1% 6% 13%
44%
37%
19
81
3.13
2011 1% 6% 7%
35%
51%
13
86
3.34
2010 4% 13%
43%
41%
17
84
3.03
2009 1% 7%
12%
44%
35%
19
79
3.09
2008 1% 4% 13%
47%
35%
17
82
3.13
2007 1% 8% 11%
50%
30%
19
80
3.03
Base: Those on town water supply: 2007: 192, 2008: 204, 2009: 234, 2010: 215, 2011: 229, 2012: 239, 2014:245
2
Satisfaction with the Amount of Water
Available on Rural Water Scheme
Satisfaction among residents on the rural water scheme regarding the amount of water available to
them has remained relatively consistent, with 79% of residents agreeing they are satisfied this year.
Don't know/NA
Not at al satisfied
Not very satisfied
%
%
Mean score (4=
Quite satisfied
Very satisfied
dissatisfied
satisfied
very satisfied, 1=
not at all satisfied)
2014 4% 5% 12%
51%
27%
17
79
3.08
2012 3% 5% 14%
44%
34%
19
78
3.10
2011 3% 3% 13%
42%
39%
16
81
3.20
2010 5%
17%
49%
29%
21
78
3.03
2009 1% 12%
23%
45%
19%
35
64
2.71
2008 3% 7%
13%
48%
29%
20
77
3.01
2007 3% 7%
21%
51%
18%
28
69
2.83
Base: Those on rural water supply: 2007: 247, 2008: 233, 2009: 227, 2010: 221, 2011: 213, 2012: 214, 2014: 209
3
19
⌂
Hurunui District Council
Group Activity - Water Supplies
2013/2014
2013/2014
2012/2013
Actual
Budget
Actual
Operating Statement
OPERATING REVENUE
Rates
4,612,647
4,429,691
4,276,854
Other Income
190,987
75,285
540,934
Internal Interest Received
11,418
8,186
13,258
Vested Assets
95,798
33,996
386,613
Development Contributions
154,355
85,828
383,707
Total Operating Revenue
5,065,206
4,632,985
5,601,366
OPERATING EXPENDITURE
Employment Costs
687,536
672,321
622,074
Other Direct Expenditure
2,222,968
1,981,133
1,938,294
Internal Interest Paid
279,440
350,824
268,584
Council Overheads
936,996
937,597
909,336
Depreciation
1,411,820
967,325
1,378,517
Loss on Disposal of Assets
189,713
0
387,985
Total Operating Expenditure
5,728,474
4,909,200
5,504,790
Operating Surplus (Deficit)
($663,268)
($276,214)
$96,576
CAPITAL EXPENDITURE
District Wide Water
95,798
33,996
386,613
Interim Treatment for Water
42,951
0
474,218
Amberley
282,202
55,310
161,064
Leithfield Beach
22,659
0
59,829
Ashley Rural
392,682
182,476
225,937
Culverden
14,960
35,472
15,694
Waiau Town
70,128
520
245,255
Amuri Plains
24,838
23,598
1,643
Balmoral
2,325
8,078
9,695
Waiau Rural
19,739
29,621
16,037
Cheviot
6,456
215,558
273,633
Waipara
37,824
15,000
11,170
Hanmer Springs
12,846
40,980
37,641
Hawarden - Waikari
167
0
18,272
Hurunui Rural
86,815
120,000
137,880
Total Capital Expenditure
$1,112,393
$760,609
$2,074,582
⌂
20
Annual Report 2013/14
Sewerage
Sewerage covers one activity:
$222,891. This was due to the higher level of new
1. Sewerage
development that occurred in the 2012/2013 year.
• Development Contributions – Again, due to the
Our aim
development in the Amberley Township in the
To provide proficient, cost effective, sewage disposal
2012/2013 year, the level of Development Contri-
schemes relevant to the needs of the community.
butions was $303,614 last year compared to only
$84,900 received in 2013/2014.
Achievement of levels of service
• Other Direct Expenditure – the level of operating
This activity has performance measures to describe the
expenditure in Hanmer Springs was higher than for
service targets we were aiming for. These are set out in
the 2012/2013 year due to the cost of electricity re-
the following pages with a commentary on how we had
lating to the full function of the Sewer Pond Aerators
performed at the end of the year (end of year results).
and also the level of consultants costs incurred in
preparation for the resource consent renewal for the
Financial Commentary – 2013/14 Actual
ponds which is due in early 2015.
compared with 2013/14 Budget
Overal , an operating deficit of $432,277 was recorded
Significant Capital Expenditure
against a budgeted operating deficit of $1,091,559. The
Overal , $583,485 was recognised as Capital Expenditure
key variances from budget have been:
for the 2013/2014. This was $519,239 greater than was
• Rates – this is higher than budget due to the in-
budgeted for.
creased level of connections to the schemes than
• District Wide Sewer – The amount of assets vested
was anticipated when the budgets for the Annual
in Council for the year was $222,891. This was due to
Plan were prepared.
a key subdivision in Hanmer Springs and the work in
• Vested Asset Income – The level of assets vested
Amberley in conjunction with the supermarket.
in Council for the year was $222,891, whereas the
• Amberley Sewer – $266,584 was incurred for the
budget was only $33,996. The key assets vested
year, whereas the Annual Plan budget was only
were in conjunction with the Rippingale Road subdi-
$13,280. Key Pipe Upgrade work was carried out
vision in Hanmer Springs and the supermarket site in
during the year, which was projects that were car-
Amberley.
ried forward from the 2012/2013 year.
• Development Contributions – Due to the develop-
• Cheviot Sewer – Work was required to be under-
ment in Hanmer Springs, the level of Development
taken to meet conditions of the resource consent
Contributions has exceeded budget by $46,180.
renewal. A total of $71,217 was recognised in the
• Other Direct Expenditure – In the budget for the
2013/2014 year from a budget of only $2,000; how-
Annual Plan, a $475,000 was allowed for the de-
ever the funding for this work was carried over from
sludging of the Hanmer Springs Sewer Ponds and
the prior year.
a further $100,000 for the Waikari Sewer Ponds.
Neither of these key projects was undertaken during Internal Borrowing
the year. This is the key reason for the underspend of • At the start of the financial year, the level of internal
$475,709 from the budget.
borrowing for Sewerage was $4,724,976.
• Overall operating surpluses of $56,595 were record-
Financial Commentary – 2013/14 Actual
ed and further Capital Expenditure of $360,594 (ex-
compared with 2012/13 Actual
cluding vested assets) was incurred during the year.
This year’s operating deficit of $432,277 was $562,533
This has resulted in the balance of the internal bor-
lower than the operating surplus recorded for the
rowings for Sewerage sitting at $5,028,975 as at the
2012/2013 year of $130,256.
end of the year – an overall increase of $303,999.
• Rates – as flagged in the 2012/2022 Long Term
• The amount of Internal Interest charged to the Wa-
Plan, rates have increased by $87,345 to service an
ter Supplies for the year was $354,302, with those
increased level of internal debt.
that held funds (rather than being in debt) receiving
• Vested Asset Income – the level of assets vested in
an amount of internal interest total ing $7,417.
the Council for the 2012/2013 year was $483,255,
whilst for the 2013/2014 year; the amount is only
21
⌂
Hurunui District Council
Community outcomes to which this group of • We protect our environment while preserving peo-
activities primarily contribute
ple’s property rights
A desirable and safe place to live
• We minimise solid waste to the ful est extent, and
• We have attractive well designed townships
manage the rest in a sustainable way
• Communities have access to adequate health and
emergency services and systems and resources are
A place with essential infrastructure
available to meet civil defence emergencies
• We have a strong emphasis on service delivery
• Risks to public health are identified and appropriate-
across all infrastructure including roading, water (for
ly managed
drinking and development), waste water, stormwater
and solid waste
A place that demonstrates environmental
responsibility
Goal
How we will achieve our goals
Performance measures
Protect public health through ensuring
Maintain sewage disposal and treat-
All major and significant non-compli-
good sanitary standards.
ment facilities in most urban areas.
ances for our sewage disposal resource
consents reduce until we have 0% non
compliance. (Target for this year = 1%).
End of year result - Met
13 resource consents related to sewerage in 2013/14, with a total of 204 conditions. Of these 204 conditions, Environment
Canterbury monitored 184 of them. Two of the 184 conditions were significant non-compliances (1%). Both of these related
to sampling requirements of treated discharge from the treatment ponds into an open drain. The 13 May 2014 monitoring
report from Environment Canterbury reported the Cheviot sewerage scheme as being significantly non-compliant due to
repeated missed or late schedule samples. Although this in itself is minor non-compliance, they were elevated to significant
non-compliances due to the recurrence of the non-compliance. A new sampling programme and roster has since been imple-
mented to ensure schedule samples are now done on time as per the resource consent requirement.
Source: Environment Canterbury compliance monitoring reports, resource consent numbers 12, CRC091326 & 12,
CRC091327.
Goal
How we will achieve our goals
Performance measures
Protect public health through ensuring
Maintain sewage disposal and treat-
All sewer breaks are repaired within 12
good sanitary standards.
ment facilities in most urban areas.
hours of notification.
End of year result - Met
There were no sewerage breaks reported in 2013-14 (compared to two in the previous year). We use CCTV to monitor the
condition of our underground wastewater pipe assets for issues such as deterioration and blockage build-up. This helps us to
develop improvement programmes as required and to mitigate future sewer breaks.
Source: Council’s Customer Service Requests.
⌂
22
Annual Report 2013/14
Group Activity - Sewerage
2013/2014
2013/2014
2012/2013
Actual
Budget
Actual
Operating Statement
OPERATING REVENUE
Rates
720,467
686,060
633,122
Other Income
690
330
4,803
Internal Interest Received
7,417
1,776
7,337
Vested Assets
222,891
33,996
483,255
Development Contributions
84,900
38,792
303,614
Total Operating Revenue
1,036,364
760,954
1,432,130
OPERATING EXPENDITURE
Employment Costs
27,093
55,379
47,719
Other Direct Expenditure
447,604
923,313
344,165
Internal Interest Paid
354,302
361,210
324,632
Council Overheads
139,272
139,284
134,160
Depreciation
447,351
373,326
437,296
Loss on Disposal of Assets
53,019
0
13,901
Total Operating Expenditure
1,468,641
1,852,512
1,301,874
Operating Surplus (Deficit)
($432,277)
($1,091,559)
$130,256
CAPITAL EXPENDITURE
District Wide Sewer
222,891
33,996
483,255
Amberley
266,584
13,280
20,986
Culverden
0
0
0
Cheviot
71,217
2,000
10,439
Greta Valley
8,033
2,078
2,880
Motunau Beach
10,928
0
15,585
Waipara
0
0
0
Hanmer Springs
3,211
10,392
243,905
Hawarden
621
2,500
0
Waikari
0
0
1,320
Total Capital Expenditure
$583,485
$64,246
$778,370
23
⌂
Hurunui District Council
Roads and footpaths
• Vested Assets Income – The level of assets vested in
Council in 2012/2013 was considerably higher than
Roads and footpaths covers one activity:
2013/2014 due to the higher level of subdivision
1. Roads and footpaths
work that was carried out.
• Operating Expenditure – this has increased by
Our aim
$1,973,071 due to the $1,826,710 of emergency rein-
To provide a transport network that is safe and accessi-
statement work incurred during the year.
ble for all people throughout the District.
• Depreciation – As a result of the revaluation process
undertaken by the Council at the end of June 2013
Achievement of levels of service
that resulted in a higher value of the Council’s Road-
This activity has performance measures to describe the
ing assets, the level of depreciation to be recognised
service targets we were aiming for. These are set out in
in the 2013/2014 year was significantly higher than in
the following pages with a commentary on how we had
the previous year.
performed at the end of the year (end of year results).
Significant Capital Expenditure
Financial Commentary – 2013/14 Actual
Overal , $3,579,814 was recognised as Capital Expend-
compared with 2013/14 Budget
iture for the 2013/2014. This was $233,057 lower than
Overal , an operating surplus of $422,468 was recorded
was budgeted for.
against a budgeted operating surplus of $633,785. The
• Subsidised and Special Purpose Roading – The Coun-
key variances from budget have been:
cil spent a total of $2.75 mil ion on Capital Expend-
• NZTA Subsidies – the total subsidies recognised in
iture for Roading during the year. These projects
2013/2014 was $5,058,788, which was $1,670,890
are partial y funded by the New Zealand Transport
greater than was budgeted for. The increase is the
Agency. The key projects for the year were Unsealed
increased operating expenditure that was caused by
Road Metal ing, Sealed Road Resurfacing and Area
the storm events of July that resulted in a $1,826,710
Wide Pavement Rehabilitation.
of emergency reinstatement work.
• In addition, a total of $549,488 of Roading Assets
• Vested Assets Income – The total value of assets
were vested in Council during the year, this includes
vested in Council during the year was $549,488,
$56,871 in Pavement Surfacing, $161,054 in Foot-
which was $390,842 greater than was budgeted for.
paths, $91,843 in Swales, Kerb and Channel ing,
The key series of roading assets identified during the
$94,740 for Street Lights and $126,500 relating to
year was for Rippingale Road in Hanmer Springs and
stock underpasses.
Tennyson Close also in Hanmer Springs.
• Footpath Construction – A total of $278,158 was
• Depreciation – The amount of depreciation charged
spent on Footpath works during the year. This was
has increased by $889,572 on the level budgeted
$59,383 greater than the $218,775 budget, however,
for. This was due to the revaluation of the Coun-
work in the Amberley, Amuri, Cheviot and Hanmer
cil’s Roading Assets that was carried out for the
Springs has been deferred until the 2014/2015 year.
2012/2013 year.
The Council spent $150,000 on work that will eventu-
al y link key subdivisions in Amberley.
Financial Commentary – 2013/14 Actual
compared with 2012/13 Actual
Internal Borrowing
This year’s operating surplus of $422,468 was $543,678
• At the start of the financial year, the level of internal
lower than the operating surplus recorded for the
borrowing for Roading was $20,768, which related to
2012/2013 year of $966,146.
Stage 1 of Woodbank Road Sealing project.
• Rates – there has been an increase of $140,621 in
• Adjustment was made to the balance to bring it to a
rates. This was flagged in the Annual Plan as being
balance of $24,033 at year end.
required to continue to meet the required levels of
• The interest charged for the year was $3,298.
service despite the lower level of funding available
Community outcomes to which this group of
for the three year period of 2012 to 2015.
• NZTA Subsidies – there has been an increased level
activities primarily contribute
of subsidies received due to the increased cost of
A desirable and safe place to live
emergency reinstatement to which NZTA is contrib-
• We have attractive well designed townships
uting a higher subsidy rate than the standard rate
• Communities have access to adequate health and
received for routine work.
emergency services and systems and resources are
available to meet civil defence emergencies
⌂
24
Annual Report 2013/14
• Risks to public health are identified and appropriate-
drinking and development), waste water, stormwa-
ly managed
ter and solid waste.
A place with essential infrastructure
• We have a strong emphasis on service delivery
across all infrastructure including roading, water (for
Goal
How we will achieve our goals
Performance measures
Maintain the District’s roads to a stand- Contract out road maintenance and
Hurunui’s sealed roads will compare
ard appropriate to their use.
monitor performance accordingly.
favourably with the national rural road
condition rating index.
End of year result - Mostly met
Condition ratings of sealed roads are assessed in June each year (for the previous year). The corresponding report is released
in December of that year which means that our results for 2013/14 will be available in December 2014.
The December 2013 Sealed Roads Condition Rating Index report assessed the condition index (CI) for Hurunui’s sealed roads
in 2012/2013 at 97%, compared to the national average for rural roads of 98.3%. The Hurunui’s sealed road network has
stayed consistent at 97% over the last three years for condition index ratings, whilst the national average has progressive-
ly improved from 2010/2011 : 98% to 2011/2012 : 98.2%, and subsequently 2012/2013 : 98.3%. This shows that Hurunui’s
sealed roads are marginally lower and have remained lower than those nationally on rural sealed roads for Condition Index.
Factors included in the CI rating are seal cracking, scabbing, raveling, potholes, pothole patches and seal flushing. Although
the result is slightly lower than the national average overall, we have done better than the national average for the major
measures below.
Source: http://www.nzta.govt.nz/resources/road-net. (Click on Planning and Investment Outcomes, then Transport data,
then Transport networks, then Condition).
Goal
How we will achieve our goals
Performance measures
Maintain the District’s roads to a stand- Contract out road maintenance and
Hurunui’s sealed roads will compare
ard appropriate to their use.
monitor performance accordingly.
favourably with the national rural road
smoothness travel exposure rating.
End of year result - Met
The 2012/2013 assessment for smooth travel exposure for Hurunui’s sealed roads is 98%, 1% better than last year’s result.
The national rural road average is 95%, slightly lower than last year’s assessment at 96%. In this case, a higher value is better.
This means that Hurunui is doing better than the national average for rural sealed roads. Smooth travel exposure is an index
which takes into account both the roughness and average daily traffic measured each year.
Source: http://www.nzta.govt.nz/resources/road-net. (Click on Planning and Investment Outcomes, then Transport data,
then Transport networks, then Smoothness).
Goal
How we will achieve our goals
Performance measures
Maintain the District’s roads to a stand- Contract out road maintenance and
Hurunui’s sealed roads will compare
ard appropriate to their use.
monitor performance accordingly.
favourably with the national rural road
‘roughness’ rating.
End of year result - Met
The 2012/13 assessment percentage for the road network’s ‘roughness’ in the Hurunui is 3.7% (with 2011/12 : 4.2%; and
2010/11 : 4.2%). The national average for rural roads is 9.53% (2011/12 : 9.4%; 2010/11 : 9.1%). In this case, a lower value
is better and this means that Hurunui has substantially fewer ‘rough’ roads than that the national network for rural sealed
roads.
Source: http://www.nzta.govt.nz/resources/road-net. (Click on Planning and Investment Outcomes, then Transport data,
then Transport networks, then Roughness).
Goal
How we will achieve our goals
Performance measures
Maintain the District’s roads to a stand- Contract out road maintenance and
Hurunui’s sealed roads will compare
ard appropriate to their use.
monitor performance accordingly.
favourably with the national rural road
pavement integrity rating index.
End of year result - Met
The strength of sealed roads is measured via a ‘pavement integrity index’ (PII). Our sealed road network for 2012/2013
measured at 96.4%, 0.2% less than the previous year’s 96.6% rating. The national average in 2012/2013 for rural roads is 95%,
the same as last year’s assessment. A higher value is better; therefore our roads are rated better than the national rural road
average for strength.
Source: http://www.nzta.govt.nz/resources/road-net. (Click on Planning and Investment Outcomes, then Transport data,
then Transport networks, then Pavement Integrity).
25
⌂
Hurunui District Council
Goal
How we will achieve our goals
Performance measures
Maintain the District’s roads to a stand- Undertake a residents satisfaction
Residents consider the overall standard
ard appropriate to their use.
survey.
of road maintenance to be satisfactory
(more than 70%).
End of year result - Met
The 2014 resident satisfaction survey showed satisfaction levels for the overall standard of road maintenance in the Hurunui
to be 70%. This is reasonably consistent with the results of our satisfaction survey over the years with 2011 being the only
year to rate higher at 73% satisfaction. (Previous satisfaction results for the same measure are 2007: 66%; 2008: 66%; 2009:
67%; 2010: 70%; 2011: 73%; 2012: 69%; 2013: 65%; 2014:70%)
Source: 2014 Resident Satisfaction Survey.
Goal
How we will achieve our goals
Performance measures
Ensure that all bridges are safe and well Contract out bridge maintenance and
Replace priority bridge structures
maintained.
monitor performance accordingly.
according to the bridge replacement
programme.
End of year result - Met
The second step of a 3-year bridging programme covering the years from 2013 to 2015 went as planned during the year. The
bridge replacement contract was tendered out and successfully won by Hunter Civil and they commenced works in April
2013/2014. This contract will continue through to June 2015. 13 bridges will have remedial works done in this time but no
bridges will be completed by June 2014. The bridging replacement programme will result in some old and obsolete timber
decks being replaced with concrete decks to improve road user safety and bridge weight ratings. Routine maintenance is
on-going within the road maintenance contract with Downers, now into their third year of a 3+1+1 approved contract.
Every three years, general bridge inspection is carried out by Opus International and they provide a 3-year forward works
programme identifying high, medium and low priority maintenance work which is then integrated into the Downers works
programme. Opus’s next general inspection is due to be carried out late in 2014 and the priority list will feed into our budget
plan for 2015/18.
Group Activity - Roads and Footpaths
2013/2014
2013/2014
2012/2013
Actual
Budget
Actual
Operating Statement
OPERATING REVENUE
Rates
3,640,759
3,644,744
3,500,138
NZTA Subsidies
5,058,788
3,387,898
3,318,994
Other Income
135,471
139,224
122,830
Internal Interest Received
0
0
0
Vested Assets
549,488
158,646
852,084
Development Contributions
0
0
0
Total Operating Revenue
9,384,505
7,330,512
7,794,046
OPERATING EXPENDITURE
Employment Costs
541
0
579
Other Direct Expenditure
5,190,196
2,958,412
3,125,406
Internal Interest Paid
3,298
1,953
1,707
Council Overheads
541,188
554,183
597,620
Depreciation
4,071,751
3,182,179
3,102,589
Total Operating Expenditure
9,806,974
6,696,727
6,827,900
Operating Surplus (Deficit)
($422,468)
$633,785
$966,146
CAPITAL EXPENDITURE
Subsidised Roading
3,018,851
3,546,646
3,897,929
Special Purpose Roading
282,804
47,450
19,129
Unsubsidised Roading
0
0
0
Road Safety Programme
0
0
0
Amberley Ward Roadside Construction
12,574
28,288
39,881
Amberley Ward Special Projects
150,000
0
0
Amuri Ward Roadside Construction
0
45,724
162,523
Cheviot Ward Roadside Construction
0
35,196
72,910
Glenmark Ward Roadside Construction
0
0
0
Hanmer Springs Ward Roadside Construction
89,585
92,940
185,526
Hurunui Ward Roadside Construction
26,000
16,627
0
Total Capital Expenditure
$3,579,814
$3,812,871
$4,377,898
⌂
26
Annual Report 2013/14
Stormwater and drainage
Stormwater and drainage covers one activity:
• Other Direct Expenditure – In 2012/2013, there was
1. Stormwater and drainage
a significant amount of consultants costs incurred in
relation to the development of the global stormwa-
Our aim
ter consent for Amberley. While that process contin-
To prevent or minimise adverse effects of surface flood-
ued in the 2013/2014, the costs incurred were not at
ing and stormwater discharge.
the same level.
Achievement of levels of service
Significant Capital Expenditure
This activity has performance measures to describe the
Overal , $152,366 was recognised as Capital Expenditure
service targets we were aiming for. These are set out in
for the 2013/2014. This was $90,014 greater than was
the following pages with a commentary on how we had
budgeted for.
performed at the end of the year (end of year results).
• Vested Assets – The assessment of assets vested in
Council for the 2013/2014 year was $141,586, which
Financial Commentary – 2013/14 Actual
related to the subdivision in Hanmer Springs.
compared with 2013/14 Budget
Overal , an operating surplus of $268,038 was recorded
Internal Borrowing
against a budgeted operating surplus of $35,825. The key • At the start of the financial year, the level of internal
variances from budget have been:
borrowing for Stormwater was $1,263,365.
• Vested Assets Income – A total of $141,586 was
• Overall operating surpluses of $136,210 and further
recognised as vested assets for the year. The Council
Capital Expenditure of $10,780 (excluding Vested
had not previously budgeted to receive vested assets
Assets) incurred has resulted resulting in the balance
for Stormwater. These assets relate to the new sub-
of the internal borrowings for Stormwater sitting
division in Hanmer Springs.
at $1,137,935 as at the end of the year – an overall
• Employment Costs – the budget for the 2013/2014
decrease in borrowing of $125,430.
year allowed for the employment of a Stormwater
• The amount of Internal Interest charged to Storm-
Engineer. That position commenced in late January
water for the year was $100,842, with those that
2014, so the full budget of $103,130 was not spent.
held funds (rather than being in debt) receiving an
amount of internal interest total ing $4,734.
Financial Commentary – 2013/14 Actual
compared with 2012/13 Actual
Community outcomes to which this group of
This year’s operating surplus of $268,038 was $341,906
activities primarily contribute
lower than the operating surplus recorded for the
A desirable and safe place to live
2011/2012 year of $609,944.
• We have attractive well designed townships
• Rates – for the 2013/2014 year, additional rates were • Communities have access to adequate health and
set in the Annual Plan to fund the employment of a
emergency services and systems and resources are
stormwater engineer.
available to meet civil defence emergencies
• Vested Assets Income – The level of assets vested in • Risks to public health are identified and appropriate-
Council in 2012/2013 was considerably higher than
ly managed
2013/2014 due to the higher level of subdivision
work that was carried out.
A place with essential infrastructure
• Development Contributions – there was a signif-
• We have a strong emphasis on service delivery
icant amount of development in Amberley in the
across all infrastructure including roading, water (for
2012/2013 year resulting $90,550 of Development
drinking and development), waste water, stormwater
Contributions being received. The level of develop-
and solid waste
ment has not been as great in the 2013/2014 year
and as a result, the level of contribution received
was only $31,519.
27
⌂
Hurunui District Council
Goal
How we will achieve our goals
Performance measures
Minimise the risk of flooding.
Maintain all drainage systems in accord- All major and significant non-com-
ance with resource consent conditions.
pliance for our stormwater resource
consents reduce until we have 0%
non-compliance. (Target for this year =
1%).
End of year result - Unknown
We have 44 resource consents with 529 conditions relating to stormwater. We are unable to report on the end of year
compliance as no monitoring report has been received from Environment Canterbury relating to these conditions. We have
carried out the actions required of us to comply with the conditions of the approved resource consents. The lack of monitor-
ing is not a result of non attention, but simply that stormwater is monitored very irregularly. We can only conclude that the
have had no instances of non-compliance notices issued or registered with HDC.
Source: Council records of stormwater consents.
Goal
How we will achieve our goals
Performance measures
Minimise the risk of flooding.
Employ an engineer to manage the
District wide stormwater catchment
stormwater and drainage portfolio.
and management plans have been put
in place.
End of year result - Not met
Stormwater management is an area that we are focusing on to mitigate the effects of flooding, improve stormwater asset
capability and to meet the residents’ expectations. In January 2014, we engaged an engineer to specifically focus on storm-
water and to develop stormwater plans for the Hurunui district. The appointment was further into the year than was hoped
for due to a nationwide demand for engineers, and a first for the Council to have a dedicated employee for stormwater.
Catchment plans are currently being developed for all urban areas, before progressing to district-wide assessments next year.
Some improvement and remedial stormwater works have been identified and are being progressed.
Group Activity - Stormwater
2013/2014
2013/2014
2012/2013
Actual
Budget
Actual
Operating Statement
OPERATING REVENUE
Rates
424,096
389,601
295,130
Other Income
0
0
0
Internal Interest Received
4,734
2,640
3,900
Vested Assets
141,586
0
706,995
Development Contributions
31,519
17,791
90,550
Total Operating Revenue
601,935
410,032
1,096,575
OPERATING EXPENDITURE
Employment Costs
39,504
103,130
818
Other Direct Expenditure
102,480
90,443
297,632
Internal Interest Paid
100,842
118,452
99,407
Council Overheads
13,380
13,382
12,852
Depreciation
74,393
48,800
72,623
Loss on Disposal of Assets
3,298
0
3,298
Total Operating Expenditure
333,897
374,207
486,631
Operating Surplus (Deficit)
$268,038
$35,825
$609,944
CAPITAL EXPENDITURE
District Wide Stormwater
141,586
0
706,995
Amberley Beach Foreshore Protection
0
0
0
Amberley Stormwater
10,780
0
38,194
Jed River Clearance
0
0
0
Hanmer Springs Stormwater
0
62,352
0
Total Capital Expenditure
$152,366
$62,352
$745,189
⌂
28
Annual Report 2013/14
Community services and facilities
Community Services and Facilities cover three activities:
that had an increase in value when buildings were
1. Community Services (library – youth programme
last revalued.
– community development – grants and service
awards)
Financial Commentary – 2013/14 Actual com-
2. Property (housing – public toilets – council offices –
pared with 2012/13 Actual
medical centres – hal s – swimming pools – township This year’s operating deficit of $1,911,087 was $705,677
maintenance)
greater than the operating deficit recorded for the
3. Reserves (parks – reserves – cemeteries)
2012/2013 year of $1,205,410.
• Rates – the level of rates struck for Community
Our Aim:
Services and Facilities is $139,958 greater than was
To provide services that will support the community to
received in the 2012/2013 year. The increase in rates
lead healthy and fulfil ed lives and meet and extend their
was anticipated with the Hanmer Springs Communi-
recreational, cultural, educational development and
ty setting a new rate for the purchase of a Doctor’s
information needs.
House. In addition, there was an increase provided
for the Community Hal s and Pools in anticipation of
Achievement of levels of service
increasing Insurance Costs.
Each of the activities listed above have a range of perfor- • Other Income – the level of Other Income is down
mance measures to describe the service targets we were
from last year due to the Insurance Proceeds re-
aiming for. These are set out in the following pages with
ceived from the damage to the Balcairn Council
a commentary on how we had performed at the end of
Chambers of $203,580 and the termination of the
the year (end of year results).
Community Development Programme at the end of
Financial Commentary – 2013/14 Actual
June 2013, of which the Council received a grant of
compared with 2013/14 Budget
$80,000.
• Development Contributions – the significant level
Overal , an operating deficit of $1,911,087 was recorded
of development that occurred in the 2012/2013
against a budgeted operating deficit of $2,113,502. The
year has not been as high in the 2013/2014 year and
key variances from budget have been:
consequently, the level of development contributions
• Other Income – the level of Other Income is up on
is lower.
budget by $113,976 due to higher than expected
• Other Direct Expenditure – the level of operating ex-
income from the farming operations on the Scar-
penditure is down on that recorded in the 2012/2013
gil -Motunau Recreation Reserve, higher receipts
year due to a range of repair work carried out on
from the camp at Amberley Beach and higher re-
buildings with earthquake damage. In addition, the
ceipts for the Waikari Reserve.
Council went through of process of placing priorities
• Development Contributions – the level of develop-
over buildings in respect to the level of insurance
ment contributions received for the year was down
cover, which resulted in a large saving in premiums
on that budgeted for particularly in respect to the
for community assets.
Queen Mary Upgrade.
• Employment Costs – the amount of employment
Significant Capital Expenditure
costs allocated to Community Services and Facilities
Overal , $637,352 was recognised as Capital Expendi-
was lower than was budgeted for the year, par-
ture for the 2013/2014. This was $290,268 less than was
ticularly for general Hanmer Springs Amenities and
budgeted for.
District Reserves.
• Library – $58,290 was spent on Library books for the
• Other Direct Expenditure – the level of operating
year.
expenditure on District Reserves are lower than was • Medical Buildings – after consulting with the commu-
budgeted for with the amount set aside for work
nity through the Annual Plan, the Council, purchased
on the Queen Mary Site being less than anticipated
a new house to accommodate a doctor in Hanmer
while earthquake strength issues are being investi-
Springs at a price of $500,000.
gated.
• Reserves – A total of $319,416 was budgeted for
• Depreciation – The amount of Depreciation charged
capital projects for Reserves. At the end of the year
for the year was $575,324, compared with the
only $50,672 was spent, with remaining balances to
budget of $432,142. The increase on budget is relat-
be carried forward into the 2013/2014 year. Of the
ing to the realignment of depreciation on buildings
29
⌂
Hurunui District Council
project that were undertaken: $15,149 was spent on Community outcomes to which this group of
new Water Heating for the Leithfield Beach Camp;
activities primarily contribute
$12,234 was spent on the Squash Courts at the
A desirable and safe place to live
Scargil -Motunau Recreation Reserve; and funding
• We have attractive well designed townships
towards a tractor and new picnic tables for the Han-
• Communities have access to adequate health and
mer Springs Reserves.
emergency services and systems and resources are
Internal Borrowing
available to meet civil defence emergencies
• Risks to public health are identified and appropriate-
• At the start of the financial year, the level of internal
ly managed
borrowing for Community Services and Facilities was
$3,113,131.
A place where our traditional rural values and heritage
• Operating surpluses (excluding depreciation) re-
make Hurunui unique
corded by the individual Community Services and
• People have a range of opportunities to participate
Facilities total ing $571,702 were used to offset
in leisure and culture activities
the borrowings, with a further $833,768 of Capital
• Our historic and cultural heritage is protected for
Expenditure incurred resulting in the balance of the
future generations.
internal borrowings for Community Services and
Facilities sitting at $3,375,198 as at the end of the
year – an overall increase of $262,066.
• The amount of Internal Interest charged to the
Community Services and Facilities for the year was
$299,245 with those that held funds (rather than be-
ing in debt) receiving an amount of internal interest
totalling $63,828.
Group Activity - Community Services and Facilities
2013/2014
2013/2014
2012/2013
Actual
Budget
Actual
Operating Statement
OPERATING REVENUE
Rates
1,672,445
1,610,444
1,532,487
Other Income
815,638
701,662
1,216,194
Internal Interest Received
63,828
45,994
46,004
Development Contributions
200,911
247,626
750,758
Council Overheads (Income)
0
0
0
Total Operating Revenue
2,752,822
2,605,726
3,545,443
OPERATING EXPENDITURE
Employment Costs
716,922
844,940
730,548
Other Direct Expenditure
2,053,019
2,075,164
2,217,646
Internal Interest Paid
299,245
347,568
305,170
Council Overheads
1,019,400
1,019,414
997,838
Depreciation
575,324
432,142
499,651
Total Operating Expenditure
4,663,910
4,719,229
4,750,854
Operating Surplus (Deficit)
($1,911,087)
($2,113,503)
($1,205,410)
CAPITAL EXPENDITURE
Community Services
58,290
67,548
118,800
Property
528,390
540,656
241,377
Reserves
50,672
319,416
82,776
Total Capital Expenditure
$637,352
$927,620
$442,953
⌂
30
Annual Report 2013/14
Community services
Goal
How we will achieve our goals
Performance measures
Provide community services that are
Run a youth programme that meets the Youth events attendances reach no less
valued by people in the District.
needs of our local youth.
than the minimum desired.
End of year result - Not met
At the end of the year, the Hurunui Youth Programme completed all of the activities that had been scheduled. There were a
total of 39 ‘registered’ events (the events where we record names) and another 15 ‘non-registered’ events (open) held, as
well as the weekly school visits, regular youth meetings and club days/nights. Of the 39 registered events, five events did not
achieve the minimum desired numbers set. These have been evaluated and either deleted, put on hold or adjusted to make
them more appealing (in conjunction with discussions with attendees and with the Hurunui Youth Council).
Goal
How we will achieve our goals
Performance measures
Provide community services that are
Undertake a residents satisfaction
Satisfaction with library customers is
valued by people in the District.
survey.
maintained or continues to improve.
End of year result - Met
Satisfaction with the service provided by the library increased to 83%, up 2% on the 2012/13 result for this question.
With the exception of Cheviot, satisfaction levels across the district were consistently high (Amberley 94%, Glenmark 96%,
Amuri
80%, Hanmer Springs 78% and Hurunui 75%).
Cheviot residents are least likely to say they are satisfied with the library (61%). It is noted that this has been a consistent
result since 2007. Borrowing from the Cheviot library has increased by 67% since its relocation in October 2013. When the
survey was conducted in early February 2014 the Cheviot service point was still relatively new.
Goal
How we will achieve our goals
Performance measures
Provide community services that are
Reward and recognise outstand¬ing
Awards and funds are disbursed accord-
valued by people in the District.
contribution from people in the District. ing to the criteria annually.
End of year result - Met
Each year the Council distributes funds and awards for outstanding service or contribution to the district. This year we re-
ceived 20 applications for the secondary school achiever awards (the biggest for some years). The $10,000 fund was distrib-
uted between the top 6 students.
Five community service awards were distributed throughout the district. This is to recognise voluntary effort and no financial
reward is given.
Only 2 applications were received for the Hurunui Heritage Fund for projects that improve the preservation and understand-
ing of the district’s heritage. Of the 2 applications, one was awarded $3,100 out of the $5,000 available.
Four applications for the Council and MainPower’s joint Hurunui Natural Environment Fund were received. A total of
$10,000 is available for works on public or private land that benefits existing indigenous values or reinstates indigenous vege-
tation. The total fund was distributed in full to all four applicants.
2009
2010
2011
2012
2014
Resident satisfaction with the library
77%
81%
84%
81%
83%
31
⌂
Hurunui District Council
Applicants/awards by year and fund
40
35
5
7
30
5
s
6
ard 25
4
12
19
5
3
2
Community Service Awards
7
20
2
Environmental Fund
applicants/aw
Hurunui Heritage Fund
ber of
8
15
Secondary School Achievers Awards
um
3
6
N
8
5
3
2
3
10
20
18
4
2
2
13
1
5
10
10
7
7
6
0
Applications
Awards
Applications
Awards
Applications
Awards
Applications
Awards
2010/11
2011/12
2012/13
2013/14
Funds available/disbursed by year and fund
$30,000
$25,000
$20,000
$13,500
$10,000
$13,500
$10,000
$10,000
$10,000
$9,000
$5,500
$15,000
Environmental Fund
Hurunui Heritage Fund
s available/disbursed
$5,000
$3,000
$3,000
$3,000
$3,000
$3,000
Secondary School Achievers Awards
$2,500
$3,000
Fund $10,000
$5,000
$10,000
$10,000
$10,000
$10,500
$10,000
$10,000
$10,000
$10,000
Note:
There is no fund available
$0
for Community Service
Funds
Funds
Funds
Funds
Funds
Funds
Funds
Funds
Awards
available
disbursed
available
disbursed
available
disbursed
available
disbursed
2010/11
2011/12
2012/13
2013/14
⌂
32
Annual Report 2013/14
Hurunui Youth Programme Registered Attendance Chart 2013-2014
120
100
80
60
40
20
Actual Attendance
Minimum Desired
0
p
c
4
4
4
4
4
4
uly
uly
uly
st
st
ep
ep
ct
ov
ov
ov
ov
14
14
ril
14
gu
Aug
gu
ber
S
ober
014
arch
how
014
une
26 J
ugust
1 N
8 N
C De
201
201
20
Ap
tem
7
ct
y 2
/201
P S
o 1
29 N
DD
03
8 M
&
ay 201
ay 2
ay 20
b 29
une 2014
t 27 J
ovies 5 J
rip 17 J
ep
ne 1
w
arch
arch
arch
ril 11 20
M
M
i T
ovies 4 O
ovies 16
ovies
ovies 13 Se
ovies 20 S
hree 25 N
anuary 2014
anuary 201
anuary 2014
bruary 2014
bruary 201
bruary 2014
1/
ow
lim
6
igh
Sk
vies 2 A
cial 30 Au
M
e O
e T
e Jam
ebruar
1
treat 25-
ovies 9 Au
DDC S
e T
how
7 M
t 20 J
P Sh
den A
al Ap
ight 9 M
uri M
ating 11 O
am
am
kat
22 J
1 F
t 28 M
es N
am
23 Fe
ar
P S
rm
rum
ight 23
igh
berley M
uri Mo
arden
berley M
Sk
l G
l G
arty 21 M
am
berley M
Am
l G
ty 2
&
treat 19 J
p 20-
arty 31 J
Haw
Fo
Clip 'n C
es N
Am
HYC Re
Am
nesies So
Cheviot M
Ice
arty 02 Fe
arty 14 Fe
ar
p 22-
ate Jam
ovie N
Cheviot M
Am
tbal
tbal
Am
O
Haw
P
ovie N
ke
ke
tbal
berley S
uri A
ong P
ater Figh
am
ke
ool P
ool P
ool
am
Cheviot A&
Youth Fo
Bas
Bas
Am
HYC Re
Am
uri Sk
Bas
Cheviot G
Am
ing P
berley M
berley P
den P
Cheviot M
berley G
eadership Cam
ar
Cheviot W
Am
Am
Cheviot P
Am
Culverden Pool P
eadership C
Haw
arden P
nior L
Haw
Se
Year 8 L
Activity - Community Services
2013/2014
2013/2014
2012/2013
Actual
Budget
Actual
Operating Statement
OPERATING REVENUE
Rates
789,861
740,755
788,234
Other Income
96,071
94,828
188,485
Internal Interest Received
8,854
1,501
2,703
Development Contributions
27,511
38,777
87,966
Total Operating Revenue
922,297
875,861
1,067,388
OPERATING EXPENDITURE
Employment Costs
457,345
514,474
522,088
Other Direct Expenditure
416,212
359,632
450,349
Internal Interest Paid
124,929
150,151
141,741
Council Overheads
518,460
518,439
502,668
Depreciation
177,924
109,842
136,682
Total Operating Expenditure
1,694,870
1,652,537
1,753,528
Operating Surplus (Deficit)
($772,573)
($776,676)
($686,141)
CAPITAL EXPENDITURE
Library
58,290
67,548
118,800
Community Programmes
0
0
0
Grants
0
0
0
Amenities
0
0
0
Total Capital Expenditure
$58,290
$67,548
$118,800
33
⌂
Hurunui District Council
Property
Goal
How we will achieve our goals
Performance measures
To provide and maintain buildings to
Consult with the community about the
Decide on the course of action to be
support activities and recreational
future of the Amberley swimming pool. taken (build, upgrade or abandon) de-
needs for local communities.
pending upon community views.
End of year result - Not met
An incorporated Society ‘Save our Pool Inc.’ was formed from interested community leaders to develop plans and raise funds
for the agreed option. The Amberley Ward Committee approved $15,000 of funding for the society to commission a scoping
report. That report has not yet been received but when received will determine the future course of actions
Goal
How we will achieve our goals
Performance measures
To maintain townships so they are neat Investigate complaints about the stand- All complaints are followed up within 48
and tidy.
ard of any Council owned facilities.
hours.
End of year result - Not met
34 customer requests for service were lodged in relation to our property. Of the 34, 31 were followed up within 48 hour.
Most of the requests were to bring matters to our attention for service rather than ‘complaints’. Unfortunately were not able
to respond to 3 of the requests within 48 hours due to: staff illness (an issue at times for a small council); and difficulty in
finding a supplier to make a sign for one of our reserves. Our usual signage supplier had recently been disestablished. The
requests for service relating to council owned property included community halls, playground equipment, reserves (trees),
pensioner units, cemeteries, public toilets, camping grounds and depots. On most occasions, our response time is very
prompt and delays to actually completing any service requirements are almost always due to having to wait for contractors
or tradespeople to be able to ‘fit the job in’ to their schedules.
Goal
How we will achieve our goals
Performance measures
To maintain townships so they are neat Undertake a residents satisfaction
Residents satisfaction over attractive-
and tidy.
survey.
ness and neatness of their townships is
maintained or improved.
End of year result - Not met
We did not ask a question relating to neatness an C
d att o
rac u
tiven
ne c
s il f
s of towa
n c
shipilit
s in o ie
ur 20s
1
4 resident satisfaction survey. We
do know that residents in the main are satisfied with council owned township facilities such as halls, libraries, parks and re-
serves, cemeteries, waste and recycling and footpaths. The results vary but over time have mainly been consistent. Satisfac-
tion for recycling and waste has reduced due to the introduction of new collection bags. In the past, residents were able to
put their waste and recycling into bags or boxes of their choice. We will be monitoring this trend into the future.
Service/Facility
2010
2011
2012
2014
Trend
Maintenance of parks and reserve
85
91
87
90
Standard of local halls
76
78
78
73
Service provided by the library
81
84
81
83
Quality of public toilets
78
80
82
76
Standard of cemetery
60
68
62
70
Satisfaction with household waste collection
91
95
96
87
Satisfaction with household recycling collection
-
86
89
72
Standard of public footpaths
74
66
67
71
Base: Total sample: 500 Note: satisfaction with these services in 2013 was not asked
1
⌂
34
Annual Report 2013/14
Activity - Property
2013/2014
2013/2014
2012/2013
Actual
Budget
Actual
Operating Statement
OPERATING REVENUE
Rates
603,512
597,699
487,325
Other Income
426,548
413,345
774,366
Internal Interest Received
54
0
0
Development Contributions
73,771
63,460
72,803
Total Operating Revenue
1,103,885
1,074,504
1,334,493
OPERATING EXPENDITURE
Employment Costs
127,295
146,967
136,671
Other Direct Expenditure
865,629
807,453
984,204
Internal Interest Paid
173,843
195,168
162,332
Council Overheads
117,600
117,616
114,236
Depreciation
321,220
256,461
293,536
Total Operating Expenditure
1,605,588
1,523,666
1,690,978
Operating Surplus (Deficit)
($501,703)
($449,162)
($356,486)
CAPITAL EXPENDITURE
Rental Property
3,685
0
149,811
Public Toilets
0
0
14,945
Medical Centres
500,000
500,000
2,546
Halls
17,367
12,078
37,438
Pools
0
2,078
0
Township Maintenance
7,338
26,500
36,636
Total Capital Expenditure
$528,390
$540,656
$241,377
35
⌂
Hurunui District Council
Reserves
Goal
How we will achieve our goals
Performance measures
To provide parks and reserves for peo-
Involve local communities in the plan-
Reserve and / or Ward Committees
ple to enjoy.
ning and development of their reserves. spend their annual budgets on projects
identified for that year.
End of year result - Mostly met
A total of $524,676 was spent on operating expenses for local amenities reserves, which was $58,342 lower than was budg-
eted for. Capital Expenditure for the year was $43,138, which was $71,923 lower than budget due to the decision to defer the
resealing of the tennis courts at Leithfield Beach.
Goal
How we will achieve our goals
Performance measures
Our cemeteries meet the needs of our
Undertake a residents satisfaction
No less than 90% of residents who have
communities.
survey.
visited a cemetery are satisfied.
End of year result - Not met
70% of residents surveyed were satisfied with the standard of cemeteries in the district (compared with 62% in 2012). There
was no distinction made in the survey between those who had actually visited a cemetery and those who hadn’t.
Activity - Reserves
2013/2014
2013/2014
2012/2013
Actual
Budget
Actual
Operating Statement
OPERATING REVENUE
Rates
279,072
271,990
256,929
Other Income
293,019
193,488
253,343
Internal Interest Received
54,920
44,493
43,301
Development Contributions
99,630
145,389
589,989
Total Operating Revenue
726,641
655,361
1,143,563
OPERATING EXPENDITURE
Employment Costs
132,281
183,499
71,789
Other Direct Expenditure
771,177
908,081
783,093
Internal Interest Paid
473
2,249
1,097
Council Overheads
383,340
383,359
380,934
Depreciation
76,180
65,839
69,434
Total Operating Expenditure
1,363,451
1,543,027
1,306,347
Operating Surplus (Deficit)
($636,809)
($887,666)
($162,784)
CAPITAL EXPENDITURE
District Reserves
7,533
74,455
24,200
Cemeteries
0
129,900
2,750
Amberley Reserves
15,149
95,836
32,014
Amuri Reserves
0
8,833
15,708
Cheviot Reserves
0
0
0
Glenmark Reserves
12,234
0
7,083
Hanmer Springs Reserves
15,755
10,392
0
Hurunui Reserves
0
0
1,021
Self Funded Reserves
0
0
0
Trust Funds
0
0
0
Total Capital Expenditure
$50,672
$319,416
$82,776
⌂
36
Annual Report 2013/14
Environment and safety
Environment and Safety cover four activities:
budgeted for; Consultants costs associated with
1. Emergency services (civil defence – rural fire)
Building Control was $83,926 greater than budget;
2. Resource management (administering the District
and Solid Waste Costs were $150,811 greater than
Plan, resource consents, township planning, policy
budget, which included the unbudgeted purchase of
and by-law development)
refuse and recycling bags as the result of chance to
3. Compliance and regulatory functions (building
the col ection structure. These costs were offset by
controls, public health and liquor licensing, animal
the Council only spending $13,600 of the budgeted
control)
$170,000 on Earthquake Strength reviews due to the
4. Waste minimisation (refuse, recycling, transfer sta-
delay to confirmation of the relevant legislation.
tions, litter bin col ection)
• Depreciation – the level of depreciation is higher
than budgeted due to the depreciation that has
Our aim
been charged on the newly developed Transfer Sta-
To protect people, animals and the environment from
tion site in Amberley.
natural disaster, disease and hazards.
Financial Commentary – 2013/14 Actual
Achievement of levels of service
compared with 2012/13 Actual
Each of the activities listed above have a range of perfor-
This year’s operating deficit of $529,266 was $572,714
mance measures to describe the service targets we were less than the operating surplus recorded for the
aiming for. These are set out in the following pages with
2012/2013 year of $43,448.
a commentary on how we had performed at the end of
• Rates – the rates charged for the 2013/2014 year
the year (end of year results).
were higher than the level struck for the previous
year due to the budgeted costs involved in reviewing
Financial Commentary – 2013/14 Actual
the Earthquake Strength of the Council’s buildings.
compared with 2013/14 Budget
In addition, there were more ratepayers paying the
Overal , an operating deficit of $529,266 was recorded
refuse col ection rates than were identified in the
against a budgeted operating surplus of $17,418. The key
previous year.
variances from budget have been:
• Other Income – Other income is up on the previous
• Rates – The level of rates received for Refuse Col-
year by $73,275, which is due to: Subsidies received
lection was higher than budgeted for due to a
on Rural Fire Equipment; Income from Building Con-
higher than anticipated number of ratepayers being
trol is up on last year by $29,438 due to increased
charged the rate.
level of building activity during the year; Changes
• Other Income – other income for Environment and
to the Liquor Licensing legalisation has resulted in
Safety is up on budget due to: a subsidy of $29,859
increased income of $25,086 from last year; the
was received on Rural Fire Equipment purchased,
greater number of dogs registered in the District has
which was not budgeted for; Dog Licence fees ended
resulted in Dog Licenses being $46,207 greater than
the year $15,197 up on the level budgeted for due to
that recognised last year; and income from Solid
a higher number of dogs being registered in the Dis-
Waste was $38,652 greater than was recorded in the
trict; changes to the Liquor Licensing legalisation had
2012/2013 year .
meant that fees increased by $25,949 on the level
• Employment Costs – there was an increase from
budgeted for; and Solid Waste Charges were $20,509
2012/2013 in the employment costs due to: the
greater than budget.
higher staff numbers required in the building control
• Employment Costs – to ensure that Council could
department; increased level of training incurred on
meet the required statutory timeframes for Re-
Rural Fire Control; increased staffing requirements in
source and Building Consents, there was the require-
relation to the sale of alcohol legislation and a great-
ment to increase the staff level for the year.
er level of resources assigned to Animal Control.
• Other Direct Expenditure – other direct expenditure
• Other Direct Expenditure – the major movement
is up on budget by $509,922. This is due to: Costs in-
in direct expenditure for Environment and Safety is
curred in suppressing a rural fire in the Ashley Forest
as follows: Costs incurred in suppressing a rural fire
area was $189,126, of which the Council is actively
in the Ashley Forest area was $189,126, of which
pursuing reimbursement; direct costs associated
the Council is actively pursuing reimbursement;
with District Plan review was $139,460 greater than
direct costs associated with District Plan review was
37
⌂
Hurunui District Council
$144,418 greater than last year; Consultants costs
Internal Borrowing
associated with Building Control was $47,902 greater • At the start of the financial year, the level of inter-
than last year; and Solid Waste Costs were $181,611
nal funds on hand for Environment and Safety was
greater than last year. These costs were offset by
$90,704. This was in respect to the Targeted Rate
the Council only spending $13,600 on Earthquake
Funded Rural Fire Control and Household Refuse
Strength reviews compared to $90,150 spent in the
Collection.
2012/2013 year.
• Operating deficits recorded by the individual Envi-
• Depreciation – the level of depreciation is higher
ronment and Safety cost centres total ed $229,739
this year compared to last year due to the deprecia-
(primarily due to the costs incurred on the Ashley
tion that has been charged on the newly developed
Forest Fire suppression) and resulted overall bor-
Transfer Station site in Amberley.
rowings for Environment and Safety at the end of
the year of $139,035 – an overall increase in internal
Significant Capital Expenditure
borrowings of $229,739.
Overal , $1,252,902 was recognised as Capital Expendi-
• The amount of Internal Interest charged to the
ture for the 2013/2014. This was $1,045,454 greater than
Environment and Safety cost centres for the year
was budgeted for.
was $11,321 with those cost centres that held funds
• Civil Defence and Rural Fire – A total of $101,892
(rather than being in debt) receiving an amount of
was spent of the $119,508 budget. Work total ing
internal interest total ing $4,315.
$35,634 was carried out on Generators and a further
$66,258 was spent on work on Rural Fire Tankers.
Community outcomes to which this group of
Budget for the Remote Trigger for Tsunami Sirens,
activities primarily contribute
Digital radios for Rural Fire and the Fire Depot in
A desirable and safe place to live
Waiau have been deferred until 2014/2015.
• We have attractive well designed townships
• Resource Management and Planning - $25,980 was
• Communities have access to adequate health and
budgeted to purchase a replacement vehicle for the
emergency services and systems and resources are
Monitoring area. This was deferred until 2014/2015.
available to meet civil defence emergencies
In the meantime, the biodiversity vehicle was sold
• Risks to public health are identified and appropriate-
and replaced from the current fleet of vehicles.
ly managed.
• Compliance and Regulatory – Replacement vehicles
for Building Inspectors and Public Health Officer
A place that demonstrates environmental
was budgeted for but not spent and will be carried
responsibility
forward to the 2014/2015 year.
• We protect our environment while preserving peo-
• Waste Minimisation – although there was no specific
ple’s property rights
budget set for Waste Minimisation for the year, the
• We minimise solid waste to the ful est extent, and
major projects of the relocation of the Amberley
manage the rest in a sustainable way.
Transfer Station continued with funds carried over
from prior years. For the 2013/2014 year $1,154,658
was spent to complete the project.
⌂
38
Annual Report 2013/14
Group Activity - Environment and Safety
2013/2014
2013/2014
2012/2013
Actual
Budget
Actual
Operating Statement
OPERATING REVENUE
Rates
3,419,346
3,313,371
3,303,658
Other Income
1,725,543
1,654,378
1,652,268
Internal Interest Received
4,315
0
1,917
Development Contributions
0
0
0
Council Overheads (Income)
0
0
0
Total Operating Revenue
5,149,203
4,967,750
4,957,844
OPERATING EXPENDITURE
Employment Costs
1,625,615
1,476,772
1,465,350
Other Direct Expenditure
3,097,932
2,605,232
2,611,067
Internal Interest Paid
11,321
7,443
1,910
Council Overheads
743,412
743,423
717,140
Depreciation
200,189
117,462
118,928
Total Operating Expenditure
5,678,469
4,950,332
4,914,395
Operating Surplus (Deficit)
($529,266)
$17,418
$43,448
CAPITAL EXPENDITURE
Emergency Services
101,892
119,508
148,699
Resource Management & Planning
(12,206)
25,980
31,686
Compliance and Regulatory Functions
8,558
61,960
45,763
Waste Minimisation
1,154,658
0
967,265
Total Capital Expenditure
$1,252,902
$207,448
$1,193,412
39
⌂
Hurunui District Council
Emergency services
Goal
How we will achieve our goals
Performance measures
To be prepared for emergency situa-
Ensure there are sufficient resources.
Educate the public on how to prepare
tions which have adverse implications
themselves for an emergency.
for the District.
End of year result - Met
Educating the public to be prepared for an emergency situation is an on-going programme involving different initiatives. The
following is an example of what has been done to do this during the year:
• Council website with useful information about preparedness.
• Weather warnings notified to the public through the web and Facebook.
• Displays and interactive games and models at the Amberley and Amuri A&P shows (for both civil defence and rural fire).
• Use of an earthquake stimulator at shows and schools to heighten awareness of what to do.
• Talk about preparedness, civil defence and rural fire at a fortnightly dedicated slot on the local ‘Compass’ radio station.
• Fire permits are used as an education opportunity to promote safe burning.
• New initiatives include developing a planning guide for the public, and working with small businesses to develop business
continuity plans.
Goal
How we will achieve our goals
Performance measures
To be prepared for emergency situa-
Ensure there are sufficient resources.
Staff and volunteers are trained to deal
tions which have adverse implications
with an emergency.
for the District.
End of year result - Met
Developing and training volunteers to respond and deal with an emergency is an important function of the council. There are
9 sector posts within the district and within those, there is regular training. The frequency is different for different groups,
remembering that these are volunteers, therefore the training has to suit them. Some train fortnightly, some monthly and
others quarterly.
There are 6 volunteer rural fire forces in the Hurunui district with the newest being formed at Mt Lyford. Two basic rural fire
courses were delivered during the year – February and May, and a rural fire pump course. Of the 92 rural fire personnel, 59
attended a training course in the 2013/2014 financial year. Each fire force also conducts fortnightly or monthly training.
Staff training has been through real life situations during the year. Minor civil defence activations were initiated through
severe weather events. Most staff have been involved in formal civil defence training with the newest staff yet to receive
any. We are confident that we have sufficiently trained staff to manage effectively in a civil defence emergency. Within the
Canterbury region, more emphasis is being placed on sharing expertise and skill across the region for all emergency situations
where people, property and animals are at risk. It is recognised that to train all staff and to maintain the level competence
for all staff is impractical if not an impossible aim, not to mention costly.
Activity - Emergency Services
2013/2014
2013/2014
2012/2013
Actual
Budget
Actual
Operating Statement
OPERATING REVENUE
Rates
444,635
435,047
432,925
Other Income
25,817
0
2,021
Internal Interest Received
0
0
170
Total Operating Revenue
470,452
435,047
435,116
OPERATING EXPENDITURE
Employment Costs
163,619
110,696
100,984
Other Direct Expenditure
388,016
152,887
175,758
Internal Interest Paid
11,321
7,182
1,894
Council Overheads
102,144
102,140
99,764
Depreciation
91,814
60,848
66,359
Total Operating Expenditure
756,914
433,753
444,759
Operating Surplus (Deficit)
($286,462)
$1,294
($9,644)
CAPITAL EXPENDITURE
Civil Defence
35,634
25,980
52,977
Rural Fire
66,258
93,528
95,722
Total Capital Expenditure
$101,892
$119,508
$148,699
⌂
40
Annual Report 2013/14
Resource management
Goal
How we will achieve our goals
Performance measures
To manage our natural resources as
Have good rules, standards and process- The District Plan review is complete.
safely as possible and ensure they are
es in place.
protected for the future.
End of year result - Not met
We started to review our District Plan over a year ago. This work is complex and important to the future of the Hurunui
district. Therefore it is more important that we do this thoroughly at the expense of taking longer than we may have initially
planned. The review is not complete but we have been actively seeking community feedback for us to consider before we
get to the final draft stage. There have been many hours of work invested in this project by both staff and councillors and we
believe that we will have developed a robust plan to put out for public consultation in 2015.
Goal
How we will achieve our goals
Performance measures
To manage our natural resources as
Have good rules, standards and process- 95% of all resource consents will be
safely as possible and ensure they are
es in place.
processed within 20 working days.
protected for the future.
End of year result - Met
169 resource consents were processed within the statutory time-frame and 1 resource consent was processed outside the
statutory time-frame. This equates to 99.4% of resource consents been processed within 20 working days.
Goal
How we will achieve our goals
Performance measures
To manage our natural resources as
Protect the unique biodiversity values
Work with land owners and communi-
safely as possible and ensure they are
of the District.
ties to encourage restoring indigenous
protected for the future.
plants and animals.
End of year result - Met
Through the District Plan review, landowners have been invited to work with council officers to identify significant natural
areas on private land. This has generated much interest and feedback. In addition, our biodiversity officer has worked with
landowners and community groups to implement biodiversity protection and restoration projects such as planting pro-
grammes, trapping pest mammals, plus documenting work on National Biodiversity Database, NatureWatchNZ. A variety of
specific projects and advice has been undertaken during the year, for example:
• Funding applications, rates relief of covenants, and tax benefits of riparian planting and fencing, and reduction of nitro-
gen runoff to waterways.
• Designed and implemented programmes for community groups to restore Council-owned sections of the Chatterton
River and Tipapa Stream.
• Working with DOC to plant rare and endangered limestone plants on Council-owned land.
• Awareness programme to promote the value of protecting, enhancing, and restoring biodiversity through fact sheets
and presentations to community groups. This included creating a children’s book, ‘Celebrating Biodiversity in the
Hurunui District’.
41
⌂
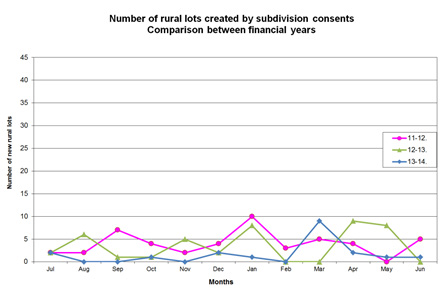
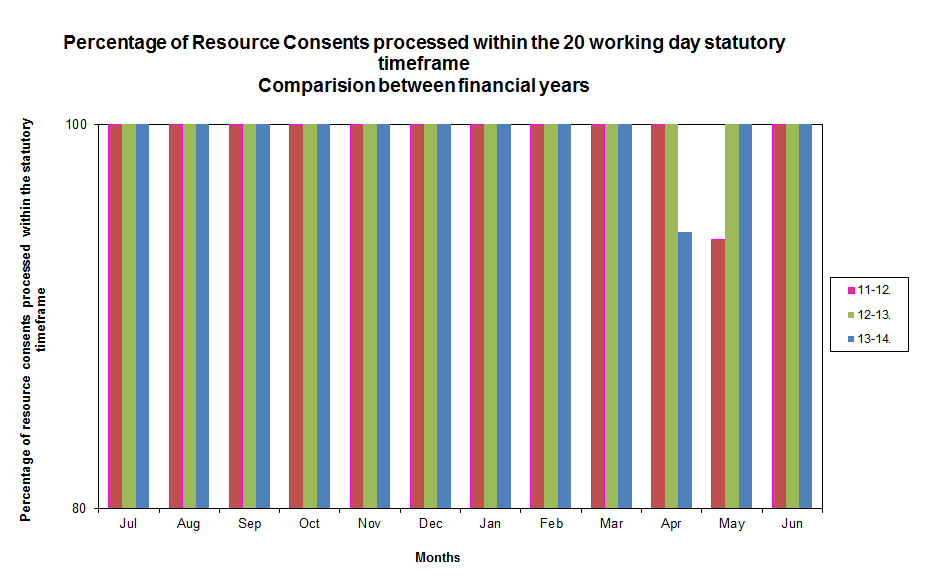
Hurunui District Council
⌂
42
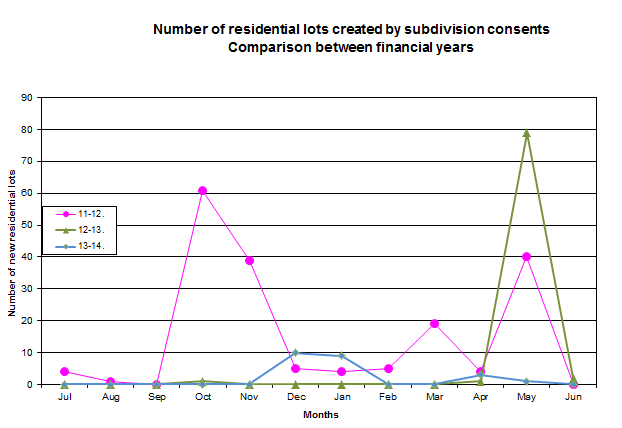
Annual Report 2013/14
Activity - Resource Management
2013/2014
2013/2014
2012/2013
Actual
Budget
Actual
Operating Statement
OPERATING REVENUE
Rates
848,169
841,511
868,579
Other Income
405,098
420,770
493,705
Total Operating Revenue
1,253,267
1,262,281
1,362,284
OPERATING EXPENDITURE
Employment Costs
609,094
626,241
650,939
Other Direct Expenditure
512,926
345,137
391,817
Council Overheads
276,384
276,384
266,498
Depreciation
6,876
14,520
9,416
Total Operating Expenditure
1,405,281
1,262,281
1,318,670
Operating Surplus (Deficit)
($152,014)
($0)
$43,614
CAPITAL EXPENDITURE
Resource Management
(12,206)
25,980
0
Subdivision Inspection
0
0
31,686
Total Capital Expenditure
($12,206)
$25,980
$31,686
43
⌂
Hurunui District Council
Compliance and regulatory functions
Goal
How we will achieve our goals
Performance measures
Buildings are safe for the public.
Inspect buildings in accord with NZ
80% of building consents are processed
building standards.
within 20 working days.
End of year result - Met
A total of 513 building consents were issued during the year. Of these, 494 were processed within the statutory 20 working
days which equals 96%. We were late in processing 19 of the building consents due to a number of clerical, resource and
contractor issues. These have all been addressed and 100% of consents have been issued within the required time in the last
6 months of the year. A daily monitoring programme of consents is now being carried out to avoid any future consent going
over the 20 working days.
We had originally set our target at 80% because of the difficulties Canterbury has been experiencing with obtaining skilled
building officers. This has impacted in the past on our ability to process building consents in a timely fashion. We are fortu-
nate to have qualified staff and also have a shared working relationship with other councils so we can assist each other.
Goal
How we will achieve our goals
Performance measures
Food and liquor premises are compliant Inspect food and liquor outlets to make 100% of licensed food and on licence
with standards.
sure they do not pose any risk to the
liquor premises are inspected annually.
public.
End of year result - Not met
93% (130) of licensed food premises and 96% (50) of on licensed liquor premises were inspected during the year. There are
155 licenced food premises (149 in 2012/13 and 153 in 2011/12), and 52 on licenced liquor premises (52 in 2012/13 and 67 in
2011/12). As a result of the inspections, some minor food related issues were identified and resolved with the operator, but
there were no serious non-compliances.
We work with other agencies (police and public health) to make sure liquor sales and licences are within the law and do dif-
ferent types of inspections including testing to see whether any of the outlets are selling to underage purchasers. During our
visits, we unfortunately found 7 cases where illegal sales were made. These were dealt with by the Alcohol Regulatory and
Licensing Authority with suspensions of licences for the premises and the manager’s certificates. Higher risk premises were
visited with 17 of them being visited on more than one occasion. Intoxication issues were found at 2 of the premises and
excessive noise complaints were dealt with at 3 of the premises.
We did fewer inspections than the previous 2 years when we inspected all premises (100%). With the introduction of the
new ‘Sale and Supply of Alcohol Act’ and the measures we needed to put in place to implement it, we focused our inspec-
tions on the higher risk premises rather than all of them. Given that we generally do inspect all premises, it was more im-
portant during the year to put time into ensuring the new Act was implemented correctly. We will have additional on-going
resourcing needs and in September 2014, we employed a part time environmental health officer to supplement our internal
capacity.
Goal
How we will achieve our goals
Performance measures
Dogs and stock do not cause a nuisance. Investigate complaints about animals
All serious dog complaints are followed
causing danger or nuisance.
up within 24 hours.
End of year result - Met
There are 5,399 dogs on our dog registration data base for the Hurunui district. This is a slight reduction from the previous 2
years (2013: 5,506; 2012:5,565; 2011:5,299; 2010: 5,109). All serious dog complaints were investigated within 24 hours. We
received a total of 390 complaints about dogs during the year. The nature of the complaints varied (see table).
2014
2013
2012
Aggressive behaviour
34
43
28
Stock worrying
7
17
15
Barking
69
75
66
Lost/Found/Roaming
246
256
306
Welfare
16
19
34
⌂
44
Annual Report 2013/14
Building Consents issued by category for whole District
80
70
60
ts
50
n
e
s
n
o
40
f C
r o
e
b
m
30
u
N
20
10
0
Dwellings
Commercial
Farm Blds
Dwg Alterations
Other Build
Percentage of Consents issued within the 20 day statutory time frame
120
100
80
le
10-11
it
T
60
11-12
is
x
A
12-13
13-14
40
20
0
Jul
Aug
Sept
Oct
Nov
Dec
Jan
Feb
Mar
Apr
May
Jun
45
⌂
Hurunui District Council
Number of LIMs issued
70
60
50
40
le
it
11/12
T
is
x
12/13
A
13/14
30
20
10
0
July
Aug
Sept
Oct
Nov
Dec
Jan
Feb
Mar
Apr
May
Jun
Activity - Compliance & Regulatory Functions
2013/2014
2013/2014
2012/2013
Actual
Budget
Actual
Operating Statement
OPERATING REVENUE
Rates
397,016
394,730
265,804
Other Income
1,040,158
999,503
940,580
Total Operating Revenue
1,437,175
1,394,233
1,206,385
OPERATING EXPENDITURE
Employment Costs
755,214
662,022
620,341
Other Direct Expenditure
394,438
452,367
419,452
Council Overheads
240,132
240,123
230,686
Depreciation
12,301
23,333
17,501
Total Operating Expenditure
1,402,084
1,377,846
1,287,980
Operating Surplus (Deficit)
$35,090
$16,387
($81,595)
CAPITAL EXPENDITURE
Building Control
8,558
35,980
45,763
Public Health
0
25,980
0
Liquor Licensing
0
0
0
Animal Control
0
0
0
Total Capital Expenditure
$8,558
$61,960
$45,763
⌂
46
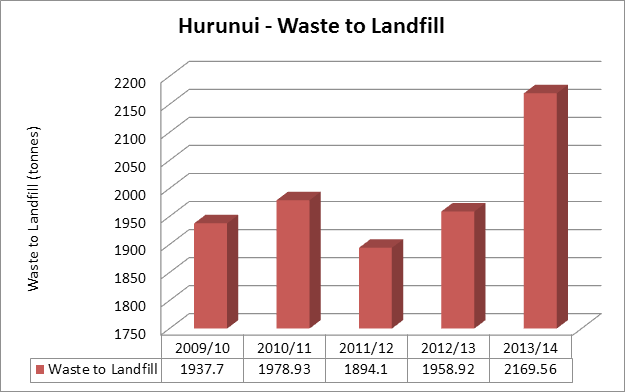
Annual Report 2013/14
Waste minimisation
Goal
How we will achieve our goals
Performance measures
To continue to work to reduce the quan- Encourage the community to recycle
Residual waste to landfill reduces each
tities of residual waste from the district, and reduce their residual waste.
year.
disposed of to landfill.
End of year result - Not met
Despite our best efforts to reduce the amount of residual waste sent to the landfill each year, we have not been able to
achieve that this year. Part of the issue is that we have a growing community in Amberley and the popularity of holiday
homes in Hanmer Springs has contributed to increases in waste rather than reductions.
During the year, the amount of waste deposited to the landfill rose to 2,169.5 tonnes (compared with 1,959 in 2012/13 and
1,894 in 2011/12). We will continue to encourage and educate people to recycle and reduce waste.
Goal
How we will achieve our goals
Performance measures
To continue to work to reduce the quan- Encourage the community to recycle
Recycling levels increase each year.
tities of residual waste from the district, and reduce their residual waste.
disposed of to landfill.
End of year result - Not met
Whereas we are aiming to increase our volumes of recyclables, we have had mixed results during the year.
• There has been a decrease in green waste coming into the transfer stations which implies that people are dealing with it
in other ways, such as burn or composting at home. 71 tonnes during the year compared with 112 in 2012/13 and 81 in
2011/12.
• The volume of recyclables (plastic, paper, scrap metal, etc) going to our transfer stations has increased to 257 tonnes (up
from 238 in 2012/13 and 153 in 2011/12). The growth in housing and population in Amberley could account for some of
this increase.
• However the volumes collected from the kerbside have been decreasing since 2010. It is difficult for us to establish the
reasons for this. The way we have been measuring our kerbside collection has been rather rudimentary but we believe
our measurements will be accurate as of February 2014 when we changed contractors. The volumes in kerbside col-
lection show only 365 tonnes were picked up during the year, compared to 526 in 2012/13; 532 in 2011/12 and 565 in
2010/11.
A new transfer station opened in Amberley in June 2014 and already we are seeing a marked increase in recyclables and
sales. We do expect our end of year results next year to show an increase with our improved service.
47
⌂
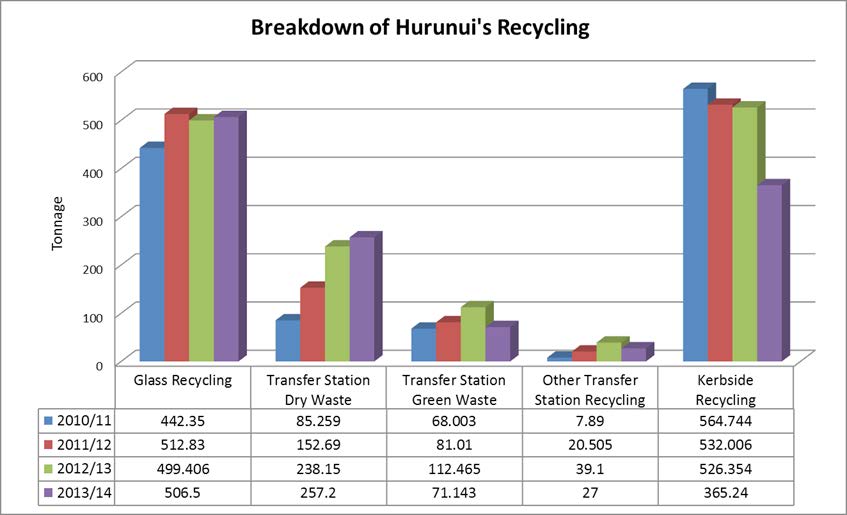
Hurunui District Council
Activity - Waste Minimisation
2013/2014
2013/2014
2012/2013
Actual
Budget
Actual
Operating Statement
OPERATING REVENUE
Rates
1,729,526
1,642,084
1,736,349
Other Income
254,469
234,105
215,962
Internal Interest Received
4,315
0
1,748
Total Operating Revenue
1,988,310
1,876,189
1,954,059
OPERATING EXPENDITURE
Employment Costs
97,688
77,813
93,086
Other Direct Expenditure
1,802,552
1,654,840
1,624,041
Internal Interest Paid
0
261
16
Council Overheads
124,752
124,776
120,192
Depreciation
89,197
18,760
25,652
Total Operating Expenditure
2,114,190
1,876,450
1,862,986
Operating Surplus (Deficit)
($125,879)
($261)
$91,073
CAPITAL EXPENDITURE
Transfer Stations
1,154,658
0
967,265
Litter Bin Collection
0
0
0
Household Refuse Collection
0
0
0
Total Capital Expenditure
$1,154,658
$0
$967,265
⌂
48
Annual Report 2013/14
District promotion
District promotion covers one activity:
Financial Commentary – 2013/14 Actual
1. District promotion
compared with 2012/13 Actual
Our aim
This year’s operating deficit of $71,582 was $7,051 more
than the operating deficit recorded for the 2012/2013
To retain businesses and support their growth and
year of $64,531.
prosperity, to attract investment, new businesses, tour-
ists and visitors, and promote the Hurunui District to
Significant Capital Expenditure
improve the local economy and wel -being of the local
There is no significant capital expenditure in this activity.
community.
Achievement of levels of service
Internal Borrowing
This activity does not hold internal borrowings.
This activity has performance measures to describe the
service targets we were aiming for. These are set out in
Community outcomes to which this group of
the following pages with a commentary on how we had
activities primarily contribute
performed at the end of the year (end of year results).
A place with a thriving local economy
Financial Commentary – 2013/14 Actual
• We are seen as a good place to do business, to live
compared with 2013/14 Budget
and to visit
Overal , an operating deficit of $71,582 was recorded
against a budgeted operating deficit of $46,800. The key
variances from budget have been:
• Other Income – various third party contributions
were received during the year that was not budgeted
for.
• Other Direct Expenditure – the third party contribu-
tions have been made for specific additional pro-
jects undertaken by the Hurunui Tourism Board. In
addition, the Hurunui Tourism Board utilised unspent
funds from prior years to carry out a range of other
projects.
49
⌂
Hurunui District Council
Goal
How we will achieve our goals
Performance measures
To increase our visitors and population.
Promote the District through advertising Number of visitor numbers who stay
and marketing and encourage people to overnight will not be less than the NZ
come.
average.
End of year result - Not met
The number of visitors who stayed overnight in the Hurunui during the year totalled 335,884 (+0.8 percentage growth). The
total guest nights for all of New Zealand was 33,710,060 (5.4 percentage growth). Although a slight improvement to the pre-
vious year, this is still below our aim to at least match the growth in New Zealand. We believe this is a realistic goal particular-
ly considering the national reputation of the Hanmer Springs thermal pools and spa. Comparable figures for previous years
were: 2012/13 - 335,487 (-4.2%); 2011/12 - 350,354 (+11.4%); 2010/11 - 314,533 (+7.9%).
Goal
How we will achieve our goals
Performance measures
To increase our visitors and population.
Promote the District through advertising Our population increases each census.
and marketing and encourage people to
come.
End of year result - Met
Our population did show an increase in the 2013 census from the 2006 census, which has been confirmed as 12,000 (from
10,476). The population growth is mainly in the Amberley area where there has been substantial development with new
dwellings, particularly post the 2010/11 Canterbury earthquakes.
Goal
How we will achieve our goals
Performance measures
To increase our visitors and population.
Promote the District through advertising Develop a new district promotion activ-
and marketing and encourage people to ity model
come.
End of year result - Not met
In 2012/13 the Council considered how to promote the District and delegated the Hurunui Tourism Board to do this alongside
tourism promotion. $30,000 was identified for an events development fund from 1 July 2013 but the criteria for any expendi-
ture has yet to be agreed. The Council decided to let this discussion ‘lay on the table’ and may reconsider it in the future.
Group Activity - District Promotion
2013/2014
2013/2014
2012/2013
Actual
Budget
Actual
Operating Statement
OPERATING REVENUE
Rates
297,081
303,365
398,547
Other Income
60,708
15,157
80,062
Internal Interest Received
0
0
0
Development Contributions
0
0
0
Council Overheads (Income)
0
0
0
Total Operating Revenue
357,790
318,522
478,609
OPERATING EXPENDITURE
Employment Costs
51,345
52,482
52,135
Other Direct Expenditure
367,927
301,810
481,038
Internal Interest Paid
0
0
0
Council Overheads
3,528
3,529
3,396
Depreciation
6,571
7,500
6,571
Total Operating Expenditure
429,372
365,321
543,140
Operating Surplus (Deficit)
($71,582)
($46,800)
($64,531)
CAPITAL EXPENDITURE
Tourism
0
0
0
Economic Development
0
0
0
Total Capital Expenditure
$0
$0
$0
⌂
50
Annual Report 2013/14
Hanmer Springs Thermal Pools and Spa
Hanmer Springs Thermal Pools and Spa cover one activ-
• $181,769 on further costs towards the Discharge
ity:
Bore
1. Hanmer Springs Thermal Pools and Spa (Pools, Spa,
• $345,711 spent during the year on the work on the
i-site, café)
I-site and the Changing Room Upgrade.
Our aim
Internal Borrowing
To be a national y and international y recognised quality
• At the start of the financial year, the level of internal
visitor destination.
borrowing for Hanmer Springs Thermal Pools and
Spa was $10,698,003.
Achievement of levels of service
• The level of internal debt remained constant at
This activity has performance measures to describe the
$10,698,003 during the year.
service targets we were aiming for. These are set out in
• The amount of Internal Interest charged to the Han-
the following pages with a commentary on how we had
mer Springs Thermal Pools and Spa activity for the
performed at the end of the year (end of year results).
year was $936,075
Financial Commentary – 2013/14 Actual
Community outcomes to which this group of
compared with 2013/14 Budget
activities primarily contribute
Overal , an operating surplus of $1,248,148 was recorded
A place with a thriving local economy
against a budgeted operating surplus of $1,028,726. The
• We are seen as a good place to do business, to live
key variances from budget have been:
and to visit
• Other Income – income from the Hanmer Springs
Thermal Pools and Spa finished the year $165,784
A place where our traditional rural values and heritage
greater than the amount budgeted for.
make Hurunui unique
• Internal Interest – due to not undertaking the antic-
• People have a range of opportunities to participate
ipated level of Capital Expenditure during the year,
in leisure and culture activities
the level of internal debt had not changed and as a
• Our historic and cultural heritage is protected for
result, the internal interest charge is $43,750 lower
future generations
than budgeted for.
Financial Commentary – 2013/14 Actual
compared with 2012/13 Actual
This year’s operating surplus of $1,248,148 was $220,093
higher than the operating surplus recorded for the
2012/2013 year of $1,028,055. The key variance from last
year was:
• Other Income – due to a combination of higher
patronage and a price increase during the year,
the overall income from the activity increased by
$417,026 from 2012/2013.
• Employment Costs and Other Direct Expenditure –
overal , direct expenditure increased by $178,488.
Significant Capital Expenditure
Overal , $813,632 was recognised as Capital Expenditure
for the 2013/2014. This was still $156,368 lower than
was budgeted for, despite the Council carrying forward
a budget of $2 mil ion from the 2012/2013 year relating
to the upgrade of the changing room and the administra-
tion block. The key work carried out during the year was:
• $145,880 spent on a new Chlorine Gas Shed.
• $53,618 spent on building work on the Café.
51
⌂
Hurunui District Council
Goal
How we will achieve our goals
Performance measures
Manage and operate the thermal re-
Advertise, market and promote the
Customer numbers are maintained
serve complex to attract local, national complex.
or increased according to the annual
and international visitors.
projections of 3% growth in customer
numbers.
End of year result - Not met
Customer numbers were down 1% on last year as a result of the predicted fall off of Christchurch customers.
The loss of these customers was greater than forecast at 9%.
International customers increased by 1%
Goal
How we will achieve our goals
Performance measures
Manage the thermal reserve complex
Operate the complex to an approved
The thermal complex achieves an annu-
profitably.
business plan.
al surplus in line with the annual budget.
End of year result - Met
A surplus of $2,329,737 was recorded against a budget of $2,124,387
Goal
How we will achieve our goals
Performance measures
Maintain the complex so that it is in
Protect the thermal water to ensure an Bore water consumption levels are with-
good condition for future generations.
ongoing supply.
in the consent limits at no more than
47.5 litres per second.
End of year result - Met
Water consumption levels are at 16.11 litres per second.
Customer numbers
2014
2013
nding June
Year e
2012
2011
514,000
516,000
518,000
520,000
522,000
524,000
526,000
528,000
530,000
532,000
534,000
Customers
⌂
52
Annual Report 2013/14
Bore water consumption
2014
2013
nding June
Series1
Year e
2012
13.5
14
14.5
15
15.5
16
16.5
Average litres per second
It is not unusual to have fluctuations from year to year as bore consumption is influenced by bather loading and
weather conditions.
Group Activity - Hanmer Springs Thermal Pools & Spa
2013/2014
2013/2014
2012/2013
Actual
Budget
Actual
Operating Statement
OPERATING REVENUE
Other Income
9,966,784
9,801,000
9,549,758
Total Operating Revenue
9,966,784
9,801,000
9,549,758
OPERATING EXPENDITURE
Employment Costs
3,704,932
3,760,122
3,568,773
Other Direct Expenditure
3,128,169
3,077,600
3,085,840
Internal Interest Paid
936,075
979,825
936,075
Council Overheads
135,720
135,727
132,290
Depreciation
813,739
819,000
798,725
Total Operating Expenditure
8,718,636
8,772,274
8,521,703
Operating Surplus (Deficit)
$1,248,148
$1,028,726
$1,028,055
CAPITAL EXPENDITURE
Hanmer Springs Thermal Pools & Spa
813,632
970,000
206,600
Total Capital Expenditure
$813,632
$970,000
$206,600
53
⌂
Hurunui District Council
Governance
Governance covers one activity:
Significant Capital Expenditure
1. Governance
Overal , $5,360 was recognised as Capital Expenditure
for the 2013/2014. There was no budget set; however,
Our aim
this was to provide Councillors with electronic devices
To provide support and leadership to the Hurunui com-
to improve communication. The budget allowed for the
munity and to ensure that the interests of residents and
replacement vehicle for the Mayor was not utilised.
communities are advanced by the Council taking a role
as ‘advocate’ on their behalf.
Internal Borrowing
This activity does not hold internal borrowings.
Achievement of levels of service
This activity has performance measures to describe the
Community outcomes to which this group of
service targets we were aiming for. These are set out in
activities primarily contribute
the following pages with a commentary on how we had
A desirable and safe place to live
performed at the end of the year (end of year results).
• We have attractive well designed townships
Financial Commentary – 2013/14 Actual
• Communities have access to adequate health and
emergency services and systems and resources are
compared with 2013/14 Budget
available to meet civil defence emergencies
Overal , an operating surplus of $58,941 was recorded
• Risks to public health are identified and appropriate-
against a breakeven budget for the year. The key vari-
ly managed
ances from budget have been:
• Other Direct Expenditure – the actual costs incurred
for travel ing expenses for the Councillors and the
final cost of the election was lower than was budget-
ed for.
Financial Commentary – 2013/14 Actual
compared with 2012/13 Actual
This year’s operating surplus of $58,941 was $46,366
lower than the operating surplus recorded for the
2012/2013 year of $105,307. The key variances from last
year were:
• Rates – the general rate component to Govern-
ance increased by $32,813 from last year. This was
increased during the budget process to allow for an
increase in Elected Members’ remuneration and a
higher allocation of staff time associated with the
Governance function. In addition, the rates were
increased to allow for the cost of the election.
• Employment Costs – this has increased due to a
greater allocation of staff time directly associated
with serving of the governance function.
⌂
54
Annual Report 2013/14
Goal
How we will achieve our goals
Performance measures
Represent the interests of the Hurunui
Undertake regular residents satisfaction Residents satisfaction with the overall
District communities.
survey.
performance of the Council is main-
tained or improved.
End of year result - Not met
The Council has run a resident satisfaction survey since 2007. Satisfaction levels have remained reasonably consistent
throughout that time. Satisfaction with the performance of the Mayor and Councillors was 77% satisfied in 2014 – the same
as in 2007 when the first survey was undertaken. The years in between have remained close to this percentage with the
lowest being 70% in 2008. Satisfaction with the performance of the Council over the last 12 months is consistent with 2013,
however it is marginally lower than 2009 - 2012. 75% in 2014, 78% in 2013. Satisfaction with the overall service received
from the Council Offices has been maintained since 2007 although, this year, 71% reported being satisfied which is lower than
in more recent years. (See table below.)
2007
2008
2009
2010
2011
2012
2013
2014
Satisfaction with performance of
77%
70%
75%
76%
76%
76%
76%
77%
Mayor and Councillors
Satisfaction with Performance of
n/a
78%
79%
83%
87%
84%
78%
75%
Hurunui District Council
Satisfaction with the overall service
received from the Council Offices
72%
77%
70%
78%
79%
78%
78%
71%
Group Activity - Governance
2013/2014
2013/2014
2012/2013
Actual
Budget
Actual
Operating Statement
OPERATING REVENUE
Rates
1,018,852
1,010,527
986,039
Other Income
21,328
21,000
19,089
Internal Interest Received
0
0
0
Total Operating Revenue
1,040,180
1,031,527
1,005,128
OPERATING EXPENDITURE
Employment Costs
479,109
455,114
417,147
Other Direct Expenditure
186,672
256,182
153,795
Council Overheads
310,764
310,767
324,654
Depreciation
4,695
9,464
4,225
Total Operating Expenditure
981,240
1,031,527
899,821
Operating Surplus (Deficit)
$58,941
$0
$105,307
CAPITAL EXPENDITURE
Council
5,360
36,372
5,283
Total Capital Expenditure
$5,360
$36,372
$5,283
55
⌂
Hurunui District Council
⌂
56
Annual Repor
4
t 2013/14 4
Financial Statements
Statement of comprehensive income .. .. .. .. .. .. .. .. .. .. .. .. .. .. .. .. .. .. .. .. .. .. .. .. .. .. .. .. .. .. .. .. .. .. .. .. .. .. .. .. .. ..58
Statement of changes in equity.. .. .. .. .. .. .. .. .. .. .. .. .. .. .. .. .. .. .. .. .. .. .. .. .. .. .. .. .. .. .. .. .. .. .. .. .. .. .. .. .. .. .. .. .. .. ..59
Statement of financial position .. .. .. .. .. .. .. .. .. .. .. .. .. .. .. .. .. .. .. .. .. .. .. .. .. .. .. .. .. .. .. .. .. .. .. .. .. .. .. .. .. .. .. .. .. .. ..60
Statement of cash flows .. .. .. .. .. .. .. .. .. .. .. .. .. .. .. .. .. .. .. .. .. .. .. .. .. .. .. .. .. .. .. .. .. .. .. .. .. .. .. .. .. .. .. .. .. .. .. .. .. .. .. ..61
Notes to the financial statements .. .. .. .. .. .. .. .. .. .. .. .. .. .. .. .. .. .. .. .. .. .. .. .. .. .. .. .. .. .. .. .. .. .. .. .. .. .. .. .. .. .. .. .. ..62
Funding impact statements .. .. .. .. .. .. .. .. .. .. .. .. .. .. .. .. .. .. .. .. .. .. .. .. .. .. .. .. .. .. .. .. .. .. .. .. .. .. .. .. .. .. .. .. .. .. .. .. ..100
57
⌂
Hurunui District Council
SSTtAaTteme
EMENT OF n
COt o
MPR f c
EHEN om
SIVE INp
C r
O e
ME hensive income
FOR THE YEAR ENDED 30 JUNE 2014
Group
Council
Actual
Actual
Actual
Budget
Actual
Notes
2014
2013
2014
2014
2013
$000's
$000's
$000's
$000's
$000's
Revenue
Total rates revenue, excluding targeted water supply rates 3
14,399
13,578
14,399
13,932
13,578
Fees, charges, and targeted rates for water supply
3
659
1,125
659
471
1,125
Development Contributions
3
472
1,145
472
390
1,145
Investment income
3
188
137
188
74
137
Subsidies and grants
3
5,153
3,499
5,153
3,388
3,499
Hanmer Springs Thermal Pools & Spa
3
9,967
9,503
9,967
9,801
9,503
Vested Asset Income
3
1,010
2,429
1,010
227
2,429
Other Income
3
6,770
3,371
6,770
3,071
3,371
Gains/(Losses) on Forestry Revaluation
13
(1,788)
401
(1,788)
13
401
Gains/(Losses) on NZ Emissions Units
11
25
(54)
25
0
(54)
36,854
35,134
36,854
31,367
35,134
Less Expenditure
Employee Benefits
4
9,933
9,334
9,933
9,895
9,334
Direct Expenditure
5
20,059
15,510
20,059
15,431
15,510
Finance Expenses
5
508
320
508
1,222
320
Depreciation, Amortisation and Loss on Disposal
5
8,213
7,197
8,213
6,298
7,197
Total Operating Expenditure
38,712
32,361
38,712
32,846
32,361
Operating Surplus/(Deficit) before tax
(1,858)
2,773
(1,858)
(1,479)
2,773
Share of associates surplus/(deficit)
16
(3)
1
0
0
0
Net Surplus/(Deficit) before tax
(1,861)
2,774
(1,858)
(1,479)
2,773
Tax Expense
6
0
0
0
0
0
Net Surplus/(Deficit) after tax
(1,861)
2,774
(1,858)
(1,479)
2,773
Add Other Comprehensive Income
Gains/(Losses) on Asset Revaluation
10
4,163
16,505
4,163
4,938
16,505
Gains/(Losses) in Fair Value of Shares
121
41
121
0
41
4,283
16,546
4,283
4,938
16,546
Total Compehensive Income
2,423
19,320
2,426
3,459
19,319
The accompanying notes from part of the financial statements
The accompanying notes form part of the financial statements
⌂
58
Annual Repor
4
t 2013/14 4
SSTta
AT t
E e
ME m
NT ent
OF C o
HANG f
E chang
S IN EQUITY es in equity
FOR THE YEAR ENDED 30 JUNE 2014
Group
Council
Actual
Actual
Actual
Budget
Actual
Notes
2014
2013
2014
2014
2013
$000's
$000's
$000's
$000's
$000's
Equity at Start of Year
353,537
334,217
353,323
339,556
334,004
Add Total Comprehensive Income for Year
2,423
19,320
2,426
3,459
19,319
Equity at End of Year
23
355,960
353,537
355,749
343,015
353,323
The accompanying notes form part of the financial statements
59
The accompanying notes from part of the financial statements
⌂
Hurunui District Council
Statement of financial position
STATEMENT OF FINANCIAL POSITION
AS AT 30 JUNE 2014
Group
Council
Actual
Actual
Actual
Budget
Actual
Notes
2014
2013
2014
2014
2013
$000's
$000's
$000's
$000's
$000's
Assets
Current Assets
Cash and cash equivalents
7
4,075
1,786
4,075
37
1,786
Trade and other receivables
8
3,442
2,290
3,442
2,181
2,290
Inventories
143
155
143
204
155
Non-current assets held for sale
9
305
305
305
324
305
Total current assets
7,964
4,536
7,964
2,746
4,536
Non-current assets
Property, plant and equipment
- Operational
10
45,219
41,238
45,219
45,978
41,238
- Restricted
10
37,322
35,941
37,322
45,550
35,941
- Infrastructure
10
286,513
287,160
286,513
272,926
287,160
Intangible assets
11
140
147
140
80
147
Forestry assets
13
950
2,738
950
2,363
2,738
Other financial assets
15
617
374
617
339
374
Investments in associates
16
211
214
0
0
0
Total non-current assets
370,972
367,812
370,761
367,236
367,598
Total assets
378,936
372,348
378,725
369,982
372,134
Liabilities
Current liabilities
Trade and other payables
18
3,826
3,539
3,826
4,183
3,539
Landfil aftercare provision
20
8
8
8
8
8
Employee benefits
21
1,122
1,054
1,122
0
1,054
Current portion of term debt
22
2,000
0
2,000
0
0
Current portion of derivative financial instruments
14
1
11
1
0
11
Income in advance
19
1,683
1,444
1,683
997
1,444
Total current liabilities
8,639
6,056
8,639
5,188
6,056
Non-current liabilities
Term debt
22
14,200
12,350
14,200
21,000
12,350
Landfil aftercare provision
20
116
120
116
779
120
Employee benefits
21
47
35
47
0
35
Derivative financial instruments
14
(26)
250
(26)
0
250
Total non-current liabilities
14,338
12,755
14,338
21,779
12,755
Total liabilities
22,977
18,811
22,977
26,967
18,811
Net assets
355,960
353,537
355,749
343,015
353,323
Equity
Asset revaluation reserve
23
199,695
195,532
199,695
189,563
195,532
AFS investments revaluation reserve
23
257
136
257
92
136
Special fund reserves
23
2,015
1,975
2,015
972
1,975
Rate reserve funds
23
(24,261)
(23,428)
(24,261)
(21,947)
(23,428)
Retained earnings
23
178,254
179,322
178,043
174,335
179,108
Total Equity
355,960
353,537
355,749
343,015
353,323
The acTcomp
he ac a
c ny
om ing no
panyi tes f
ng not or
es m p
fr
a
om rt o
partf th
of te fin
he fi anci
nanc a
i l s
al t
stat
at em
em en
ent t
ss
⌂
60
Annual Repor
4
t 2013/14 4
Statement of cash flows
STATEMENT OF CASH FLOWS
FOR THE YEAR ENDED 30 JUNE 2014
Group
Council
Actual
Actual
Actual
Budget
Actual
Notes
2014
2013
2014
2014
2013
$000's
$000's
$000's
$000's
$000's
Cash flows from operating activities
Revenue
36,569
32,180
36,569
30,979
32,180
Agency receipts
3,006
2,857
3,006
2,243
2,857
Interest received
60
54
60
0
54
Dividends received
128
83
128
74
83
Payments to suppliers and employees
(29,925)
(25,039)
(29,925)
(25,175)
(25,039)
Interest and other costs of finance paid
(832)
(2,084)
(832)
(1,223)
(2,084)
Agency payments
(3,006)
(720)
(3,006)
(2,243)
(720)
Net GST Movement
(178)
233
(178)
0
233
Net cash from operating activities
24
5,822
7,564
5,822
4,655
7,564
Cash flows from investing activities
Payment on Loan
0
0
0
0
0
Proceeds from the sale of plant, property & equipment
0
246
0
0
246
Proceeds on sale of investments
101
5
101
0
5
Insurance recoveries
0
204
0
0
204
Payment for purchase of investments
(121)
0
(121)
0
0
Payment for plant, property & equipment
(7,363)
(7,658)
(7,363)
(6,993)
(7,658)
Net cash from investing activities
(7,383)
(7,203)
(7,383)
(6,993)
(7,203)
Cash flows from financing activities
Proceeds from the issue of debt securities
3,850
5,900
3,850
2,250
5,900
Repayment of loans
0
(5,550)
0
0
(5,550)
Net cash from financing activities
3,850
350
3,850
2,250
350
Increase/(decrease) in cash & cash equivalents
2,289
711
2,289
(88)
711
Cash and cash equivalents as 1 July
1,786
1,075
1,786
124
1,075
Cash and cash equivalents as 30 June
4,075
1,786
4,075
36
1,786
The GST (net) component of operating activities reflect the net GST paid and received with the Inland Revenue Department.
The GST (net) component has been presented on a net basis, as the gross amounts do not provide meaningful information
for financial statement purposes.
The accompanying notes form part of the financial statements
61
The accompanying notes from part of the financial statements
⌂
Hurunui District Council
Notes to the financial statements
Note 1: Statement of Accounting Policies for the
sand dol ars ($’000). The functional currency of the HDC
year ended 30 June 2014
is New Zealand dol ars.
Reporting Entity
Changes in accounting policies
Hurunui District Council is a territorial local authority as
There have been no changes in accounting policies dur-
governed by the Local Government Act 2002 and is dom- ing the financial year.
iciled in New Zealand.
Standards, amendments and interpretations issued
The Hurunui District Council group consists of the ulti-
that are not yet effective and have not been early
mate parent Hurunui District Council (HDC) and its sub-
adopted
sidiary Hurunui Holdings Limited (HHL) (100% owned),
Standards, amendments, and interpretations issued but
associate Enterprise North Canterbury (50% equity
not yet effective that have not been early adopted, and
share) and Canterbury Economic Development Company which are relevant to the Council and group, are:
Limited (10%) and Transwaste Canterbury Limited (1.2%). • NZ IFRS 9 Financial Instruments will eventual y
All HDC subsidiaries and associates are incorporated and
replace NZ IAS 39 Financial Instruments: Recogni-
domiciled in New Zealand.
tion and Measurement. NZ IAS 39 is being replaced
through the following 3 main phases: Phase 1 Clas-
The primary objective of HDC is to provide goods and
sification and Measurement, Phase 2 Impairment
services for the community or social benefit rather than
Methodology, and Phase 3 Hedge Accounting. Phase
making a financial return.
1 on the classification and measurement of financial
assets has been completed and has been published
Accordingly, HDC has designated itself and the group as
in the new financial instrument standard NZ IFRS
public benefit entities for the purposes of New Zealand
9. NZ IFRS 9 uses a single approach to determine
equivalents to International Financial Reporting Stand-
whether a financial asset is measured at amortised
ards (“NZ IFRS”).
cost or fair value, replacing the many different rules
in NZ IAS 39. The approach in NZ IFRS 9 is based on
The administrative seat of HDC is situated at Amberley.
how an entity manages its financial instruments
The financial statements of HDC are for the year ended
(its business model) and the contractual cash flow
30 June 2014 and were authorised for issue by HDC on
characteristics of the financial assets. The financial
30 October 2014.
liability requirements are the same as those of NZ
Basis of Preparation
IAS 39, except for when an entity elects to designate
a financial liability at fair value through the surplus/
Statement of compliance
deficit. The new standard is required to be adopted
The financial statements for HDC have been prepared
for the year ended 30 June 2016. However, as a new
in accordance with the requirements of the Local Gov-
Accounting Standards Framework will apply before
ernment Act 2002, which includes the requirement to
this date, there is no certainty when an equivalent
comply with New Zealand general y accepted accounting
standard to NZ IFRS 9 will be applied by public bene-
practice (“NZ GAAP”).
fit entities.
The financial statements have been prepared in accord-
The Minister of Commerce has approved a new Ac-
ance with NZ GAAP. They comply with NZ IFRS and other counting Standards Framework (incorporating a Tier
applicable financial reporting standards as appropriate
Strategy) developed by the External Reporting Board
for public benefit entities.
(XRB). Under this Accounting Standards Framework, the
Council is classified as a Tier 1 reporting entity and it will
Measurement base
be required to apply full Public Benefit Entity Accounting
The financial statements have been prepared on the his-
Standards (PAS). These standards are being developed
torical cost basis, modified by the revaluation of certain
by the XRB based on current International Public Sector
assets.
Accounting Standards. The effective date for the new
standards for public sector entities is expected to be
Functional and presentation currency
for reporting periods beginning on or after 1 July 2014.
The financial statements are presented in New Zealand
This means the Council expects to transition to the
dol ars and all values are rounded to the nearest thou-
new standards in preparing its 30 June 2015 financial
statements. As the PAS are still under development, the
⌂
62
Annual Repor
4
t 2013/14 4
Council is unable to assess the implications of the new
Associates
Accounting Standards Framework at this time.
HDC accounts for an investment in an associate in the
group financial statements using the equity method. An
Due to the change in the Accounting Standards Frame-
associate is an entity over which the HDC has significant
work for public benefit entities, it is expected that all
influence and that is neither a subsidiary nor an inter-
new NZ IFRS and amendments to existing NZ IFRS will
est in a joint venture. The investment in an associate is
not be applicable to public benefit entities. Therefore,
initial y recognised at cost and the carrying amount is
the XRB has effectively frozen the financial reporting
increased or decreased to recognise HDC’s share of the
requirements for public benefit entities up until the new surplus or deficit of the associate after the date of acqui-
Accounting Standard Framework is effective. Accordingly, sition. HDC’s share of the surplus or deficit of the associ-
no disclosure has been made about new or amended NZ ate is recognised in HDC’s statement of comprehensive
IFRS that exclude public benefit entities from their scope. income. Distributions received from an associate reduce
the carrying amount of the investment.
Significant Accounting Policies
Basis of Consolidation
If HDC’s share of an associate’s deficit equals or exceeds
The purchase method is used to prepare the consolidat-
its interest in the associate, HDC discontinues recog-
ed financial statements, which involves adding together
nising its share of further deficits. After HDC’s interest
like items of assets, liabilities, equity, income and ex-
is reduced to zero, additional deficits are provided for,
penses on a line-by-line basis. All significant intra-group
and a liability is recognised, only to the extent that HDC
balances, transactions, income and expenses are elimi-
has incurred legal or constructive obligations or made
nated on consolidation.
payments on behalf of the associate. If the associate
subsequently reports surpluses, HDC will resume recog-
Subsidiaries
nising its share of those surpluses only after its share of
HDC consolidates its subsidiaries in the group financial
surpluses equals the share of deficits not recognised.
statements all entities where HDC has the capacity to
control their financing and operating policies so as to ob- HDC’s share in the associate’s surplus or deficits resulting
tain benefits from the activities of the entity. This power from unrealised gains on transactions between the HDC
exists where HDC controls the majority voting power on
and its associates is eliminated.
the governing body or where such policies have been
irreversibly predetermined by HDC or where the deter-
HDC’s investments in associates are carried at cost in
mination of such policies is unable to material y impact
HDC’s own “parent entity” financial statements.
the level of potential ownership benefits that arise from
the activities of the subsidiary.
Revenue
Revenue is measured at the fair value of consideration
HDC measures the cost of a business combination as the received.
aggregate of the fair values, at the date of exchange, of
assets given, liabilities incurred or assumed, in exchange
Rates revenue
for control of the subsidiary plus any costs directly attrib- Rates are set annual y by a resolution from HDC and re-
utable to the business combination.
late to a financial year. All ratepayers are invoiced within
the financial year to which the rates have been set. Rates
Any excess of the cost of the business combination over
revenue is recognised when payable. Rates col ected on
HDC’s interest in the net fair value of the identifiable
behalf of the Canterbury Regional Council (ECan) are not
assets, liabilities and contingent liabilities is recognised
recognised in the financial statements as HDC is acting as
as goodwil . If HDC’s interest in the net fair value of the
an agent for ECan.
identifiable assets, liabilities and contingent liabilities
recognised exceeds the cost of the business combina-
Water revenue
tion, the difference will be recognised immediately in the Water Bil ing is recognised on volumes delivered on
surplus or deficit.
accrual basis.
Investments in subsidiaries are valued as available for
Land Transport New Zealand subsidies
sale investments in HDC’s own “parent entity” financial
Land Transport New Zealand roading subsidies are
statements.
recognised as revenue upon entitlement which is when
63
⌂
Hurunui District Council
conditions pertaining to eligible expenditure have been
tax is calculated using rates that have been enacted or
fulfilled.
substantively enacted at balance date.
Contract revenue
Deferred tax is the amount of income tax payable or
Revenue from a contract to provide services is recog-
recoverable in future periods in respect of temporary
nised by reference to the stage of completion of the
differences and unused tax losses. Temporary differences
contract at the balance sheet date based on the actual
are differences between the carrying amount of assets
service provided as a percentage of total services to be
and liabilities in the financial statements and the corre-
provided.
sponding tax bases in the computation of taxable profit.
User charges
Deferred tax liabilities are general y recognised for tax-
Sales of goods are recognised when the significant risks
able temporary differences and deferred tax assets are
and rewards of ownership of the assets have been trans-
recognised to the extent that it is probable that taxable
ferred to the buyer which is usual y when the goods are
profits will be available against which deductible tempo-
delivered and title has passed.
rary differences can be utilised.
Interest revenue
Deferred tax is not recognised if the temporary differ-
Interest income is accrued on a time basis, by reference
ence arises from the initial recognition of goodwill or
to the principal outstanding and at the effective interest
from the initial recognition of an asset and liability in a
rate applicable.
transaction that is not a business combination, and at
the time of the transaction, affects neither the account-
Dividend revenue
ing profit nor taxable profit.
Dividend income from investments is recognised as rev-
enue, net of imputation credits, when the shareholders’
Deferred tax is recognised on taxable temporary differ-
rights to receive payment have been established.
ences arising on investments in subsidiaries and associ-
ates, and interests in joint ventures, except where the
Other revenue
company can control the reversal of the temporary dif-
Other revenue including assets vested in HDC, with or
ference and it is probable that the temporary difference
without restrictions, is recognised as revenue when con-
will not reverse in the foreseeable future.
trol over the assets is obtained.
Deferred tax is calculated at the tax rates that are ex-
Development contributions
pected to apply in the period when the liability is settled
Development contributions are recognised as revenue
or the asset is realised, using tax rates that have been
when the HDC provides, or is able to provide, the ser-
enacted or substantial y enacted by balance date.
vice for which the contribution was charged. Otherwise
development contributions are recognized as liabilities
Current tax and deferred tax is charged or credited to
until such time the HDC provides, or is able to provide,
the surplus or deficit, except when it relates to items
the service.
charged or credited directly to equity, in which case the
tax is dealt with in equity.
Development contributions are classified as part of “Oth-
er Revenue”.
Leases
Operational leases
Borrowing costs
An operating lease is a lease that does not transfer
All borrowing costs are recognised as expenses in the
substantial y all the risks and rewards incidental to own-
statement of comprehensive income in the period in
ership of an asset. Lease payments under an operating
which they are incurred.
lease are recognised on a straight-line basis over the
lease term.
Income tax
Income tax in relation to the surplus or deficit for the
period comprises current tax and deferred tax.
Cash and cash equivalents
Current tax is the amount of income tax payable on the
Cash and cash equivalents comprise cash in hand, de-
taxable profit for the current year, plus any adjustments
mand deposits and other short-term highly liquid invest-
to income tax payable in respect of prior years. Current
ments that are readily convertible to a known amount
of cash and are subject to an insignificant risk of changes
⌂
64
Annual Repor
4
t 2013/14 4
in value, and with original maturities of three months or
Where securities are held for trading purposes, gains
less.
and losses arising from changes in fair value are included
in the surplus or deficit for the period.
Trade and other receivables
Trade and other receivables are initial y measured at fair For available-for-sale investments, gains and losses aris-
value and subsequently measured at amortised cost us-
ing from changes in fair value are recognised directly in
ing the effective interest rate method, less any provision equity, until the security is disposed of or is determined
for impairment.
to be impaired, at which time the cumulative gain or loss
previously recognised in equity is included in the surplus
Inventories
or deficit for the period.
Inventories are stated at the lower of cost and net real-
isable value. Cost comprises direct materials and, where
Impairment of investments
applicable, directs labour costs and those overheads that An impairment loss is recognised in the surplus or deficit
have been incurred in bringing the inventories to their
when there is objective evidence that the asset is im-
present location and condition. Cost is calculated using
paired, and is measured as the difference between the
the weighted average method.
investment’s carrying amount and the present value of
estimated future cash flows discounted at the effective
Net realisable value represents the estimated sel ing
interest rate computed at initial recognition. Impair-
price less all estimated costs of completion and costs to
ment losses are reversed in subsequent periods when
be incurred in marketing, sel ing and distribution.
an increase in the investment’s recoverable amount can
be related objectively to an event occurring after the
Financial Assets
impairment was recognised, subject to the restriction
The Group classifies its financial assets into the follow-
that the carrying amount of the investment at the date
ing four categories: financial assets at fair value through
the impairment is reversed shall not exceed what the
profit or loss, held to maturity investments, loans and
amortised cost would have been had the impairment not
receivables and financial assets at fair value through
been recognised.
equity.
Derivative financial instruments
The classification depends on the purpose for which the
The Group uses derivative financial instruments (primar-
investments were acquired. Management determines
ily interest rate hedges) to hedge the risks associated
the classification of its investments at initial recognition
with interest rate movements. The use of financial deriv-
and re-evaluates the designation every reporting date.
atives is governed by the Group’s policies approved by
the HDC and the HHL board of directors, which provide
Financial assets and liabilities are initial y measured at
written principles on the use of financial derivatives con-
fair value plus transaction costs unless they are carried
sistent with the Group’s risk management strategy. The
at fair value through profit and loss in which case trans-
Group does not use derivative financial instruments for
action costs are recognised in the surplus or deficit.
speculative purposes.
Investments
Such derivatives are initial y recorded at fair value on
Investments are recognised on a trade-date basis and
contract date and are adjusted to fair value at subse-
are initial y measured at fair value, including transaction
quent reporting dates. Changes in the fair value of deriv-
costs. At subsequent reporting dates, debt securities that ative financial instruments are recognised in the surplus
the Group has the expressed intention and ability to hold or deficit as they arise.
to maturity (held-to-maturity debt securities) are meas-
ured at amortised cost using the effective interest rate
Non-current assets held for sale
method, less any impairment loss recognised to reflect
Non-current assets are classified as held for sale if their
irrecoverable amounts.
carrying amount will be recovered principal y through a
sale transaction, not through continuing use. Non-cur-
Investments other than held-to-maturity debt securities
rent assets held for sale are measured at the lower of
are classified as either held-for-trading or available-for
their carrying amount and fair value less costs to sel .
sale, and are measured at subsequent reporting dates at
fair value.
Any impairment losses for write downs or non-current
assets held for sale are recognised in the surplus or defi-
cit. Any increase in fair value (less costs to sel ) is recog-
65
⌂
Hurunui District Council
nised up to the level of any impairment losses that have
will flow to the Group and the cost can be measured
been previously recognised.
reliably.
Non-current assets (including those that are part of a
Revaluation
disposal group) are not depreciated or amortised while
An asset’s fair value at the date of revaluation is equal
they are classified as held for sale. Interest and other
to the revalued amount. Revaluations are performed
expenses attributable to the liabilities of a disposal group with sufficient regularity such that the carrying amount
classified as held for sale continue to be recognised.
does not differ material y from that which would be
determined using fair values at balance date and this is
Property, plant & equipment
general y every three years.
Property, plant and equipment consists of:
• Operational assets — These include land, buildings,
Revaluation increments and decrements are credited or
landfill post closure, library books, plant and equip-
debited to the asset revaluation reserve for that class of
ment, and motor vehicles.
asset. Where this results in a debit balance in the asset
• Restricted assets — Restricted assets are parks and
revaluation reserve, this balance is expensed in the sur-
reserves owned by HDC which provide a benefit or
plus or deficit. Any subsequent increase on revaluation
service to the community and cannot be disposed of that offsets a previous decrease in value is recognised in
because of legal or other restrictions.
the surplus or deficit. Any increase will be recognised up
• Infrastructure assets — Infrastructure assets are the to the amount previously expensed, and then credited to
fixed utility systems owned by HDC. Each asset class the revaluation reserve for that class of asset.
includes all items that are required for the network.
Operational Land and Buildings
Property, Plant and Equipment are at stated values less
Land and Buildings were valued by QV Limited (Regis-
accumulated depreciation and impairment losses.
tered Valuers) as at 30 June 2014. The basis of valuation
is fair value with reference to highest and best use, as at
Fixtures and Fittings, Motor Vehicles, Plant and Equip-
30 June 2014. They are stated at valuation less accumu-
ment, and Library Books are stated at cost less accumu-
lated depreciation and accumulated impairment.
lated depreciation and impairment losses.
Properties in the course of construction for production,
Additions
rental or administrative purposes, or for purposes not
The cost of an item of property, plant and equipment is
yet determined, are carried at cost, less any recognised
recognised as an asset if, and only if, it is probable that
impairment loss. Cost includes professional fees.
future economic benefits or service potential associated
with the item will flow to the Group and the cost of the
Subsequent costs are included in the asset’s carrying
item can be measured reliably.
amount or recognised as a separate asset, as appro-
priate, only when it is probable that future economic
In most instances, an item of property, plant and equip-
benefits associated with the item will flow to HDC and
ment is recognised at its cost. Where an asset is acquired the cost of the item can be measured reliably. All oth-
at no cost, or for a nominal cost, it is recognised at fair
er repairs and maintenance are charged to the surplus
value as at the date of acquisition.
or deficit during the financial period in which they are
incurred.
Disposals
Gains and losses on disposals are determined by com-
Restricted Assets
paring the proceeds with the carrying amount of the
Certain infrastructure assets and land have been vest-
asset. Gains and losses on disposals are recognised in
ed in HDC as part of the subdivisional consent process.
the surplus or deficit. When revalued assets are sold,
The vested reserve land has been initial y recognised
the amounts included in asset revaluation reserves in
at the most recent appropriately certified government
respect of those assets are transferred to retained earn-
valuation. Vested infrastructure assets have been valued
ings.
based on the estimated quantities of infrastructure com-
ponents vested and the current “in the ground” cost of
Subsequent Costs
providing identical services.
Costs incurred subsequent to initial acquisition are
capitalised only when it is probable that future economic
Infrastructural asset classes; roads, water reticulation,
benefits or service potential associated with the item
sewerage reticulation and stormwater systems
⌂
66
Annual Repor
4
t 2013/14 4
Infrastructural assets are recorded at valuation estab-
See table on page 70.
lished using depreciated replacement cost, plus additions
at cost less accumulated depreciation and accumulated
Intangible assets
impairment losses. The revaluation of infrastructural
Software acquisition and development
assets is carried out on a three yearly cycle.
Acquired computer software licenses are capitalised on
the basis of the costs incurred to acquire and bring to
The roading valuation includes land under the road-
use the specific software.
ing network. The valuation of this land is based on the
average rateable value of land in the associated ward as
Costs associated with maintaining computer software
determined by QV Valuations (Registered Valuers) as at
are recognised as an expense when incurred. Costs that
30 June 2005. Under NZ IFRS HDC has elected to use the
are directly associated with the development of software
fair value of the land under roads as at 30 June 2005 at
for internal use by the Group are recognised as an intan-
deemed cost. Land under roads is no longer revalued.
gible asset. Direct costs include the software develop-
ment employee costs and an appropriate portion of the
Roading assets have been valued at depreciated re-
relevant overheads.
placement cost as at 30 June 2013. The valuation was
performed internal y by HDC’s Roading Engineer – Asset
Carbon Credits
Management, J Whyte and peer reviewed by George
Carbon Credits acquired by way of a government grant
Jason Smith, BE(NSW), MIPENZ(Civil), CPEng, Principal
are initial y recognised at the date of entitlement at fair
Asset Management Consultants for AECOM New Zealand value. Subsequent to initial recognition, carbon credits
Limited. Additions and disposals after the date of valua-
are measured at the original fair value less any accumu-
tion will be recorded at cost.
lated impairment losses.
Water, Sewerage, Stormwater and Drainage Assets
Carbon credits have an indefinite useful life and are
have been valued at depreciated replacement cost as at
tested for impairment annual y or when an indication of
30 June 2012. The valuation was performed internal y
impairment exists. The useful life of carbon credits with
by HDC’s Technical Officer - Utilities, D Perry and peer
an indefinite life is reviewed each reporting period to de-
reviewed by M Clough, Registered Valuer of Beca Valu-
termine whether the indefinite life assessment continues
ations Limited. Additions and disposals since the date of
to be supportable.
valuation have been recorded at cost.
Amortisation
Certain infrastructural assets have been vested in HDC as The carrying value of intangible assets with a finite life
part of the subdivision consent process. Vested infra-
is amortised on a straight-line basis over its useful life.
structure assets have been valued based on the estimat-
Amortisation begins when the assets is available for use
ed quantities of the components vested in HDC.
and ceases at the date that the asset is de-recognised.
The amortisation charge for each period is recognised in
Depreciation
the surplus or deficit.
Depreciation is provided on a straight line basis on all
property, plant and equipment and intangible assets oth- The useful lives and associated amortisation rates of
er than land and heritage assets, at rates which will write major classes of intangible assets have been estimated
off the cost (or valuation) of the assets to their estimated as follows:
residual values over their useful lives. Depreciation of
these assets commences when the assets are ready for
Computer software
3 – 4 years
25 – 33%
their intended use.
Aerial Photos
10 years
10%
Depreciation on revalued assets is charged to the surplus Forestry assets
or deficit. On the subsequent sale or retirement of a re-
Forestry and other biological assets are stated at fair
valued asset, the attributable revaluation surplus remain- value less estimated point-of-sale costs, with any result-
ing in the properties revaluation reserve is transferred
ant gain or loss recognised in the statement of compre-
directly to retained earnings.
hensive income. Point-of-sale costs include all costs that
would be necessary to sell the assets, excluding costs
The gain or loss arising on the disposal or retirement of
necessary to transport the assets to market.
an asset is determined as the difference between the
sales proceeds and the carrying amount of the asset and The fair value of standing timber older than 10 years,
is recognised in the surplus or deficit.
being the age at which it becomes marketable, is based
67
⌂
Hurunui District Council
on the market price of the estimated recoverable wood
For assets not carried at a revalued amount (other than
volumes, net of harvesting costs. The fair value of
goodwil ), the reversal of an impairment loss is recog-
younger standing timber is based on the present value
nised in the surplus or deficit.
of the net cash flows expected to be generated by the
plantation at maturity. The present values are calculated Creditors and other payables
using a pre-tax discount rate that reflects current market Creditors and other payables are initial y measured at
assessments of the time value of money and the risks
fair value and subsequently measured at amortised cost.
specific to the asset.
Borrowings
Forests are valued annual y by Laurie Forestry Ltd. Any
Borrowings are initial y measured at fair value of net
increase or decrease in the valuation is reflected in the
transaction costs and subsequently measured at amor-
surplus or deficit.
tised cost using the effective interest method.
Impairment of property, plant, and equip-
Borrowings are classified as current liabilities unless HDC
ment and intangible assets
or group has an unconditional right to defer settlement
Intangible assets that have an indefinite useful life, or
of the liability for at least 12 months after balance date.
are not yet available for use, are not subject to amorti-
sation and are tested annual y for impairment. Assets
Employee Entitlements
that have a finite useful life are reviewed for impairment Provision is made in respect of the Group’s liability for
whenever events or changes in circumstances indicate
retiring gratuity allowances, annual and long service
that the carrying amount may not be recoverable. An im- leave, and sick leave.
pairment loss is recognised for the amount by which the
asset’s carrying amount exceeds its recoverable amount. Short-term benefits - Employee benefits that HDC ex-
The recoverable amount is the higher of an asset’s fair
pects to be settled within 12 months of balance date are
value less costs to sell and value in use.
measured at nominal values based on accrued entitle-
ments at current rates of pay.
Value in use is depreciated replacement cost for an asset
where the future economic benefits or service potential
These include salaries and wages accrued up to bal-
of the asset is not primarily dependent on the asset’s
ance date, annual leave earned to, but not yet taken at
ability to generate net cash inflows and where the Coun-
balance date, retiring and long service leave entitlements
cil or group would, if deprived of the asset, replace its
expected to be settled within 12 months, and sick leave.
remaining service potential.
HDC recognises a liability for sick leave to the extent that
The value in use for cash-generating assets and
absences in the coming year are expected to be greater
cash-generating units is the present value of expected
than the sick leave entitlements earned in the coming
future cash flows.
year. The amount is calculated based on the unused sick
leave entitlement that can be carried forward at balance
If an asset’s carrying amount exceeds its recoverable
date, to the extent that HDC anticipates it will be used by
amount, the asset is impaired and the carrying amount
staff to cover those future absences.
is written down to the recoverable amount. For revalued
assets, the impairment loss is recognised against the
HDC recognises a liability and an expense for bonuses
revaluation reserve for that class of asset. Where that
where contractual y obliged or where there is a past
results in a debit balance in the revaluation reserve, the
practice that has created a constructive obligation.
balance is recognised in the surplus or deficit.
Long service leave and retiring gratuity - The retiring
For assets not carried at a revalued amount, the total im- gratuity and long service leave liability is assessed on
pairment loss is recognised in the surplus or deficit.
an actuarial basis using current rates of pay taking into
account years of service, years to entitlement and the
The reversal of an impairment loss on a revalued asset
likelihood staff will reach the point of entitlement.
is credited to other comprehensive income and increas-
es the asset revaluation reserve for that class of asset.
Provisions
However, to the extent that an impairment loss for that
Provisions are recognised when the Group has a pres-
class of asset was previously recognised in the surplus or ent obligation as a result of a past event (either legal or
deficit, a reversal of the impairment loss is also recog-
constructive), and it is probable that the Group will be
nised in the surplus or deficit.
required to settle that obligation. Provisions are meas-
⌂
68
Annual Repor
4
t 2013/14 4
ured at management’s best estimate of the expenditure
‘Indirect costs’ are those costs, which cannot be identi-
required to settle the obligation at balance date, and are fied in an economical y feasible manner with a specific
discounted to present value where the effect is material. significant activity.
Provisions are not recognised for future operating losses. The costs of internal services not directly charged to ac-
As operator of the Waikari Landfil , HDC has a legal ob-
tivities are allocated as overheads using appropriate cost
ligation under the resource consent to provide ongoing
drivers such as actual usage, staff numbers and the like.
maintenance and monitoring services at the landfill site
after closure. A provision for post-closure costs is recog-
Critical accounting estimates and assump-
nised as a liability when the obligation for post-closure
tions
costs arises.
The preparation of financial statements in conformity
with NZ IFRS requires management to make judgments,
The provision is measured based on the present value
estimates and assumptions that affect the application of
of future cash flows expected to be incurred, taking into
policies and reported amounts of assets and liabilities,
account future events including new legal requirements, income and expenses. The estimates and associated
and known improvements in technology, where there
assumptions are based on historical experience and
is sufficient evidence that these events will occur. The
various other factors that are believed to be reasonable
provision includes all other costs associated with landfill
under the circumstances, the results of which form the
post-closure.
basis of making the judgments about carrying values of
assets and liabilities that are not readily apparent from
Amounts provided for landfill post-closure are capital-
other sources.
ised to the landfill asset where they give rise to future
economic benefits to be obtained. Components of the
Critical judgments in applying accounting
capitalised landfill asset are depreciated over their useful policies
lives. The discount rate used is a rate that reflects cur-
rent market assessments of the time value of money and Management has exercised the following critical judg-
the risks specific to the liability.
ments in applying the accounting policies for the period
ended 30 June 2014. Judgments have been made over
Goods and Services Tax
useful lives of property, plant and equipment and intan-
These financial statements have been prepared exclu-
gible assets, landfill after-care provision, probability of
sive of GST, except for receivables and payables, which
reaching vesting date for long service liability, sick leave
are GST inclusive. Where GST is not recoverable as an
provisions, valuations of infrastructural assets and the
input tax, it is recognised as part of the related asset or
long term effects on HDC’s assets as a result of the Can-
expense.
terbury earthquakes. Therefore, actual results may differ
from these estimates.
Budget Figures
The judgments and underlying assumptions are reviewed
The budget figures are those approved by HDC at the be- on an ongoing basis. Revisions to accounting estimates
ginning of the year after a period of consultation with the are recognised in the period to which the estimate is re-
public as part of the Long Term Council Community Plan
vised if the revision affects only that period or the period
(LTCCP) or Annual Plan process. The budget figures have
of the revision and future periods if the revision affects
been prepared in accordance NZ GAAP and are consist-
both current and future periods.
ent with the accounting policies adopted by HDC for the
preparation of the financial statements.
Cost Al ocation
HDC has derived the net cost of service for each signifi-
cant activity of HDC using a system of cost allocation.
Direct Costs are charged directly to significant activities.
Indirect costs are charged to significant activities based
on cost drivers and related activity/usage information.
‘Direct’ costs are those costs directly attributable to a
significant activity.
69
⌂
Hurunui District Council
Useful lives and depreciation rates
Useful Life
Depreciation Rate
Buildings - wooden (excluding properties intended for sale)
50 years
2%
Buildings - concrete (excluding properties intended for sale)
100 years
1%
Furniture and fittings: administration
5 years
20%
Furniture and fittings: pensioner flats
10 years
10%
Library books
3-8 years
12.5% - 33.33%
Computer hardware
3-4 years
25% - 33.33%
Motor vehicles
5 years
20%
Thermal pools - plant
5 years
20%
Thermal pools – development expenditure
20 – 100 years
1% - 5%
Plant and machinery (excluding HDC’s infrastructural assets)
10 years
10%
Small plant and machines
3 - 10 years
10 - 33.33%
Car parks
20 – 25 years
4 – 5%
Landscaping
10 – 50 years
2 – 10%
Roads, Streets and Bridges
- Land under roads
Not depreciated
0%
- Pavement formation
Not depreciated
0%
- Pavement layers (sealed)
100 years
1%
- Pavement layers (unsealed)
Not depreciated
0%
- Pavement surface (sealed)
Average 16 years
6.25%
- Pavement surface (unsealed)
12 years
8.33%
- Culverts
25 – 50 years
2 – 4%
- Kerb and channel
50 – 80 years
1.25 – 2%
- Footpaths
20 – 75 years
1.33 – 5%
- Bridges – timber
70 years
1.43%
- Bridges – concrete and other
100 years
1%
- Retaining walls
50 years
2%
- Traffic signs
12 years
8.33%
- Street lighting
15 – 25 years
4 – 6.67%
Sewerage
- Pipes
50 – 80 years
1.25 – 2%
- Pipes other
40 years
2.5%
- Pumps and controls
10 – 25 years
4 – 10%
- Manholes
50 – 80 years
1.25 – 2%
- Treatment plant
25 – 60 years
1.67 – 4%
Water
- Pipes
50 – 80 years
1.25 – 2%
- Pipes other
50 – 80 years
1.25 – 2%
- Reservoir and tanks
80 years
1.25%
- Pumps and controls
10 – 25 years
4 – 10%
- Pump stations/intakes
20 – 60 years
1.67 – 5%
- Treatment plant
10 – 80 years
1.25 – 10%
Drainage
3 - 10 years
10 - 33.33%
- Points
80 years
1.25%
- Lines
50 - 80 years
1.25 – 2%
⌂
70
Annual Repor
4
t 2013/14 4
Note 2: Summary of cost of services
Council
Actual
Budget
Actual
2014
2014
2013
$000's
$000's
$000's
Page Activities Revenue
16
Water Supplies
5,065
4,633
5,601
21
Sewerage
1,036
761
1,432
24
Roads and Footpaths
9,385
7,331
7,794
27
Stormwater and Drainage
602
410
1,097
29
Community Services and Facilities
2,753
2,606
3,545
37
Environment and Safety
5,149
4,968
4,958
49
District Promotion
358
319
479
51
Hanmer Springs Thermal Pools and Spa
9,967
9,801
9,550
54
Governance
1,040
1,032
1,005
Corporate Services
10,276
6,672
6,215
Total activity income
45,631
38,531
41,676
Less internal income
7,014
7,176
6,889
Total Activities Revenue
38,617
31,355
34,787
Gains/(Losses) on Forestry Revaluation
(1,788)
13
401
Gains/(Losses) on NZ Emissions Units
25
0
(54)
Total Revenue
36,854
31,368
35,134
Page Less Activities Expenditure
16
Water Supplies
5,728
4,909
5,505
21
Sewerage
1,469
1,853
1,302
24
Roads and Footpaths
9,807
6,697
6,828
27
Stormwater and Drainage
334
374
487
29
Community Services and Facilities
4,664
4,719
4,751
37
Environment and Safety
5,678
4,950
4,914
49
District Promotion
429
365
543
51
Hanmer Springs Thermal Pools and Spa
8,719
8,772
8,522
54
Governance
981
1,032
900
Corporate Services
7,916
6,352
5,498
Total activity expenditure
45,726
40,023
39,250
Less internal expenditure
7,014
7,176
6,889
Total Expenditure
38,712
32,847
32,361
Net Surplus/(Deficit) before tax
(1,858)
(1,479)
2,774
Tax Expense
0
0
0
Net Surplus/(Deficit) after tax
(1,858)
(1,479)
2,774
Add Other Comprehensive Income
(not recognised in Activities Revenue or Expenditure)
Gains/(Losses) on Asset Revaluation
4,163
4,938
16,505
Gains/(Losses) in Fair Value of Shares
121
0
41
Total Comprehensive Income
2,425
3,459
19,320
71
⌂
Hurunui District Council
Note 3: Revenue
Group
Council
Actual
Actual
Actual
Actual
2014
2013
2014
2013
$000's
$000's
$000's
$000's
Rates revenue
District wide rates
6,012
5,611
6,012
5,611
Rate penalties
98
86
98
86
Targeted rates
- Refuse
870
855
870
855
- Stormwater/Drainage
318
295
318
295
- Road Sealing
(5)
5
(5)
5
- Rural Fire
291
277
291
277
- Tourism
202
308
202
308
- Pool Inspections
36
33
36
33
- Medical Centres
249
185
249
185
- Amberley Library Rate
43
40
43
40
- Amenities
1,450
1,334
1,450
1,334
- Sewerage
720
633
720
633
- Water (excluding water supply rates)
4,114
3,915
4,114
3,915
Total rates revenue, excluding targeted water supply rates
14,399
13,578
14,399
13,578
Targeted water supply rates
499
362
499
362
Total annual rates income
14,898
13,940
14,898
13,940
Other revenue
Gains/(Losses) in Forestry Valuation
(1,788)
401
(1,788)
401
Gains/(Losses) on NZ Emissions Units
25
(54)
25
(54)
Gains/(Losses) on Sale of Assets
31
26
31
26
Fees and charges for water supplies
160
763
160
763
Vested Asset Income
1,010
2,429
1,010
2,429
Interest
60
54
60
54
Dividends
128
83
128
83
Donations
15
14
15
14
Subsidies revenue
5,153
3,499
5,153
3,499
Petrol Tax
130
116
130
116
Hanmer Springs Thermal Pools & Spa Receipts
9,967
9,503
9,967
9,503
Insurance Proceeds
17
381
17
381
Forestry Proceeds
3,829
121
3,829
121
User Charges
761
759
761
759
Rental
541
520
541
520
Regulatory revenue
1,445
1,434
1,445
1,434
Development contributions
472
1,145
472
1,145
21,956
21,194
21,956
21,194
Total revenue
36,854
35,134
36,854
35,134
Rate Remissions
Rates revenue is shown gross of any rate remission, which are recorded as an expense. The Council's rates remission policy
allows the Council to remit rates on condition of a ratepayers' extreme financial hardship, land used for sport, and land
protected for historical or cultural purposes. During the 2013/2014 financial year, the Council provided remissions totalling
$18,843 (2012: $16,670).
Non-rateable land
Under the Local Government (Rating) Act 2002, certain properties cannot be rated for general rates. These properties include
schools, places of religious worship, public gardens and reserves. These non-ratebable properties may be subject to targeted
rates in respect of sewerage, water and refuse collection. Non-rateable land does not constitute a remission under the Council's
rate remission policy.
Government grants and subsidies
There are no unfulfilled conditions and other contingencies attached to New Zealand Transport Agency subsidies recognised.
In 2010, the Council was provided a grant of $1.5 million from the Ministry of Culture and Heritage towards urgent maintenance
and earthquake strengthening of the Nurses Block, which was one of the key buildings vested to Council from the former
Queen Mary Hospital site. Council has undertaken part of this work, with the earthquake strengthening still to be carried out.
There were no fixed timeframes around the earthquake strengthening work but the Council has budgeted for it to be carried
out in 2016.
As part of the vesting process, the Council has committed setting aside $3.4 million for the conservation, of the Soldiers'
Block and Chisholm Ward and surrounding land area. The development and maintenance expenditure is at the discretion of the
Council and subject to the Long Term Planning process.
⌂
72
Annual Repor
4
t 2013/14 4
Note 4: Employee benefit expense
Group
Council
Actual
Actual
Actual
Actual
2014
2013
2014
2013
$000's
$000's
$000's
$000's
Salary and wages
9,577
9,112
9,577
9,112
Employer contribution to super
277
169
277
169
Increase/(decrease) in employee benefit liabilities (Note 21)
79
53
79
53
Total employee benefit expenses
9,933
9,334
9,933
9,334
Note 5: Other expenses
Group
Council
Actual
Actual
Actual
Actual
2014
2013
2014
2013
$000's
$000's
$000's
$000's
Fees paid to principal auditor
- audit fees for financial statement audit
104
101
104
101
- audit fees for Long Term Plan
0
0
0
0
- audit fees for additional work
65
12
65
12
- disbursements charged
3
2
3
2
Finance costs
- interest expense on bank borrowings
794
707
794
707
- fair value movement of derivatives
(286)
(387)
(286)
(387)
Movements in doubtful debts
0
(0)
0
(0)
Depreciation of non-current assets
7,904
6,730
7,904
6,730
Amortisation of non-current assets
63
62
63
62
Loss on disposal of assets
246
405
246
405
Expenses from other activities
19,887
15,395
19,887
15,395
Total other expenses
28,779
23,027
28,779
23,027
Audit New Zealand has been appointed as the audit service provider on behalf of the Auditor-General for the Council and Group.
Note 6: Tax
Group
Council
Actual
Actual
Actual
Actual
2014
2013
2014
2013
$000's
$000's
$000's
$000's
Components of tax expense
Current tax expense
0
0
0
0
Adjustment to current tax in prior years
0
0
0
0
Deferred tax expense
0
0
0
0
0
0
0
0
Relationship between tax expense and accounting profit
Surplus/(deficit) before tax
(1,861)
2,774
(1,858)
(1,858)
Tax at 28% (2013: 28%)
(521)
777
(520)
(520)
Non-taxable income
521
(777)
520
520
0
0
0
0
Imputation credit account
Credits available for future use
295
295
0
0
295
295
0
0
73
⌂
Hurunui District Council
Note 7: Cash and cash equivalents
Group
Council
Actual
Actual
Actual
Actual
2014
2013
2014
2013
$000's
$000's
$000's
$000's
Cash at bank or in hand
4,075
1,786
4,075
1,786
4,075
1,786
4,075
1,786
Cash at bank has original maturity of less than three months.
Note 8: Trade and other receivables
Group
Council
Actual
Actual
Actual
Actual
2014
2013
2014
2013
$000's
$000's
$000's
$000's
Trade and other receivables
3,188
2,190
3,188
2,190
Goods and services tax (GST) receivable
314
160
314
160
Provision for impairment
(60)
(60)
(60)
(60)
3,442
2,290
3,442
2,290
The average credit period on sale of goods and services is 30 days as services are paid for at the start of the process.
An allowance has been made for estimated irrecoverable amounts from the sale of services, determined by reference
to past default experience. There was no movement in the allowance for the current or previous financial year.
Rates are paid in quarterly instalments and 10% penalty is added on any rates unpaid at the end of the quarter.
A further additional 10% is added to all rates and additional charges from the previous year remaining unpaid
at 1 July. A further additional charge of 10% is added to all rates and additional charges remaining unpaid at 1 January.
The status of receivables as at 30 June 2014 and 2013 are detailed below:
2014
2013
Gross
Impairment
Net
Gross
Impairment
Net
$000's
$000's
$000's
$000's
$000's
$000's
Council
Not past due
2,779
0
2,779
1,801
0
1,801
Past due 1-60 days
238
0
238
236
0
236
Past due 61-120 days
132
0
132
13
0
13
Past due >120 days
353
(60)
293
300
(60)
240
Total
3,502
(60)
3,442
2,350
(60)
2,290
Group
Not past due
2,779
0
2,779
1,801
0
1,801
Past due 1-60 days
238
0
238
236
0
236
Past due 61-120 days
132
0
132
13
0
13
Past due >120 days
353
(60)
293
300
(60)
240
Total
3,502
(60)
3,442
2,350
(60)
2,290
Note 9: Non-current assets held for sale
Group
Council
Actual
Actual
Actual
Actual
2014
2013
2014
2013
$000's
$000's
$000's
$000's
Land classified as held for sale
305
305
305
305
305
305
305
305
The Council intends to dispose of parcels of land it no longer needs for its operations. Negotiations are
being pursued with potential buyers.
⌂
74
Annual Repor
4
t 2013/14 4
Note 10: Property, plant and equipment
Freehold Land, Buildings and Pools Carried at Fair Value
An independent valuation of the consolidated entity’s land, buildings and pools was performed by QV
Limited, registered independent valuers not related to the consolidated entity, to determine the fair value of
land, buildings and pools at 30 June 2014. The valuation, which conforms to New Zealand Property Institute
Practice Standard 3 - Valuations for Financial Reporting Purposes, was determined by using standard and
recognised valuation methods depending upon the type of property. Under the New Zealand Property
Institute Practice Standard 1, which came into force from 1 May, 2004, all valuations must be assessed as at
the date of inspection of the property, except where the valuation instructions are to assess the value at a
retrospective date.
Land under road
The valuation of this land is based on the average rateable value of land in the associated ward as
determined by QV Valuations (Registered Valuers) as at 30 June 2005. Under NZ IFRS HDC has elected to
use the fair value of the land under roads as at 30 June 2005 as deemed cost. Land under roads is no longer
revalued.
Roading assets
Roading assets have been valued at depreciated replacement costs as at 30 June 2013. The valuation was
performed internally by the Council's Roading Engineer - Asset Management, John Whyte, and peer reviewed by
George JasonSmith, BE(NSW), MIPENZ(Civil), CPEng, Principal Asset Management Consultant for AECOM
New Zealand Limited.
Water and sewer assets
Water and sewer assets have been valued at depreciated replacement cost as at 30 June 2012.
The valuation was performed internally by the Council's Technical Officer for Utilities, David Perry and peer
reviewed by M Clough, Registered Valuer of Beca Valuations Limited.
Drainage and stormwater assets
Drainage and stromwater assets have been valued at depreciated replacement cost as at 30 June 2012.
The valuation was performed internally by the Council's Technical Officer for Utilities, David Perry and peer
reviewed by M Clough, Registered Valuer of Beca Valuations Limited.
Work in Progess
The total amount of property, plant and equipment in the course of construction as at 30 June 2014 was
as follows:
2014
2013
Water Infrastructure
1,247,500
1,214,738
Sewer Infrastructure
655,489
295,116
Stormwater Infrastructure
123,974
113,194
Roading Infrastructure
380,591
73,250
Council Buildings - Operational
0
84,183
Council Buildings - Restricted
59,382
24,199
$2,466,936
$1,804,680
These items classified as Work In Progress have been recorded as additions in the following schedule.
Restrictions on plant, property and equipment
The Council agreed as part of the vesting agreement for the former Queen Mary Hospital site in Hanmer Springs,
that it accepts responsibility for and maintain the integrity of the heritage site. The Council is committed to carrying
out earthquake strengthening work on the Nurse's Hostel and conserve, develop and maintain the Soldiers'
Block and Chisholm Ward and the surrounding land area. It is also committed to ensure the history of Hanmer
Springs will be promoted to the community and visitors thorugh heritage interpretation of the Queen Mary Hospital
Heritage Site.
75
⌂
Hurunui District Council
8,509
210
204
,367
,160
,870
,513
,339
,054
10,183 2,256
12,881 7,199 41,238
10,062 12,215 2,380
13,088 7,270 45,219
23,286 12,655 35,941
24,803 12,519 37,322
2,303 12,106 42,989 16,946
3,449
2,479 12,111 42,500 17,029
3,524
rrying
ne
209
287
208
286
364
369
Ca unt 30 Ju
Amo
d
0
0
0
0 0
0
0 0
on
324
992 535
582
12 420 432
18 658 676
436
73
883
147
late
d nt 30
3,760
5,785
3,586 1,053
3,219 8,440
1,376
1,885
2,788
4,072
7,890
ne
11,396
13,713
17,006
reciati an airme Ju
Accumu Dep
Imp
on 30
8,509
6,016 1,202
5,966 1,257
2,303
,367 3,522 ,045
2,479
,942 3,671 ,404
,052 ,061
ne
10,507
13,416 12,984 52,634
10,062 12,797
13,088 10,489 53,659
23,298 13,075 36,373
24,821 13,177 37,998
12,106 44,365 17,382 209
289
12,111 45,287 17,912 212
294
378
386
Cost/ luati Ju
Reva
d
0 0 8) 0 0 0 8)
0 0 1) 0 0 ) )
0 0 0
0 0 0
0 0 0 0 0 0 0
0 0 0 0 0 0 0
8) )
on ld fied
late
So
(11
(11
(71
093 804
(11
804
ts
(3, (3,
(3,
reciati sse eclassi
Accumu Dep on A or R
0
0
6
6
0 0
0 0
ar on
165 501 62 267 530
258 537 61 270 527
211 217
238 244
436
73
447
74
t Ye
1,525
1,653
1,376
3,103
4,988
1,412
4,072
6,005
6,730
7,902
reciati
Curren Dep
0 0 0 0 0 0 0
0 0 0 0 0 0 0
0 0 0
0 0 0
0 0 0 0 0 0 0
0 0 0 0 0 0 0
0
0
nt
airme
Imp
0 0 0 0 0 0 0
0 0 0 0 0 0 0
0
0 0 0
0 0 0 0
0
0 0 0 0 0 0 0
0
0
ion
837
837
7)
7)
(83
(83
ficat
Reclassi
0 0 0 0 0 0 0
0 0
0
0 0 0
46
0 0 0 0
0
0 0 0 0 0
on
1,369 770
278
2,417
1,523
1,569
176
176
16,505
16,505
16,505
4,163
luati Surplus
Reva
0
0 0 0
0 0
0 0 ) )
0 0 0
0 0 0
0 0
) 0
0 0
) 0
)
d.
ar
8)
4)
2)
5)
7)
(3) 4)
0)
(3) 6)
6)
(20
(14
(35
(76
109 874
(38 (14
(40
(19 (53
(24
(75
120
lose
t Ye osals
(3, (3,
(4,
isc
Curren Disp
een d
as b
0
0
0
0 5
ar
300 686 618 62
208
184
715 55 199 614
123 45 168
56 56
376
778
746
583
152
t Ye
1,874
1,520
3,287
2,077
4,002
7,979
1,112
3,575
5,428
8,771
tions
10,021
hedule h
Curren Addi
only one sc
8,417 9,662 2,165 210
7,521
8,509
2,256 210
7,199
2,303
,800 2,779 ,905
2,303
,367 3,449 ,160
,181 ,339 ore
ly
13,148
41,123
10,183
12,881
41,238
22,332 12,821 35,153
23,286 12,655 35,941
11,730 42,675 16,618
12,106 42,989 16,946
ref
rrying unt 1
192
268
209
287
345
364
Ju
Ca Amo
e, the
sam
d
0 9
0 8
0 4
2 5
6 9 5
0 2
0 0 0 0
0
0 0
6 0
15
93 26
32
99 53
20 21
12 42 43
43
73
late on 1
3,377
5,255 9,989
3,760
5,785
6,004
6,004
1,376
1,885
e the
ly
11,396
16,208
13,713
reciati Ju
up ar
ro
Accumu Dep
d G
on 1
8,417 9,821 5,542 1,140
8,509
6,016 1,202
2,303
,804 2,779 ,909
2,303
,367 3,522 ,045
,389 ,052 uncil an
ly
13,416 12,776 51,112
10,507
13,416 12,984 52,634
22,338 13,030 35,368
23,298 13,075 36,373
11,730 42,675 16,618 198
274
12,106 44,365 17,382 209
289
361
378
Co
Cost/ luati Ju
Reva
ent for the
quipm
d e
ols
perty an
ment
ols ment
pro
& Po uip
& Po uip
t,
gs
gs
lan
ment
ildin nt & Eq
ment
ildin nt & Eq
ts
f p
ts
uip
uip
ts
sse
ce o
sse
e Bu e Pla
e Bu e Pla
d gs
d gs
sse d gs
d gs
d
d
ildin nt & Eq s erv erv
s erv erv
ral A
d
d
alan
ok es es
ildin nt & Eq ok es es
ildin
ildin
onal A
3
4
d Lan
d Lan
d A d Lan
d Lan
d Lan Lan
ge
d Lan Lan
ge
e b
ati
cil Bu cil Pla Bo
otal
cil Bu cil Pla Bo
otal
cil Bu otal
cil Bu otal
ructu
ing
ing age otal
ing
ing age otal
201
201
th
er hol
rary mal R mal R 3 T
hol
rary mal R mal R 4 T
ricte hol
3 T
hol
4 T
hol
hol
ater wera
3 T
ater wera
4 T
Op Free Coun Coun Lib Ther Ther 201
Free Coun Coun Lib Ther Ther 201
Rest Free Coun 201
Free Coun 201
Infrast Free Road W Se Road Drain 201
Free Road W Se Road Drain 201
Total
Total
Note:
⌂
76
Annual Repor
4
t 2013/14 4
Note 11: Intangible assets
Group
Council
Actual
Actual
Actual
Actual
2014
2013
2014
2013
$000's
$000's
$000's
$000's
Software:
Cost
Balance at 1 July
546
473
546
473
Additions
31
73
31
73
Disposals
0
0
0
0
Balance at 30 June
577
546
577
546
Aerial Photography:
Cost
Balance at 1 July
112
103
112
103
Additions
0
9
0
9
Disposals
0
0
0
0
Balance at 30 June
112
112
112
112
Accumulated amortisation and impairment
Balance at 1 July
530
468
530
468
Amortisation charge for Software and Aerial Photography
63
62
63
62
Disposals
0
0
0
0
Balance at 30 June
593
530
593
530
Carrying amount at 30 June
96
128
96
128
New Zealand Emmision Units:
Cost
Balance at 1 July
19
73
19
73
Add Additions
0
0
0
0
Less Disposals
0
0
0
0
Add increase in value
25
(54)
25
(54)
Carrying amount at 30 June
44
19
44
19
Total Intangible Assets
140
147
140
147
Note 12: Depreciation and amortisation expenses by group of activity
Council
Actual
Actual
2014
2013
$000's
$000's
Directly attributable depreciation and amortisation expense by group of activity
Water Supplies
1,412
1,379
Sewerage
447
437
Roads and Footpaths
4,072
3,103
Stormwater and Drainage
74
73
Community Services and Facilities
575
500
Environment and Safety
200
119
District Promotion
7
7
Hanmer Springs Thermal Pools and Spa
814
799
Governance
5
4
Directly attributable depreciation and amortisation expense by group of activity
7,606
6,419
Depreciation and amortisation expense not directly attributable to group of activities
361
373
Total depreciation and amortisation expense
7,967
6,792
77
⌂
Hurunui District Council
Note 13: Forestry assets
Group
Council
Actual
Actual
Actual
Actual
2014
2013
2014
2013
$000's
$000's
$000's
$000's
Balance at 1 July
2,738
2,337
2,738
2,337
Gain/(losses) arising from changes in fair value
(1,788)
401
(1,788)
401
Balance at 30 June
950
2,738
950
2,738
The Council owns 234.8 hectares of predominantly radiata pine forestry, which are at varying stages of maturity ranging
from 2 to 36 years.
Valuation Assumptions
Independent registered forestry consultants, Laurie Forestry Limited, have valued the forestry stands as at 30 June 2014.
The following valuation assumptions have been adopted in determining the fair value of forestry assets:
- a pre-tax discount rate of 8.5% (2012: 8.5%) has been used in discounting the present value of expected cash flows;
- the value of the underlying land has not been included in the valuation;
- the valuation assumes that the current tree crop wil be grown for one rotation only, and that no new planting wil be
undertaken or charged against the existing crop.
- time conventions used in the valuation are that the valuation year commences at 1st July and ends 30th June the next
calendar year. This convention applies to all costs, prices, yields and age of trees although it may need to be adjusted
for any significant price movements during the valuation year.
- the valuation uses current and actual prevailing industry costs. The costs have been expressed in real terms, and no
adjustment has been made for any possible changes in prices relative to cost.
Financial risk management strategies
The Council is exposed to financial risks arising from changes in timber prices. The Council is a long-term investor in
forestry and does not expect timber prices to change significantly into the foreseeable future, therefore, has not taken
any measures to manage the risks of a decline in timber prices.
Emmisions Trading Scheme
As Council holds greater than 50 hectares of pre-1990 forests, it has registered under the New Zealand Emmissions Units
Register. As at 30 June 2014, the Council was allocated 10,560 NZUs. The value of these have been recognised as Intangible
Assets in note 11.
Note 14: Derivative financial instruments
Group
Council
Actual
Actual
Actual
Actual
2014
2013
2014
2013
$000's
$000's
$000's
$000's
Current liability portion
Interest rate swaps
1
11
1
11
Non-current liability portion
Interest rate swaps
(26)
250
(26)
250
Total derivative financial instruments liability
(25)
261
(25)
261
Fair Value
Interest rate swaps
The fair values of interest rate swaps have been determined by calculating the expected cash flows under the terms of
the swaps and discounting these to present value. The inputs into the valuation model are from independently sourced
market parameters such as interest rate yield curves. Most market parameters are implied from instrument prices.
Interest rate swaps
The notional principal amounts of the outstanding interest rate swap contracts for the Council were $17.0 million.
(2013: $15.0 mil ion). At 30 June 2014, the fixed interest rates of cash flows hedge interest rate swaps varied from 3.95% to 5.30%
(2013: 3.65% to 5.30%)
Changes in the fair value of interest rate swaps are recognised in the statement of comprehensive income.
⌂
78
Annual Repor
4
t 2013/14 4
Note 15: Other financial assets
Group
Council
Actual
Actual
Actual
Actual
2014
2013
2014
2013
$000's
$000's
$000's
$000's
Environment Canterbury - Waiau River Loan
40
47
40
47
Shares carrying amount
- Local Government Funding Agency Borrower Notes
128
0
128
0
- Civic Assurance
16
16
16
16
- Transwaste Canterbury
433
311
433
311
Fair value amount
617
374
617
374
The financial statements include holdings in unlisted shares. Fair value is estimated using a combination of estimated
future discounted cash flows and asset backing per share. The discounted cash flow approach includes some
assumptions that are not supportable by observable market prices or rates. Changes in these assumptions do not
significantly change the fair value recognised.
Changes in the fair value of unlisted shares are recognised through comprehensive income using the available for
sale approach. The fair value movement recognised in compehensive income for the period was a gain of
$121,592 (2013: Gain of $41,999). There were no impairments or realised gains or losses recognised in the statement of
comprehensive for the period (2013: Nil).
Note 16: Investments in associates
Group
Actual
Actual
2014
2013
$000's
$000's
Movements in the carrying amount of investment in Enterprise North Canterbury
Balance at 1 July
214
213
Share of total recognised revenues and expenses
(3)
1
Balance at 30 June
211
214
Summarised financial information of Enterprise North Canterbury
Assets
649
694
Liabilities
228
266
Revenues
906
934
Surplus/(deficit)
(6)
2
Group's interest
50%
50%
Enterprise North Canterbury recorded no contingent assets or contingent liabilities as at 30 June 2014 (2013: Nil).
79
⌂
Hurunui District Council
Note 17: Financial instruments
17 A - Financial instrument categories
The accounting policies have been applied to the line items listed below:
Group
Council
Actual
Actual
Actual
Actual
2014
2013
2014
2013
$000's
$000's
$000's
$000's
Financial assets
Loans and Receivables
Cash and cash equivalents
4,075
1,786
4,075
1,786
Debtors and other receivables
3,442
2,290
3,442
2,290
Non interest bearing loans
40
47
40
47
Total loans and receivables
7,557
4,123
7,557
4,123
Fair value through other comprehensive income
Unlisted shares
449
327
449
327
Total fair value through other comprehensive income
449
327
449
327
Financial liabilities
Fair value through surplus or deficit
Interest rate swaps
(25)
261
(25)
261
Total fair value through surplus or deficit
(25)
261
(25)
261
Financial liabilities at amortised cost
Borrowings
- secured loans
16,200
12,350
16,200
12,350
Creditors and other payables
3,826
3,539
3,826
3,539
Total financial liabilities at amortised cost
20,026
15,889
20,026
15,889
⌂
80
Annual Repor
4
t 2013/14 4
17B - Fair value hierarchy disclosures
For those instruments recognised at fair value in the statement of financial position, fair values are determined according
to the following hierarchy:
- Quoted market price - financial instruments with quoted prices for identical instruments in active markets.
- Valuation technique using observable inputs - financial instruments with quoted prices for similar instruments in active
markets or quoted prices for identical or similar instruments in inactive markets and financial instruments valued using
models where all significant inputs are observable.
- Valuation techniques with significant non-observable inputs - financial instruments valued using models where one or
more significant inputs are not observable.
The fol owing table analyses the basis of the valuation of classes of financial instruments measured at fair value in the
statement of financial position.
Significant
Quoted
Observable non-observable
Total
Market Price
Inputs
inputs
$000's
$000's
$000's
$000's
Council and Group 2014
Financial assets
Unlisted shares
449
0
0
449
Financial liabilities
Interest rate swaps
(25)
0
(25)
0
Council and Group 2013
Financial assets
Unlisted shares
327
0
0
327
Financial liabilities
Interest rate swaps
261
0
261
0
There were no transfers between the different levels of the fair value hierarchy.
Valuation techniques with significant non-observable inputs
The table below provide a reconciliation from the opening balance to the closing balance for the financial assets and liabilities
measured using valuation techniques with significant non-observable inputs.
Group
Council
Actual
Actual
Actual
Actual
2014
2013
2014
2013
$000's
$000's
$000's
$000's
Balance as at 1 July
327
286
327
286
Gains/losses recognised in surplus/(deficit)
121
41
121
41
Balance at 30 June
448
327
448
327
81
⌂
Hurunui District Council
17 C - Financial instrument risks
The Council has a series of policies to manage the risks associated with financial instruments. The Council is risk
adverse and seeks to minimise exposure from its treasury activities. The Council has established and approved a
Treasury Risk Management policy.
Market Risk
Currency risk
Currency risk is the risk that the value of a financial instrument wil fluctuate due to changes in foreign exchange rates.
The Council is not exposed to currency risk.
Fair value interest rate risk
Fair value interest rate risk is the risk that the value of a financial instrument wil fluctuate due to changes in market
interest rates. Borrowings and investment held at fixed interest rates expose the Council to fair value interest rate risks.
The Council's policy is to maintain between 50% and 95% of its borrowings in fixed rate instruments. The Council is subject to
fair value interest rate risk on its deposits but the risk is minimised as the deposits are for a maturity period of less than one
year.
Cash flow interest rate risk
Cash flow interest rate risk is the risk that cash flows from a financial instrument wil fluctuate due to changes in
market interest rates. Borrowings and investment held at variable interest rates expose the Council to cash flow
interest rate risks.
The Council's policy is to maintain between 50% and 95% of its borrowings in fixed rate instruments and uses interest
rate swaps to convert floating rate borrowing to fixed rate borrowing to manage interest rate risk. Under the interest
rate swaps, the Council agrees with other parties to exchange, as specific intervals, the difference between fixed
contract rates and floating rate interest amounts calculated by reference to the agreed notional principal amounts.
Credit risk
Credit risk is the risk that a third party wil default on its obligations to the Council causing a loss. In the normal
course of its business, credit risks arises from debtors, deposits with banks, bond investments and derivative
financial instruments. The Council's investment policy limits the amount of credit exposure to any one financial
institution.
Maximum exposure to credit risk
The Council's maximum exposure to credit risk for each class of financial instrument is set out below.
Group
Council
Actual
Actual
Actual
Actual
2014
2013
2014
2013
$000's
$000's
$000's
$000's
Cash and cash equivalents
4,075
1,786
4,075
1,786
Debtors and other receivables
3,442
2,290
3,442
2,290
Non interest bearing loans
40
47
40
47
Total credit risk
7,557
4,123
7,557
4,123
⌂
82
Annual Repor
4
t 2013/14 4
17D: Credit quality of financial assets
The Council only deposits funds with entities that have a high credit rating. Cash and cash equivalents are with registered
banks that have high credit ratings. For other financial instruments, the Council does not have high concentrations of credit
risk. No collateral is held as security against these financial instruments including those that are overdue or impaired.
The credit quality of financial assets that are neither past due nor impaired can be assessed by reference to Standard and
Poor's credit rating (if available) or to historic information about counterparty default rates.
Group
Council
Actual
Actual
Actual
Actual
2014
2013
2014
2013
$000's
$000's
$000's
$000's
Counterparties with credit ratings:
Cash and cash equivalents
AA
4,075
1,786
4,075
1,786
Total cash and cash equivalents
4,075
1,786
4,075
1,786
Counterparties without credit ratings:
Non interest bearing loans
Existing counterparty with no defaults in the past
40
47
40
47
Total Non interest bearing loans
40
47
40
47
Shares in unlisted companies
Unlisted shares
448
327
448
327
Total shares in unlisted companies
448
327
448
327
Debtors and other receivables arise mainly from the Council's statutory functions. Therefore, there are no procedures in place
to monitor or report the credit quality of debtors and receivables with reference to internal or external credit ratings. The
Council has no significant concentration of credit risk in relation to debtors and other receivables as it has a large number of
customers, primarily ratepayers, and the Council has powers under the Local Government (Rating) Act 2002 to recover
outstanding debts from ratepayers.
83
⌂
Hurunui District Council
17E: Liquidity risk
Liquidity risk is the extent to which the Council will encounter difficulty in raising liquid funds to meet commitments as they
fall due.
Prudent liquidity risk management implies maintaining sufficient cash, the availability of funding through an adequate
amount of committed credit facilities and ability to close out market positions. The Council aims to maintain flexibilty in
funding by keeping committed credit lines available.
As at 30 June 2014, the Council has a credit facility of $19 mil ion (2013: $18 mil ion) against which it had drawn $16.2 mil ion
(2013: $12.35 mil ion). There is a tranche of borrowings totalling $2 mil ion that is due for maturity within the next 12 months.
Contractual maturity analysis on financial liabilities
The table below analyses the Council's financial liabilities into relevant maturity groupings based on the remaining period at the
balance date to the contractual maturity date.
Liability
Total
Carrying
Cash
Less than
More than
Amount
Flows
1 year
1-5 years
5 years
$000's
$000's
$000's
$000's
$000's
Council and Group 2014
Creditors and other payables
3,826
3,826
3,826
0
0
Secured loans
16,200
16,200
2,000
10,200
4,000
Interest rate swaps
77
77
1
76
0
Council and Group 2013
Creditors and other payables
3,539
3,539
3,539
0
0
Secured loans
12,350
12,350
0
12,350
0
Interest rate swaps
261
261
11
250
0
Contractual maturity analysis on financial assets
The table below analyses the Council's financial assets into relevant maturity groupings based on the remaining period at the
balance date to the contractual maturity date.
Asset
Total
Carrying
Cash
Less than
More than
Amount
Flows
1 year
1-5 years
5 years
$000's
$000's
$000's
$000's
$000's
Council and Group 2014
Cash and cash equivalents
4,075
4,075
4,075
0
0
Debtors and other receivables
3,442
3,442
3,442
0
0
Non interest bearing loans
40
40
7
28
5
Interest rate swaps
102
102
0
0
102
Council and Group 2013
Cash and cash equivalents
1,786
1,786
1,786
0
0
Debtors and other receivables
2,290
2,290
2,290
0
0
Non interest bearing loans
47
47
7
28
12
⌂
84
Annual Repor
4
t 2013/14 4
17F: Sensitivity analysis for interest rate risk
The table below il ustrates the potential effect on the surplus or deficit for reasonably possible market movements, with all
other variables held constant, based on the Council's and Group's financial instrument exposures at balance date.
Council and Group
2014
2013
$000
$000
-100bps
+100bps
-100bps
+100bps
Financial assets
Cash and cash equivalents
(41)
41
(18)
18
Interest rate swaps
0
1
0
0
Financial liabilities
Secured loans
162
(162)
124
(124)
Interest rate swaps
(613)
626
(794)
238
Total sensitivity
(492)
506
(688)
132
Explanation of interest rate sensitivity
The interest rate sensitivity is based on a reasonably possible movement in interest rates, with all other variable held
constant, measured as a basis point movement (bps). For example, an interest of 100bps is equivalent to an increase in
interest rates of 1%.
The sensitivity for interest rate swaps has been calculated using a derivative valuation model based on parallel shift in
interest rates of +/- 100bps.
Note 18: Trade and other payables
Group
Council
Actual
Actual
Actual
Actual
2014
2013
2014
2013
$000's
$000's
$000's
$000's
Trade payables
3,873
2,704
3,873
2,704
Agency payables
(47)
835
(47)
835
3,826
3,539
3,826
3,539
The Group has a policy to pay payables within the credit timeframe and therefore does not incur interest charges on
its payables.
Note 19: Income in Advance
Group
Council
Actual
Actual
Actual
Actual
2014
2013
2014
2013
$000's
$000's
$000's
$000's
Depoist and bonds
848
764
848
764
Other income in advance
835
680
835
680
1,683
1,444
1,683
1,444
85
⌂
Hurunui District Council
Note 20: Landfil aftercare provision
Group
Council
Actual
Actual
Actual
Actual
2014
2013
2014
2013
$000's
$000's
$000's
$000's
Balance at 1 July
128
138
128
138
Additional provisions
0
0
0
0
Adjustment to provisions
4
(2)
4
(2)
Amount of provision used
(8)
(8)
(8)
(8)
Balance at 30 June
124
128
124
128
Disclosed as:
Current
8
8
8
8
Non-current
116
120
116
120
124
128
124
128
The provision for Landfil Aftercare costs represents the present value of the Council’s best estimate of the
future sacrifice of economic benefits that will be required to provide ongoing maintenance and monitoring of
the closed Waikari Landfill.
Note 21: Employee benefit liability
Group
Council
Actual
Actual
Actual
Actual
2014
2013
2014
2013
$000's
$000's
$000's
$000's
Current portion
Accrued pay
391
341
391
341
Annual leave
667
639
667
639
Sick leave
28
30
28
30
Long service leave
35
44
35
44
1,122
1,054
1,122
1,054
Non-current portion
Long service leave
47
36
47
36
47
36
47
36
1,169
1,090
1,169
1,090
Note 22: Borrowings
Group
Council
Actual
Actual
Actual
Actual
2014
2013
2014
2013
$000's
$000's
$000's
$000's
Secured Loans
Current
2,000
0
2,000
0
Non-current
14,200
12,350
14,200
12,350
Balance
16,200
12,350
16,200
12,350
As at 30 June 2014, the Council had debt facilities totaling $19.0 mil ion (2013: $18.0 mil ion)
The Council's borrowing of $16.2 mil ion (2013: $12.35 mil ion) on a floating rate reset quarterly based on the 90 day bank
bill rate plus a margin for credit risk. The Council uses interest rate swaps to provide for a fixed rate portion of the
borrowings of 77.16%. The effective fixed rates for this portion range from 3.95% to 5.30% plus a margin for credit risk.
The borrowings are secured against rates of the Council under a debenture trust deed.
The total amount of the borrowings approximates its fair value.
⌂
86
Annual Repor
4
t 2013/14 4
Note 23: Equity
Group
Council
Actual
Actual
Actual
Actual
2014
2013
2014
2013
$000's
$000's
$000's
$000's
Asset revaluation reserve
Balance at 1 July
195,532
179,027
195,532
179,027
Revaluation increments/(decrements)
4,163
16,505
4,163
16,505
Impairment of assets
0
0
0
0
Plant, property and equipment disposed
0
0
0
0
Balance at 30 June
199,695
195,532
199,695
195,532
The asset revaluation reserve arises on the revaluation of land and buildings, and infrastructural assets. Where
a revalued land, building or infrastructural assets is sold that portion of the asset revaluation reserve which relates
to that asset, and is effectively realised, is transferred directly to retained earnings.
Available for sale reserve
Balance at 1 July
136
95
136
95
Valuation gain/(loss) recognised
121
41
121
41
Balance at 30 June
257
136
257
136
The available-for-sale revaluation reserve arises on the revaluation of available-for-sale financial assets. Where
a revalued financial asset is sold that portion of the reserve which relates to that financial asset, and is effectively
realised, is recognised in profit or loss. Where a revalued financial asset is impaired that portion of the reserve
which relates to that financial asset is recognised in profit or loss.
Special fund reserves
Balance at 1 July
1,975
720
1,975
720
Transfers in
266
1,238
266
1,238
Transfers out
(226)
17
(226)
17
Balance at 30 June
2,015
1,975
2,015
1,975
Rate Reserve Funds
Balance at 1 July (Transferred from Retained Earnings)
(23,428)
(20,498)
(23,428)
(20,498)
Surplus/(defict) for year
1,388
1,684
1,388
1,684
Transfers in/(out)
(2,222)
(4,614)
(2,222)
(4,614)
Balance at 30 June
(24,261)
(23,428)
(24,261)
(23,428)
Retained earnings
Balance at 1 July
179,322
174,873
179,108
174,660
Surplus/(deficit) after tax
(1,861)
2,774
(1,858)
2,773
Plant, property and equipment disposed
0
0
0
0
Net internal borrowing appropriations
833
2,930
833
2,930
Net special fund appropriations
(40)
(1,255)
(40)
(1,255)
Balance at 30 June
178,254
179,322
178,043
179,108
Summary of equity accounts
Asset revaluation reserve
199,695
195,532
199,695
195,532
Available-for-sale revaluation reserve
257
136
257
136
Special fund reserves
2,015
1,975
2,015
1,975
Rate reserve funds
(24,261)
(23,428)
(24,261)
(23,428)
Retained earnings
178,254
179,322
178,043
179,108
355,960
353,537
355,749
353,323
87
⌂
Hurunui District Council
Note 24: Statement of cash flow reconciliation
Group
Council
Actual
Actual
Actual
Actual
2014
2013
2014
2013
$000's
$000's
$000's
$000's
Reconciliation of surplus for the period to net cash flows from
operating activities
Net Surplus/(Deficit) after tax
(1,861)
2,774
(1,858)
2,773
Non Cash Items
Vested assets
(1,010)
(2,429)
(1,010)
(2,429)
Gain/Loss on Fair Value of Forestry
1,788
(401)
1,788
(401)
Movement in Landfill Aftercare Liability
0
(10)
0
(10)
Movement in Non Current Employee Entitlements
11
0
11
0
Depreciation and amortisation
7,963
6,792
7,963
6,792
8,752
3,952
8,752
3,952
Items classified as investing or financing
(Gain)/loss on Sale of Assets
215
379
215
379
(Gain)/loss on fair value of NZ Emmissions Units
(25)
54
(25)
54
(Gain)/loss on fair value of financial assets
(286)
(387)
(286)
(387)
(96)
46
(96)
46
Movements in working capital
(Increase)/decrease in Inventory
12
37
12
37
(Increase)/decrease in Receivables
(1,152)
(239)
(1,152)
(239)
Increase/(decrease) in Payables
164
646
164
646
Increase/(decrease) in Current Employee Entitlements
0
53
0
53
Increase/(decrease) in Income in Advance
0
500
0
500
(976)
997
(976)
997
Other Movements
Insurance recoveries related to capital item
0
(204)
0
(204)
Share of associates (surplus)/deficit
3
(1)
0
0
3
(205)
0
(204)
Net Cash Flow from Operating Activities
(as per Statement of Cash Flows)
5,822
7,564
5,822
7,564
⌂
88
Annual Repor
4
t 2013/14 4
Note 25: Capital commitments and operating leases
Capital Commitments
Group
Council
Actual
Actual
Actual
Actual
2014
2013
2014
2013
$000's
$000's
$000's
$000's
Property, plant and equipment
750
667
750
667
750
667
750
667
The Council has allowed in its Long Term Plan to undertake direct roading expenditure to the value of $20 million over the next
three years. The primary Roading Maintenance and Operational Contract is due to expire in June 2015, but depending on the
incumbent contractor’s ability to achieve consistent, successful outcomes, is subject to a possible +1, +1 (years) contract period
additions. The other lesser roading contracts are let and completed in the same financial year. These contracts are for roading
renewals and maintenance and will give rise to capital expenditure in these years.
Operating leases as lessee
The Council and group does have an operating lease for photocopier equipment. The lease payments are based on
usage and as such, due to the variable nature of the lease agreement, the future value of the lease payments cannot
be reliably estimated.
Operating leases as lessor
Property is leased under operating leases. The majority of the leases have non-cancel able terms of either three or five
years. The future aggregate minimum lease payments to be col ected under non-cancel able leases are as fol ows:
Group
Council
Actual
Actual
Actual
Actual
2014
2013
2014
2013
$000's
$000's
$000's
$000's
Not later than one year
133
163
133
163
Later than one year and not later than five years
177
109
177
109
Later than five years
4
9
4
9
314
281
314
281
No contingent rents have been recognised during the period.
89
⌂
Hurunui District Council
Note 26: Contingent assets and liabilities
Contingent Assets
The Council has a level of damage to various buldings resulting from the Canterbury Earthquakes. The assessment of the
insurance claims for the Council's non-residential buildings that have yet to be settled has been estimated at $497,200.
Council had a low level of damage to its residential buildings as well. Being residential buildings, the repair process is
organised by EQC and a ful assessment of the damage and the possible payout should the Council undertake the repair
work itself has yet to be received. (2013: $497,000). In addition, there was a fire in the Ashley Forest area, which cost the
Council's Rural Fire Control Department approximately $189,000 to suppress. It has been assessed that a total of $170,000
is to be reimbursed for the costs by the party causing the fire but that is stil to be agreed to.
Contingent Liabilities
RiskPool
RiskPool provide public liability and professional indemnity insurance for its members. The Council is a member of
RiskPool. The Trust Deed of RiskPool provides that, if there is a shortfall (whereby claims exceed contributions of members
and reinsurance recoveries) in any Fund year, then the Board may make a call on members for the Fund year. The Council
has been asked to make calls in the past for Fund years as a result of deficits incurred due to the "leaky building" issue.
No calls have been made by the Board of New Zealand Mutual Liability RiskPool for the 2014/2015 year (2013: Nil).
There may be further calls on any shortfalls on the mutual pool's funds in the future, but the full extent of these calls
have yet to be ascertained.
The Supreme Court decision in October 2012 on a Council's liability for non-residential buildings may affect the liability
of the Council for weathertightness claims for non- residential buildings. The impact of the decision is yet to be quantified
by the Council. The Council is yet to receive any claims as a result of the ruling.
Council has received notice that there are two active claims under Weathertight Homes Resolution Service.
The Council has assessed that the potential liability to Council arises from these claims is minimal.
Impairment of Buildings
Council has started a process of reviewing all of its buildings for earthquake strengths. Currently the Council's policy is
to ensure that buildings are at least 67% of New Building Standard (NBS), however, central government is in the process
of reviewing this standard nationally. The Council has identified some buildings that are less than 33% NBS, which is the
level that the current valuation for buildings has been assumed. Council has had some indicative costings on certain
buildings to bring them up to the new standard of 67% NBS, however, there is not enough reliability to determine what
level of costs would be required to match the level that the buildings were previously valued at and as a result, no specific
impairment assessment has been allowed for in this Annual Report.
⌂
90
Annual Repor
4
t 2013/14 4
Note 27: Related party disclosures
The parent entity in the consolidated entity is the Council.
Equity interests in subsidiaries
The Council holds interests in the following entities:
- Hurunui Holdings Limited 100% (2013: 100%)
- Enterprise North Canterbury 50% (2013: 50%)
- Canterbury Economic Development Company Limited 10% (2013: 10%)
- Transwaste Canterbury Limited 1.2% (2013: 1.2%)
Transactions involving the parent entity
During the year, Council ors and key management, as part of a normal customer relationship, were involved in
minor transactions with the Hurunui District Council (such as payment of rates, use of transfer stations, etc).
During the year, the Council disposed of solid waste at the Kate Valley Landfill. The Landfill is owned and operated by
Transwaste Canterbury Limited which Hurunui District Council owns 1.2% of the shares and Councillor RW Davison is a
director. The services cost $301,949 (2013: $251,080). As at 30 June 2014, Council owed Transwaste Canterbury Limited
$26,445 (2013: Nil).
During the year, the Council leased the medical centre in Rotherham to the Amuri Health Care Limited, of which Council or
RW Davison is a director. The revenue for the year was $13,328 (2013: $13,217, plus a contribution to the building of $63,594).
As at 30 June 2014, the amount owing to Council was $14,831 (2013: $74,410).
Cr JM Fletcher is a director of Hanmer Holiday Homes 2004 Limited. The company supplied various services, mainly col ection
of glass in the solid waste activity, to the value of $1,919 (2013: $1,852). As at 30 June 2014, Council owed the company
$266 (2013: Nil). The company also received services from Council for advertising through the district promotion activity to
to the value of $4,780 (2013: $3,900). As at 30 June 2014, the company had no outstanding balance with Council (2013: Nil).
Other than the above, no Council ors or senior management have entered into related party transactions with the Group.
No amounts were provided for doubtful debts relating to debts due from related parties as at 30 June 2014 (2013: Nil).
Hurunui Holdings Limited
As Hurunui Holding Limited is now no longer trading, there are no transactions between Council and the Company for
the current or prior year.
Enterprise North Canterbury
During the financial year, the Council paid $51,565 (2013: $50,000) to Enterprise North Canterbury as a grant
for it general purposes. The Council has made no payment for any additional services (2013: Nil).
Key management personnel compensation
The compensation of the Mayor, Councillors, CEO and other senior management is set out below:
Council
Actual
Actual
2014
2013
$000's
$000's
Salary and Allowances
1,392
1,339
Other benefits
66
58
1,458
1,397
Related Party Commitments
As at 30 June 2014, there was no related party commitments (2013: Nil).
91
⌂
Hurunui District Council
Note 28: Remuneration
Chief Executive Officer
Andrew Dalziel was the Chief Executive Officer of the Hurunui District Council from 1 July 2013 to 30 August 2013.
Hamish Dobbie began his 5 year contract as Chief Executive Officer on 16 September 2013.
Council
Actual
Actual
2014
2013
$
$
Andrew Dalziel (1 July 2013 to 30 August 2013)
- Salary
53,891
229,133
- Vehicle (at FBT rates)
1,529
8,220
- Superannuation contribution
1,983
5,026
57,403
242,379
Hamish Dobbie (16 September 2013 to 30 June 2014)
- Salary
163,942
0
- Vehicle (at FBT rates)
7,168
0
- Superannuation contribution
4,573
0
175,683
0
Mayor and Council ors
Elected representatives of the District Council received the following remuneration (including travel ing al owances):
Council
Actual
Actual
2014
2013
$
$
Marie Black
29,450
18,422
Russell Black
5,191
15,565
Gary Cooper
19,958
17,853
Julie Coster
13,108
0
Winton Dalley
69,848
67,459
Vincent Daly
23,125
20,188
Richard Davison
27,073
21,703
Jason Fletcher
18,020
0
Jim Harre
21,574
19,557
Fiona Harris
13,108
0
Ross Little
8,161
19,100
Michael Malthus
14,163
27,664
Judith McKendry
18,299
15,565
281,077
243,076
Council Employees
Total annual remuneration by band for employees as at 30 June:
Council
Actual
Actual
2014
2013
#
#
< $60,000
127
138
$60,000 - $79,999
27
17
$80,000 - $99,999
15
13
$100,000 - $139,999
6
2
$140,000 - $259,999
6
6
181
176
Total remuneration includes non-financial benefits provided to employees.
At balance date, the Council (including the Hanmer Springs Thermal Pools and Spa) employed 92 (2013: 87) full-time employees,
with a further 89 (2013: 89) part-time staff representing 53.7 (2013: 54.5) full-time equivalent employees.
A full-time employee is determined on the basis of a 40-hour working week.
⌂
92
Annual Repor
4
t 2013/14 4
Note 29: Severance payments
Schedule 10(19) of the Local Government Act 2002 requires any severance including the tax liability to be disclosed.
For the year ended 30 June 2014, no severance payments were made (2013: Nil).
Note 30: Subsequent events
There have been no events subsequent to 30 June 2014 which would affect the readers' assessment of the financial
performance and position of the Hurunui District Council.
Note 31: Capital management
The Council's capital is its equity (or ratepayers' funds), which comprise retained earnings and reserve. Equity is
represented by net assets.
The Local Government Act 2002 (the Act) requires the Council to manage its revenues, expenses, assets, liabilities,
investments, and general financial dealings prudently and in a manner that promotes the current and future interests of the
community. Ratepayer’s funds are largely managed as a by-product of managing revenues, expenses, assets, liabilities,
investments, and general financial dealings.
The objective of managing these items is to achieve intergenerational equity, which is a principle promoted in the Act and
applied by Council. Intergenerational equity requires today’s ratepayers to meet the costs of utilising the Council’s assets
and not expecting them to meet the ful cost of long term assets that wil benefit ratepayers in future generations. Additionally,
the Council has in place asset management plans for major classes of assets detailing renewal and maintenance
programmes, to ensure ratepayers in future generations are not required to meet the costs of deferred renewals and
maintenance.
The Act requires the Council to make adequate and effective provision in its Long Term Plan (LTP) and in its annual plans
(where applicable) to meet the expenditure needs identified in those plans. The Act sets out the factors that the Council
is required to consider when determining the most appropriate sources of funding for each of its activities. The sources and
levels of funding are set out in the funding and financial policies in the Council’s LTP.
The Council has created reserves for different areas of benefit which are used where there is a discrete set of rate or levy
payers as distinct from the general rate. Any surplus or deficit relating to these separate areas of benefit is applied to the
specific reserves.
93
⌂
Hurunui District Council
ng
$
0
953 755
781 012 491 881) 284) 079 140 905) 236 514 872 202 358 333 944
354
831
775
067 600 183 482 087 165
114
5, 3, 418 2, 392 (917) 856 355 210 783) 290)
935 4, 892 481 391
945
095 281) 242 2,
4, 1, 1,
197
Closi Balance ne 2014
68, 203,
81, 330,
(33, (52, 87, 98, (58, 51, 19, 43, 30, 29,
40,
33,
52, 22, 47, (27,
25, 14,
19, 23, 53,
17,
13,
(800,
358,
229, (33,
015,
1,
2,
30 Ju
) $
ers
0
0 0 0 0
0
0 0 0 0 0 0 0 0 0 0
0 0 0
0 0
0
0
0 0
0
0 0 0 0 0 0 0 0 0 0 0
452
874)
369)
667
210
210)
021)
145)
nsf (OutIn/
21,
(24,
16,
47,
(47,
(1,
Tra
(238,
(226,
013-2014
$
riations 2 us/
25
81
0
0
71 21 6
37 40 0 0
eficit)
186) 926
695
426
669
183
164
154
6, 658
367
945 133 568
504 913 800
365 046
631
103
871 167
007
1, 193 288 9, 2, 8,
1, 7, 8,
031
8, 2, 667 351
8, 221)
6, 935
714) 4, 5,
616 (100)
437
Surpl (D
(4, 10,
35,
11, 16,
16,
16, 22,
(17,
14,
(12,
48,
24,
266,
Approp
$
ng
65
3 0
0
ni
688 829
086 353
248) 397 791 564 038) 667 845 368 288 557 150 919 387 273 360 963) 189
415) 069)
728 210 611 627 610 224
939
095 897) 342 996 579 177 328 050 125
114
905
ly 2013
51,
75,
70,
42, 18, 42, 22, 20, 5, 3, 24, 2, 8, (2, 36,
19, 47, 4, 33, 18, 48,
17, 1,
4, 1, 1,
13,
Ope Balance
192,
294,
(35, 175,
112, (61,
(36, (783,
310,
229, (57,
974,
1 Ju
1,
1,
pital
ley
os
er
ber
orm
m
ings
y H
pr
ar
he F
ain
ings
S
pr
er
om
ley in the A
ilion
ueen M
ings
S
ies
ies
ies ies
ber es
er
pr ings
er
Q
lock on t
er den D er
er er
out
ley
av
wat
S pr
n Hanm
er
B
et
et
et et
ber
m
er S all
m
or
ses
in Am
ve P
er
ea i
ulver
er ipes ond
tor
em
em
em em
n Hanm
ar d
ur
y
ves
P P
ycling R
es
ve
ings H re i
ar
the f
il's C he C il's C
il's C il's C
er
in Am
er er er
er
pr
of
brar ley
ves
ew ew at ings S
d
S ent
ridge
the N
er
ley R
pr d
alkway
ounc
ounc
ounc ounc
S ar
d
ar ain in Hanm
er
ings W
d
d ent
e of
ber
hip res
es
ber ley S ley S ley W er
d
ar
ihi Res
m
m
om ilion in Hanm anm
pr
ar
ar
istrict Li
ns
m
re d ar
k W
own C
cal W S
W erry B
alking and C
d r
elopm
ar
ber ber ber
m m m anm ley W
ar i W
iot W
ar
oni er
k In A in the C leading into t in the C
in the C in the C
tow W
w
the A A A A H ber
ent i W ur
ain Pav
unui
ar
m
the O
the D
the H the T
C
aiau F ings W dev
the D
es
ty C ur m
hev
lenm
anm
ur
pr
aintenanc
SA
om
tones
tones
tones tones
uni m
S
lain P
m
SA
the W er
es
es ve es es
ojects for ojects for
ojects for
the gat
ley R ojects for ojects for ojects for ojects for ojects for
ojects for
ojects for the D ojects for ojects for
ojects for
ojects for
k and m
ojects for ber av
av
av av
of
er
ds h
om
iot R
ilion
d
e of anm
or
gr
gr es gr gr
ber
d
d av
ar
ham
ent
eac
m
ojects in the A ar
ojects in the A d hev ojects in the C ar
ojects in the G
ade of
ojects in the H W ojects in the H
ng w
e of
e of
e of e of
e Fun
elated pr elated pr
elated pr
elated pr elated pr elated pr elated pr elated pr
i W den C ilities in the A
ar
k W
elated pr
elated pr
elated pr elated pr
elated pr
the H elated pr
elated pr
den R
ley B
acem
ar
th r th r
th r the A th r th r th r th r th r ve pr ur
unui
m ulver
ve pr iot W the C ve pr ar aipara P th r ve pr th r
heni
e upgr th r th r
th r ve pr ur ve pr aintenanc
th r
th r
epl
aw
eserv ber
er
ts fac er
er
er
er
er
m ow ow
ow f of ow ow ow ow ow
f of
ow
ow ur ow ow
ow
ow
ow ojects on C aintenanc
aintenanc
aintenanc aintenanc
gr gr
gr
gr gr gr gr gr res
res hev
res lenm
gr res gr fut gr gr
gr res
res the m ojects for gr
trengt
gr pr m the r m he H m m
ng R A
the A the C spor
C
G the W
the H
e s
di
for for
for
for for for for for for
for
for
for for for for for for
for for
for for
pital Site
ing pr for
for for for for for
for for
os
Hol
on behal
on behal
ket
thquak
or ojects for
ojects for ojects for ojects for
ojects for
ojects for ojects for
ojects for
ar
y H
ojects on t
ide funds ide funds
ide funds
ide funds ide funds ide funds ide funds ide funds ide funds
ide funds
ide funds
ide funds ide funds ide funds ide funds ide funds ide funds
ide funds ide funds
ide funds ide funds
ide funds
ar ide funds ide funds ide funds ide funds ide funds
ide funds ide funds
ov ov
d funds
d funds
d ov
ov ov ov ov ov ov
ov
ov
ov ov ov ov ov ov
ov ov
ov ov
ov
ov ov ov ov ov
ov ov
ar
Reason f To fund pr To pr To pr W To pr To hol To pr To pr To pr To pr To pr To pr To fund pr To fund pr To fund pr To pr To fund pr To hol To pr To fund pr To fund pr To pr To pr To pr To pr To pr To pr
To pr To pr To fund pr To pr To pr To fund m To pr Site To fund ear Queen M To pr To pr To pr To pr To pr To fund pr To pr To pr
ilities ilities
ilities ilities ilities ilities
ilities ilities ilities ilities ilities ilities ilities ilities ilities ilities ilities ilities ilities ilities ilities ilities
ilities ilities ilities ilities ilities ilities
ilities
ilities ilities ilities ilities ilities ilities ilities ilities ilities
nd Fac nd Fac
nd Fac nd Fac nd Fac nd Fac
nd Fac nd Fac nd Fac nd Fac nd Fac nd Fac nd Fac nd Fac nd Fac nd Fac nd Fac nd Fac nd Fac nd Fac nd Fac nd Fac
nd Fac nd Fac nd Fac nd Fac nd Fac nd Fac
nd Fac
nd Fac nd Fac nd Fac nd Fac nd Fac nd Fac nd Fac nd Fac nd Fac
rainage
ctivities lates to ervices a ervices a
ervices a ervices a ervices a ervices a
ies
ervices a ervices a ervices a ervices a ervices a ervices a ervices a ervices a ervices a ervices a ervices a ervices a ervices a ervices a ervices a ervices a
ervices a ervices a ervices a ervices a ervices a ervices a
ervices a
ervices a ervices a ervices a ervices a ervices a ervices a ervices a ervices a ervices a
and D
A d re
er
unity S unity S
unity S unity S unity S unity S age age uppl S wat unity S unity S unity S unity S unity S unity S unity S unity S unity S unity S unity S unity S unity S unity S unity S unity S
unity S unity S unity S unity S unity S unity S
unity S
unity S unity S unity S unity S unity S unity S unity S unity S unity S
Fun m m
m m m m er er er m m m m m m m m m m m m m m m m m
m m m m m m
m
m m m m m m m m m
at
Group of the Com Com
Com Com Com Com Sew Sew W Stor Com Com Com Com Com Com Com Com Com Com Com Com Com Com Com Com
Com Com Com Com Com Com
Com
Com Com Com Com Com Com Com Com Com
rainage
vices
ies
er
and D
he lates to
uppl er
ty S
ty t
ves ves
ves ves ves ty age age S wat ves ves ves ves ves ves ves ves ves ves ves ves ves ves ty ty
ves ves ves ves ves ves
ves
ves uni ves ves ves ves ves ves ves
ivi d re er er
er er er
er er er m er er er er er er er er er er er er er er
er er er er er er
er
er m er er er er er er er
at
Act Fun Res Res
Res Res Res Proper Sew Sew W Stor Res Res Res Res Res Res Res Res Res Res Res Res Res Res Proper Proper
Res Res Res Res Res Res
Res
Res Com Res Res Res Res Res Res Res
und
ve ve
F
er er
es es
und
ent
R
ve
d
F
R
ve
er
und ent
er
es
ent
elopm und
ent
ve
F
F
er
ve
es
ve R
s Fun
R
er
und
ne 2014
ev
ent elopm
ve es
ve
er
d es ent
ve
F tion
elopm
D ent
elopm
ve
er
iation
ev
er R
er
er
es
ent
R
ev
es
ev es ent
es
Fun
es
ve
rant
30 Ju
es
D
out elopm
elopm
R
ent elopm
otion
er
ontribu
ssoc
und
ev
elopm
reservation
es
ovt G
ves
ev
ade D ade D
vision R
e Fund
D
ent elopm
d
vision R
ent
rom
Pavilion elopm
vision R
e P P
R
ent C
t
ions A
ve F er
pgr
ilion D
pgr
ev
vision R re
ubdi
ev hip Dev
tabl
ent
m t rus
k
ot
ves as at
er
ycling R ves
av
elopm D e Fund
Fun
ubdi
d
e Fund ain Dev ain
cal Hil es ubdi
ridg rism
lock G
ar
es
C er
B
rus
cue
es d
ipes U ond U ev er
ubdi
elopm
e Fund
e T
t
rom
tabl
ilities e Fund
d e Fund
tabl om om all D owns
oni ont
ry B
T
ial P
P es
h R hip Res
ve P P P D
Fun
elopm
ses evelop
rus
d R
wat
ty Cent
er er er er m es
tabl d Land S
Dev es
s D
tabl
s Tou
ev
ur
ros
ain Gates
or
ay s R
alking & ar SA Fun es
at
ont
uni
tabl d Land S
es ar
ve ont ings D
ings H ings T
ings C ings C d Land S es
om y T em
ust
und Reser
eac owns
ew ew
tor
d Land S m
es ar SA Fun ont
avilion er
pr pring pr pr
pr pr ar ont rge Fer pring
y D
y N ary D
aintenanc
ust
vent
F
R
ar
k W
k C
ar
ar ibr lain B
ley B ley T
ley W ley W
ley R ley S ley S ley W ley S ley C
om
ont
R
es
S
S S
S S W C
M
Gatew
i W i C
i C iot W
iot C ar ra P
ar er er S er er
er er
Go er S
ber
den D
den M
se E
ber ber
ber ber berley ber ber ber ber ber ber ur ur uri Sports Fac ur
es
ar on Tr
aipa ihi R
unui unui aiau
ch Legac
rester Tr unui er
Special
Am Am
Am Am Am Am Am Am Am Am Am Am Am Am Am Chev Cheviot Chev Glenm W Om Glenm Hanm Hanm Hanm Hanm
Hanm Hanm Hur Hur W Hanm
Queen M
Queen M District L Cham Grav Culver Bus Haw Brids For Hur Adv
⌂
94
Annual Repor
4
t 2013/14 4
ng
$
3
0
688 829
086 353 65 248) 397 791 564 038) 667 845 368 288 557 150 919
273 360
728
611
996 579 177 328 050 125
114
5, 3, 387 2, 8, 963) 189
415) 069)
210 4, 627 610 224
939
095 897) 342 1,
4, 1, 1,
905
Closi Balance ne 2013
51, 192,
75, 294,
(35, 175, 70, 112, (61, 42, 18, 42, 22, 20,
24,
(2, 36,
(36,
19, 47,
33, 18, 48,
17,
13,
(783,
310,
229, (57,
974,
1,
1,
30 Ju
) $
ers
0
0 0 0 0 0 0 0 0 0 0 0 0 0 0 0 0 0
0 0 0 0 0
0 0
0 0
0
0 0 0 0 0 0 0 0 0 0 0
897
083)
000
466
nsf (Out
(348)
In/
23,
(7,
1,
17,
Tra
012-2013
$
riations 2 us/
65
3
0
7
0
(38)
78
74 21
39 42
eficit)
020
920
446 646 452 643
177
279
375 934
886
863
116 141 576 945
643
160
1, 203
361
237 803 908 563 649 9,
1, 7, 761)
3,
5, 4, 667
4, 676)
2, 667
5, 5, 4,
124
548
(653)
149
Surpl (D
162,
61, 216,
21, 141, 151, 101, 72,
(3,
16,
(26,
16,
165,
81,
237,
Approp
1,
$
ng
0
0
ni
771 626
167 992
485) 594 117) 002 686) 222 199 916 645 318 973 957 108 195 068 897) 522
300) 394)
866 543 495 833 034 280
814
095 445) 699 922 558 170 168 011 083 653 114
289
ly 2012
26, 30,
13, 77,
33,
11,
33, 18, 40, 14, 24, 4, 3, 21, 2, 10, (7, 19,
16, 30, 3, 28, 13, 43,
16, 1,
4, 1, 1,
13,
Ope Balance
(56,
(81,
(133,
(41, (756,
145,
229, (139,
720,
1 Ju
1,
pital
ley
os
er
ber
orm
m
ings
y H
pr
ar
he F
ain
ings
S
pr
er
om
ley in the A
ilion
ueen M
ings
S
ies
ies
ies ies
ber es
er
pr
er
Q
lock on t
er den D er
er er
out
ley
av
wat
S
n Hanm
er
B
et
et
et et
ber
m
er all
m
or
ses
in Am
ve P
ea i
ulver
er ipes ond
tor
em
em
em em
n Hanm
ar d
ur
y
ves
P P
ycling R
es
ve
ings H re i
ar
the f
il's C he C il's C
il's C il's C
er
in Am
er er er
er
pr
of
brar ley
ves
ew ew at ings S
d
S ent
ridge
the N
er
ley R
pr d
alkway
ounc
ounc
ounc ounc
S ar
d
ar ain in Hanm er
ings W
d
d ent
e of
ber
hip res
es
ber ley S ley S ley W er
d
ar
ihi Res
m
m
om anm
pr
ar
ar
istrict Li
ns
m
re d ar
k W
own C
cal W S
W erry B
alking and C
d r
elopm
ar
ber ber ber
m m m anm ley W
ar i W
iot W
ar
oni er
k In A in the C leading into t in the C
in the C in the C
tow W
w
the A A A A H ber
ent i W ur
unui
ar
m
the O
the D the H the T
C
aiau F ings W dev
the D
es
ty C ur m
hev
lenm
anm
ur
pr
aintenanc
SA
tones
tones
tones tones
uni m
S
lain P
m
SA
the W er
es
es ve es es
ojects for ojects for
ojects for
the gat
ley R ojects for ojects for ojects for ojects for ojects for
ojects for
ojects for ojects for ojects for
ojects for
ojects for
k and m
ojects for ber av
av
av av
of
er
ds h
om
iot R
ilion
d
e of anm
or
gr
gr es gr gr
ber
d
d av
ar
ham
ent
eac
m
ojects in the A ar
ojects in the A d hev ojects in the C ar
ojects in the G
ojects in the H W ojects in the H
ng w
e of
e of
e of e of
e Fun
elated pr elated pr
elated pr
elated pr elated pr elated pr elated pr elated pr
i W den C ilities in the A
ar
k W
elated pr
elated pr elated pr elated pr
elated pr
the H elated pr
elated pr
den R
ley B
acem
ar
th r th r
th r the A th r th r th r th r th r ve pr ur
unui
m ulver
ve pr iot W the C ve pr ar aipara P th r ve pr th r th r th r
th r ve pr ur ve pr aintenanc
th r
heni
th r
epl
aw
eserv ber
er
ts fac er
er
er
er
er
m ow ow
ow f of ow ow ow ow ow
f of
ow
ow ow ow
ow
ow
ow ojects on C aintenanc
aintenanc
aintenanc aintenanc
gr gr
gr
gr gr gr gr gr res
res hev
res lenm
gr res gr gr gr
gr res
res the m ojects for gr
trengt
gr pr m the r m he H m m
ng R A
the A the C spor
C
G the W
the H
e s
di
for for
for
for for for for for for
for
for
for for for for for
for for
for for
pital Site
ing pr for
for for for for for
for for
os
Hol
on behal
on behal
ket
thquak
or ojects for
ojects for ojects for ojects for
ojects for
ojects for ojects for
ojects for
ar
y H
ojects on t
ide funds ide funds
ide funds
ide funds ide funds ide funds ide funds ide funds ide funds
ide funds
ide funds
ide funds ide funds ide funds ide funds ide funds
ide funds ide funds
ide funds ide funds
ide funds
ar ide funds ide funds ide funds ide funds ide funds
ide funds ide funds
ov ov
d funds
d funds
d ov
ov ov ov ov ov ov
ov
ov
ov ov ov ov ov
ov ov
ov ov
ov
ov ov ov ov ov
ov ov
ar
Reason f To fund pr To pr To pr W To pr To hol To pr To pr To pr To pr To pr To pr To fund pr To fund pr To fund pr To pr To fund pr To hol To pr To fund pr To fund pr To pr To pr To pr To pr To pr
To pr To pr To fund pr To pr To pr To fund m To pr Site To fund ear Queen M To pr To pr To pr To pr To pr To fund pr To pr To pr
ilities ilities
ilities ilities ilities ilities
ilities ilities ilities ilities ilities ilities ilities ilities ilities ilities ilities ilities ilities ilities ilities
ilities ilities ilities ilities ilities ilities
ilities
ilities ilities ilities ilities ilities ilities ilities ilities ilities
nd Fac nd Fac
nd Fac nd Fac nd Fac nd Fac
nd Fac nd Fac nd Fac nd Fac nd Fac nd Fac nd Fac nd Fac nd Fac nd Fac nd Fac nd Fac nd Fac nd Fac nd Fac
nd Fac nd Fac nd Fac nd Fac nd Fac nd Fac
nd Fac
nd Fac nd Fac nd Fac nd Fac nd Fac nd Fac nd Fac nd Fac nd Fac
rainage
ctivities lates to ervices a ervices a
ervices a ervices a ervices a ervices a
ies
ervices a ervices a ervices a ervices a ervices a ervices a ervices a ervices a ervices a ervices a ervices a ervices a ervices a ervices a ervices a
ervices a ervices a ervices a ervices a ervices a ervices a
ervices a
ervices a ervices a ervices a ervices a ervices a ervices a ervices a ervices a ervices a
and D
A d re
er
unity S unity S
unity S unity S unity S unity S age age uppl S wat unity S unity S unity S unity S unity S unity S unity S unity S unity S unity S unity S unity S unity S unity S unity S
unity S unity S unity S unity S unity S unity S
unity S
unity S unity S unity S unity S unity S unity S unity S unity S unity S
Fun m m
m m m m er er er m m m m m m m m m m m m m m m m
m m m m m m
m
m m m m m m m m m
at
Group of the Com Com
Com Com Com Com Sew Sew W Stor Com Com Com Com Com Com Com Com Com Com Com Com Com Com Com
Com Com Com Com Com Com
Com
Com Com Com Com Com Com Com Com Com
rainage
vices
ies
er
and D
he lates to
uppl er
ty S
ty t
ves ves
ves ves ves ty age age S wat ves ves ves ves ves ves ves ves ves ves ves ves ves ty ty
ves ves ves ves ves ves
ves
ves uni ves ves ves ves ves ves ves
ivi d re er er
er er er
er er er m er er er er er er er er er er er er er
er er er er er er
er
er m er er er er er er er
at
Act Fun Res Res
Res Res Res Proper Sew Sew W Stor Res Res Res Res Res Res Res Res Res Res Res Res Res Proper Proper
Res Res Res Res Res Res
Res
Res Com Res Res Res Res Res Res Res
und
ve ve
F
er er
es es
und
ent
R
ve
d
F
R
ve
er
und ent
er
es
ent
elopm und
ent
ve
F
F
er
ve
es ve R
s Fun
R er
und
ne 2013
ev
ent elopm
ve es
ve
er
es ent
ve
F tion
elopm
D ent
elopm
ve
er
iation
ev
er R
er
er
es
ent R
ev
es
ev es ent
es
es
ve
rant
30 Ju
es
D
out elopm
elopm
R
ent elopm
otion
er
ontribu
ssoc
und
ev
elopm
reservation
es
ovt G
ves
ev
ade D ade D
vision R
e Fund
D
ent elopm
d
vision R
ent
elopm
vision R
rom
e P P
R
ent C
t
ions A
ve F er
pgr
ilion D
pgr
ev
vision R re
ubdi
ev hip Dev
tabl
ent
m t rus
k
ot
ves as at
er
ycling R ves
av
elopm D e Fund
Fun
ubdi
d
e Fund ain Dev
cal Hil es ubdi
ridg rism
lock G
ar
es
C er
B
rus
cue
es d
ipes U ond U ev er
ubdi
elopm
e Fund
e T
t
rom
tabl
ilities e Fund
d e Fund
tabl om all D owns
oni ont
ry B
T
ial P
P es
h R hip Res
ve P P P D
Fun
elopm
ses evelop
rus
d R
wat
ty Cent
er er er er m es
tabl d Land S
Dev es
tabl
s Tou
ev
ur
ros
ain Gates
or
ay s R
alking & ar SA Fun es
at
ont
uni
tabl d Land S
es ar
ve ont ings D ings H ings T
ings C ings C d Land S es
om y T em
ust
und Reser
eac owns
ew ew
tor
d Land S m
es ar SA Fun ont
avilion er
pr pr pr
pr pr ar ont rge Fer pring
y D
y N ary D
aintenanc
ust
vent
F
R
ar
k W
k C
ar
ar ibr lain B
ley B ley T
ley W ley W
ley R ley S ley S ley W ley S ley C
om
ont
R
es
S S S
S S W C
M
Gatew
i W i C
i C iot W
iot C ar ra P
ar er er er
er er
Go er S
ber
den D
den M
se E
ber ber
ber ber berley ber ber ber ber ber ber ur ur uri Sports Fac ur
es
ar on Tr
aipa ihi R
unui unui aiau
ch Legac
rester Tr unui er
Special
Am Am
Am Am Am Am Am Am Am Am Am Am Am Am Am Chev Cheviot Chev Glenm W Om Glenm Hanm Hanm Hanm
Hanm Hanm Hur Hur W Hanm
Queen M
Queen M District L Cham Grav Culver Bus Haw Brids For Hur Adv
95
⌂
Hurunui District Council
ng
$
0
291)
027) 672) 915) 491) 358) 844) 274 445) 070) 053 312) 212 801) 348) 803) 548) 367) 865
887
591 699
7, 034) 415) 5, 212) 176 402) 3, 6, 033) 865 621) 952 774 828) 232) 412 763) 997) 368) 637) 761) 549) 514
003)
870)
Closi Balance ne 2014
42,
51,
(2,
16,
82, (3,
17,
(395,
(692, (70, (356, (70, (188, (89, 109, (239, 386,
(70,
(500, 956,
(88, (22,
(19, 743,
(210, 144, 292,
(24,
487, 192,
(507,
(633, (142, (326, (467, (115, (273, 134,
698,
260,
(1,
(2,
(1,
(1,
(1,
30 Ju
(10,
(24,
$
ital
0
0
0
0 0
0 0 0 0
0 0
0 0 0
0 0 0
0
ture
951)
202) 659) 682) 960) 128) 838) 325) 739) 456) 824) 846) (167) 815) 584)
217) 033) 928)
211) (621)
780)
512)
459) 798) 000)
000)
737)
Cap
(42,
(2,
(6,
(8,
(3,
(7,
(282, (22, (392, (14, (70, (24,
(19,
(37, (12,
(86, (266,
(71,
(10,
(10,
(182,
(117, (26,
(500,
221,
Expendi
(2,
013-2014
$
riations 2 us/
0
0
eficit)
326
919 256
197
149
919
9, 727 890) 237 904) 4, 516 365) 039) 931 652 330 696 (195) 517 3, 221 328) 045) 031 551 525 634
133 265) 525 353) 657 443 535 404 492 462 360 139 363 326) 554) 814
395
Surpl (D
81,
53,
395, (1, 39, (18,
13, (16, (1, 171, 40, 85, 66,
31,
10, (1, (91, 14, 23, 23, 51,
60, (3, 42, (13, 136, 46, 14, 182, 19, 66, 27, 24, 32, (7,
45,
Approp
(275,
388,
1,
$
ng
0
0
ni
665)
744) 270) 960) 640) 467) 102) 402 221) 249) 917 397) 727 315) 460) 607) 847) 483) 573 706) 159) 523) 764) 652 256) 673 434) 768) 660) 756) 296 331 904) 839) 920 225) 357) 507)
435) 005 700
003)
529)
ly 2013
80,
10,
(2,
8,
(7,
2,
56, 36,
23,
2, 88,
Ope Balance
(433,
(463, (57, (359, (53, (157, (46, 107, (233, 363,
(229,
(499, 756,
(48, (17,
(17, 649,
(233, 120, 333,
(53, (20, (25, 291,
(10, (571,
(700, (170, (350,
(108,
698,
427,
1 Ju
(1,
(2,
(1,
(1,
(1,
(10,
(23,
ings
pr
S
er
n Hanm
d
ar
STP&S
d
oad i
ar
tion
R
d
the H
d dar ings Wpr
ar
er
ec
ar
ings W
at
rot
ties
S
W
er pr
w er
e P
er oodbank
eni
i W iot W
S unui rol
ojects for
of at
ur
tion
er
hor
wat W
m
m hev anm er ur ont
ent w
er
er
m
ts ties
ties d A
m of
er
er
er
er
er e
eni
ties eni
ties
ar
anm
ollec
ion pr
ent
at
at i wat er
ew
ores
tor ing of
m ties eni m
eni
m
er
er
er
hip wat
at
er
wat
eni m
m in the A in the C in the H
in the H
e C
pans
er h w
er hip wat at
er er
h s
er
h F m
seal tion cos d A m
d A
al Fire C us
im treat
at
er
aikar
er
n the H
eac al wat at
w
ar
d A res res res
res
ex
al wat er
ings w
al w
ew er sew
ings sew ew er
learanc ings S
ar
d A
ings W
ur ef
at owns pr W ur
eac ew pr
eac
pr
truc
d A ar
pr ar
e i
R R
ey
ds nter ull treat
ur
ur
C
ar
k W
ley w
owns
S
R
alley
S
S
S W
or or
ield B
den w
i Plains al wat
iot w
er den-
ley sew den s
den s i sew ley B ley stor
ley W
ar
ar
er
iver er
er
unui
iot sew a V unau B
ar
y cons
i W iot W
unui cal cent cal cent cal cent idenc cal cent
e Fun
ber
ur
ber
ber ber
ber ur
m thf shley R ulver aiau T m almor aiau R hev aipara T anm aw
m ulver hev ret ot aipara s anm aw aikar m m
anm irst stage of
m m hev lenm anm ur edi edi edi
edi ded f ded f
A Lei A C W A B W C W H H Hur A C C G M W H H W A A Jed R H
brar A A C G H H m m m 's res m or or
relating to k
eserv
the f
tor
doc
icits rec icits rec
debt
ng R
istrict Li
di ojects relating to i ojects relating to f ojects for ojects for ojects for ojects for ojects for ojects for ojects for ojects for ojects for ojects for ojects for ojects for ojects for ojects for ojects for ojects for ojects for ojects for ojects for ojects for ojects for ojects for ojects for ojects for ojects for ojects for
D ojects for ojects for ojects for ojects for ojects for ojects for ojects for ojects for ojects for e of ojects for
nal
Hol tal pr tal pr tal pr tal pr tal pr tal pr tal pr tal pr tal pr tal pr tal pr tal pr tal pr tal pr tal pr tal pr tal pr tal pr tal pr tal pr tal pr tal pr tal pr tal pr tal pr tal pr tal pr tal pr ributions for tion of tal pr tal pr tal pr tal pr tal pr tal pr tal pr tal pr tal pr chas tal pr ious def ious def
or
y inter
api api api api api api api api api api api api api api
ev ev
capi api api api api api api api api api api api api api ont
api api api api api api api api api
api
t-onl
es
er
Reason f To fund c To fund c To fund c To fund c To fund c To fund c To fund c To fund c To fund c To fund c To fund c To fund c To fund c To fund c To fund To fund c To fund c To fund c To fund c To fund c To fund c To fund c To fund c To fund c To fund c To fund c To fund c To fund c To fund c To fund por To fund c To fund c To fund c To fund c To fund c To fund c To fund c To fund c To fund c To fund pur To fund c To fund pr To fund pr
Int
pa
S
ilities ilities ilities ilities ilities ilities ilities ilities ilities ilities ilities ilities
s &
y y
nd Fac nd Fac nd Fac nd Fac nd Fac nd Fac nd Fac nd Fac nd Fac nd Fac nd Fac nd Fac et et
al Pool
rainage rainage rainage rainage hs
Saf Saf
herm
ctivities lates to ies ies ies ies ies ies ies ies ies ies ies ies ies ies ies
ervices a ervices a ervices a ervices a ervices a ervices a ervices a ervices a ervices a ervices a ervices a ervices a
and D and D and D and D ootpat
al and al and
ings T
A
pr
d re uppl uppl uppl uppl uppl uppl uppl uppl uppl uppl uppl uppl uppl uppl uppl
er er er er
ent ent
S
S S S S S S S S S S S S S S S age age age age age age age age age wat wat wat wat and F unity S unity S unity S unity S unity S unity S unity S unity S unity S unity S unity S unity S
er
Fun er er er er er er er er er er er er er er er er er er er er er er er er m m m m
m m m m m m m m m m m m
at at at at at at at at at at at at at at at
ironm ironm
Group of the W W W W W W W W W W W W W W W Sew Sew Sew Sew Sew Sew Sew Sew Sew Stor Stor Stor Stor Roads Com Com Com Com Com Com Com Com Com Com Com Com Env Env
Hanm
s
al Pool
rainage rainage rainage rainage hs
herm
vices vices vices vices vices vices vices
vices
ies ies ies ies ies ies ies ies ies ies ies ies ies ies ies
er er er er er er er
er
and D and D and D and D ootpat
isation ings T
he
y S
pr
lates to uppl uppl uppl uppl uppl uppl uppl uppl uppl uppl uppl uppl uppl uppl uppl
er er er er
ty S ty S ty S ty S ty S ty S ty S
inim S
ty t
S S S S S S S S S S S S S S S age age age age age age age age age wat wat wat wat and F uni uni uni uni uni uni uni ty ty ty ty ty
er
ivi d re er er er er er er er er er er er er er er er er er er er er er er er er m m m m
m m m m m m m
genc
a
at at at at at at at at at at at at at at at
er aste M
Act Fun W W W W W W W W W W W W W W W Sew Sew Sew Sew Sew Sew Sew Sew Sew Stor Stor Stor Stor Roads Com Com Com Com Com Com Com Proper Proper Proper Proper Proper Em W Hanm & Sp
Loan
nal
er
ne 2014
er
tion
nt
at
ec
al
ve I
rot
e
er
30 Ju
tage 1 ard
er S
er
e P
W
rinking W
at
hor
wat
ties
al
al Res
unds
D
er
ater er
er
er
m ing -
al
cal Gener cal Hous re
at
ater
W at i W er
eni
ew
ores er e tor eal berley
m
ener edi edi ent
herm
unds as at
for
er
W
er
at
er ew
wat
m
ener
ve F
ent
er h W at er
ater
at
aikar
er er
ew h S
er
h F m
enities
ties
rol tion
ve F
m
er
nship
er
enities
ent at
at
oad S
cal G
cal C
eser
eac al W
nship s W at
er
er
al W er
ew
S
ew
at
ings W
al W
ings S
ings S
ings A
ings M ings M
ings T
pr W ur ew
eac tor learanc
m
enities m
eni
ew
eac ew pr
ew
C pr R ary - A A enities m
pr m cal G edi pr pr edi Cont ollec
pr
e R
eser
ibr
edi
eatm ley W
den W Tow lain al W
ra Tow S
R
S
S
m
S A
S S
S
er den -
ley S den S
alley
er den S i S ley B ley S iver er
A ark A er
er er i M ire e C
er
at
e R
im treat
ield B
iot W
ar
iot S a V
ar
i M iot M
R
er
ber thf
aiau uri P
aiau Rur
aipa
unui ber
unau B
ot aipara S
aikar ber ber
oodbank
berley uri A
nm
unui ur
aikar al F us
Rat
Int Full Tr Am Lei Ashley Rur Culver W Am Balmor W Chev W Hanm Haw Hur Am Culver Chev Gret M W Hanm Haw W Am Am Jed R Hanm W District L Am Am Cheviot Gle Hanm Hur Am Chev Hanm Hanm W Rur Ref
Hanm
Total
⌂
96
Annual Repor
4
t 2013/14 4
ng
$
0
665)
744) 270) 960) 640) 467) 102) 402 221) 249) 917 397) 727 315) 460)
847) 483)
706) 159)
764) 652 256)
434) 768) 660) 756) 296 331 904) 839) 920 225) 357) 507) 435)
700
003)
529)
Closi
8,573
2,673
2,005
Balance ne 2013
80,
10,
(2,607)
(7,523)
56, 36,
23,
88,
(433,
(463, (57, (359, (53, (157, (46, 107, (233,
(48, (17,
(17,
120,
(53, (20, (25,
(10,
698,
427,
(1,363,
(229,
(499, (2,756,
(1,649,
(233,
(1,333,
(1,291,
(571,
(700, (170, (350, (108,
30 Ju
(10,
(23,
ital
$
0
0
0
0
0
0 0 0 0
0
0 0 0 0 0
ture
218)
064) 829) 937) 694) 255)
037) 633) 170) 641) 272) 880) 986)
439)
585)
905)
194)
333) 231) 910)
162)
000)
544)
Cap
(1,643) (9,695)
(2,880)
(1,320)
(7,083)
(2,546)
(474,
(161, (59, (225, (15, (245,
(16, (273, (11, (37, (18, (137, (20,
(10,
(15,
(243,
(38,
(109, (178, (72,
(222,
Expendi
(2,000,
(4,613,
012-2013
riations 2 us/
$
0
0
eficit)
553
9,282 1,449 705 2,924 304 5,383 7,191 214 000 9,672 929 787 511 923) (182) 249 733 5,562
332) 9,023 591 710 264) 310 169) 9,053 822
023 240 1,123 302 818 264 229 050 1,589
665
943
Surpl (D
40,
820,
26,
30, 84,
143, 37, 155,
22,
(1,233)
17, 22,
36, (5,492) 79, 44,
17,
23, 15,
(3,718)
Approp
(187,
(61,
(103,
(13,
154,
117,
107,
1,683,
$ 0 0
ning
962)
728) 870) 484 841) 907 398) 615) 415 685)
946) 551)
658) 335) 596 473) 922) 546) 035) 942 798)
265) 821) 482) 931) 503 001
978)
943) 586) 557) 024)
965)
003)
928)
ly 2012
1,110
61,
82,
(8,788)
(2,426)
18,
97,
2,363
65, (4,943)
6,102
5,723
Ope Balance
(311,
(954, (40,
(49, 109, (247,
(335,
(516,
(60, (15,
(16,
(16, (250,
(40, (29, (62,
155,
(503,
(814, (193, (365, (110,
(18,
497,
1 Ju
(1,173,
(2,547,
(1,343,
(1,191,
(1,176,
(8,698,
(20,
ings
pr
S
er
n Hanm
d
ar
STP&S
oad i
tion
R
d
the H
d d ings W ar
ar ar pr
ater
rotec
ties
S W
w
er
e P
oodbank
i W iot W
unui
ojects for
of ater
rol tion
w
hor
W ts ties
ties meni
mur hev anm ur ont
ment of
er
er
mwater
ties
d A ties
ion pr
ater
ater i water
ollec
ew
ores
e tor ing of
meni ties
meni ar
ment
er
h w
hip water
ater
meni
meni in the A in the C in the H in the H
e C
pans
hip water ater
er er
h s
er
h F mwater
seal tion cos d A meni
d A
al Fire C
im treat
ater
aikar
er
eac al water ater
w
d A
ex
al water
ings w
al w
ew er sew
ings sew ew er
ings S
ar
d A ar ings W
res res res res ur efus
ater owns pr W ur
eac ew pr
eac
learanc pr
truc
d A ar
pr ar
R R
ey
ds nter ull treat
ur
ur
C
k W
ley w
ar
den w
S
R
alley
S
S
S W
or or
i Plains al water
iot w
er den-
ley sew den s
den s i sew ley B ley stor
ley W
ar
ar
iot sew
er ar
iver er
y cons
i W iot W
er
cal cent cal cent cal cent cal cent
e Fun
unui
unui
mber thfield B shley R ulver aiau Towns mur almor aiau R hev aipara T anm aw
mber ulver hev reta V otunau B aipara s anm aw aikar mber mber
anm irst stage of
mber mur hev lenm anm ur edi edi edi edi ded f ded f
A Lei A C W A B W C W H H Hur A C C G M W H H W A A Jed R H
brar A A C G H H m m m m or or
relating to k
eserv
the f
istrict Li
icits rec icits rec
debt
ojects relating to i ojects relating to f ojects for ojects for ojects for ojects for ojects for ojects for ojects for ojects for ojects for ojects for ojects for ojects for ojects for ojects for ojects for ojects for ojects for ojects for ojects for ojects for ojects for ojects for ojects for ojects for ojects for ojects for
D ojects for ojects for ojects for ojects for ojects for ojects for ojects for ojects for ojects for ojects for
nal
Holding R tal pr tal pr tal pr tal pr tal pr tal pr tal pr tal pr tal pr tal pr tal pr tal pr tal pr tal pr tal pr tal pr tal pr tal pr tal pr tal pr tal pr tal pr tal pr tal pr tal pr tal pr tal pr tal pr ributions for
tal pr tal pr tal pr tal pr tal pr tal pr tal pr tal pr tal pr tal pr ious def ious def
or
tion of
api api api api api api api api api api api api api api
ev ev
y inter
capi api api api api api api api api api api api api api ont
api api api api api api api api api api
t-onl
es
Reason f To fund c To fund c To fund c To fund c To fund c To fund c To fund c To fund c To fund c To fund c To fund c To fund c To fund c To fund c To fund To fund c To fund c To fund c To fund c To fund c To fund c To fund c To fund c To fund c To fund c To fund c To fund c To fund c To fund c To fund por To fund c To fund c To fund c To fund c To fund c To fund c To fund c To fund c To fund c To fund c To fund pr To fund pr
Inter
pa
S
ilities ilities ilities ilities ilities ilities ilities ilities ilities ilities ilities
s &
rainage rainage rainage rainage hs
Safety Safety
ctivities lates to ies ies ies ies ies ies ies ies ies ies ies ies ies ies ies
ootpat ervices and Fac ervices and Fac ervices and Fac ervices and Fac ervices and Fac ervices and Fac ervices and Fac ervices and Fac ervices and Fac ervices and Fac ervices and Fac al and al and
ings Thermal Pool
A
and D and D and D and D
pr
d re uppl uppl uppl uppl uppl uppl uppl uppl uppl uppl uppl uppl uppl uppl uppl
ent ent
S
S S S S S S S S S S S S S S S age age age age age age age age age
and F
er
Fun
er er er er er er er er er
ater ater ater ater ater ater ater ater ater ater ater ater ater ater ater
mwater mwater mwater mwater
ironm ironm
Group of the W W W W W W W W W W W W W W W Sew Sew Sew Sew Sew Sew Sew Sew Sew Stor Stor Stor Stor Roads Community S Community S Community S Community S Community S Community S Community S Community S Community S Community S Community S Env Env
Hanm
s
rainage rainage rainage rainage hs vices vices vices vices vices vices vices
vices
ies ies ies ies ies ies ies ies ies ies ies ies ies ies ies
ootpat er er er er er er er
er isation ings Thermal Pool
he
and D and D and D and D
y S
lates to
pr
uppl uppl uppl uppl uppl uppl uppl uppl uppl uppl uppl uppl uppl uppl uppl
ty S ty S ty S ty S ty S ty S ty S
inim S
S S S S S S S S S S S S S S S age age age age age age age age age
and F
ty ty ty ty
er
ivity t d re
er er er er er er er er er
muni muni muni muni muni muni muni
genc
a
ater ater ater ater ater ater ater ater ater ater ater ater ater ater ater
mwater mwater mwater mwater
aste M
Act Fun W W W W W W W W W W W W W W W Sew Sew Sew Sew Sew Sew Sew Sew Sew Stor Stor Stor Stor Roads Com Com Com Com Com Com Com Proper Proper Proper Proper Emer W Hanm & Sp
Loan
nal
ne 2013
tion
nter
ater
al
ve I
rotec
er
30 Ju
tage 1 ard
e P
S W
rinking W
ater
hor
ties
al
unds
D
ater
er
er
mwater ing -
al
cal Gener re
ater
ater
W ater i W
ew
ores
e tor eal
meni
ener edi
unds as at
for
W
er ew
mberley
ent
ve F
h W ater
ater
ater
ater
ener
aikar
er er
ew h S
er
h F mwater
ties
rol tion
ve F
ment
ater
nship
er
cal G
eser
eac
ater
oad S
al W
nship s W ater
cal C
al W
ew er
ew er
ater
ings W
al W
S
ings S
ings S
ings A
ings M
ings Thermal Res
pr W ur ew
learanc
menities
ew
eac ew pr
ew eac tor
menities
C pr R ary - A A
menities
pr meni cal G
pr edi Cont ollec
pr
e R
eser
eatment ley W
den W Tow lain al W
ra Tow S
S
S
S
edi
S
S
er den - R ley S den S
alley
er den S i S ley B ley S
menities
A
iver er
A
er
er i M
e C
er
at
e R
im treat
iot W
iot S
i M iot Medi
thfield B
ar
ar
aiau
aiau Rur
aipa
unui
aipara S
aikar
oodbank
nmark A
unui
aikar al Fire
Rat
Inter Full Tr Amber Lei Ashley Rur Culver W Amuri P Balmor W Chev W Hanm Haw Hur Amber Culver Chev Greta V Motunau B W Hanm Haw W Amber Amber Jed R Hanm W District Libr Amberley Amuri A Cheviot Gle Hanm Hur Amur Chev Hanm W Rur Refus
Hanm
Total R
97
⌂
Hurunui District Council
Note 32: Rating Base Information
Section 30A of the Local Government Act 2002, requires Councils to disclose rating base information within the District
as at 30 June 2014. The relavent information is as fol ows:
(a) Number of rating units within the district:
8,
010
(b) Total Capital Value of rating units within the district:
5,
$ 734,645,650
(c) Total Land Value of rating units within the district:
3,
$ 722,148,900
Note 33: Insurance of Assets
Section 31A of the Local Government Act 2002, requires Councils to disclose information about insurance on its
assets as at 30 June 2014. The relavent information is as fol ows:
(a) The total value of al assets of the Council that are covered by insurance contracts, and the maximum amount
to which they are insured:
Buildings
The Hurunui District Council has adopted a tiered structure in respect to the insurance policy on its buildings.
The structure allows for full insurance cover on buildings that are deemed to be essential and for buildings that
are deemed discretionery, the Council has resolved to eliminate the natural disaster cover.
Carrying Value of Buildings with insurance cover:
$ 37,
995,645
Maximum amount insured for Buildings with full insurance cover:
$ 51,
971,816
Maximum amount insured for Buildings with limited insurance cover:
$ 24,
666,500
Vehicles
All Council vehicles have full insurance coverage.
Carrying Value of Vehicles with insurance cover:
$ 1,
269,949
Maximum amount insured for Vehicles with full insurance cover:
$ 1,
802,389
Forestry
The Forestry Estate is insured for accidental physical damage or destruction caused by fire, lightning, impact,
malicious damage.
Carrying Value of Forestry Assets:
$ 950,
245
Maximum amount insured for Forestry Assets:
$ 2,
058,459
(b) The total value of al assets of the Council that are covered by financial risk sharing arrangements, and the
maximum amount available to the Council under those arrangements.
The Hurunui District Council is a member of the Local Authority Protection Programme (LAPP). This covers
Council for 40% of the reinstatement of infrastructural assets as a result of a natural disaster, with central
government contributing to remaining 60%.
Carrying Value of Water Supplies covered by LAPP:
$ 42,
527,000
Carrying Value of Sewerage Schemes covered by LAPP:
$ 17,
029,000
Carrying Value of Stormwater Systems covered by LAPP:
$ 3,
524,000
Maximum amount covered by LAPP:
$ 91,
343,489
(c) The total value of al assets of the Council that are self-insured, and the value of any fund maintained by
Council for that purpose.
The Hurunui District Council has not set funds aside for assistance to meeting the reinstatement costs of
damage on assets that are not insured. The Council does not have any insurance covering on its Roading
Assets which has a carrying value of $208,780,000.
⌂
98
Annual Repor
4
t 2013/14 4
Note 34: Core Asset Information
Clause 6 of the Local Government (Financial Reporting and Prudence) Regulations 2014, requires Councils to disclose
information about its core assets.
Acquisitions made during 2013/2014
Closing Book Value
Constructed by Council
Vested in Council
($000's)
($000's)
($000's)
Water Supply - Treatment Plants and facilities
4,
622
106
-
Water Supply - Other Assets
37,
878
910
96
42,
500
1,
016
96
Sewerage - Treatment Plants and facilities
4,
731
117
-
Sewerage - Other Assets
12,
298
243
223
17,
029
360
223
Stormwater and Drainage
3,
524
11
141
Flood Protection and Control Works
-
-
-
Roads and Footpaths
208,
870
3,
030
549
All assets are valued on a deemed cost valuation basis.
99
⌂
Hurunui District Council
Funding impact statements
WHOLE OF COUNCIL - FUNDING IMPACT STATEMENT
FOR THE YEAR ENDED 30 JUNE 2014
2014
2014
2013
2013
Annual
Annual
Long Term
Annual
Plan
Report
Plan
Report
$000's
$000's
$000's
$000's
Sources of operating funding
General rates, uniform annual general charges, rates penalties
5,982
6,144
5,629
5,697
Targeted rates (other than a targeted rate for water supply)
8,022
8,247
7,627
7,878
Subisidies and grants for operating purposes
1,613
3,267
1,563
1,476
Fees, charges, and targeted rates for water supply
471
631
444
741
Interest and dividends from investments
74
137
72
137
Local authorities fuel tax, fines, infringements, and other receipts
12,801
16,861
12,031
12,745
Total operating funding (A)
28,963
35,287
27,366
28,674
Applications of operating funding
Payments to staff and suppliers
25,326
30,499
23,526
24,843
Finance costs
1,223
0
969
709
Other operating funding applications
0
0
0
0
Total applications of operating funding (B)
26,549
30,499
24,495
25,552
Surplus/(deficit) of operating funding (A-B)
2,414
4,787
2,871
3,122
Sources of capital funding
Subsidies and grants for capital expenditure
1,775
1,851
1,821
2,130
Development and financial contributions
617
472
608
1,530
Assets vested in Council
0
1,010
0
0
Increase/(decrease) in debt
1,771
3,850
4,265
350
Gross proceeds from sale of assets
0
0
0
246
Lump sum contributions
0
0
0
0
Total sources of capital funding (C)
4,163
7,183
6,694
4,256
Applications of capital funding
Capital expenditure:
- To meet additional demand
390
1,444
848
0
- To improve the level of service
1,720
2,916
4,909
2,803
- To replace existing assets
5,109
4,318
5,007
4,645
Increase/(decrease) in reserves
(642)
3,291
(1,199)
(71)
Increase/(decrease) in investments
0
0
0
0
Total applications of capital funding (D)
6,577
11,969
9,565
7,378
Surplus/(deficit) of operating funding (C-D)
(2,414)
(4,786)
(2,871)
(3,122)
Funding balance ((A-B)+(C-D))
0
0
0
0
Reconciliations between Financial Summary and Funding Impact Statement
Surplus/(Deficit) after tax
(1,479)
(1,858)
(227)
2,773
Add Depreciation
6,298
8,214
5,804
6,792
Add Loss on Disposal
0
0
0
405
Less change in fair value of derivatives
0
0
0
(387)
Less gains on forestry revaluation
(13)
1,788
(277)
(401)
Less gains on asset sales
0
0
0
(26)
Less gains in value of NZUs
0
(25)
0
54
Less Development and Financial Contributions
(617)
(472)
(608)
(1,530)
Less Subsides and Grants for Capital Expenditure
(1,775)
(1,851)
(1,821)
(2,130)
Less Vested Asset income
0
(1,010)
0
(2,428)
Surplus/(deficit) of operating funding (A-B)
2,414
4,786
2,871
3,122
⌂
100
Annual Repor
4
t 2013/14 4
WATER SUPPLIES - GROUP ACTIVITY FUNDING IMPACT STATEMENT
FOR THE YEAR ENDED 30 JUNE 2014
2013
2014
2014
Long-Term
Long-Term
Annual
Plan
Plan
Report
$000's
$000's
$000's
Sources of operating funding
General rates, uniform annual general charges, rates penalties
0
0
0
Targeted rates (other than a targeted rate for water supply)
3,773
3,986
4,114
Subisidies and grants for operating purposes
0
0
0
Fees, charges, and targeted rates for water supply
444
471
631
Internal charges and overheads recovered
9
6
0
Local authorities fuel tax, fines, infringements, and other receipts
108
111
0
Total operating funding (A)
4,334
4,574
4,745
Applications of operating funding
Payments to staff and suppliers
2,396
2,471
2,911
Finance costs
310
386
268
Internal charges and overheads applied
909
938
937
Other operating funding applications
0
0
0
Total applications of operating funding (B)
3,615
3,795
4,116
Surplus/(deficit) of operating funding (A-B)
719
779
629
Sources of capital funding
Subsidies and grants for capital expenditure
114
0
59
Development and financial contributions
130
135
154
Assets vested in Council
0
0
96
Increase/(decrease) in internal debt
1,130
(210)
160
Gross proceeds from sale of assets
0
0
0
Lump sum contributions
0
0
0
Total sources of capital funding (C)
1,374
(75)
469
Applications of capital funding
Capital expenditure:
- To meet additional demand
33
44
92
- To improve the level of service
1,534
82
465
- To replace existing assets
526
578
554
Increase/(decrease) in reserves
0
0
(13)
Increase/(decrease) in investments
0
0
0
Total applications of capital funding (D)
2,093
704
1,098
Surplus/(deficit) of operating funding (C-D)
(719)
(779)
(629)
Funding balance ((A-B)+(C-D))
0
0
0
Reconciliations between Financial Summary and Funding Impact Statement
Surplus/(Deficit) for Activity
30
(52)
(663)
Add Depreciation
933
966
1,603
Less Development and Financial Contributions
(130)
(135)
(154)
Less Subsides and Grants for Capital Expenditure
(114)
0
(59)
Less Vested Asset income
0
0
(96)
Surplus/(deficit) of operating funding (A-B)
719
779
630
101
⌂
Hurunui District Council
SEWERAGE - GROUP ACTIVITY FUNDING IMPACT STATEMENT
FOR THE YEAR ENDED 30 JUNE 2014
2013
2014
2014
Long-Term
Long-Term
Annual
Plan
Plan
Report
$000's
$000's
$000's
Sources of operating funding
General rates, uniform annual general charges, rates penalties
0
0
0
Targeted rates (other than a targeted rate for water supply)
618
684
720
Subisidies and grants for operating purposes
0
0
0
Fees, charges, and targeted rates for water supply
0
0
0
Internal charges and overheads recovered
0
0
0
Local authorities fuel tax, fines, infringements, and other receipts
0
0
1
Total operating funding (A)
618
684
721
Applications of operating funding
Payments to staff and suppliers
289
304
475
Finance costs
293
360
347
Internal charges and overheads applied
134
138
139
Other operating funding applications
0
0
0
Total applications of operating funding (B)
716
802
961
Surplus/(deficit) of operating funding (A-B)
(98)
(118)
(240)
Sources of capital funding
Subsidies and grants for capital expenditure
0
0
0
Development and financial contributions
70
73
85
Assets vested in Council
0
0
223
Increase/(decrease) in internal debt
947
196
304
Gross proceeds from sale of assets
0
0
0
Lump sum contributions
0
0
0
Total sources of capital funding (C)
1,017
269
612
Applications of capital funding
Capital expenditure:
- To meet additional demand
507
34
462
- To improve the level of service
101
94
0
- To replace existing assets
311
23
122
Increase/(decrease) in reserves
0
0
(211)
Increase/(decrease) in investments
0
0
0
Total applications of capital funding (D)
919
151
372
Surplus/(deficit) of operating funding (C-D)
98
118
239
Funding balance ((A-B)+(C-D))
0
0
0
Reconciliations between Financial Summary and Funding Impact Statement
Surplus/(Deficit) for Activity
(394)
(418)
(432)
Add Depreciation
366
373
501
Less Development and Financial Contributions
(70)
(73)
(85)
Less Vested Asset income
0
0
(223)
Surplus/(deficit) of operating funding (A-B)
(98)
(118)
(239)
⌂
102
Annual Repor
4
t 2013/14 4
STORMWATER AND DRAINAGE - GROUP ACTIVITY FUNDING IMPACT STATEMENT
FOR THE YEAR ENDED 30 JUNE 2014
2013
2014
2014
Long-Term
Long-Term
Annual
Plan
Plan
Report
$000's
$000's
$000's
Sources of operating funding
General rates, uniform annual general charges, rates penalties
0
103
106
Targeted rates (other than a targeted rate for water supply)
279
286
318
Subisidies and grants for operating purposes
0
0
0
Fees, charges, and targeted rates for water supply
0
0
0
Internal charges and overheads recovered
0
0
0
Local authorities fuel tax, fines, infringements, and other receipts
0
0
0
Total operating funding (A)
279
389
424
Applications of operating funding
Payments to staff and suppliers
59
138
142
Finance costs
106
118
96
Internal charges and overheads applied
13
13
13
Other operating funding applications
0
0
0
Total applications of operating funding (B)
178
269
251
Surplus/(deficit) of operating funding (A-B)
101
120
173
Sources of capital funding
Subsidies and grants for capital expenditure
0
0
0
Development and financial contributions
17
19
32
Assets vested in Council
0
0
142
Increase/(decrease) in internal debt
176
(77)
(126)
Gross proceeds from sale of assets
0
0
0
Lump sum contributions
0
0
0
Total sources of capital funding (C)
193
(58)
47
Applications of capital funding
Capital expenditure:
- To meet additional demand
100
0
142
- To improve the level of service
194
62
11
- To replace existing assets
0
0
0
Increase/(decrease) in reserves
0
0
67
Increase/(decrease) in investments
0
0
0
Total applications of capital funding (D)
294
62
220
Surplus/(deficit) of operating funding (C-D)
(101)
(120)
(173)
Funding balance ((A-B)+(C-D))
0
0
0
Reconciliations between Financial Summary and Funding Impact Statement
Surplus/(Deficit) for Activity
73
90
268
Add Depreciation
45
48
78
Less Development and Financial Contributions
(17)
(18)
(32)
Less Vested Asset income
0
0
(142)
Surplus/(deficit) of operating funding (A-B)
101
120
173
103
⌂
Hurunui District Council
ROADS AND FOOTPATHS - GROUP ACTIVITY FUNDING IMPACT STATEMENT
FOR THE YEAR ENDED 30 JUNE 2014
2013
2014
2014
Long-Term
Long-Term
Annual
Plan
Plan
Report
$000's
$000's
$000's
Sources of operating funding
General rates, uniform annual general charges, rates penalties
3,331
3,448
3,427
Targeted rates (other than a targeted rate for water supply)
181
183
214
Subisidies and grants for operating purposes
1,563
1,612
3,267
Fees, charges, and targeted rates for water supply
0
0
0
Internal charges and overheads recovered
0
0
0
Local authorities fuel tax, fines, infringements, and other receipts
148
152
135
Total operating funding (A)
5,223
5,395
7,043
Applications of operating funding
Payments to staff and suppliers
2,836
2,924
5,191
Finance costs
2
2
3
Internal charges and overheads applied
598
618
541
Other operating funding applications
0
0
0
Total applications of operating funding (B)
3,436
3,544
5,735
Surplus/(deficit) of operating funding (A-B)
1,787
1,851
1,308
Sources of capital funding
Subsidies and grants for capital expenditure
1,707
1,774
1,792
Development and financial contributions
153
159
0
Assets vested in Council
0
0
549
Increase/(decrease) in internal debt
(3)
(3)
63
Gross proceeds from sale of assets
0
0
0
Lump sum contributions
0
0
0
Total sources of capital funding (C)
1,857
1,930
2,405
Applications of capital funding
Capital expenditure:
- To meet additional demand
153
159
749
- To improve the level of service
70
73
0
- To replace existing assets
3,421
3,549
2,831
Increase/(decrease) in reserves
0
0
132
Increase/(decrease) in investments
0
0
0
Total applications of capital funding (D)
3,644
3,781
3,712
Surplus/(deficit) of operating funding (C-D)
(1,787)
(1,851)
(1,307)
Funding balance ((A-B)+(C-D))
0
0
0
Reconciliations between Financial Summary and Funding Impact Statement
Surplus/(Deficit) for Activity
783
602
(422)
Add Depreciation
2,864
3,182
4,071
Less Development and Financial Contributions
(153)
(159)
0
Less Subsides and Grants for Capital Expenditure
(1,707)
(1,774)
(1,792)
Less Vested Asset income
0
0
(549)
Surplus/(deficit) of operating funding (A-B)
1,666
1,851
1,307
⌂
104
Annual Repor
4
t 2013/14 4
COMMUNITY SERVICES AND FACILITIES - GROUP ACTIVITY FUNDING IMPACT STATEMENT
FOR THE YEAR ENDED 30 JUNE 2014
2013
2014
2014
Long-Term
Long-Term
Annual
Plan
Plan
Report
$000's
$000's
$000's
Sources of operating funding
General rates, uniform annual general charges, rates penalties
80
135
157
Targeted rates (other than a targeted rate for water supply)
1,445
1,487
1,516
Subisidies and grants for operating purposes
0
0
0
Fees, charges, and targeted rates for water supply
0
0
0
Internal charges and overheads recovered
0
0
0
Local authorities fuel tax, fines, infringements, and other receipts
756
701
816
Total operating funding (A)
2,281
2,323
2,488
Applications of operating funding
Payments to staff and suppliers
2,831
2,798
2,770
Finance costs
262
257
235
Internal charges and overheads applied
998
1,020
1,019
Other operating funding applications
0
0
0
Total applications of operating funding (B)
4,091
4,075
4,025
Surplus/(deficit) of operating funding (A-B)
(1,810)
(1,752)
(1,537)
Sources of capital funding
Subsidies and grants for capital expenditure
0
0
0
Development and financial contributions
239
248
201
Assets vested in Council
0
0
0
Increase/(decrease) in internal debt
14
(130)
204
Gross proceeds from sale of assets
0
0
0
Lump sum contributions
0
0
0
Total sources of capital funding (C)
253
118
405
Applications of capital funding
Capital expenditure:
- To meet additional demand
55
151
0
- To improve the level of service
261
216
535
- To replace existing assets
125
70
102
Increase/(decrease) in reserves
(1,998)
(2,071)
(1,769)
Increase/(decrease) in investments
0
0
0
Total applications of capital funding (D)
(1,557)
(1,634)
(1,132)
Surplus/(deficit) of operating funding (C-D)
1,810
1,752
1,537
Funding balance ((A-B)+(C-D))
0
0
0
Reconciliations between Financial Summary and Funding Impact Statement
Surplus/(Deficit) for Activity
(1,969)
(1,905)
(1,911)
Add Depreciation
398
401
575
Less Development and Financial Contributions
(239)
(248)
(201)
Surplus/(deficit) of operating funding (A-B)
(1,810)
(1,752)
(1,537)
105
⌂
Hurunui District Council
ENVIRONMENT AND SAFETY - GROUP ACTIVITY FUNDING IMPACT STATEMENT
FOR THE YEAR ENDED 30 JUNE 2014
2013
2014
2014
Long-Term
Long-Term
Annual
Plan
Plan
Report
$000's
$000's
$000's
Sources of operating funding
General rates, uniform annual general charges, rates penalties
2,144
2,248
2,256
Targeted rates (other than a targeted rate for water supply)
1,046
1,064
1,163
Subisidies and grants for operating purposes
0
0
0
Fees, charges, and targeted rates for water supply
0
0
0
Internal charges and overheads recovered
0
0
0
Local authorities fuel tax, fines, infringements, and other receipts
1,290
1,330
1,726
Total operating funding (A)
4,480
4,642
5,145
Applications of operating funding
Payments to staff and suppliers
3,673
3,800
4,724
Finance costs
8
8
7
Internal charges and overheads applied
717
743
743
Other operating funding applications
0
0
0
Total applications of operating funding (B)
4,398
4,551
5,474
Surplus/(deficit) of operating funding (A-B)
82
91
(329)
Sources of capital funding
Subsidies and grants for capital expenditure
0
0
0
Development and financial contributions
0
0
0
Assets vested in Council
0
0
0
Increase/(decrease) in internal debt
2
19
230
Gross proceeds from sale of assets
0
0
0
Lump sum contributions
0
0
0
Total sources of capital funding (C)
2
19
230
Applications of capital funding
Capital expenditure:
- To meet additional demand
0
0
0
- To improve the level of service
50
26
1,154
- To replace existing assets
184
171
98
Increase/(decrease) in reserves
(150)
(87)
(1,352)
Increase/(decrease) in investments
0
0
0
Total applications of capital funding (D)
84
110
(99)
Surplus/(deficit) of operating funding (C-D)
(82)
(91)
329
Funding balance ((A-B)+(C-D))
0
0
0
Reconciliations between Financial Summary and Funding Impact Statement
Surplus/(Deficit) for Activity
(25)
(20)
(529)
Add Depreciation
107
111
200
Surplus/(deficit) of operating funding (A-B)
82
91
(329)
⌂
106
Annual Repor
4
t 2013/14 4
DISTRICT PROMOTION - GROUP ACTIVITY FUNDING IMPACT STATEMENT
FOR THE YEAR ENDED 30 JUNE 2014
2013
2014
2014
Long-Term
Long-Term
Annual
Plan
Plan
Report
$000's
$000's
$000's
Sources of operating funding
General rates, uniform annual general charges, rates penalties
90
93
96
Targeted rates (other than a targeted rate for water supply)
286
297
202
Subisidies and grants for operating purposes
0
0
0
Fees, charges, and targeted rates for water supply
0
0
0
Internal charges and overheads recovered
0
0
0
Local authorities fuel tax, fines, infringements, and other receipts
5
5
61
Total operating funding (A)
381
395
358
Applications of operating funding
Payments to staff and suppliers
416
435
419
Finance costs
0
0
0
Internal charges and overheads applied
3
3
4
Other operating funding applications
0
0
0
Total applications of operating funding (B)
419
438
423
Surplus/(deficit) of operating funding (A-B)
(38)
(43)
(65)
Sources of capital funding
Subsidies and grants for capital expenditure
0
0
0
Development and financial contributions
0
0
0
Assets vested in Council
0
0
0
Increase/(decrease) in internal debt
0
0
0
Gross proceeds from sale of assets
0
0
0
Lump sum contributions
0
0
0
Total sources of capital funding (C)
0
0
0
Applications of capital funding
Capital expenditure:
- To meet additional demand
0
0
0
- To improve the level of service
0
0
0
- To replace existing assets
0
0
0
Increase/(decrease) in reserves
(38)
(43)
(65)
Increase/(decrease) in investments
0
0
0
Total applications of capital funding (D)
(38)
(43)
(65)
Surplus/(deficit) of operating funding (C-D)
38
43
65
Funding balance ((A-B)+(C-D))
0
0
0
Reconciliations between Financial Summary and Funding Impact Statement
Surplus/(Deficit) for Activity
(45)
(47)
(72)
Add Depreciation
7
4
7
Surplus/(deficit) of operating funding (A-B)
(38)
(43)
(65)
107
⌂
Hurunui District Council
HANMER SPRINGS THERMAL POOLS AND SPA - GROUP ACTIVITY FUNDING IMPACT STATEMENT
FOR THE YEAR ENDED 30 JUNE 2014
2013
2014
2014
Long-Term
Long-Term
Annual
Plan
Plan
Report
$000's
$000's
$000's
Sources of operating funding
General rates, uniform annual general charges, rates penalties
0
0
0
Targeted rates (other than a targeted rate for water supply)
0
0
0
Subisidies and grants for operating purposes
0
0
0
Fees, charges, and targeted rates for water supply
0
0
0
Internal charges and overheads recovered
0
0
0
Local authorities fuel tax, fines, infringements, and other receipts
9,572
10,004
9,967
Total operating funding (A)
9,572
10,004
9,967
Applications of operating funding
Payments to staff and suppliers
6,635
6,950
6,833
Finance costs
936
1,027
936
Internal charges and overheads applied
132
134
136
Other operating funding applications
0
0
0
Total applications of operating funding (B)
7,703
8,111
7,905
Surplus/(deficit) of operating funding (A-B)
1,869
1,893
2,062
Sources of capital funding
Subsidies and grants for capital expenditure
0
0
0
Development and financial contributions
0
0
0
Assets vested in Council
0
0
0
Increase/(decrease) in internal debt
2,000
1,039
0
Gross proceeds from sale of assets
0
0
0
Lump sum contributions
0
0
0
Total sources of capital funding (C)
2,000
1,039
0
Applications of capital funding
Capital expenditure:
- To meet additional demand
0
0
0
- To improve the level of service
2,550
1,351
530
- To replace existing assets
100
104
283
Increase/(decrease) in reserves
1,219
1,477
1,248
Increase/(decrease) in investments
0
0
0
Total applications of capital funding (D)
3,869
2,932
2,062
Surplus/(deficit) of operating funding (C-D)
(1,869)
(1,893)
(2,062)
Funding balance ((A-B)+(C-D))
0
0
0
Reconciliations between Financial Summary and Funding Impact Statement
Surplus/(Deficit) for Activity
1,032
1,012
1,248
Add Depreciation
837
881
814
Surplus/(deficit) of operating funding (A-B)
1,869
1,893
2,062
⌂
108
Annual Repor
4
t 2013/14 4
GOVERNANCE - GROUP ACTIVITY FUNDING IMPACT STATEMENT
FOR THE YEAR ENDED 30 JUNE 2014
2013
2014
2014
Long-Term
Long-Term
Annual
Plan
Plan
Report
$000's
$000's
$000's
Sources of operating funding
General rates, uniform annual general charges, rates penalties
991
1,052
1,019
Targeted rates (other than a targeted rate for water supply)
0
0
0
Subisidies and grants for operating purposes
0
0
0
Fees, charges, and targeted rates for water supply
0
0
0
Internal charges and overheads recovered
0
0
0
Local authorities fuel tax, fines, infringements, and other receipts
16
17
21
Total operating funding (A)
1,007
1,069
1,040
Applications of operating funding
Payments to staff and suppliers
676
723
666
Finance costs
0
0
0
Internal charges and overheads applied
325
337
311
Other operating funding applications
0
0
0
Total applications of operating funding (B)
1,001
1,060
977
Surplus/(deficit) of operating funding (A-B)
6
9
64
Sources of capital funding
Subsidies and grants for capital expenditure
0
0
0
Development and financial contributions
0
0
0
Assets vested in Council
0
0
0
Increase/(decrease) in internal debt
0
0
0
Gross proceeds from sale of assets
0
0
0
Lump sum contributions
0
0
0
Total sources of capital funding (C)
0
0
0
Applications of capital funding
Capital expenditure:
- To meet additional demand
0
0
0
- To improve the level of service
0
0
0
- To replace existing assets
6
36
5
Increase/(decrease) in reserves
0
(27)
58
Increase/(decrease) in investments
0
0
0
Total applications of capital funding (D)
6
9
63
Surplus/(deficit) of operating funding (C-D)
(6)
(9)
(63)
Funding balance ((A-B)+(C-D))
0
0
0
Reconciliations between Financial Summary and Funding Impact Statement
Surplus/(Deficit) for Activity
0
0
59
Add Depreciation
6
9
4
Surplus/(deficit) of operating funding (A-B)
6
9
63
109
⌂
Hurunui District Council
⌂
110
Annual Report 2013/14
Benchmarking
Introduction .. .. .. .. .. .. .. .. .. .. .. .. .. .. .. .. .. .. .. .. .. .. .. .. .. .. .. .. .. .. .. .. .. .. .. .. .. .. .. .. .. .. .. .. .. .. .. .. .. .. .. .. .. .. .. .. .. .. .. .. 112
The benchmarks .. .. .. .. .. .. .. .. .. .. .. .. .. .. .. .. .. .. .. .. .. .. .. .. .. .. .. .. .. .. .. .. .. .. .. .. .. .. .. .. .. .. .. .. .. .. .. .. .. .. .. .. .. .. .. .. 113
111
⌂
Hurunui District Council
Introduction
Local Government (Financial Reporting and Prudence) Regulations 2014
Annual report disclosure statement for the year ended 30 June 2014
What is the purpose of this statement?
The purpose of this statement is to disclose the council’s financial performance in relation to various benchmarks to enable the assessment
of whether the council is prudently managing its revenues, expenses, assets, liabilities, and general financial dealings.
The council is required to include this statement in its annual report in accordance with the Local Government (Financial Reporting and
Prudence) Regulations 2014 (the regulations). Refer to the regulations for more information, including definitions of some of the terms
used in this statement.
Rates affordability benchmark
The council meets the rates affordability benchmark if—
- its actual rates income equals or is less than each quantified limit on rates; and
- its actual rates increases equal or are less than each quantified limit on rates increases.
Rates (income) affordability
The fol owing graph compares the council’s actual rates income with a quantified limit on rates contained in the financial strategy included
in the council’s long-term plan. The quantified limit was set out as fol ows:
- 2012/2013 7.83% increase from prior year ($12,945,000 + 7.83%) = $13,959,000
- 2013/2014 7.77% increase from prior year ($13,940,000 + 7.77%) = $15,023,000
$15,200,000
$15,000,000
$14,800,000
$14,600,000
$14,400,000
$14,200,000
$14,000,000
$13,800,000
$13,600,000
$13,400,000
$13,200,000
2009/2010
2010/2011
2011/2012
2012/2013
2013/2014
Year
Quantified Limit on Rates Income
Actual Rates Income (at or within limit)
Actual Rates Income (exceeds limit)
Rates (increases) affordability
The fol owing graph compares the council’s actual rates increases with a quantified limit on rates increases included in the financial
strategy included in the council’s long-term plan. The quantified limits were: 2012/2013 7.83%; and 2013/2014 7.77%.
8.00%
7.80%
2012/2013
2013/2014
7.60%
7.40%
7.20%
7.00%
6.80%
6.60%
6.40%
6.20%
2009/2010
2010/2011
2011/2012
2012/2013
2013/2014
⌂
112
Y
ear
Quantified Limit on Rates Increases
Actual Rates Increase (at or within limit)
Actual Rates Increase (exceeds limit)
Local Government (Financial Reporting and Prudence) Regulations 2014
Annual report disclosure statement for the year ended 30 June 2014
What is the purpose of this statement?
Annual Report 2013/14
The purpose of this statement is to disclose the council’s financial performance in relation to various benchmarks to enable the assessment
of whether the council is prudently managing its revenues, expenses, assets, liabilities, and general financial dealings.
The council is required to include this statement in its annual report in accordance with the Local Government (Financial Reporting and
Prudence) Regulations 2014 (the regulations). Refer to the regulations for more information, including definitions of some of the terms
The benchmarks
used in this statement.
Rates affordability benchmark
The council meets the rates affordability benchmark if—
- its actual rates income equals or is less than each quantified limit on rates; and
- its actual rates increases equal or are less than each quantified limit on rates increases.
Rates (income) affordability
The fol owing graph compares the council’s actual rates income with a quantified limit on rates contained in the financial strategy included
in the council’s long-term plan. The quantified limit was set out as fol ows:
- 2012/2013 7.83% increase from prior year ($12,945,000 + 7.83%) = $13,959,000
- 2013/2014 7.77% increase from prior year ($13,940,000 + 7.77%) = $15,023,000
$15,200,000
$15,000,000
$14,800,000
$14,600,000
$14,400,000
$14,200,000
$14,000,000
$13,800,000
$13,600,000
$13,400,000
$13,200,000
2009/2010
2010/2011
2011/2012
2012/2013
2013/2014
Year
Quantified Limit on Rates Income
Actual Rates Income (at or within limit)
Actual Rates Income (exceeds limit)
Rates (increases) affordability
The fol owing graph compares the council’s actual rates increases with a quantified limit on rates increases included in the financial
strategy included in the council’s long-term plan. The quantified limits were: 2012/2013 7.83%; and 2013/2014 7.77%.
8.00%
7.80%
2012/2013
2013/2014
7.60%
7.40%
7.20%
7.00%
6.80%
6.60%
6.40%
6.20%
2009/2010
2010/2011
2011/2012
2012/2013
2013/2014
Year
Quantified Limit on Rates Increases
Actual Rates Increase (at or within limit)
Actual Rates Increase (exceeds limit)
113
⌂
Hurunui District Council
Debt affordability benchmarks
The council meets the debt affordability benchmark if its actual borrowing is within each quantified limit on borrowing.
The fol owing graphs compares the council’s actual borrowing with a quantified limit on borrowing stated in the financial strategy included
in the council’s long-term plan. There are four factors in the Council's Financial Strategy to help determine limits on debt:
- Total Debt is no more than 100% of Total Income (Limits were: 2012/2013 $30.3 mil ion; and 2013/2014 $31.6 mil ion)
- Total Debt is no more than 10% of Total Equity (Limits were: 2012/2013 $34.2 mil ion; and 2013/2014 $34.6 mil ion)
- Interest expense is no more than 5% of Total Income (Limits were: 2012/2013 $1.52 mil ion; and 2013/2014 $1.58 mil ion)
- Interest expense is no more than 10% of Total Rates (Limits were: 2012/2013 $1.36 mil ion; and 2013/2014 $1.45 mil ion)
Total Debt is no more than 100% of Total Income
(Limits were: 2012/2013 $30.3 mil ion; and 2013/2014 $31.6 mil ion)
$35,000,000
Year
2009/2010
$30,000,000
2010/2011
2011/2012
$25,000,000
2012/2013
2013/2014
$20,000,000
$15,000,000
$10,000,000
$5,000,000
$0
2009/2010
2010/2011
2011/2012
2012/2013
2013/2014
Year
Quantified Limit on Debt
Actual Debt (at or within limit)
Actual Debt (exceeds limit)
Total Debt is no more than 10% of Total Equity
(Limits were: 2012/2013 $34.2 mil ion; and 2013/2014 $34.6 mil ion)
$40,000,000
$35,000,000
$30,000,000
$25,000,000
$20,000,000
$15,000,000
$10,000,000
$5,000,000
$0
2009/2010
2010/2011
2011/2012
2012/2013
2013/2014
Year
Quantified Limit on Debt
Actual Debt (at or within limit)
Actual Debt (exceeds limit)
⌂
114
Annual Report 2013/14
Debt affordability benchmarks (Continued)
Interest expense is no more than 5% of Total Income
(Limits were: 2012/2013 $1.52 mil ion; and 2013/2014 $1.58 mil ion)
$1,800,000
$1,600,000
$1,400,000
$1,200,000
$1,000,000
$800,000
$600,000
$400,000
$200,000
$0
2009/2010
2010/2011
2011/2012
2012/2013
2013/2014
Year
Quantified Limit on Debt
Actual Debt (at or within limit)
Actual Debt (exceeds limit)
Interest expense is no more than 10% of Total Rates
(Limits were: 2012/2013 $1.36 mil ion; and 2013/2014 $1.45 mil ion)
$1,600,000
Year
2009/2010
$1,400,000
2010/2011
2011/2012
$1,200,000
2012/2013
2013/2014
$1,000,000
$800,000
$600,000
$400,000
$200,000
$0
2009/2010
2010/2011
2011/2012
2012/2013
2013/2014
Year
Quantified Limit on Debt
Actual Debt (at or within limit)
Actual Debt (exceeds limit)
115
⌂


Hurunui District Council
Balanced budget benchmark
The fol owing graph displays the council’s revenue (excluding development contributions, financial contributions, vested assets, gains
on derivative financial instruments, and revaluations of property, plant, or equipment) as a proportion of operating expenses (excluding
losses on derivative financial instruments and revaluations of property, plant, or equipment).
The council meets this benchmark if its revenue equals or is greater than its operating expenses.
115
110
)
%
106
105
diture (
pen
ex
ue/ 100
en
98
98
Rev
95
95
95
90
2009/2010
2010/2011
2011/2012
2012/2013
2013/2014
Year
Benchmark met
Benchmark not met
Essential services benchmark
The fol owing graph displays the council’s capital expenditure on network services as a proportion of depreciation on network services.
The council meets this benchmark if its capital expenditure on network services equals or is greater than depreciation on network services.
220
202
200
)
174
180
160
on (% 160
142
140
epreciati 120
re/d
91
100
enditu 80
exp 60
ital 40
Cap
20
0
2009/2010
2010/2011
2011/2012
2012/2013
2013/2014
Year
Benchmark met
Benchmark not met
⌂
116


Annual Report 2013/14
Debt servicing benchmark
The fol owing graph displays the council’s borrowing costs as a proportion of revenue (excluding development contributions,
financial contributions, vested assets, gains on derivative financial instruments, and revaluations of property, plant, or equipment).
Because Statistics New Zealand projects the council’s population wil grow as fast as the national population growth rate, it meets the
debt servicing benchmark if its borrowing costs equal or are less than 10% of its revenue.
10.5
10.0
9.5
9.0
8.5
8.0
) 7.5
7.0
ue (% 6.5
even 6.0
5.5
osts/r 5.0
4.5
ng c 4.0
3.5
3.0
Borrowi
2.3
2.5
2.0
2.1
2.0
1.5
1.2
1.0
0.5
-
0.0
2009/2010
2010/2011
2011/2012
2012/2013
2013/2014
Year
Benchmark met
Benchmark not met
Debt control benchmark
The fol owing graph displays the council’s actual net debt as a proportion of planned net debt. In this statement, net debt means financial
liabilities less financial assets (excluding trade and other receivables).
The council meets the debt control benchmark if its actual net debt equals or is less than its planned net debt.
120.0
100.0
)
86
89
t (%
77
80.0
deb
67
et
d n 60.0
/Budgete 40.0
al
Actu
20.0
-
0.0
2009/2010
2010/2011
2011/2012
2012/2013
2013/2014
Year
Benchmark met
Benchmark not met
117
⌂

Hurunui District Council
Operations control benchmark
This graph displays the council’s actual net cash flow from operations as a proportion of its planned net cash flow from operations.
The council meets the operations control benchmark if its actual net cash flow from operations equals or is greater than its planned net
cash flow from operations.
146
147
) 140
s (%
ation 120
er
103
106
op
96
100
from
80
cash flow 60
et
n
ed 40
dget
al/Bu 20
Actu
0
2009/2010
2010/2011
2011/2012
2012/2013
2013/2014
Year
Benchmark met
Benchmark not met
⌂
118
Annual Report 2013/14
Council Contolled Organisations
Enterprise North Canterbury.. .. .. .. .. .. .. .. .. .. .. .. .. .. .. .. .. .. .. .. .. .. .. .. .. .. .. .. .. .. .. .. .. .. .. .. .. .. .. .. .. .. .. .. .. .. .. .. 120
Transwaste Canterbury Limited.. .. .. .. .. .. .. .. .. .. .. .. .. .. .. .. .. .. .. .. .. .. .. .. .. .. .. .. .. .. .. .. .. .. .. .. .. .. .. .. .. .. .. .. .. .. 122
119
⌂
Hurunui District Council
Enterprise North Canterbury
Background
3.4
Undertaken research to identify gaps, opportuni-
Enterprise North Canterbury (ENC) is a charitable trust
ties and track business issues and trends
which provides promotions and economic development
3.5
ENC will assist town development as and when
services for the North Canterbury region. On behalf of
invited
Waimakariri and Hurunui District Councils its activities
are focussed on developing existing businesses and pro-
2013/2014 Achievements
moting new businesses within the region. The Trust also
1.1
ENC Rural Engagement Objective: ENC is commit-
promotes the region as a visitor destination.
ted to creating new initiatives that stimulate and
accelerate economic growth for the North Canter-
The Mayors of the two Councils are trustees and the
bury rural sector. Three key areas of focus:
two Chief Executive Officers are advisory trustees. Other
•
Finding the gap
trustees are appointed jointly by the Hurunui and Wai-
•
Key Relationship Management
makariri District Councils.
•
Communication
1.2
Networking functions: Four networking functions
Council’s objectives for investment in Enter-
were held during the year with a total of 317
prise North Canterbury
attendees (271 last year).
The Hurunui District Council’s key objective for contin-
2.1 ENC has worked closely with Chorus, Enable,
ued investment in Enterprise North Canterbury has been
Farmside, Snap, Amuri.net, Vodafone, and Tel-
to assist in cultivating and promoting economic activ-
ecom offering solutions to a number of entities
ity and to foster growth in North Canterbury. Council
in Kaiapoi, Rangiora, Eyrewel , Balmoral, and is
achieves this by approving the Statement of Intent and
seeking ongoing solutions in Waipara, Hanmer,
reviewing the progress through the Annual Report.
Culverden, Saltwater, Southbrook, Loburn, Ohoka,
Oxford and beyond. ENC co-hosted a workshop
2013/2014 Objectives
with OPUS to 27 building owners and developers
1
Large Businesses and New Projects
in Rangiora to identify potential cost savings,
1.1
ENC will be proactive in searching for and sup-
building concepts and resource capabilities. ENC
porting new initiatives that will create substantial
became part of a regional Canterbury Digital Fo-
wealth for the region. Particular emphasis will be
rum to develop a Canterbury wide Digital Strate-
given to the primary sector and its related servic-
gy.
ing industries
3.1 ENC has a pivotal role in the enhancement of
1.2
ENC will promote the development of “business
business capability through training, coaching and
to business” networks within the region
mentoring of the SME sector through:
•
Regional Business Partner Programme (RBP)
2
Infrastructure
•
Business Training Workshops and Coaching
2.1
When ENC identifies infrastructural gaps (name-
•
Provide other Business Support Pro-
ly broadband) that may impact on the creation
grammes
of wealth in the region it will lobby appropriate
• Referrals
agencies for the provision of such facilities and
•
Mentoring
services.
•
Communications with businesses and ENC
stakeholders
3
Retain and support existing SME businesses
3.2 The celebration of business achievements within
3.1
ENC will support existing businesses by the provi-
the region is an important stimulus for entrepre-
sion of training, coaching, and mentoring services
neurs.
and networking opportunities
•
In May 2014 ENC launched the North
3.2
ENC will celebrate and recognise business leaders
Canterbury Exceptional Business Awards.
and business successes
Entries closed on the 18th of July with 45
3.3
ENC will facilitate the establishment of industry
businesses entering seven categories
groupings where there are sought by the sector,
3.3 Often small and medium businesses will benefit
to achieve efficiencies in marketing, product de-
from a col aborative approach to achieve superior
velopment and the securing of resources.
results than is possible by each business acting
⌂
120
Annual Report 2013/14
independently, and ENC is well placed to facilitate
carried out an audit of the current labour market
such sector groupings.
conditions in North Canterbury to gain a greater
3.4 ENC undertook business surveys in November
understanding of the impact of the Canterbury
2013 and May 2014 to provide a snapshot of
earthquakes and low level of unemployment on
business confidence and labour market needs.
the rural sector.
The results are distributed widely and used by
3.5 Culverden – assessed economic development
other organisations to assist in their planning. ENC
opportunities.
121
⌂
Hurunui District Council
Transwaste Canterbury Limited
Background
and CMRF adhere to the performance targets set out
Transwaste Canterbury Limited operates a regional land-
under this clause.
fill at Kate Val ey and associated transport services in a
6. Consultation and Community Relations: Establish
joint ventre with Canterbury Waste Services.
and maintain good relations with the local host com-
munity of the Kate Val ey landfill and Burwood areas
Hurunui District Council is one of the councils in the
and consult with those groups and other interest
Canterbury region which between them own 50% of
groups (including Tangata Whenua) on issues that
the shares in Transwaste Canterbury Limited. Hurunui’s
are likely to affect them.
share of the Company amounts to 1.2%.
Results for 2013/2014
The council shareholders appoint representatives to a
1. Three of the five performance targets were met.
joint committee which in turn appoints four of the eight
The two targets not met were: the average return
directors.
on invested capital was 11.5% rather than the target
of 11.87%; and annual Burwood Resource Recovery
Council’s objectives for investment in Tran-
Park revenue was $15,990,000 rather than the target
swaste Canterbury Economic Limited
of $16,392,000.
The Hurunui District Council’s key objective for invest-
2. Three of the four performance targets were met,
ment in Transwaste Canterbury Limited has been to
with the one not achieved being only 3,070 plants of
receive an economic return for its investment. Council
native species being planted rather than the targeted
continues to receive dividends from the Company.
4,000.
3. Two of the three performance targets were met,
Key performance measures
with the one not achieved being due to the website
The targets of the Company under the Statement of
being operational from June 2014, rather than Octo-
Intent were as follows:
ber 2013.
4. All three performance targets were met.
The targets of the Company under the Statement of
5. Seven of the eight performance targets were met,
Intent were as follows:
with the one not achieved being that on average
1. Shareholder Interest: To operate a successful busi-
CWS staff attended external training equivalent to
ness, providing a fair rate of return to its sharehold-
8.6 hours per FTE, rather than the targeted 10 hours
ers.
per FTE.
2. Healthy Environment: To ensure that the group, as
6. Five of the six performance targets were met, with
a minimum, meets present and future environmen-
the one not being in respect to receiving 102 com-
tal standards in a manner which is consistent with
plaints from two families relating to odour, although
the preservation of the natural environment and
none of these have been substantiated by Environ-
the careful and sustainable management of natural
ment Canterbury.
resources.
3. Corporate Citizen: To be a responsible Corporate
Citizen by acting lawful y, fairly and honestly and to
be sensitive to local issues.
4. Service Quality: Meet the present and future needs
of the people of Canterbury with high standards of
value, quality and service and establish effective
relations with customers.
5. Good Employer: Be a Good Employer, through
either direct employment or by way of management
contracts with Canterbury Waste Services (CWS)
and Canterbury Material Recovery Facilities (CMRF).
Strive for zero injury accidents in all operations the
company and its main contractors, CWS and CMRF,
will be responsible for, whilst maintaining a high
level of service and production. To ensure that CWS
⌂
122
Annual Report 2013/14
Independent Auditor’s Report
123
⌂

Hurunui District Council
Independent Auditor’s Report
To the readers of Hurunui District Council and group’s annual report
for the year ended 30 June 2014
The Auditor-General is the auditor of Hurunui District Council (the District Council) and group.
The Auditor-General has appointed me, Julian Tan, using the staff and resources of Audit
New Zealand to audit:
•
the financial statements of the District Council and group that comprise:
the statement of financial position as at 30 June 2014 on page 60;
the statement of comprehensive income, statement of changes in equity and
statement of cash flows for the year ended 30 June 2014 on pages 58, 59
and page 61;
the notes to the financial statements that include accounting policies and
other explanatory information about the financial statements on pages 62 to
93;
•
the statement of service provision (referred to as Groups of Council Activities) of the
District Council on pages 14 to 55;
•
the funding impact statements in relation to each group of activities of the District
Council on pages 101 to 109;
•
the statements about budgeted and actual capital expenditure in relation to each
group of activities of the District Council on pages 14 to 55;
•
the funding impact statement of the District Council on page 100; and
•
the disclosures of the District Council that are required by the Local Government
(Financial Reporting and Prudence) Regulations 2014 on page 99 and pages 113 to
118.
In addition, the Auditor-General has appointed me to report on whether the District Council
and group’s annual report complies with the
Other Requirements of schedule 10 of the Local
Government Act 2002, where applicable, by including:
•
Information about:
internal borrowing on pages 14 to 55;
reserve funds on pages 94 to 97;
remuneration paid to the elected members and certain employees of the
District Council on page 92;
⌂
124
Annual Report 2013/14
employee staffing levels and remuneration on page 92;
severance payments on page 93;
council-controlled organisations on pages 120 to 122;
rating base units on page 98; and
insurance of assets on page 98.
•
A report on the activities undertaken by the District Council and group to establish
and maintain processes to provide opportunities for Maori to contribute to the
Council’s decision-making processes on page 10.
•
A statement of compliance signed by the mayor and chief executive of the District
Council on page 11.
Opinion
Audited information
In our opinion:
•
The financial statements of the District Council and group on pages 58 to 93:
comply with generally accepted accounting practice in New Zealand; and
fairly reflect:
•
the District Council and group’s financial position as at 30 June
2014; and
•
the results of their operations and cash flows for the year ended on
that date.
•
The Group of Council Activities of the District Council on pages 14 to 55:
complies with general y accepted accounting practice in New Zealand; and
fairly reflects the District Council’s levels of service for the year ended
30 June 2014, including:
•
the levels of service as measured against the intended levels of
service adopted in the long-term plan; and
•
the reasons for any significant variances between the actual service
and the expected service.
•
The funding impact statements in relation to each group of activities of the District
Council on pages 101 to 109, fairly reflects by each group of activities, the amount
of funds produced from each source of funding and how the funds were applied as
compared to the information included in the District Council’s long-term plan.
125
⌂
Hurunui District Council
•
The statements about budgeted and actual capital expenditure in relation to each
group of activities of the District Council on pages 14 to 55, fairly reflects by each
group of activities the capital expenditure spent as compared to the amounts
budgeted and set out in the District Council’s long-term plan or annual plan.
•
The funding impact statement of the District Council on page 100, fairly reflects the
amount of funds produced from each source of funding and how the funds were
applied as compared to the information included in the District Council’s annual plan.
•
The disclosures on pages 113 to 118 represent a complete list of required disclosures
and accurately reflect the information drawn from District Council’s audited
information.
Compliance with the Other Requirements of schedule 10
In our opinion, which is not an audit opinion, the District Council and group’s annual report
complies with the
Other Requirements of schedule 10 that are applicable to the annual report.
Our audit was completed on 30 October 2014. This is the date at which our opinion is expressed.
The basis of our opinion is explained below. In addition, we outline the responsibilities of the
Council and our responsibilities, and we explain our independence.
Basis of opinion
We carried out our audit in accordance with the Auditor-General’s Auditing Standards, which
incorporate the International Standards on Auditing (New Zealand). Those standards require
that we comply with ethical requirements and plan and carry out our audit to obtain
reasonable assurance about whether the information we audited is free from material
misstatement.
Material misstatements are differences or omissions of amounts and disclosures that, in our
judgement, are likely to influence readers’ overal understanding of the financial statements
and [description used by the Council Type for the statement of service provision]. If we had
found material misstatements that were not corrected, we would have referred to them in our
opinion.
An audit involves carrying out procedures to obtain audit evidence about the amounts and
disclosures in the information we audited. The procedures selected depend on our judgement,
including our assessment of risks of material misstatement of the information we audited,
whether due to fraud or error. In making those risk assessments, we consider internal control
relevant to the District Council and group’s preparation of the information we audited that
fairly reflect the matters to which they relate. We consider internal control in order to design
procedures that are appropriate in the circumstances but not for the purpose of expressing an
opinion on the effectiveness of the District Council and group’s internal control.
An audit also involves evaluating:
•
the appropriateness of accounting policies used and whether they have been
consistently applied;
•
the reasonableness of the significant accounting estimates and judgements made by
the Council;
⌂
126
Annual Report 2013/14
•
the adequacy of all disclosures in the information we audited;
•
determining the appropriateness of the reported Group of Councils Activities within
the Council’s framework for reporting performance; and
•
the overal presentation of the information we audited.
We did not examine every transaction, nor do we guarantee complete accuracy of the
information we audited.
When reporting on whether the annual report complies with the
Other Requirements of schedule
10 of the Local Government Act 2002, our procedures were limited to making sure the
information required by schedule 10 was included in the annual report, where relevant, and
identifying material inconsistencies, if any, with the information we audited. This work was
carried out in accordance with International Standard on Auditing (New Zealand) 720;
The
Auditor’s Responsibilities Relating to Other Information in Documents Containing Audited Financial
Statements. As a result we do not express an audit opinion on the District Council’s compliance
with the requirements of schedule 10.
We did not evaluate the security and controls over the electronic publication of the information
we are required to audit and report on. We have obtained all the information and
explanations we have required and we believe we have obtained sufficient and appropriate
evidence to provide a basis for our opinion.
Responsibilities of the Council
The Council is responsible for preparing:
•
financial statements and Group of Council Activities that:
comply with generally accepted accounting practice in New Zealand;
fairly reflect the District Council and group’s financial position, financial
performance and cash flows;
fairly reflect its service performance, including achievements compared to
forecast;
•
funding impact statements in relation to each group of activities that fairly reflects by
each group of activities the amount of funds produced from each source of funding
and how the funds were applied as compared to the information included in the
District Council’s long-term plan;
•
statements about budgeted and actual capital expenditure in relation to each group
of activities that fairly reflects by each group of activities the capital expenditure
spent as compared to the amounts budgeted and set out in the District Council’s
long-term plan or annual plan;
•
a funding impact statement that fairly reflects the amount of funds produced from
each source of funding and how the funds were applied as compared to the
information included in the District Council’s annual plan;
127
⌂

Hurunui District Council
•
disclosures in accordance with the requirements of the Local Government (Financial
Reporting and Prudence) Regulations 2014; and
•
the other information in accordance with the requirements of schedule 10 of the Local
Government Act 2002.
The Council is responsible for such internal control as it determines is necessary to ensure that
the annual report is free from material misstatement, whether due to fraud or error. The
Council is also responsible for the publication of the annual report, whether in printed or
electronic form.
The Council’s responsibilities arise under the Local Government Act 2002.
Responsibilities of the Auditor
We are responsible for expressing an independent opinion on, the information we are
required to audit, and whether the Council has complied with the
Other Requirements of
schedule 10, and reporting that opinion to you. Our responsibility arises under section 15 of
the Public Audit Act 2001 and section 99 of the Local Government Act 2002.
Independence
When carrying out this audit, which includes our report on the
Other Requirements, we followed
the independence requirements of the Auditor-General, which incorporate the independence
requirements of the External Reporting Board.
In addition this audit, which includes our report on the
Other Requirements, we have completed
an assurance engagement preparing a report to the District Council’s bond trustee pursuant to
a debenture trust deed. This engagement is compatible with those independence requirements.
Other than this audit, and the assurance engagement, we have no relationship with or interests
in the District Council or any of its subsidiaries.
Julian Tan
New Zealand
On behalf of the Auditor-General
Christchurch, New Zealand
⌂
128
Annual Report 2013/14
Appendices
Council commit ee structure .. .. .. .. .. .. .. .. .. .. .. .. .. .. .. .. .. .. .. .. .. .. .. .. .. .. .. .. .. .. .. .. .. .. .. .. .. .. .. .. .. .. .. .. .. .. .. 132
Organisational structure .. .. .. .. .. .. .. .. .. .. .. .. .. .. .. .. .. .. .. .. .. .. .. .. .. .. .. .. .. .. .. .. .. .. .. .. .. .. .. .. .. .. .. .. .. .. .. .. .. .. 133
129
⌂
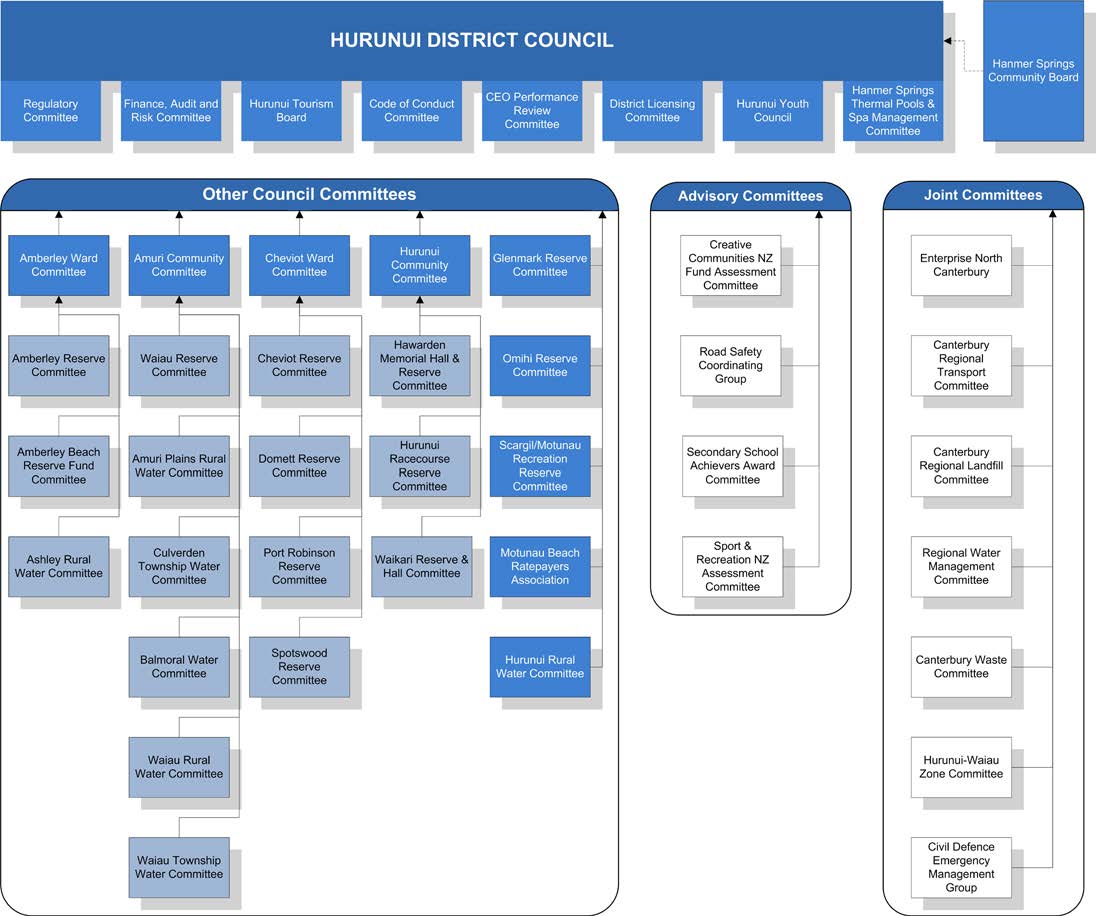
Hurunui District Council
Council committee structure
⌂
130
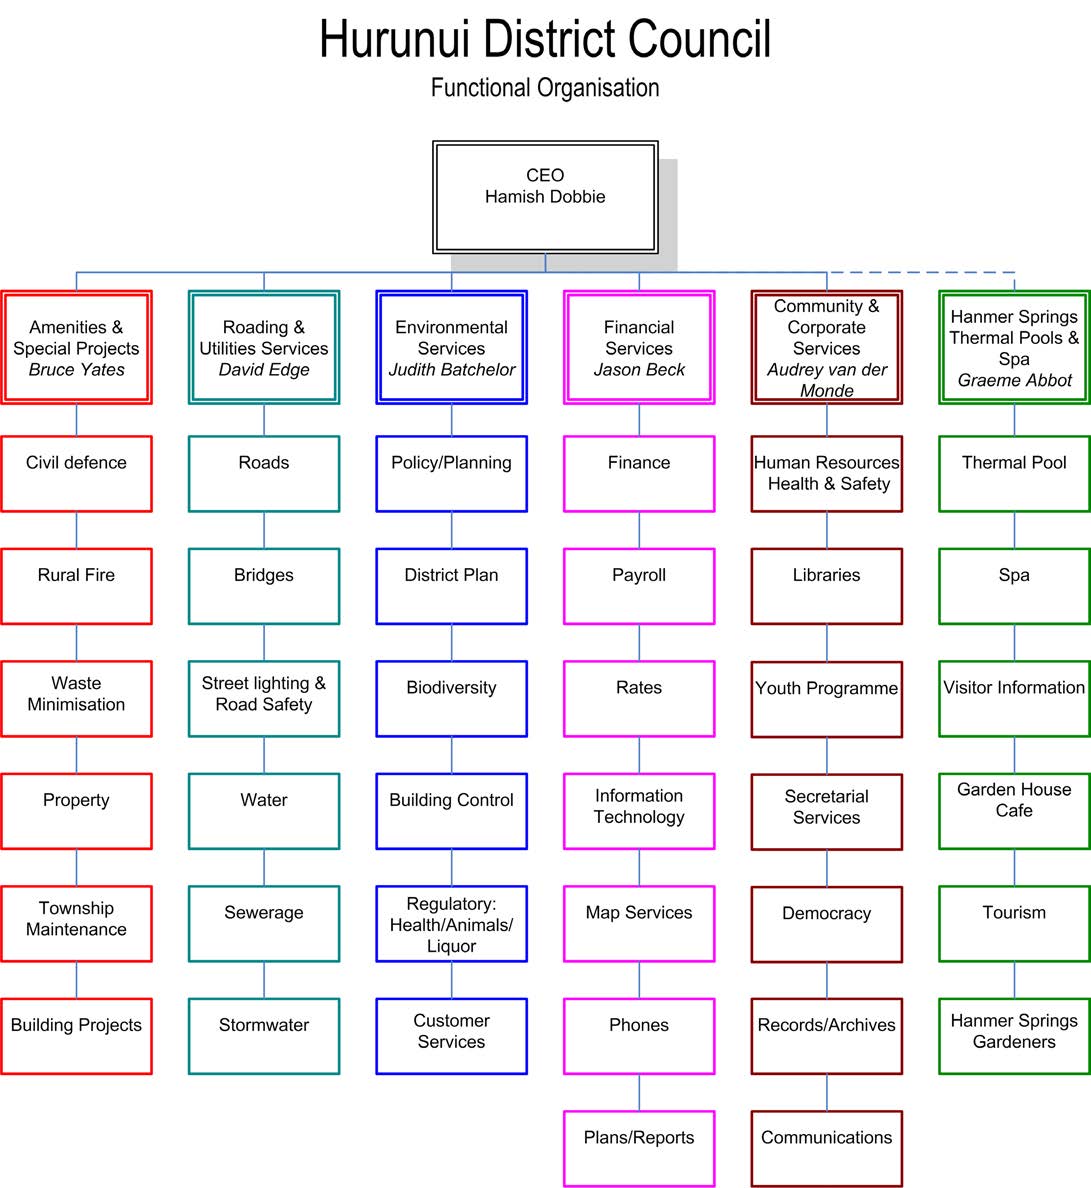
Annual Report 2013/14
Organisational structure
131
⌂


 Address:
66 Carters Road
PO Box 13
Amberley 7441
Phone:
03 314 8816
Fax:
03 314 9181
Email:
[Hurunui District Council request email]
Web:
hurunui.govt.nz
Address:
66 Carters Road
PO Box 13
Amberley 7441
Phone:
03 314 8816
Fax:
03 314 9181
Email:
[Hurunui District Council request email]
Web:
hurunui.govt.nz