Basing on the literature review highlighted below:
1. In Norway even for strong cross-wind heavy vehicles are permitted to operate on
bridges – vehicle velocity reduction is recommended in order to reduce lateral
displacement (see study 1)
2. Electric vehicles can potentially perform better in challenging road conditions
compared to ICEs due to superior responsiveness of an electric motor (see study 2)
3. Extensive study of heavy trucks in US underlines importance of information systems
to have in place in order to increase driver’s awareness of potential wind-related risks
(see study 3)
4. The absence of wind as a factor may be accounted for by driver behavioural changes
– who voluntarily adapt vehicle velocity and increase attention when driving
conditions deteriorate.
following preliminary recommendations can be suggested:
1. Support for permanent vehicle movement ban due to strong cross-wind have not
been found in the conducted literature study
2. Driver awareness is important factor and should be focused on/prioritized
3. Speed limitations during strong wind can result in increased road safety and should
be considered along with supporting measurement and indication system
4. It should be noted that the risk of incident grows in the nonlinear fashion as the
vehicle velocity increases
5. Variability of wind speed and direction at the bridge could be a relevant factor – if
historical data are available they should be taken into account (though place of taking
the measurement is critical as wind speed tends to grow logarithmically with the
altitude from the ground)
6. It is worth noting that battery electric buses (in currently predominant bus design)
have higher weight and lower centre of gravity compared to their internal combustion
counterparts – resulting in higher static stability
1. Sekulic, D., Vdovin, A., Jacobson, B., Sebben, S., & Johannesen, S. M. (2021).
Effects of wind loads and floating bridge motion on intercity bus lateral
stability. Journal of Wind Engineering and Industrial Aerodynamics, 212,
104589.
https://www.sciencedirect.com/science/article/pi /S0167610521000751
In this research, bus behaviour when passing across a floating bridge under environmental
loads (1-year storm condition case) was analysed. The along-wind and cross-wind
components have larger magnitudes (close to 20 m/s -64 km/h) on the first 1000 m of the
travelled distance and decrease to approximately 15 m/s at the end of the bridge (Fig. 18a).
The intensity of the mean part of the wind speed logarithmically increases as a function of
the height (Branlard, 2010). In the case of Bjørnafjorden crossing, the height of the bridge
deck gradually decreases, starting from approximately 70 m in the south to 20 m in the
north.
From this research, the main conclusions are as follows:
• The vehicle deviation from the path increases with increasing bus speed. Deviation
from the path is significant after the vehicle enters the bridge at a high speed when a
high-velocity cross-wind load starts acting (e.g., for a speed of 90 km/h, the deviation
is over 0.5 m; for a speed of 108 km/h, the deviation is very large, up to 2 m).
• The path deviation changes along the length of the bridge depending on the bus
speed, wind and bridge motion excitations. The largest path deviations are for the
case of 108 km/h soon after the bus enters the bridge and remain at a high value
(approximately 0.5 m) alongthe bridge. At a travel ed distance of approximately 2 km
from entering the bridge, the lateral displacements are close to 0.5 m for a velocity of
90 km/h.
• Under wind loads from 1-year storm conditions, simulation results suggest that a bus
might start driving at a lower speed (e.g., 72 km/h) with the possibility of increasing
the speed (up to 90 km/h) at the lower part of the bridge (after approximately 2 km).
This conclusion is similar to recommendations based on driving simulator tests for
buses running in straight lines across bridges. The recommendation suggests
“straight line driving for the bus at 90 km/h up to weather 6 (1-year storm condition)”.
2. Lin, J., Zou, T., Zhang, F., & Zhang, Y. (2022). Yaw Stability Research of the
Distributed Drive Electric Bus by Adaptive Fuzzy Sliding Mode
Control. Energies, 15(4), 1280.
https:/ www.mdpi.com/1996-1073/15/4/1280/pdf
Liu, W., He, H., Sun, F., & Lv, J. (2017). Integrated chassis control for a three-axle
electric bus with distributed driving motors and active rear steering system. Vehicle
System Dynamics, 55(5), 601-625.
https:/ www.researchgate.net/profile/Wei-Liu-
537/publication/312574001_Integrated_chassis_control_for_a_three-
axle_electric_bus_with_distributed_driving_motors_and_active_rear_steering_system/links/5
9e02a380f7e9bc51256d238/Integrated-chassis-control-for-a-three-axle-electric-bus-with-
distributed-driving-motors-and-active-rear-steering-system.pdf
Electric buses can be more stable in dynamic road conditions due to quicker response of the
electric motor compared to ICE.
3. Mulinazzi, T. E. (2010). Mitigating wind induced truck crashes.
https://digitalcommons.unl.edu/cgi/viewcontent.cgi?article=1090&context=matcreports
Another study by the University of Manitoba used computer simulation to determine how
combinations of weather conditions affect truck traffic (12). The angle the trailers moved, or
yaw angle, was used to measure instability. The program was constructed to simulate life-
like wind gusts. The study determined that the maximum wind speed a heavy truck with a 48
foot trailer could safely travel in was between 31 and 43 mph when empty and between 62
and 74 mph when loaded (12).
Figure 3.2 shows a distribution of the 114 studied crashes and the associated wind gust
speeds. What is distinct in this model is that crash frequency seems to peak between thirty-
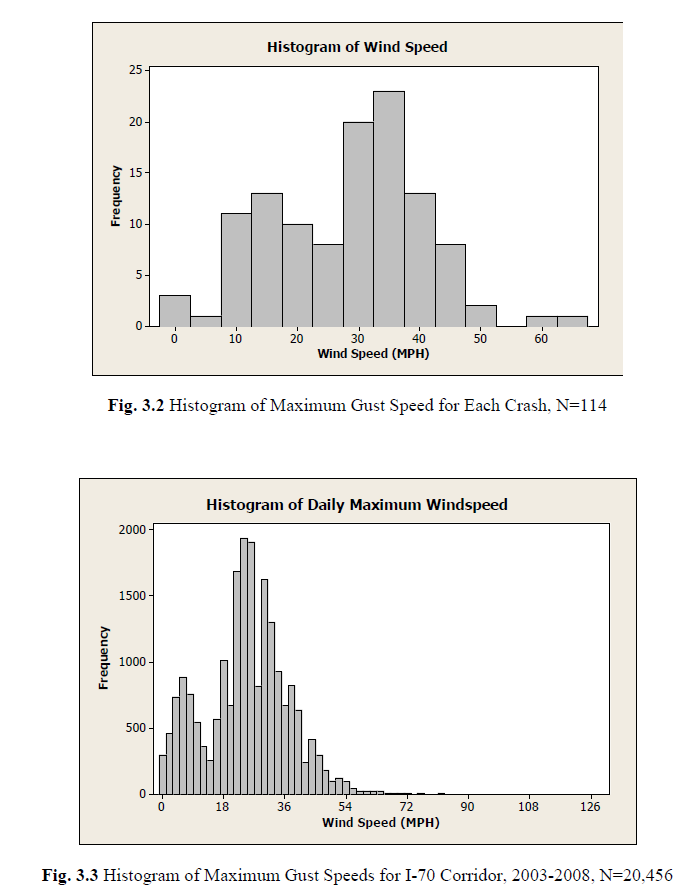
two and thirty-seven miles per hour. The research team then compared figure 3.2 to a
histrogram of all the maximum gust speeds for the entire corridoor for the entire six year
period, which are displayed in figure 3.3.
When one looks at the final form of the regression equation for predicting windblown
truck crashes in Kansas on I-70, one important conclusion is evident: neither wind
speed nor wind gust speed was found to be a factor. The factors that were found to be
statistically significant were the hour of the day (0 to 23), inches of precipitation in the
hour, presence of rain, presence of a thunderstorm, presence of scattered clouds, the
milepost (the further west, or closer to milepost zero, the more risk), daylight driving
conditions and dawn driving conditions. The absence of wind as a factor may be
accounted for by driver behavioral changes. In an ideal dataset, to underpin such a
statistical model, drivers would not alter their behavior due to any adverse weather
conditions. Obviously, this would create more crashes to study and possibly create a
significant variable for wind gust speed, and, consequently, a more robust model. However,
under real world conditions, this is simply not possible; drivers do in fact take defensive
measures, and either alter their driving (increased vigilance, decreased speed, etc.) or exit
the road and stop driving until conditions improve.
The findings of this research are consistent with the other literature identified. Like
the University of New Brunswick study, wind speeds were also not found to be a
statistically significant part of any model based on available data. The University of
Manitoba simulation study, which found that an empty truck could travel safely in winds up to
a range between 31 and 48 miles per hour, is slightly higher than the dilemma zone
identified for I-70 in Kansas. This overlap in the studies provides mutual support for the idea
that this may be a critical range, and based on the Kansas data, suggests that trucks on I-70
in Kansas may possibly have a larger safety cushion—up to 48 mph instead of 28.8 mph.
Furthermore, it suggests that, in general, they are being more conservative and making
behavioral (driving) changes at a much lower threshold relative to the New Brunswick data.
However, although there could be behavioral changes, state highway agency officials
should not expect that every individual wil have the knowledge or ability to detect
unsafe wind conditions. Placing DMS tied to weather data stations and/or installing
lighted wind socks on selected overpass bridges would be of great value to drivers
that might not otherwise take extra safety precautions based on their own judgment.
Document Outline
- 1. Sekulic, D., Vdovin, A., Jacobson, B., Sebben, S., & Johannesen, S. M. (2021). Effects of wind loads and floating bridge motion on intercity bus lateral stability. Journal of Wind Engineering and Industrial Aerodynamics, 212, 104589.
- 2. Lin, J., Zou, T., Zhang, F., & Zhang, Y. (2022). Yaw Stability Research of the Distributed Drive Electric Bus by Adaptive Fuzzy Sliding Mode Control. Energies, 15(4), 1280.
- Liu, W., He, H., Sun, F., & Lv, J. (2017). Integrated chassis control for a three-axle electric bus with distributed driving motors and active rear steering system. Vehicle System Dynamics, 55(5), 601-625.
- 3. Mulinazzi, T. E. (2010). Mitigating wind induced truck crashes.