EMPLOYEE ENGAGEMENT REPORT |
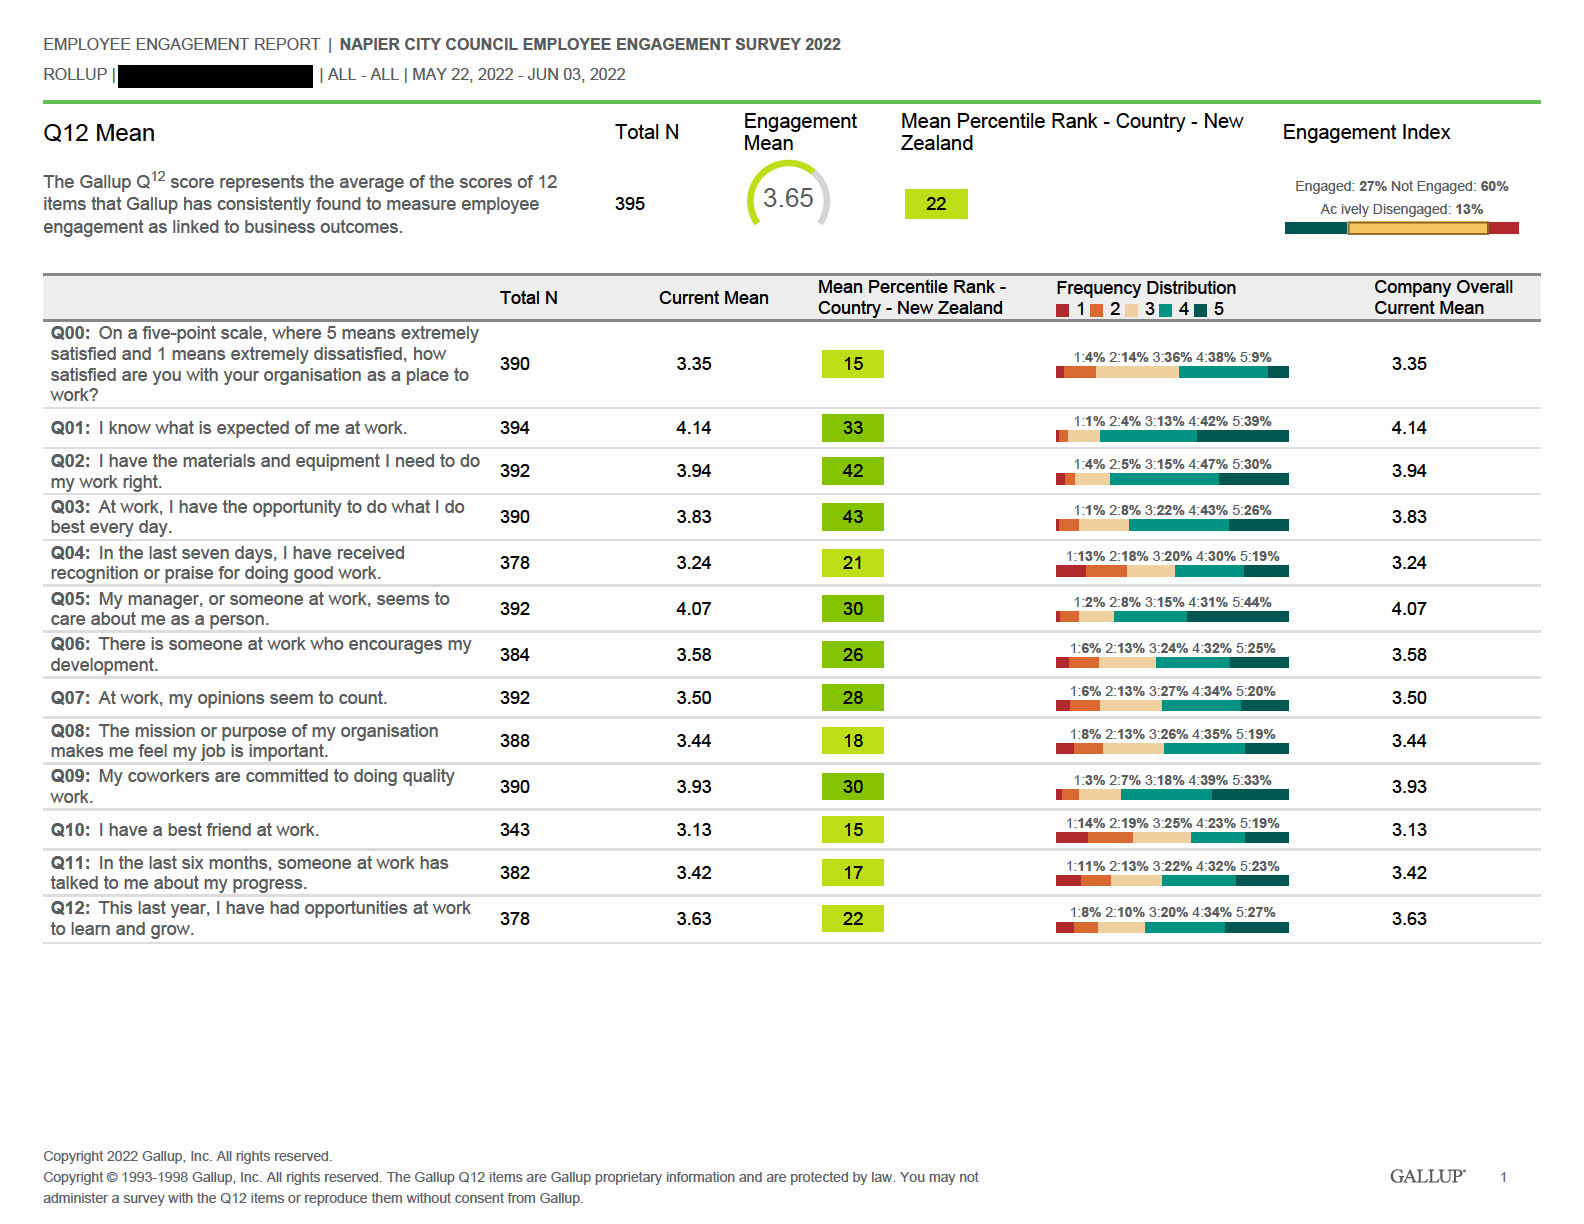
NAPIER CITY COUNCIL EMPLOYEE ENGAGEMENT SURVEY 2022
ROLLUP |
| ALL - ALL | MAY 22, 2022 - JUN 03, 2022
FOOTNOTES
* - Scores are not available due to data suppression.
Respondents can select multiple responses for multi-select questions.
Not shown if n < 4 for Mean, Top Box, Verbatim Responses and Sentiment, n < 10 for Frequency, or data is unavailable.
Mean Percentile Rank is being calculated against the Country - New Zealand database.
A green or red arrow represents meaningful change. A change in score is meaningful if it changes 0.2 between survey periods.
Percentile Rank in Country - New Zealand Database
< 25th Percentile
25-49th Percentile
50-74th Percentile
75-89th Percentile
>= 90th Percentile
Percent Engaged available when n ≥ 30. All categories available when n ≥ 100.
Copyright 2022 Gallup, Inc. All rights reserved.
Copyright © 1993-1998 Gallup, Inc. All rights reserved. The Gallup Q12 items are Gallup proprietary information and are protected by law. You may not
2
administer a survey with the Q12 items or reproduce them without consent from Gallup.
EMPLOYEE ENGAGEMENT REPORT |
NAPIER CITY COUNCIL EMPLOYEE ENGAGEMENT SURVEY 2022
ROLLUP |
| ALL - ALL | MAY 22, 2022 - JUN 03, 2022
GLOSSARY
The glossary provides high-level definitions of terms within the engagement report. Because of the dynamic nature of this site, not all terms will be applicable to or displayed on your report.
Please use the terms that are relevant to your team when discussing and interpreting the data.
ENGAGEMENT DEFINED
EMPLOYEE ENGAGEMENT: Employee engagement refers to how committed an employee is to their organisation, their role, their manager and their co-workers. Engagement drives
performance. Gallup's research shows that more highly engaged employees give more discretionary effort at work and have higher productivity, profitability and customer service, as well
as reduced turnover and safety incidents.
THE SURVEY ITEMS/QUESTIONS
OVERALL SATISFACTION: Overall Satisfaction is a measure of how content your team is with the overall company as a place to work. Overall Satisfaction is not included in the Overall
Workgroup Engagement (GrandMean) score. Being a satisfied employee does not equate with being engaged, though the two are highly related.
Q01-Q12: These items are Gallup’s proprietary workgroup engagement questions (commonly referred to as the Q¹²®). These items were selected for their strong connection to
performance outcomes and the ability to take action at the workgroup level.
INDICES: In addition to the Q¹²® items, Gallup has created a number of empirically-derived sets of indices, which are comprised of 3-4 questions each. Individual scores of each index
item are provided, along with a combined index score, which measures the strength of the core index construct. These indices help companies strategically pinpoint and improve specific
focus areas relevant to their current situation.
CUSTOM ITEMS: These items are unique to your company and can vary across companies and surveys. While these “additional” questions link to the Gallup Engagement hierarchy,
they are not always within the power of the workgroup to influence or change. These questions can provide additional insights into employees’ perceptions, the situational workplace
environment or company-specific initiatives.
EMPLOYEE ENGAGEMENT RESULTS
GRANDMEAN: The GrandMean measures overall Workgroup Engagement, which is an average of the 12 Workgroup Engagement items (Q01-Q12). The higher your score (with a
maximum possible score of 5), the more engaged your fellow employees are.
ENGAGEMENT INDEX: The Engagement Index (EI) is a macro-level indicator of an organisation's health that allows leaders to track the engagement levels of employees. This analysis
identifies the percentage of participants who are engaged, not engaged and actively disengaged based on their responses to the Q¹²® survey items. You must have 100 employees
participate to receive the full spectrum of responses for the EI. If you have 30<100 employees, the report will include the percentage of engaged employees only.
ENGAGEMENT HIERARCHY: Every employee has a distinct set of needs that follows a hierarchy, with basic needs at the foundation and growth at the top. Employees feel more or less
engaged depending on how well they believe their needs are being met in the workplace.
UNDERSTANDING THE SCORES
THE SURVEY SCALE: The engagement survey utilises a 5-point scale with 1=Strongly Disagree and 5=Strongly Agree. For each question, employees have the option to also select
Copyright 2022 Gallup, Inc. All rights reserved.
Copyright © 1993-1998 Gallup, Inc. All rights reserved. The Gallup Q12 items are Gallup proprietary information and are protected by law. You may not
3
administer a survey with the Q12 items or reproduce them without consent from Gallup.
EMPLOYEE ENGAGEMENT REPORT |
NAPIER CITY COUNCIL EMPLOYEE ENGAGEMENT SURVEY 2022
ROLLUP |
| ALL - ALL | MAY 22, 2022 - JUN 03, 2022
“Don’t know” or “Does not apply”.
TOTAL N: The total number of employees who responded to the survey.
MEAN SCORES: The average score using the 5-point survey scale, with 5.00 being the highest score and 1.00 being the lowest.
TOP BOX/%5: The percentage of employees who responded “5 – Strongly Agree” to the survey item.
DISTRIBUTION OF RESPONSES: The percentage of employees who responded “1”, “2”, “3”, “4” or “5” to an item. If 10 or more employees respond to the survey, the report could
display a full distribution of responses. Otherwise, only the percentage of employees who responded with a “5” (TopBox) and item means will display.
SUPPRESSED DATA: Confidentiality of responses is extremely important to Gallup. If too few employees respond to a survey item, the data will be suppressed (not published) and an
asterisk (“*”) will appear in its place.
COMPARISONS
EXTERNAL BENCHMARKING: (Country - New Zealand): Used as a benchmark to determine how your team’s results compare to other workgroups within the Country - New Zealand of
clients.
PERCENTILE RANKING: The 25th percentile indicates 75% of workgroups fell above this score; the 50th percentile indicates 50% of workgroups fell above and below this score; the
75th percentile indicates only 25% of workgroups fell above this score. The higher your percentile, the stronger the item is in relation to the database. Used as a benchmark to determine
how your team's results compare to internal and external workgroups.
Copyright 2022 Gallup, Inc. All rights reserved.
Copyright © 1993-1998 Gallup, Inc. All rights reserved. The Gallup Q12 items are Gallup proprietary information and are protected by law. You may not
4
administer a survey with the Q12 items or reproduce them without consent from Gallup.