3. Economic Impact Assessment
under the Official Information Act 1982
Released
© 2021 Deloitte Access Economics
17
SUMMARY
Overview
An economic impact assessment of the Three Waters Reform
The request
Overview of the economic impact of the reform
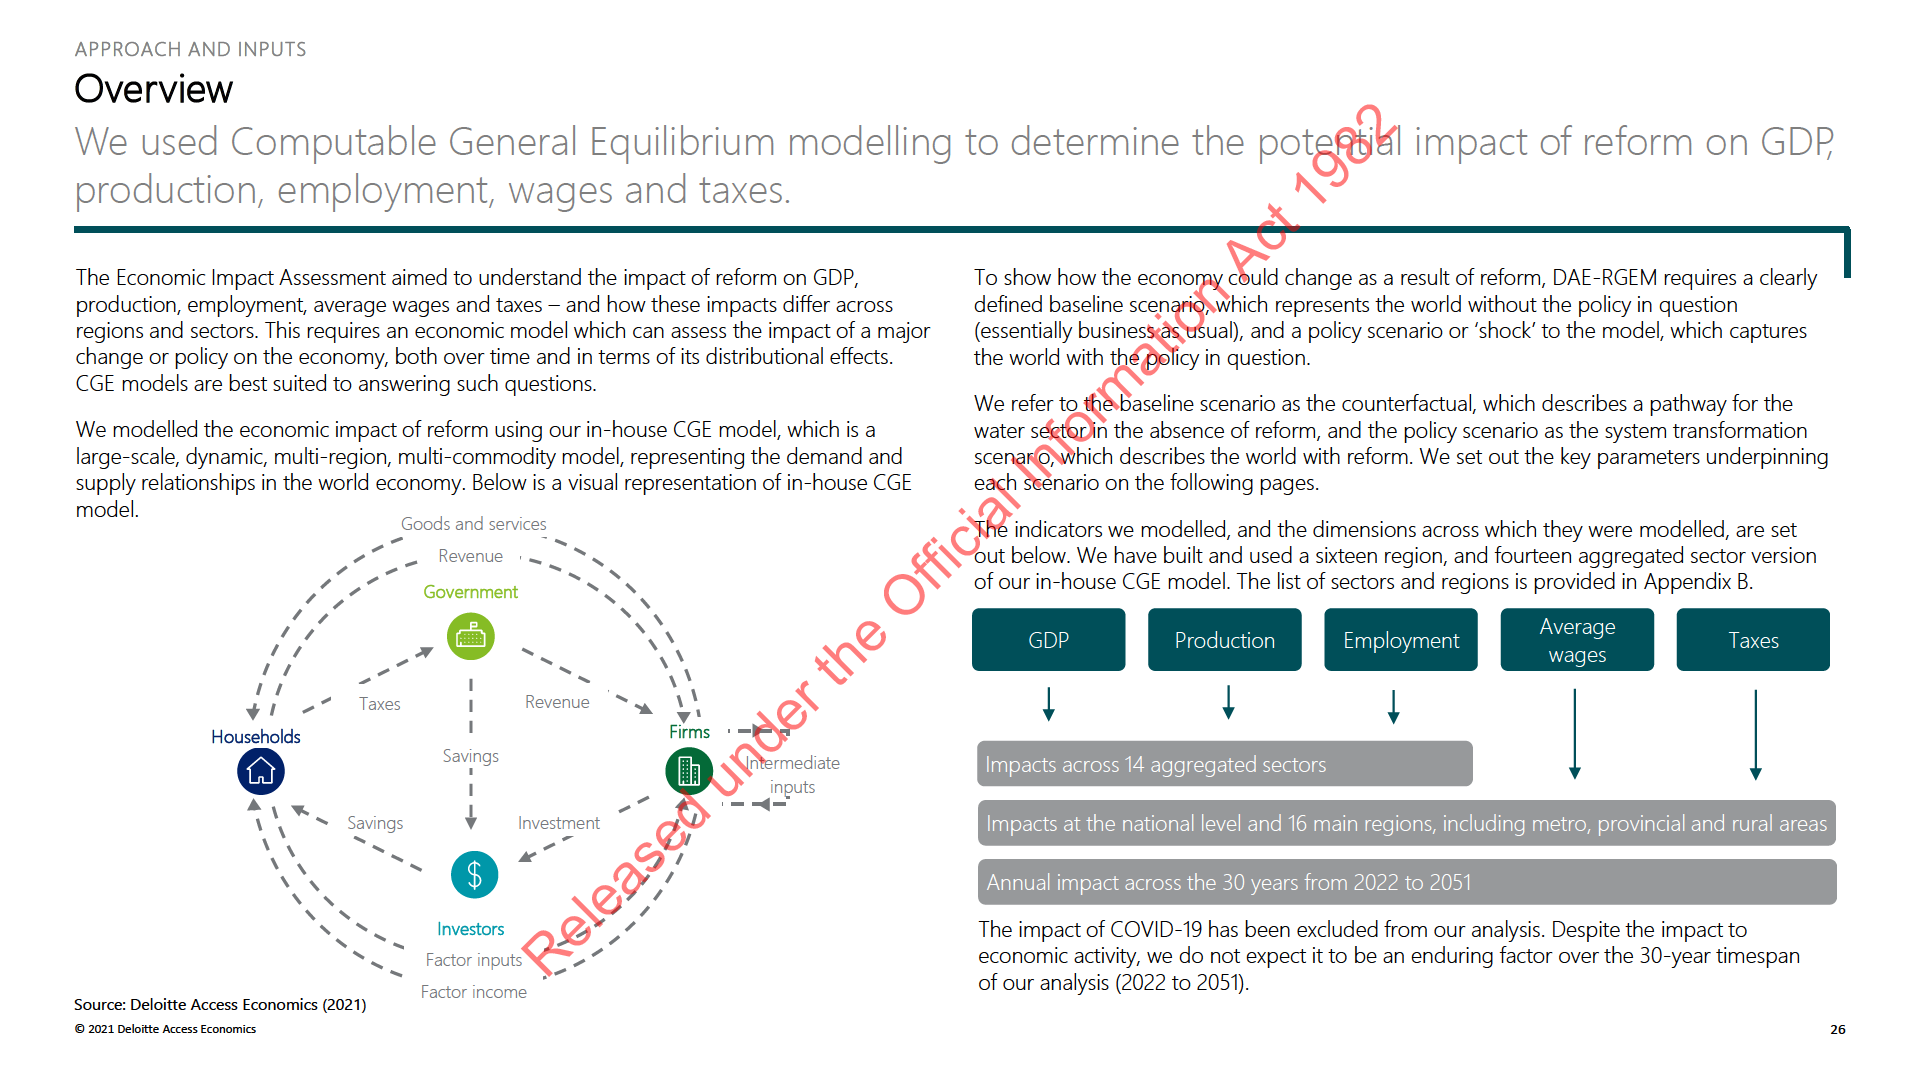
Deloitte Access Economics has been engaged by DIA to assess the potential economic
• Economic activity involves a range of complex interactions between households,
impact of the Three Waters reform, and to develop an understanding of the opportunities
businesses and governments with these agents operating across regions and countries. A
and risks presented to the affected industries. The economic impact assessment and
change in any part of the economy can therefore have a ripple effect throughout the
affected industries analysis will provide evidence to support the Regulatory Impact
whole economy. For example, a new project or program might create economic
Assessment (RIA).
opportunities in one region, but could also increase the scarcity of inputs, and in turn
affect output in other sectors.
This section of the report provides results for the economic impact of the reform. Deloitte
Access Economics assessed the economic impact of a material step up in investment in
• Computable General Equilibrium (CGE) models are the best-practice method available for
examining the impacts of a change in one part of the economy on the broader economy.
connection with reform, relative to the level of investment that might be expected in the
This is because CGE models explicitly account for behavioural responses of consumers,
absence of reform (i.e. the counterfactual). The assessment estimates how this would flow
firms, governments and foreigners, while evaluating the impacts of a given policy change.
through to national and regional indicators such as GDP, employment, wages and taxes.
At the same time, CGE modelling also accounts for resource constraints and effectively
Sections 10 to 17 discuss risks and opportunities for industries affected by reform.
represents the economic trade-offs that face the economy and its participants.
Structure of this section of the report
• The economic impact of the reform has been estimated using Deloitte Access Economics’
in-house Regional General Equilibrium Model (DAE-RGEM). More technical detail
This section presents the findings of economic impact assessment as follows:
regarding CGE modelling can be found in Appendix A. Economic impact modelling
• Overview of economic impact assessment
compares two future projections of the economy (scenarios) and compares the difference
• Scenario overview
between the two to estimate net impacts.
under the Official Information Act 1982
• Approach and inputs
The two scenarios are:
• National impacts
• Counterfactual: Under the counterfactual scenario, we assumed a pathway for the water
• Workforce impacts
sector in the absence of reform. This scenario draws on the expected investment profiles
• Distributional impacts
without reform over the 30 years from 2022 to 2051.
• System transformation: This scenario models the New Zealand economy with reform,
providing an illustrative range of the accelerated investment profile reform could enable
Released
relative to the counterfactual. This scenario factors in the expected investment profiles
under reform, over the 30 years from 2022 to 2051.
© 2021 Deloitte Access Economics
18
SUMMARY
Summary of results for core scenarios
Reform could deliver a significant economic benefit. Our focus in reporting the results are on the Low and
High Scenarios to provide an indicative range of the potential economy impact.
Our analysis focuses on Low Scenario and a High Scenario, as this provides a low and high range for the resulting economic impact. Each scenario contains high or low inputs for forward
investment profiles for the counterfactual and system transformation scenarios. The net economic impact for each scenario is presented below. We have used a 5% discount rate, per the New
Zealand Treasury’s default discount rate.*
A summary of the net economic impact relative to the counterfactual – 2022 to 2051. Change in:
Scenario
GDP
Production
Average FTEs
Average wages
Taxes
1. Low Scenario: Low system transformation vs low
constrained counterfactual
+$14b
+$29b
+5,849
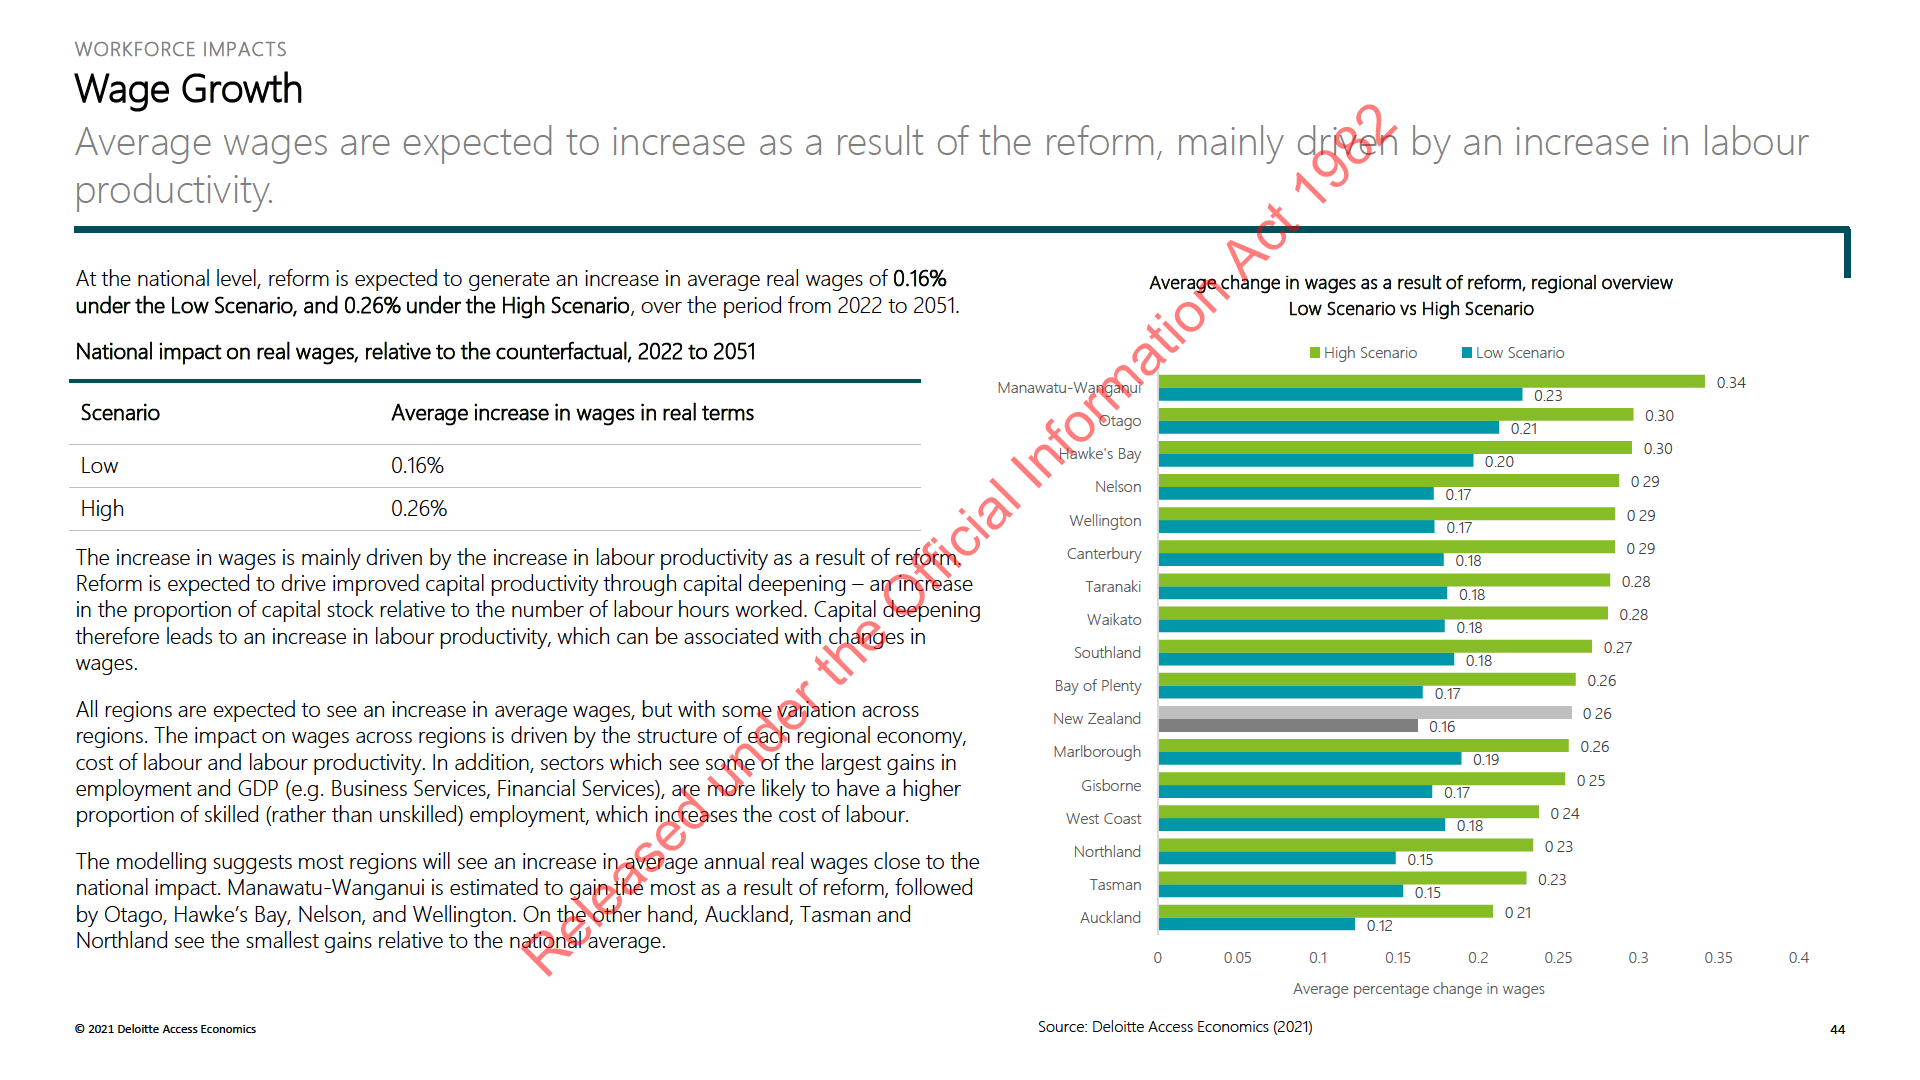
+0.16%
+$4b
2. High Scenario: High system transformation vs
high counterfactual constrained
+$23b
+$47b
+9,260
+0.26%
+$6b
Source: Deloitte Access Economics (2021)
Definitions
GDP: Change in real Gross Domestic Product (GDP) in present value terms over the period 2022 to 2051. GDP includes value added and taxes.
Production: Value of the change in production in present value terms over the period 2022 to 2051. Production is the change in GDP plus the cha
under the Official Information Act 1982nge in intermediate outputs.
Average FTEs: Average change in full-time equivalent employees over the period 2022 to 2051.
Average wages: Percentage change in average annual wages as a result of reform, over the period 2022 to 2051.
Taxes: Value of the change in overall taxes, in present value terms, as a result of reform over the period 2022 to 2051.
*Using an Social Rate of Time Preference of 3.5%, under the Low Scenario, the GDP result is $18b, production is $36b and taxes are $4.4b. Under the High Scenario, the GDP result is $29b,
production is $58b, and taxes are $7.2b.
Released
© 2021 Deloitte Access Economics
19
SUMMARY
Summary of results for other modelled scenarios
The Optimistic and Historic Scenarios also show a large positive impact across the economy as a result of
reform.
We also modelled two other scenarios based on alternative assumption sets. The net economic impact of the other scenarios is shown below, again using a 5% discount rate. Neither of the two
scenarios below are included in our preferred core scenario range. We do not consider the Optimistic Scenario as likely, and as the Historic Scenario is based on historic capital spend rather than
a forward looking perspective, which we consider less relevant. The historic scenario provides a cross-check for what might happen if councils do not change historic behaviour in response to
increased regulatory and community pressure.
A summary of the net economic impact relative to the counterfactual – 2022 to 2051
Scenario
GDP
Production
Average FTEs
Average wages
Taxes
3. Optimistic Scenario: High system transformation
vs low constrained counterfactual
+$25b
+$51b
+10,217
+0.28%
+$6b
4. Historic Scenario: Low system transformation vs
historic counterfactual
+$16b
+$32b
+6,667
+0.18%
+$4b
Source: Deloitte Access Economics (2021)
Definitions
GDP: Change in real Gross Domestic Product (GDP) in present value terms over the period 2022 to 2051. GDP includes value added and taxes.
Production: Value of the change in production in present value terms over the period 2022 to 2051. Production is the change in GDP plus the cha
under the Official Information Act 1982nge in intermediate outputs.
Average FTEs: Average change in full-time equivalent employees over the period 2022 to 2051.
Average wages: Percentage change in average annual wages as a result of reform, over the period 2022 to 2051.
Taxes: Value of the change in overall taxes, in present value terms, as a result of reform over the period 2022 to 2051.
Released
© 2021 Deloitte Access Economics
20
4. Scenario Overview
under the Official Information Act 1982
Released
© 2021 Deloitte Access Economics
21
SCENARIO OVERVIEW
Scenario Overview
This section summarises the scenarios considered in our assessment of the potential economic impact
Overview of the counterfactual and system transformation scenarios
Overview of the modelled scenarios
To understand what the economic impact of the reform could be, it is necessary to
We have used two alternative inputs (a low estimate and a high estimate) for both the
determine what the water sector could look like in the absence of reform, and what it could
counterfactual and the system transformation scenario. This formed four modelled scenarios
look like with reform. This can be summarised into two broad scenarios:
for the economic impact assessment:
The counterfactual scenario sets out a pathway for the water sector in the absence of reform.
1. Low Scenario: This scenario is characterised by a low estimate of the expected additional
The counterfactual describes what Councils are expected to spend if the reform did not
spend by Councils in the face of new regulatory constraints, and the spend with reform
proceed, and the extent to which they might face regulatory pressure. Spend under the
based on relationships between historical enhancement and growth investment in the UK
counterfactual case is higher than what Councils have spent historically. Debt and price
and various geographical indicators (WICS Approach 1).
constraints have been applied to the counterfactual. The counterfactual differs from the
2. High Scenario: This scenario is characterised by a high estimate of the expected
status quo, which we have not modelled, given regulatory changes (including the
additional spend by Councils in the face of new regulatory constraints, and the spend
establishment of Taumata Arowai) have been confirmed by Cabinet and are in the process of
with reform based on relationships between historical enhancement and growth
implementation. Data for the counterfactual was based on WICS’ phase two analysis, which
investment in Scotland and various geographical indicators (WICS Approach 2).
was sourced through the Request for Information (RFI) process.
3. Optimistic Scenario: This scenario is characterised by a low estimate of the expected
The system transformation scenario is illustrative of the forward investment profile the reform
additional spend by Councils in the face of new regulatory constraints, and the spend
could enable far more quickly than under the counterfactual. Data for the system
with reform based on relationships between historical enhancement and growth
transformation scenario was based on WICS’ Phase Two analysis, and modelling undertaken
investment in Scotland and various geographical indicators (WICS Approach 2).
by WICS.
4. Historic Scenario: This scenario is characterised by an estimate of the expected spend by
under the Official Information Act 1982
More detail on the policy parameters for each of the scenarios is provided on the
Councils if the regulatory pressure remains but this scenario provides a lower bookend
subsequent pages.
for what might happen in the future if historic rates of expenditure were to continue (i.e.
spend is based on the historical trend), and the spend with the reform based on
Given substantive policy decisions which drive the exact volume and nature of investment
relationships between historical enhancement and growth investment in the UK and
are yet to be made, there is uncertainty around what the economic benefit might be. To
various geographical indicators (WICS Approach 1).
account for this uncertainty, we have modelled four main scenarios, as described opposite.
This report focuses on the Low Scenario (the most conservative scenario) and the High
Released
scenario. We modelled the Optimistic Scenario and the Historic Scenario as sensitivities.
© 2021 Deloitte Access Economics
22
SCENARIO OVERVIEW
Counterfactual Scenario
Under the counterfactual scenario, Local Government retains responsibility for Three Waters services.
Our low and high estimates for the counterfactual draw on constrained expenditure figures provided by DIA. Constrained expenditure reflects the amount of investment that might be
possible without reform, with particular debt and price constraints imposed.* The table below outlines the key, high-level policy parameters underpinning the counterfactual.
Dimension
Description
There is no amalgamation of water services into a small number of WSEs. Instead, the 67 Councils continue to provide Three Waters services,
Number of providers
and retain direct ownership of water assets and responsibility for their funding. Revenue is sourced from households or other Council funds,
and price increases for customers. Some efficiency gains are assumed for larger Councils, but overall efficiency gains are much lower under the
counterfactual than under the system transformation scenario.
The establishment of Taumata Arowai, and the introduction of a new water services regulatory framework, will place greater pressure on
Regulatory standards
Councils to improve service delivery. This is expected to improve compliance, regulatory oversight, and transparency and accountability. More
regional collaboration across Councils in relation to resource management and land use planning is also anticipated.
Volume of investment
A renewed, collective focus on Three Waters services and greater public scrutiny around service delivery, is expected to drive a material
increase in investment. However, a large infrastructure deficit will remain.
Affordability constraints will limit significant investment, and see most Councils deferring much of their required investment. Borrowing is also
Financial constraints
likely to rise, although Councils’ will not exceed 500% debt to revenue limit for water assets. Cou
under the Official Information Act 1982ncilsare expected to offset this higher debt to
revenue ratio for water assets with lower debt to revenue ratios for other assets, so they continue to meet the LGFA debt covenants.
Economic regulation
Economic regulation is not introduced - or at least not to the same extent as under a system transformation scenario – as it is not feasible to
apply this to 67 separate Councils. This also hinders efficiency gains.
Released
*See page 34 for the specific debt and price constraints imposed.
© 2021 Deloitte Access Economics
23
SCENARIO OVERVIEW
System Transformation Scenario
System transformation transfers Three Waters services from Councils to a small number of water services
entities.
Our low and high estimates for the system transformation scenario are sourced from WICS. The system transformation scenario reflects investment that might be possible with reform,
based on either the UK’s or Scotland’s water reform experience. The table below highlights the key, high-level policy parameters underpinning this scenario.
Dimension
System transformation
Three waters services are shifted away from Councils’ remit to a small number of multi-regional water service providers – likely three to five statutory,
Number of providers
asset-owning entities. Other legislative changes to enhance the governance, management and resourcing of Three Waters, are also enacted. These
changes will deliver a range of efficiencies, including elimination of duplicated functions, a greater ability to attract and retain talent, more effective
procurement, and optimisation of asset levels.
As under the counterfactual, the WSEs would be subject to monitoring by Taumata Arowai, and a new water services regulatory framework. This will
Regulatory standards
place greater pressure on Councils to improve netwo k performance. However, Taumata Arowai will be able to perform its role more efficiently, as it will
not need to monitor and regulate 67 separate Councils.
Significant capital investment by the WSEs will be enabled through the separation of balance sheets from local Councils, and financial and operational
autonomy, which will improve access to debt. The package of reforms (aggregation, policy clarity, stronger governance, and economic regulation) will
Volume of investment
also enable new entities to realise economies of scale in the delivery of Three Waters services, which can help to offset the significant forward
investment requirements. As a result, capex is significantly higher under the system transformation scenario relative to the counterfactual, and the
infrastructure deficit is reduced faster Government funding will support the transition and establishment phases of reform.
under the Official Information Act 1982
Financial constraints
The WSEs will be better able to borrow to fund infrastructure requirements than Councils, as strengthened financial structures will allow them to take on
more debt.
Economic regulation
Amongst other things an economic regulatory regime regulates the maximum revenue WSEs can earn for a given level of investment, taking into
account required levels of service.
Released
© 2021 Deloitte Access Economics
24
5. Approach and Inputs
under the Official Information Act 1982
Released
© 2021 Deloitte Access Economics
25
APPROACH AND INPUTS
Formulating the shock for the Economic Impact Assessment
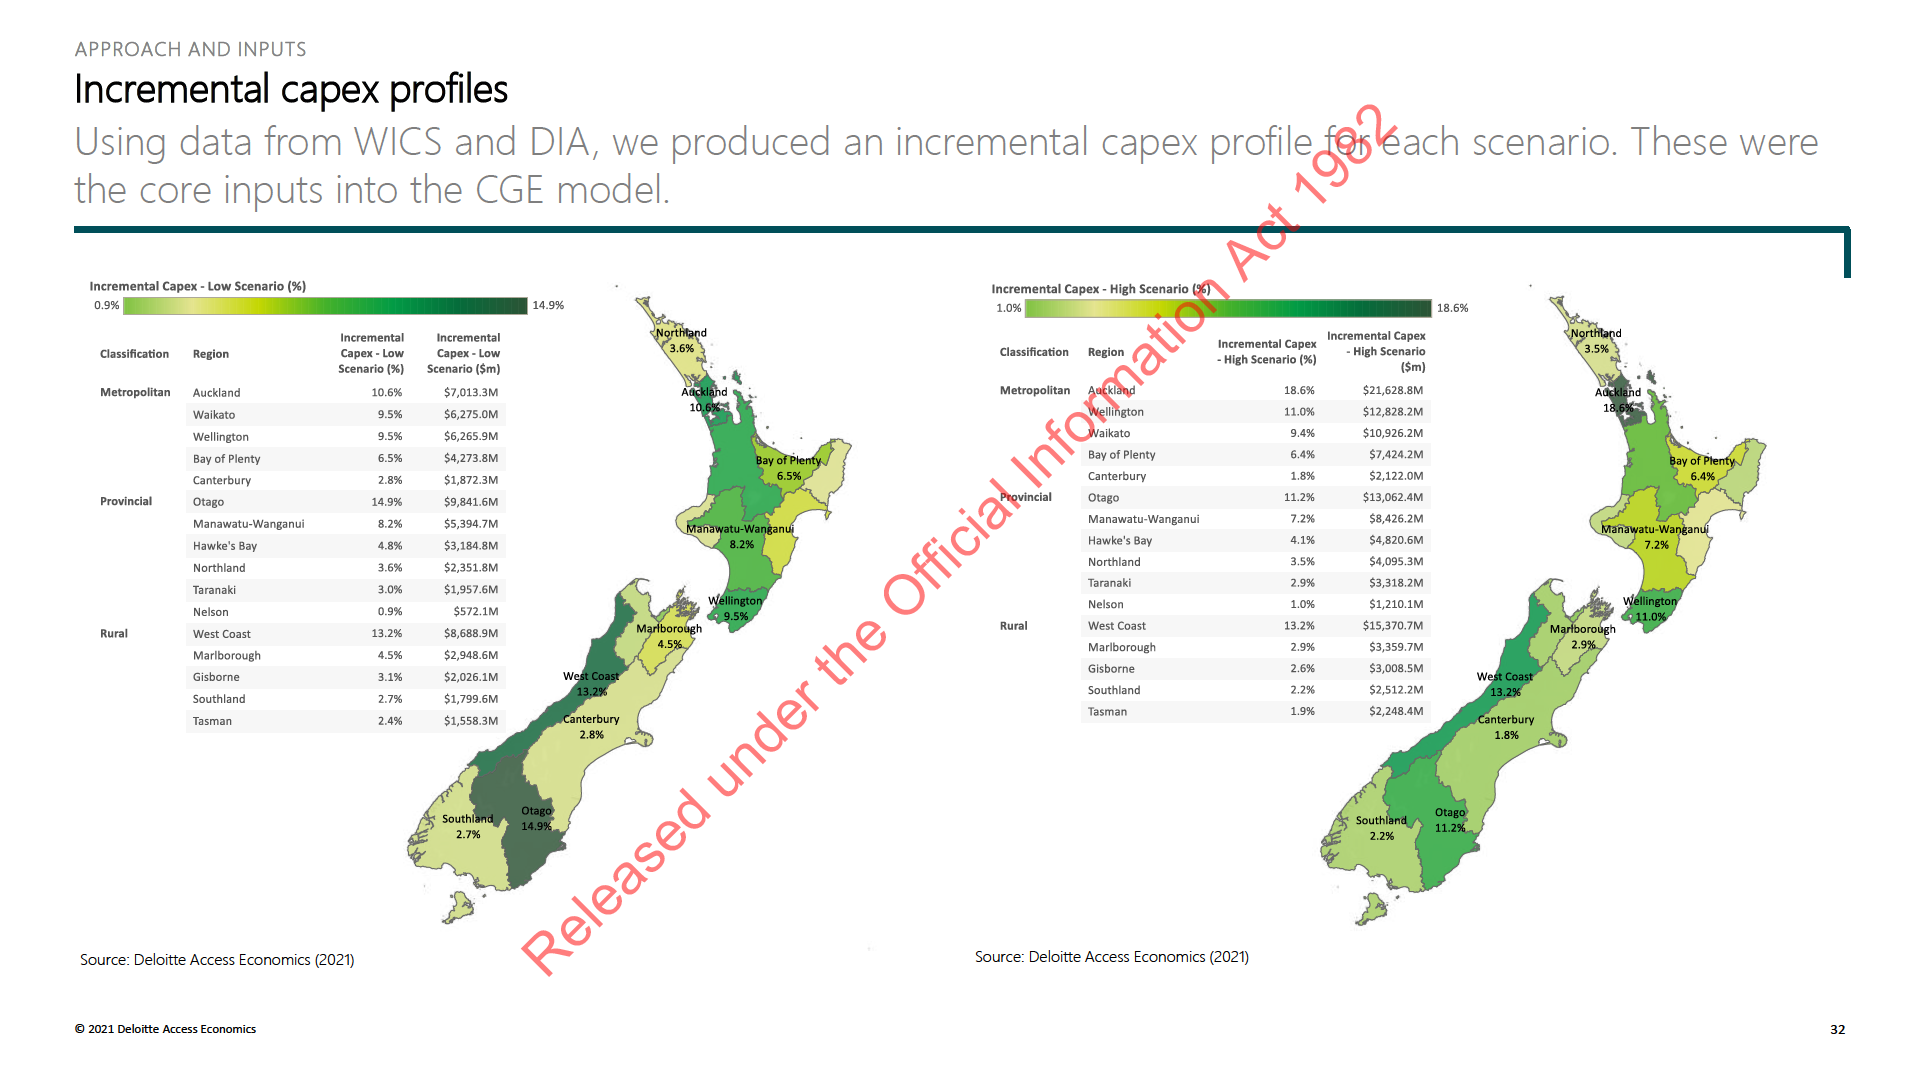
We have aggregated incremental capital expenditure profiles from individual Councils/Territorial
Authorities into 16 regions to include within our Model.
The Three Waters infrastructure network consists of infrastructure and processes used to collect, store, transmit through reticulation, treat, and discharge, Three Waters. At its core, reform is
intended to address the root causes of systemic failure in the existing system for delivering Three Waters. A key benefit of reform is that it addresses the challenges local authorities face in
planning for and investing in long term infrastructure needs, by establishing new WSEs with the operational and financial autonomy to undertake a significant uplift in investment to address
historic underinvestment, and meet health and environmental standards. DIA and WICS provided capital expenditure (capex) data for the system transformation and counterfactual scenarios,
which projected the likely spend with and without reform.
As discussed earlier, CGE modelling considers the flow-on effects of investment in the water sector on other sectors, while accounting for the overall constraints in the economy (e.g. availability
of labour). We formulated the CGE shock according to the steps below:
3. We applied the incremental regional
investment (i.e. capex data) as a shock to
the CGE model. This shock was applied to
the water sector on a regional basis.
2. We aggregated TA level incremental
investment (i.e. capex data) to a regional
level.
1. We used investment (i.e. capex data), at
an individual Council/ Territorial Area (TA)
level, over 30 years to calculate the
under the Official Information Act 1982
incremental spend based on the difference
between the system transformation and
counterfactual data.
Released
Source: Deloitte Access Economics (2021)
© 2021 Deloitte Access Economics
27
APPROACH AND INPUTS
Formulating the shock for the Economic Impact Assessment
We modelled an increase in capex, targeted towards the water sector. The resulting increase in water
sector output was assumed to be driven by improved capital productivity.
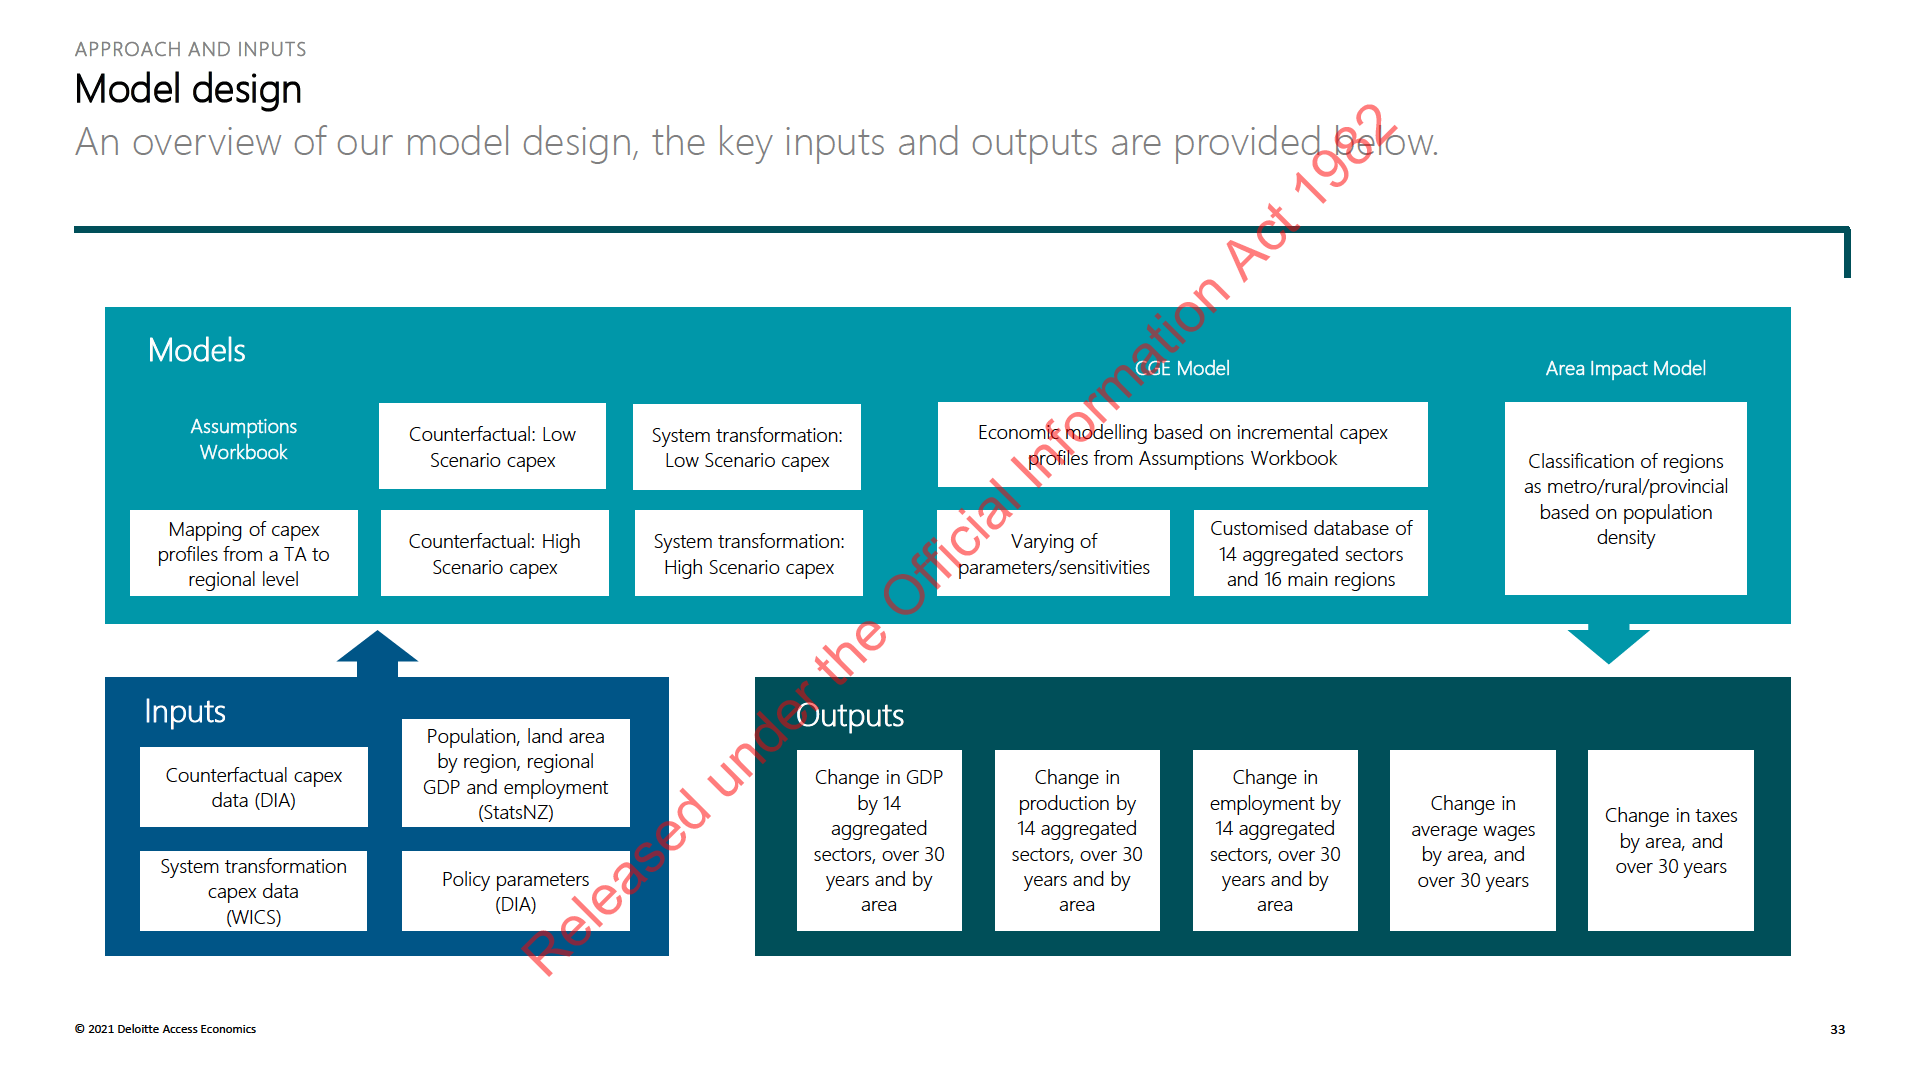
1. The core input into the CGE model for each scenario was incremental capital expenditure
iii. Deloitte Access Economics used the capex data for the water sector and
i.e. the difference between projected capex under the system transformation scenario,
implemented this as capital-productivity induced expansion in the water sector’s
and projected capex under the counterfactual.
output. We have interpreted the figures in terms of their intended outcome (e.g.
2. The incremental investment data was collected at an individual Council/TA level, and
improved service outcomes), rather than the investment’s expenditure effect. To
aggregated to a regional level based on the regional boundaries defined by Statistics
determine the appropriate link between the level of capital expenditure and the
New Zealand and the location of each TA within a region. Where a TA’s geographic
implied improvement in the water sector’s output, we pro-rated the investment
boundary spanned two or more regions, we allocated that TA to the region with the
figures down by the ratio of capital as an input to the water sector as well as the
greatest overlap.
share of capital usage, for which the water sector accounts. So in cases where a
3. The regional incremental investment profiles were used as the shock to our CGE model
region is set to receive a given increase in investment, it instead receives a proxied
and implemented as capital-productivity induced expansion in the water sector’s output:
boost to water output which is achieved via more efficient capital coming online.
Therefore, by focusing on a capital productivity shock, the model cannot factor in
i.
The reform aims to establish new multi-regional WSEs with financial and
underlying economic inefficiencies associated with the counterfactual.
operational independence. The new entities would have enough balance sheet
capacity to raise debt to finance water investment requirements, while being
In addition, our counterfactual already includes a significant step up in investment
subject to economic regulation that regulates the maximum revenue these entities
relative to the status quo. The economic modelling cannot explicitly account for the
can earn. The water investment will be funded through a mix of user charges and
impact of existing systemic challenges in the water sector, such as reactive and
improved efficiencies. This means the policy to be modelled has three key
inefficient spend, and a lack of clear career pathways – which will likely continue under
components: an increase in investment (making up for historical underspend),
the counterfactual. As a result, the results presented in this report are a conservative
efficiency improvements in the water sector, and changes in user charges.
estimate of the potential economic impact of reform.
ii.
At present, there is only concrete information on the capex component. Simulating
under the Official Information Act 1982
a blanket increase in investment across the various regions would give biased
Water infrastructure is complex, expensive, and largely located underground. Based on
impacts – especially given the sector-specific nature of the investment and the
WICS data, below ground infrastructure is expected to comprise approximately 60% of
general nature of capital in our CGE Model. Without some way to specifically
investment. A number of studies suggest underground infrastructure leads to higher
target the water sector, the results would struggle to tell a meaningful story, given
local employment multipliers, given the relatively labour intensive nature of associated
generic capex shocks tend to have broad-based benefits with particular
capex. Due to data limitations in the counterfactual, the economic impact assessment
concentration in construction, trade and business services.
focuses on the impact of the total investment profile. The Affected Industries section
qualitatively discusses the different impacts above versus below ground investment
Released
could have.
© 2021 Deloitte Access Economics
28
APPROACH AND INPUTS
Formulating the shock for the Economic Impact Assessment
We included a transition path to assess the economic impact of the reform
To assess the economic impact of reform, Deloitte Access Economics applied a transition
period to the reform programme, thereby delaying some of the economic impact of reform.
For the purposes of this report, we assumed a transition path of six years.
Based on international experience, the transition path could be shorter if existing processes
are already in place with the establishment of the new water entity. For example, Victoria
(Australia) had a shorter transition period, where Ballarat Water Board absorbed a number of
smaller water entities. However, if wholly new processes or entities need to be established,
the transition period may be longer, as was the case with the Tasmanian water reform.
This reform is shaping up to be one of the largest in New Zealand’s history, given it involves
moving from 67 local Councils to a small number of new water entities. Establishing the new
entities will be a large and complex process. The first phase of reform will need to focus on
the establishment of the new entities, before reform activities themselves can get fully
underway. This implies the transition period could be relatively long, with time needed to
complete entity establishment, commence scoping of capital work requirements, and
spending money. Accordingly, efficiency savings are likely to be delivered gradually over
time as the new entities are established, and systems and processes take effect.
The transition path will also be influenced by the political will to drive reform, including the
level of desire to accelerate the pace of change. For example, commitments that no staff will
under the Official Information Act 1982
lose their jobs will affect the pace of change.
Released
© 2021 Deloitte Access Economics
29
APPROACH AND INPUTS
Scenarios modelled
We modelled four scenarios, with incremental capital expenditure the key input for each scenario.
To understand the potential economic impact of reform, we modelled four scenarios our in-house CGE model.
The table below summarises the total investment* required under the counterfactual and system transformation scenarios, under different data inputs – either a low estimate or a high
estimate, or in the case of the “Historic Scenario”, the counterfactual is based on trends in historic spend.
Water investment projected under each modelled scenario and the incremental investment applied to assess the economic impact of reform (Total capex, 2022 to 2051, billions)
Scenario
System transformation capex
Counterfactual capex
Incremental capex
1. Low Scenario: Low system transformation vs low constrained
counterfactual
$120b
$55b
$65b
2. High Scenario: High system transformation vs high
counterfactual constrained
$185b
$69b
$116b
3. Optimistic Scenario: High system transformation vs low
constrained counterfactual
$185b
$55b
$130b
4. Historic Scenario: Low system transformation vs historic
counterfactual
$120b
$44b
$76b
under the Official Information Act 1982
Source: Deloitte Access Economics (2021)
*We have not modelled operating expenditure (opex) Modelling opex would likely show an additional economic benefit, which implies the results presented in this report are conservative.
Released
© 2021 Deloitte Access Economics
30
APPROACH AND INPUTS
Key data sources
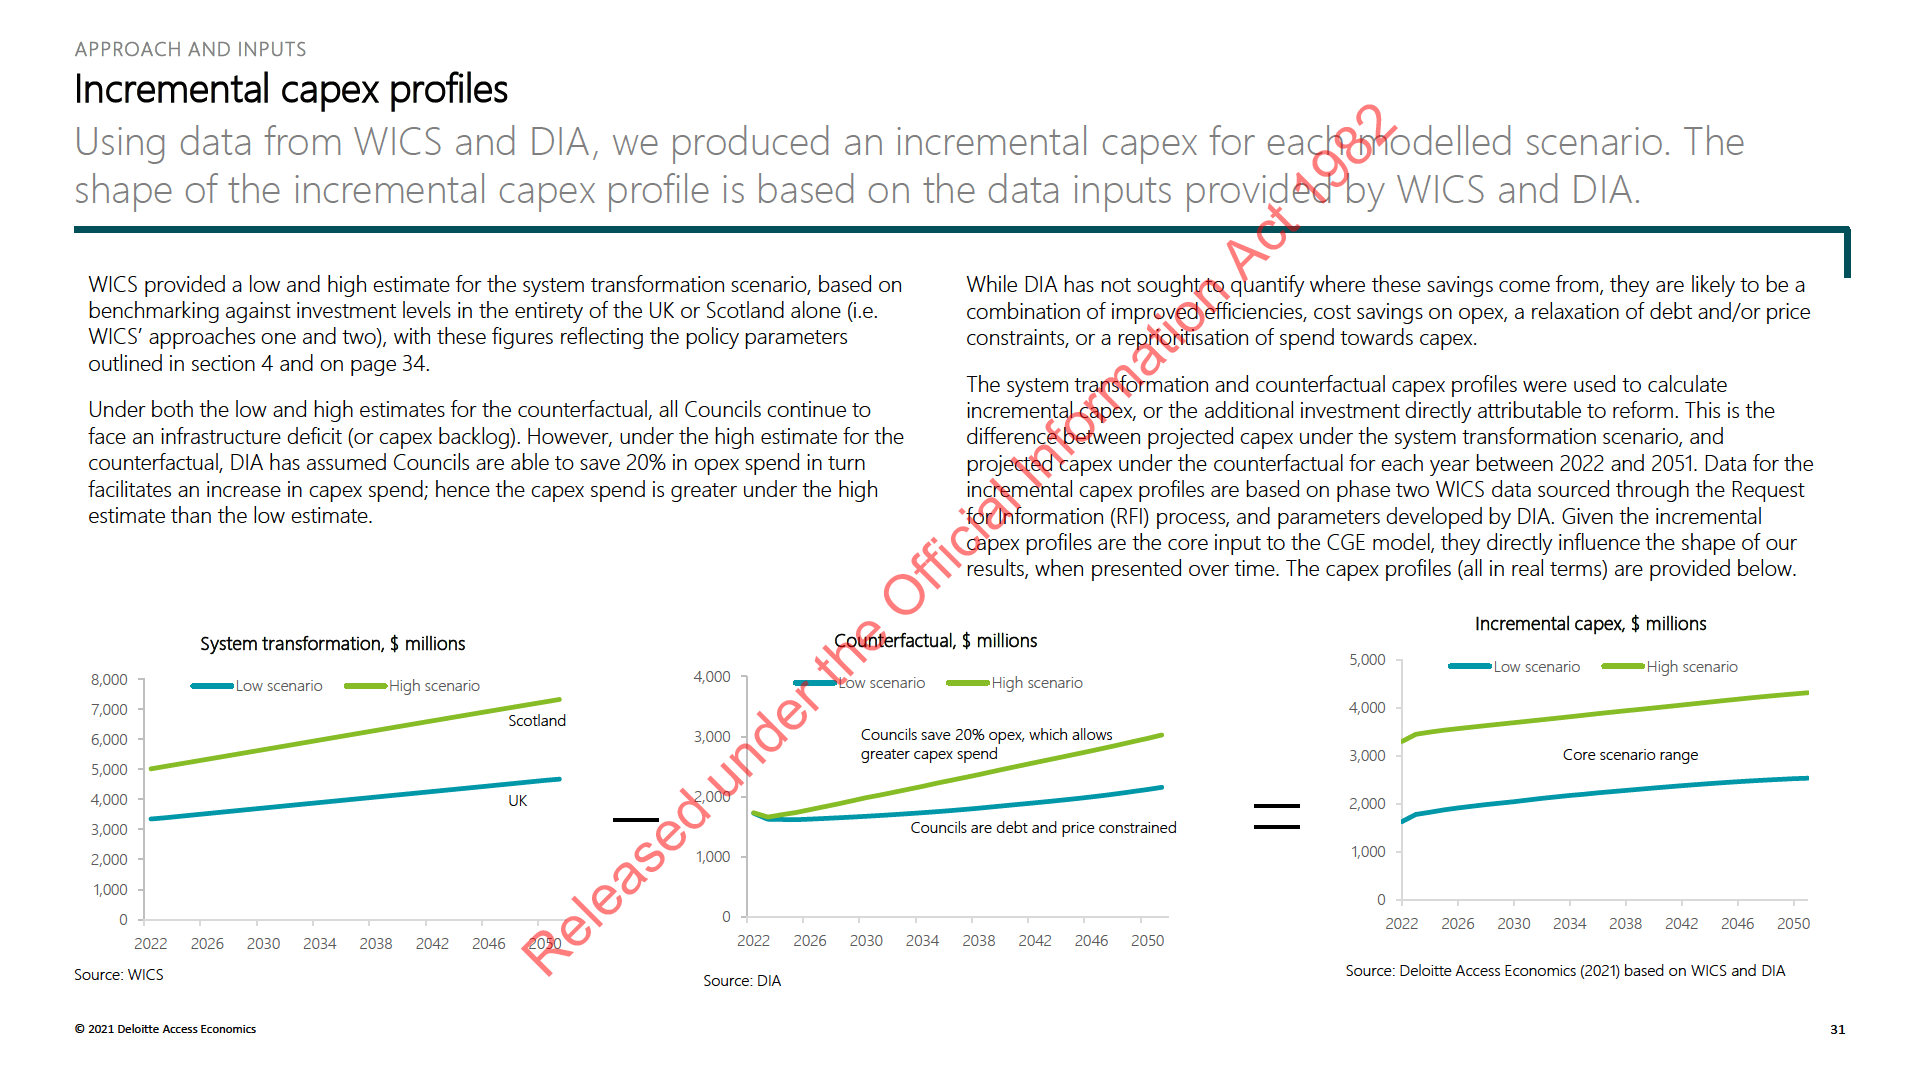
WICS’ system transformation profile uses two approaches: the investment in the UK (approach one) or
Scotland alone (approach two). DIA’s counterfactual capex profile assumes debt and pricing constraints.
System transformation data
Counterfactual
WICS provided data based on their defined Approaches One and Two for the system
DIA drew on WICS data to forecast capex under the counterfactual scenario. A starting
transformation scenario.
position was determined for Councils (i.e. revenue, operating expenditure, debt) based on
WICS’ phase two analysis, and in turn the level of capital expenditure that might be
Approach one
possible if Councils reach their debt limits, and raise water prices in line with historic
Under approach one, the ‘Revised approach used in phase one’, WICS estimated
increases.
potential expenditure on enhancement, growth and renewals. Enhancement and growth
expenditure refers to the provision of new assets or enhancement of existing assets, while
The assumed water price increase is a maximum of 4.4% per annum, in line with the
replacements refer to capital maintenance expenditure needed to maintain existing
historical rate of increase (between 1993 and 2018).
service levels to customers.
As mentioned, the debt limit imposed does not allow Councils to exceed a debt to
Enhancement expenditure was modelled based on investment in the UK, with population
revenue ratio of 500% for water assets. Where the starting debt to revenue ratio is below
and geographic drivers accounted for. A similar method was used to estimate growth
500%, it is assumed the debt to revenue ratio increases over time.
investment, but data for this was sourced from the RFI. This included growth from
A 500% debt to revenue ratio for water assets is a conservative assumption, as most
projected new connections reported by Councils, and a cap per connected citizen of
Councils use lower debt to revenue ratios in other areas to offset a higher debt to
$70,000 to account for financial constraints faced by Councils. WICS uses growth
revenue ratio for water assets, ensuring they do not breach a debt to revenue ratio of
projections provided by Councils. Renewals were modelled in terms of the average
250%.
annual replacement expenditure (i.e. economic depreciation), based on asset values
reported by Councils.
The forecast interest rate is assumed to be 3.5%.
under the Official Information Act 1982
Approach two
This aligns with approach one, with modelling undertaken based on population and
geographic drivers, growth adjustments, and capping. However, modelling was
benchmarked against Scotland only (rather than all of the UK). This was deemed
appropriate as Scotland has many geographical and economic similarities with New
Zealand.
Released
© 2021 Deloitte Access Economics
34
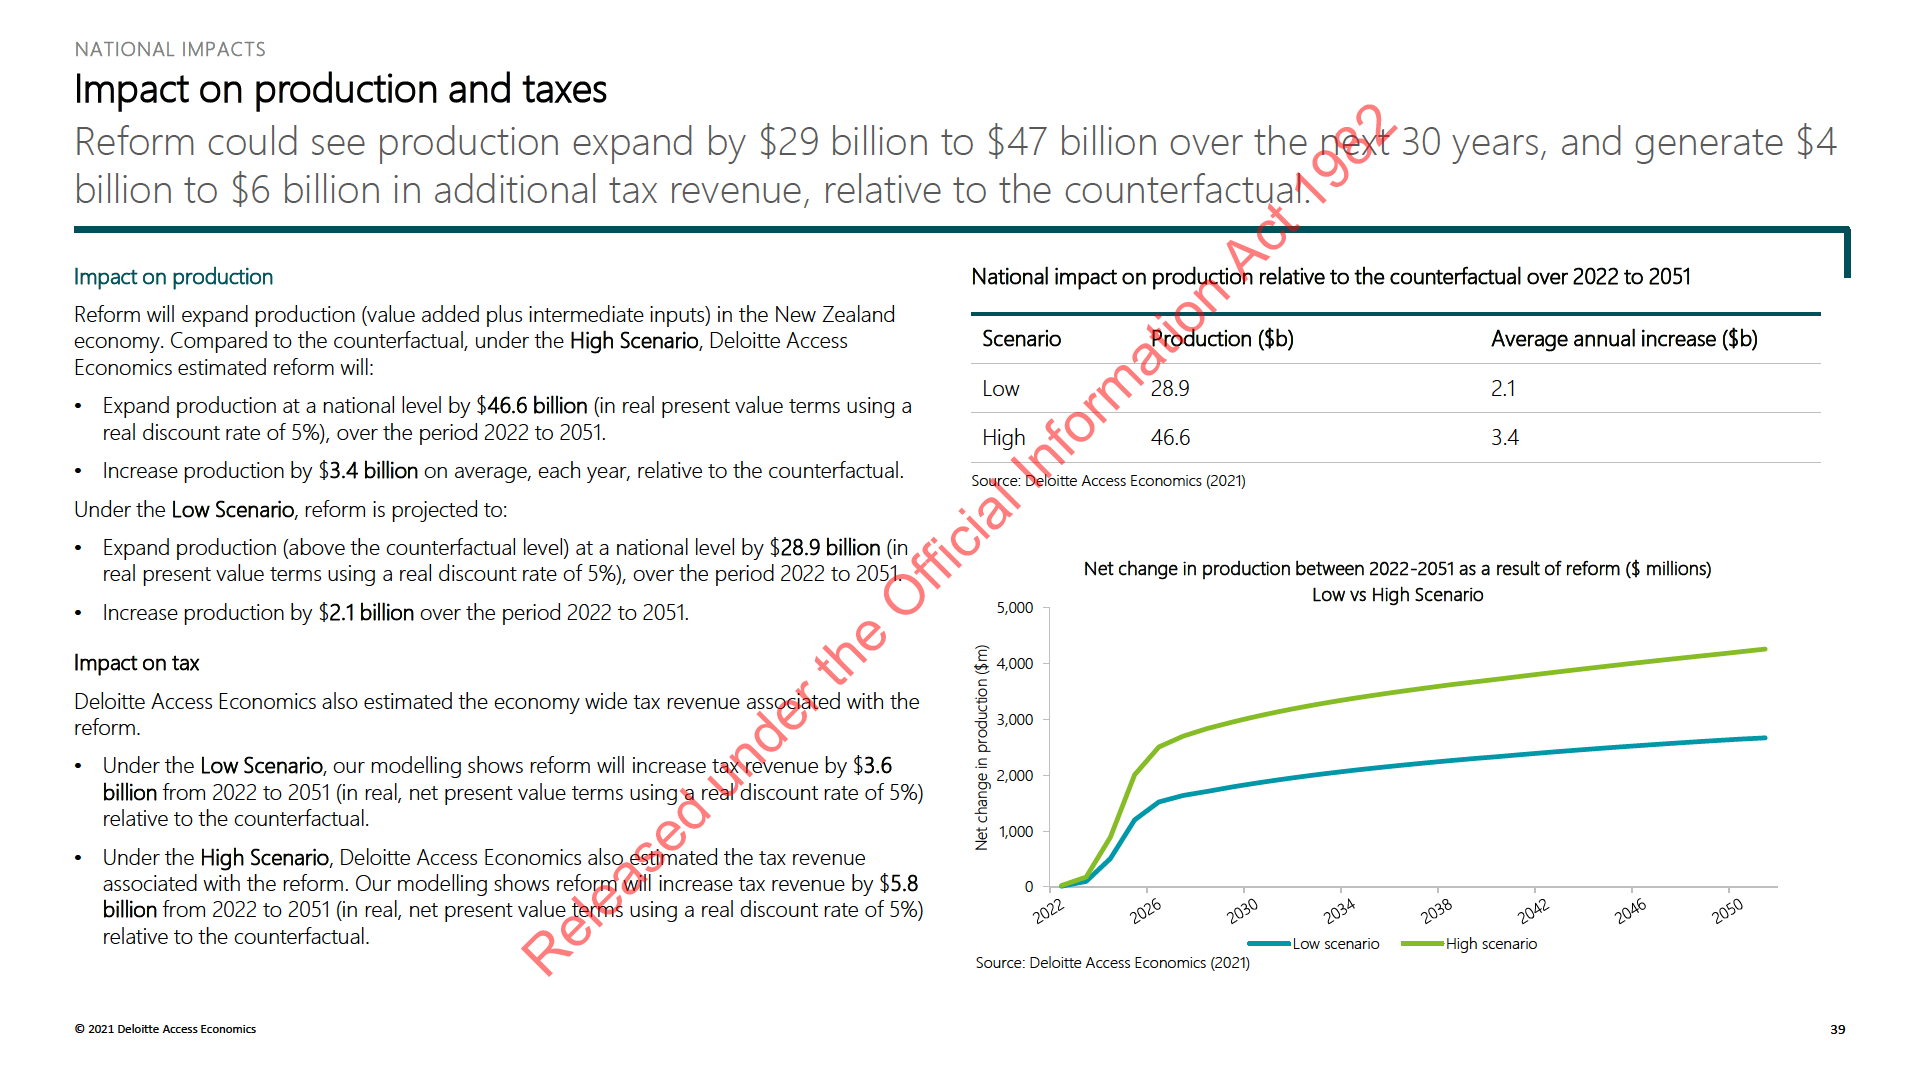
6. National Impacts
Impact on gross domestic expenditure, production and tax
implications
under the Official Information Act 1982
Released
© 2021 Deloitte Access Economics
35
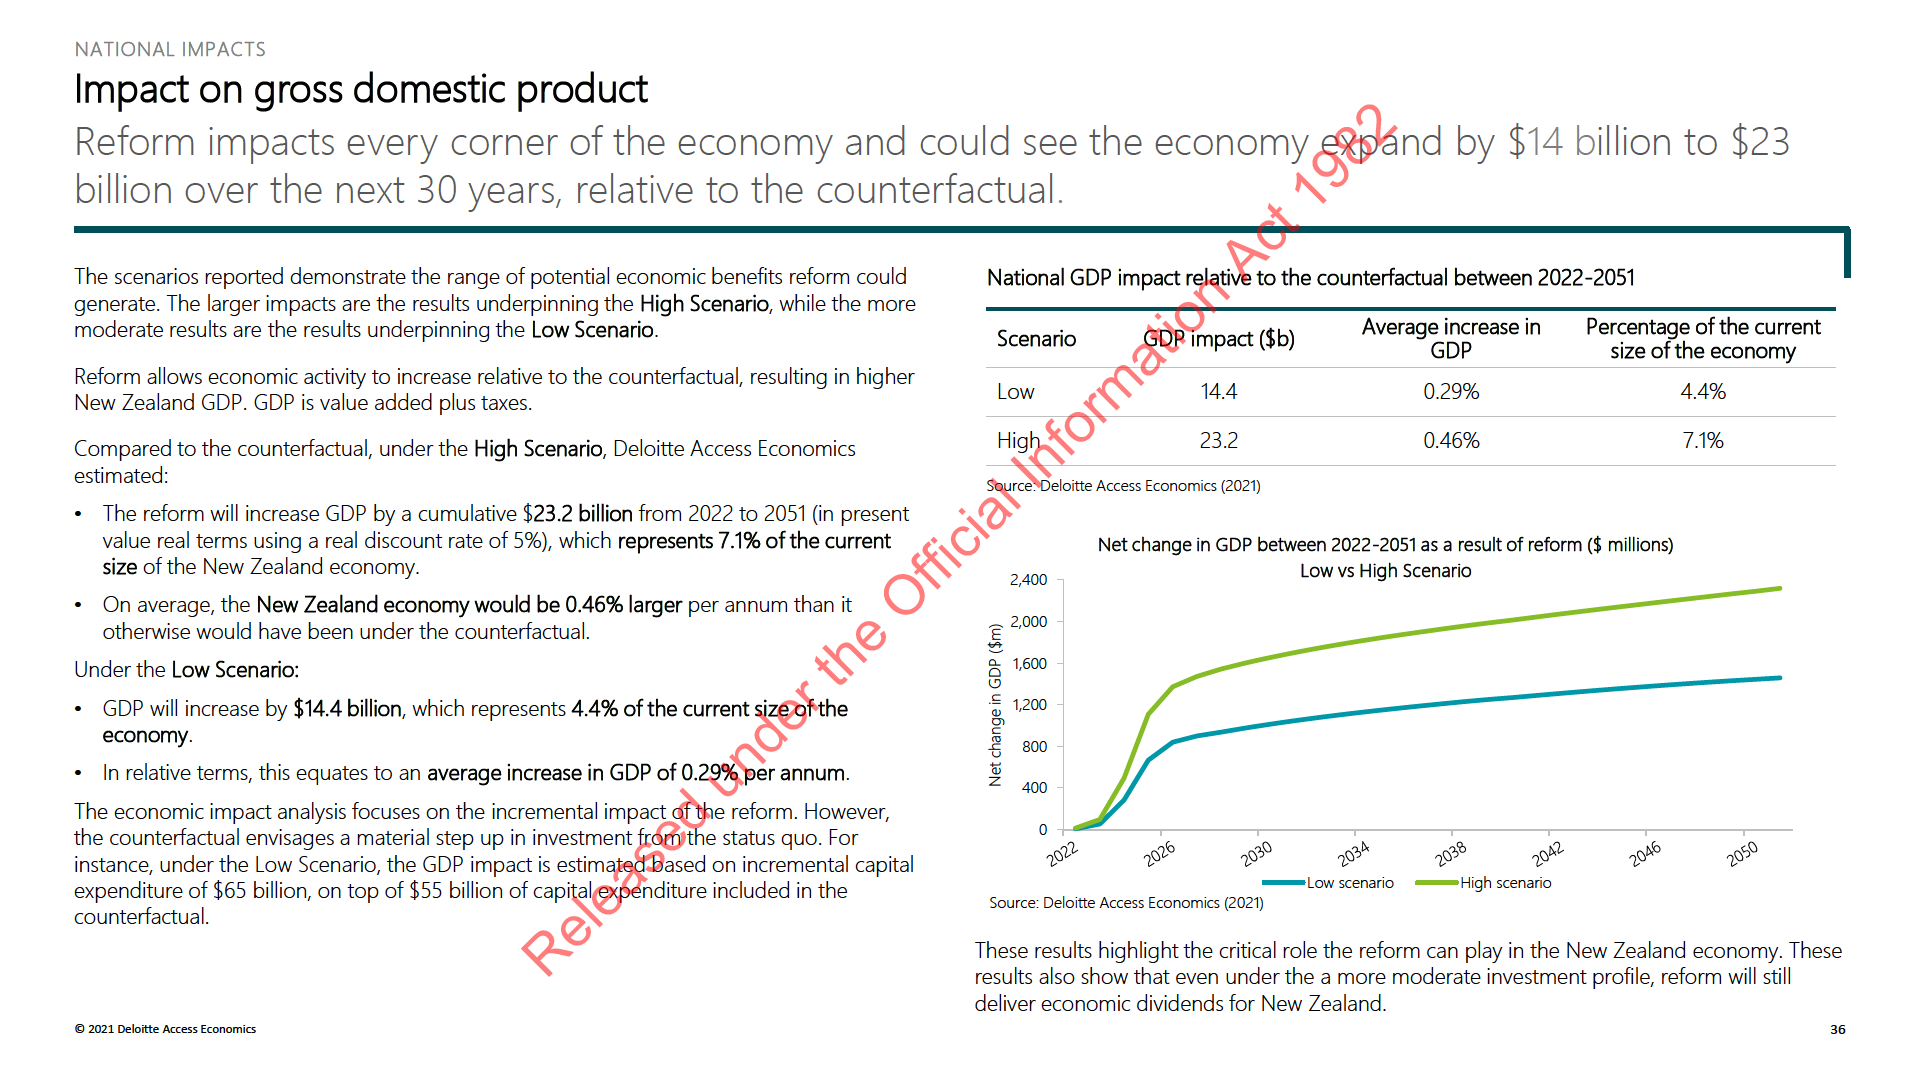
NATIONAL IMPACTS
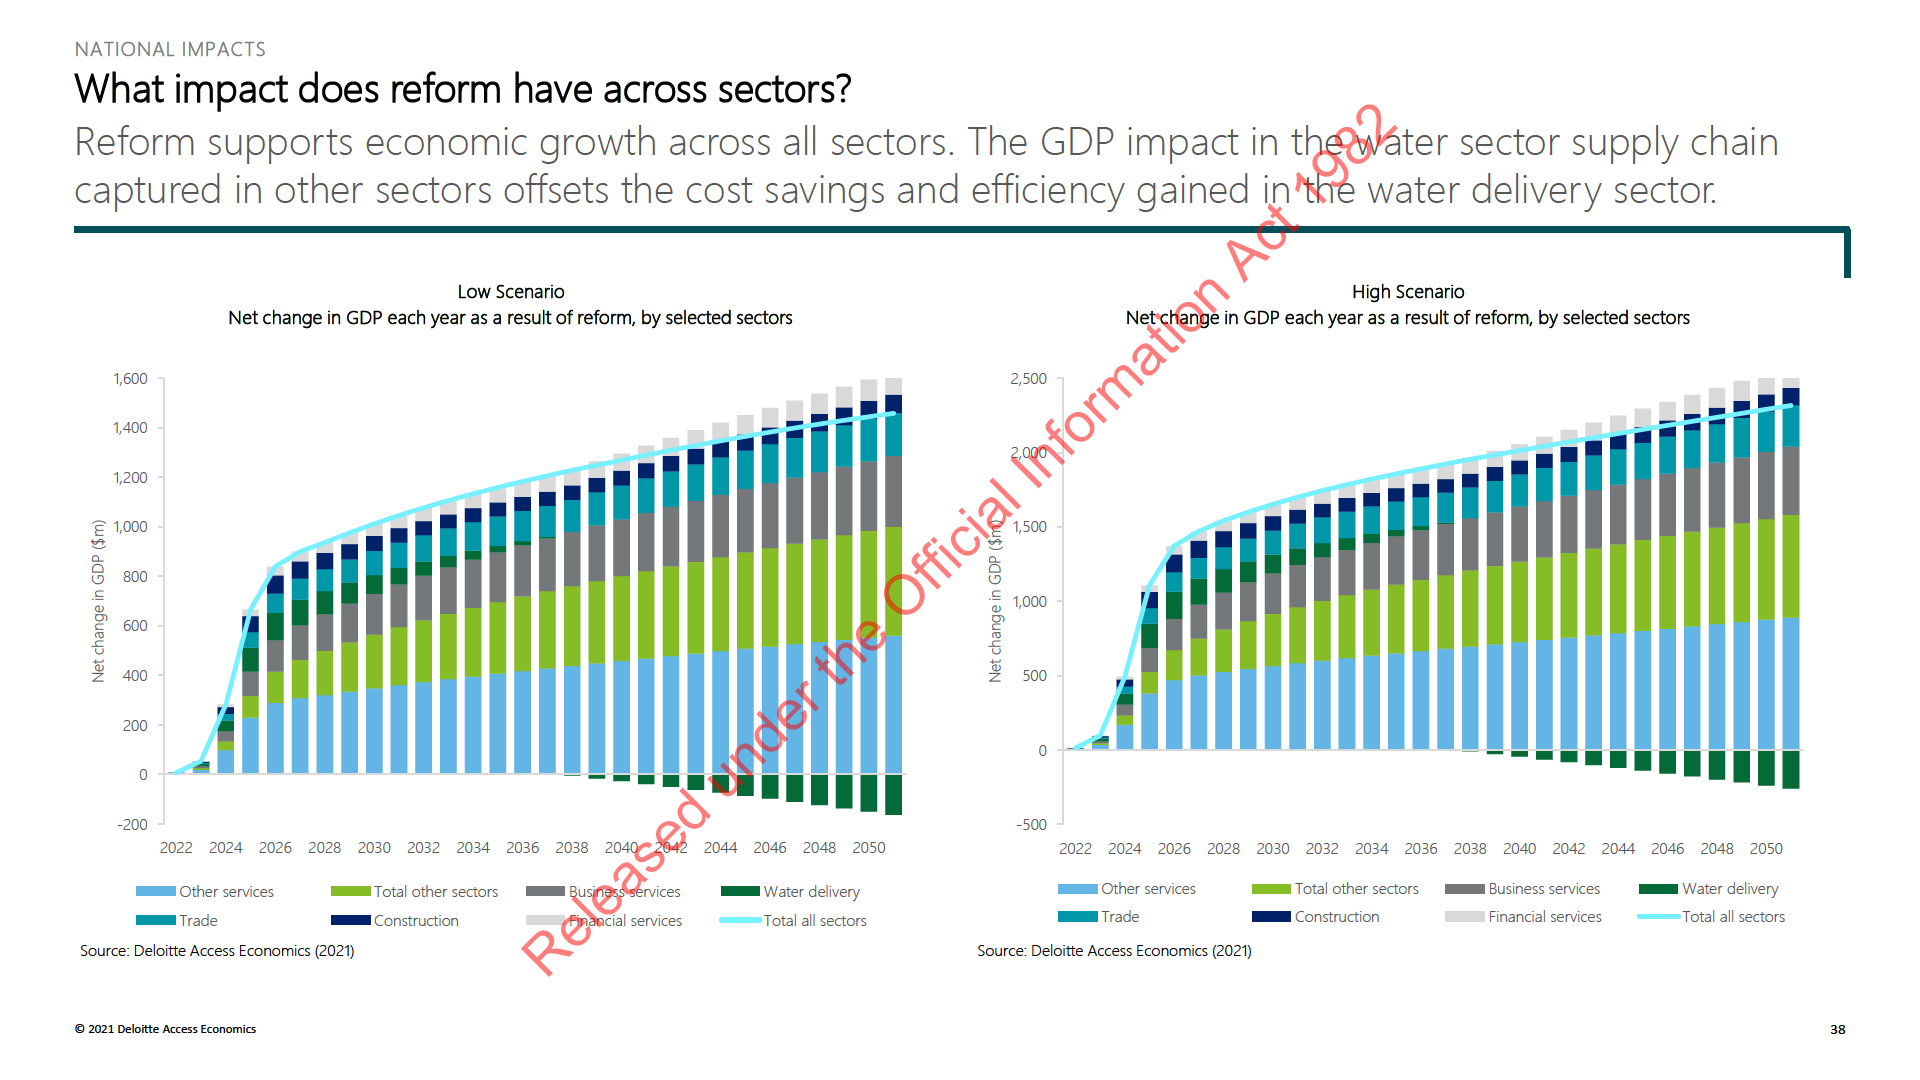
What impact does reform have across industries?
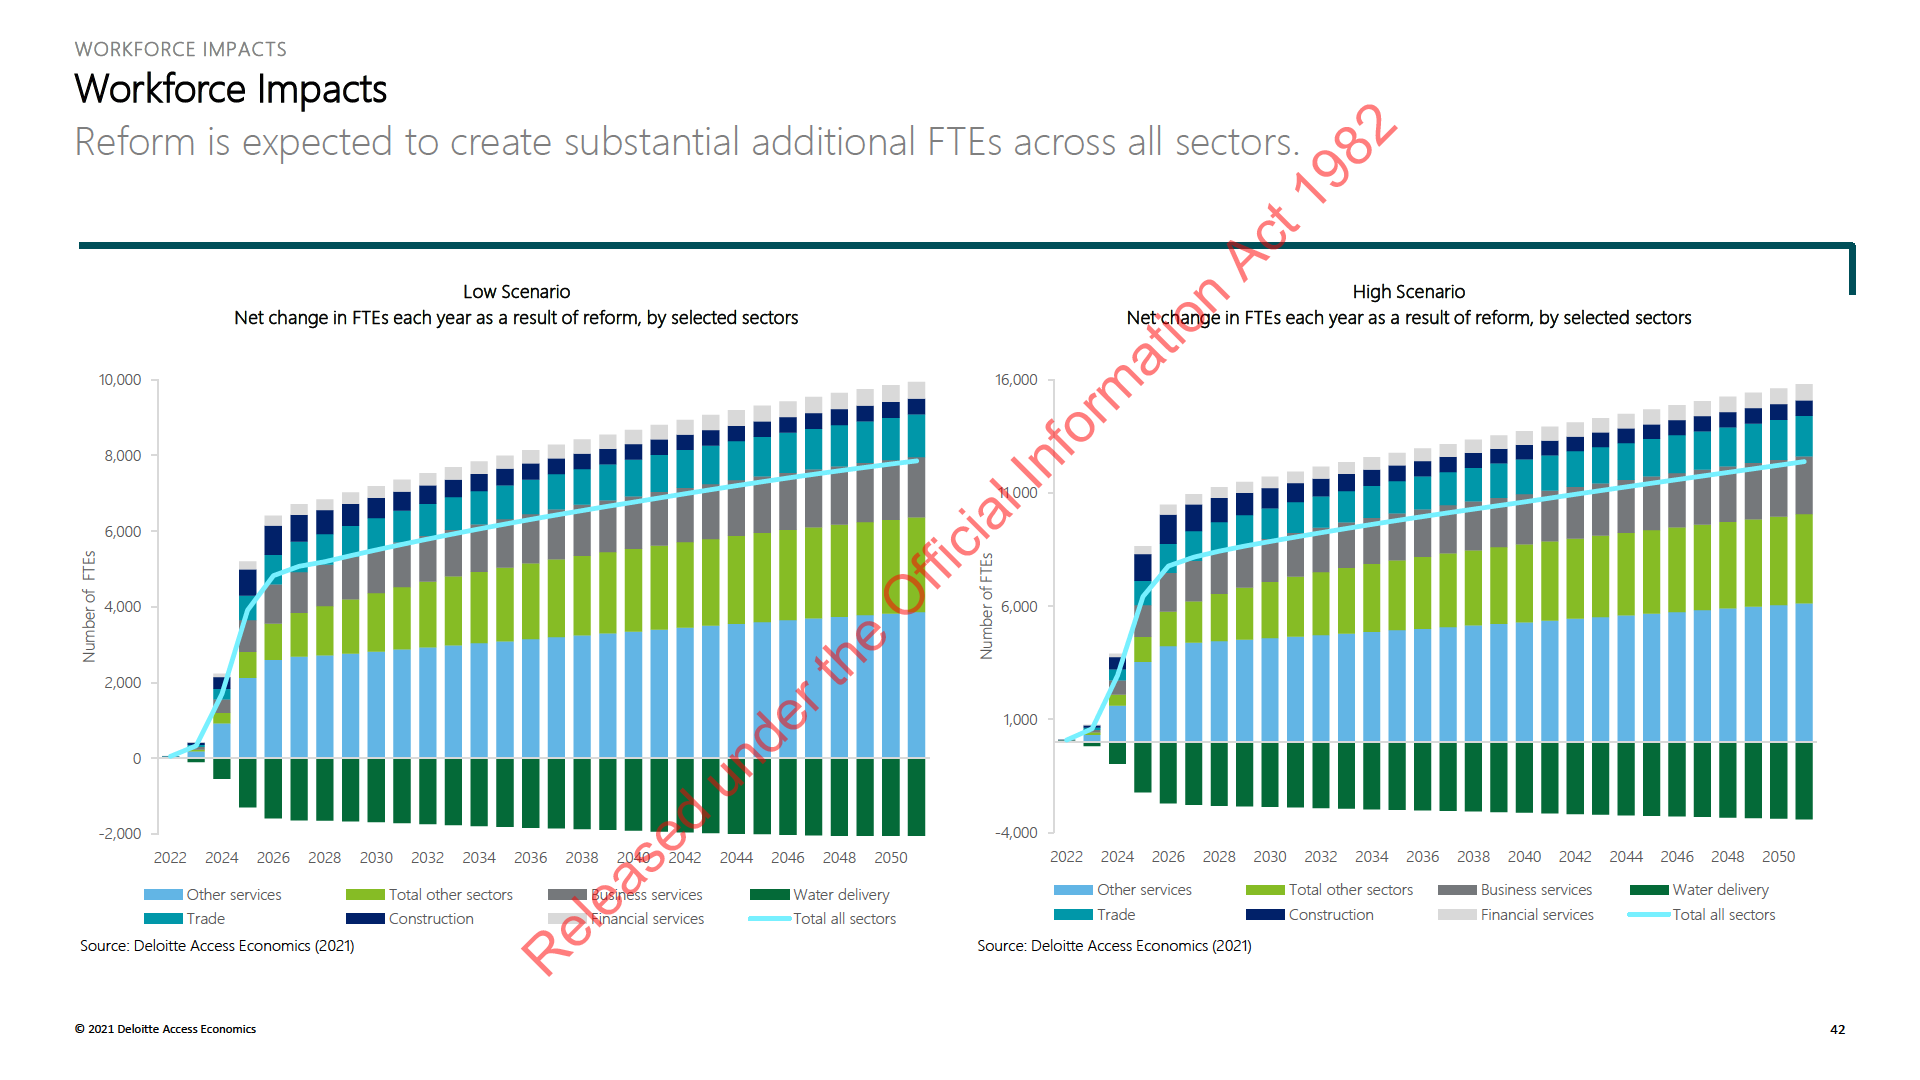
Reform supports economic growth across all sectors.
The impact on sectors is not equally distributed. The impact of the reform across sectors
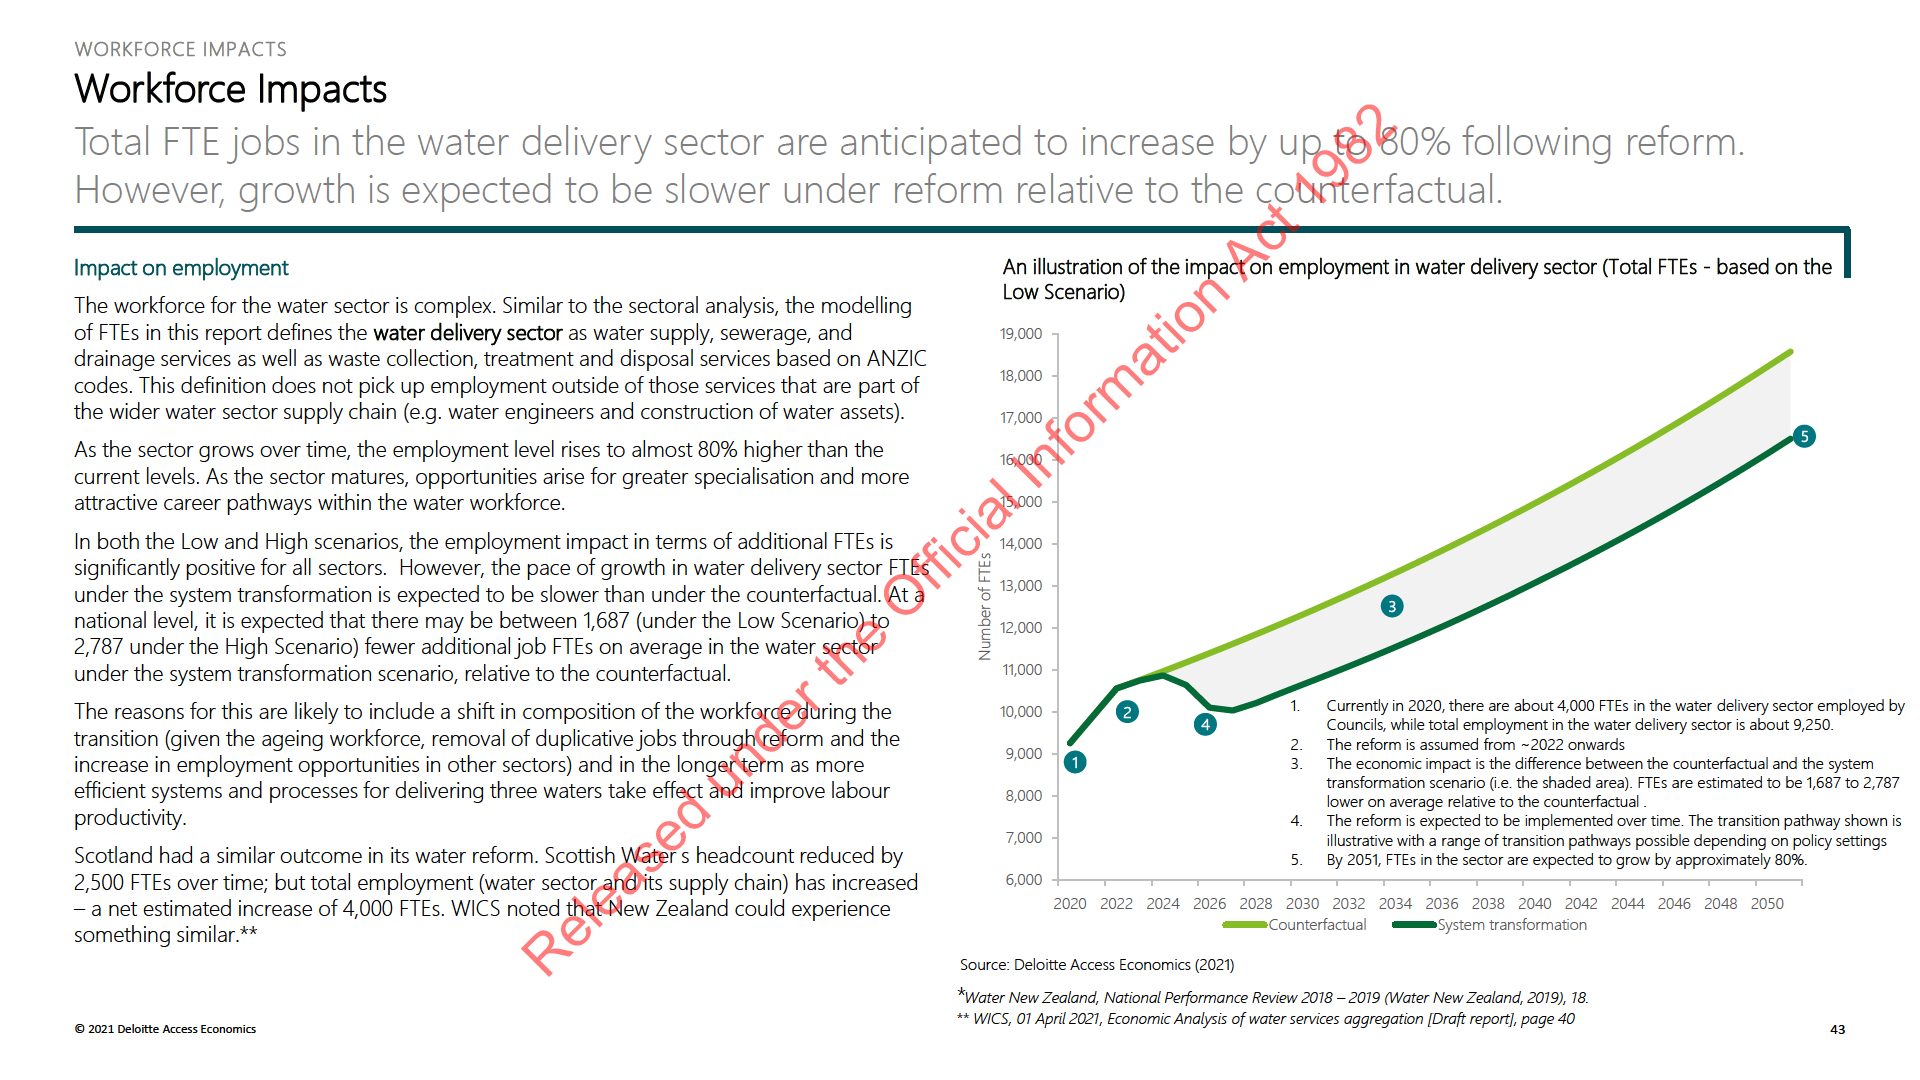
The modelling of sector GDP in this report defines the water delivery sector as water
are illustrated in more detail on the next slide. There is an increase in activity across all
supply, sewerage, and drainage services as well as waste collection, treatment and
sectors, particularly those that are more capital and water intensive. This activity is initially
disposal services based on ANZIC codes. This definition will not pick up economic activity
driven by activity in the water delivery sector associated with reform, and subsequently
in the broader water sector supply chain (e.g. water engineers and construction of water
there are positive flow-on impacts to sectors across New Zealand.
assets).
Under the Low Scenario, Trade ($1.5b) Financial services ($0.7b), Construction ($0.8b),
We recognise the economic activity in the water sector and affected sectors are fluid and
Business Services ($2.5b) and Other Services ($5.1b) are expected to see the largest
it may be difficult to attribute activities to a specific ANZIC code. For example, an engineer
increases in GDP as a result of reform. Growth in GDP in the Business Services sector due
involved in strategy and planning of a water project will be captured under Business
to reform may be associated with greater activity at the Strategy and Planning, and
Services, even though it relates to the water sector. Similarly, construction activity as a
Financing and Procurement, stages of the water industry life cycle. The sector impact
result of the reform will be captured under Construction, even though part of the project
under the High Scenario is also summarised in the table below.
organisation and execution may be conducted by a Professional firm.
The GDP impact on the water delivery sector may start to decline in relative terms versus
The Other Services sector is forecast to see the largest increase in GDP. Other services
the counterfactual from 2038 onwards, as cost savings and efficiencies increase. In today s
includes Public Administration & Defence, Education, Human Health and Social Work
terms, GDP in the water delivery sector still increases by $0.3b between 2022 and 2051.
Activities, and Dwellings (i.e. residential housing). These are large sectors, which all benefit
The step-up in investment increases output in the water delivery sector, via improved
from the GDP and output growth facilitated by reform.
capital efficiency. Any relative decline in water sector GDP is offset by an increase in
intermediate inputs (i.e. how reform benefits all other sectors).
under the Official Information Act 1982
GDP impact relative to the counterfactual between 2022 to 2051, by selected sectors ($b)
Sector
Trade
Financial Services
Construction
Business Services
Other Services
Low Scenario
1.5
0.7
0.8
2.5
5.1
High Scenario
2.4
1.2
1.4
4.1
8.2
Released
Source: Deloitte Access Economics (2021). Note the figures in this table do not add up to the total GDP impact, as this table only presents the sectors with the largest GDP impact as a result of reform.
© 2021 Deloitte Access Economics
37
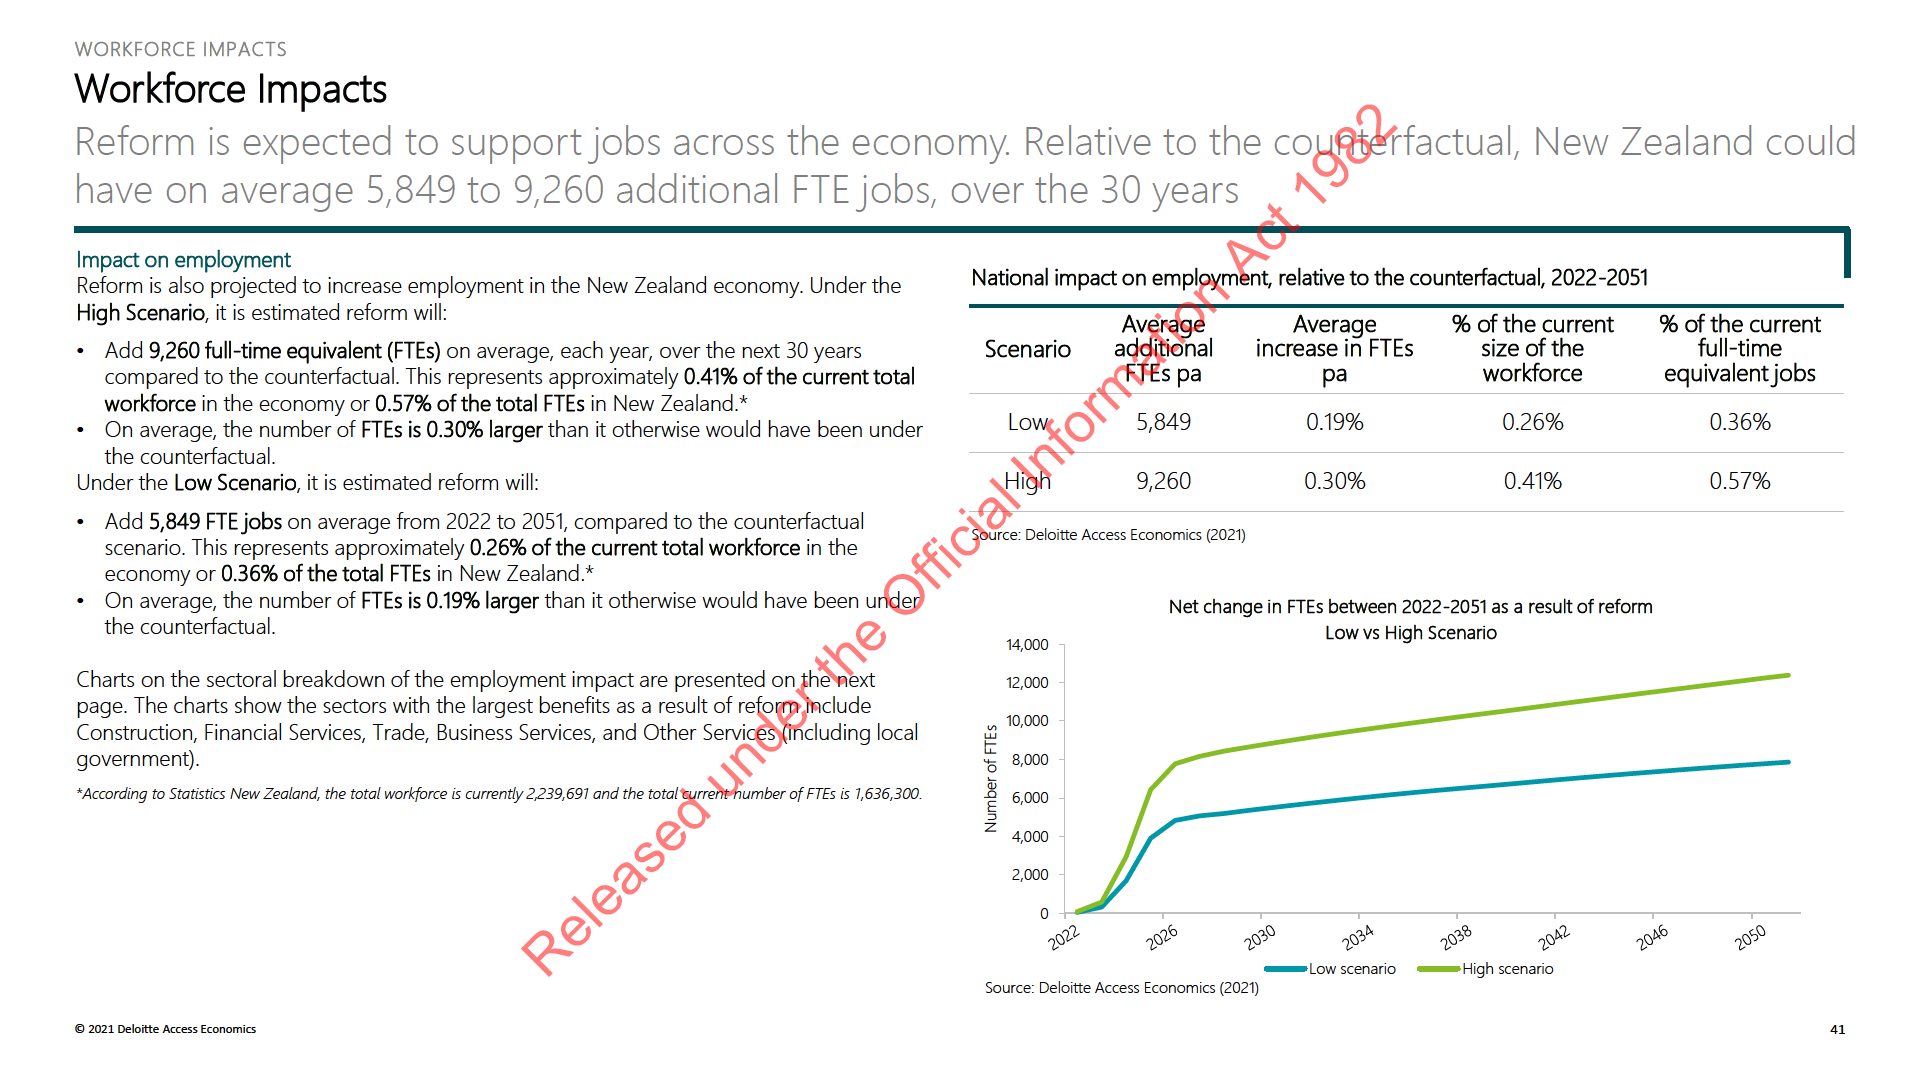
7. Workforce Impacts
under the Official Information Act 1982
Released
© 2021 Deloitte Access Economics
40
8. Distributional Impacts
How is the impact distributed across regions and across
metropolitan, provincial and rural areas?
under the Official Information Act 1982
Released
© 2021 Deloitte Access Economics
45
DISTRIBUTIONAL IMPACTS
Distributional Impacts
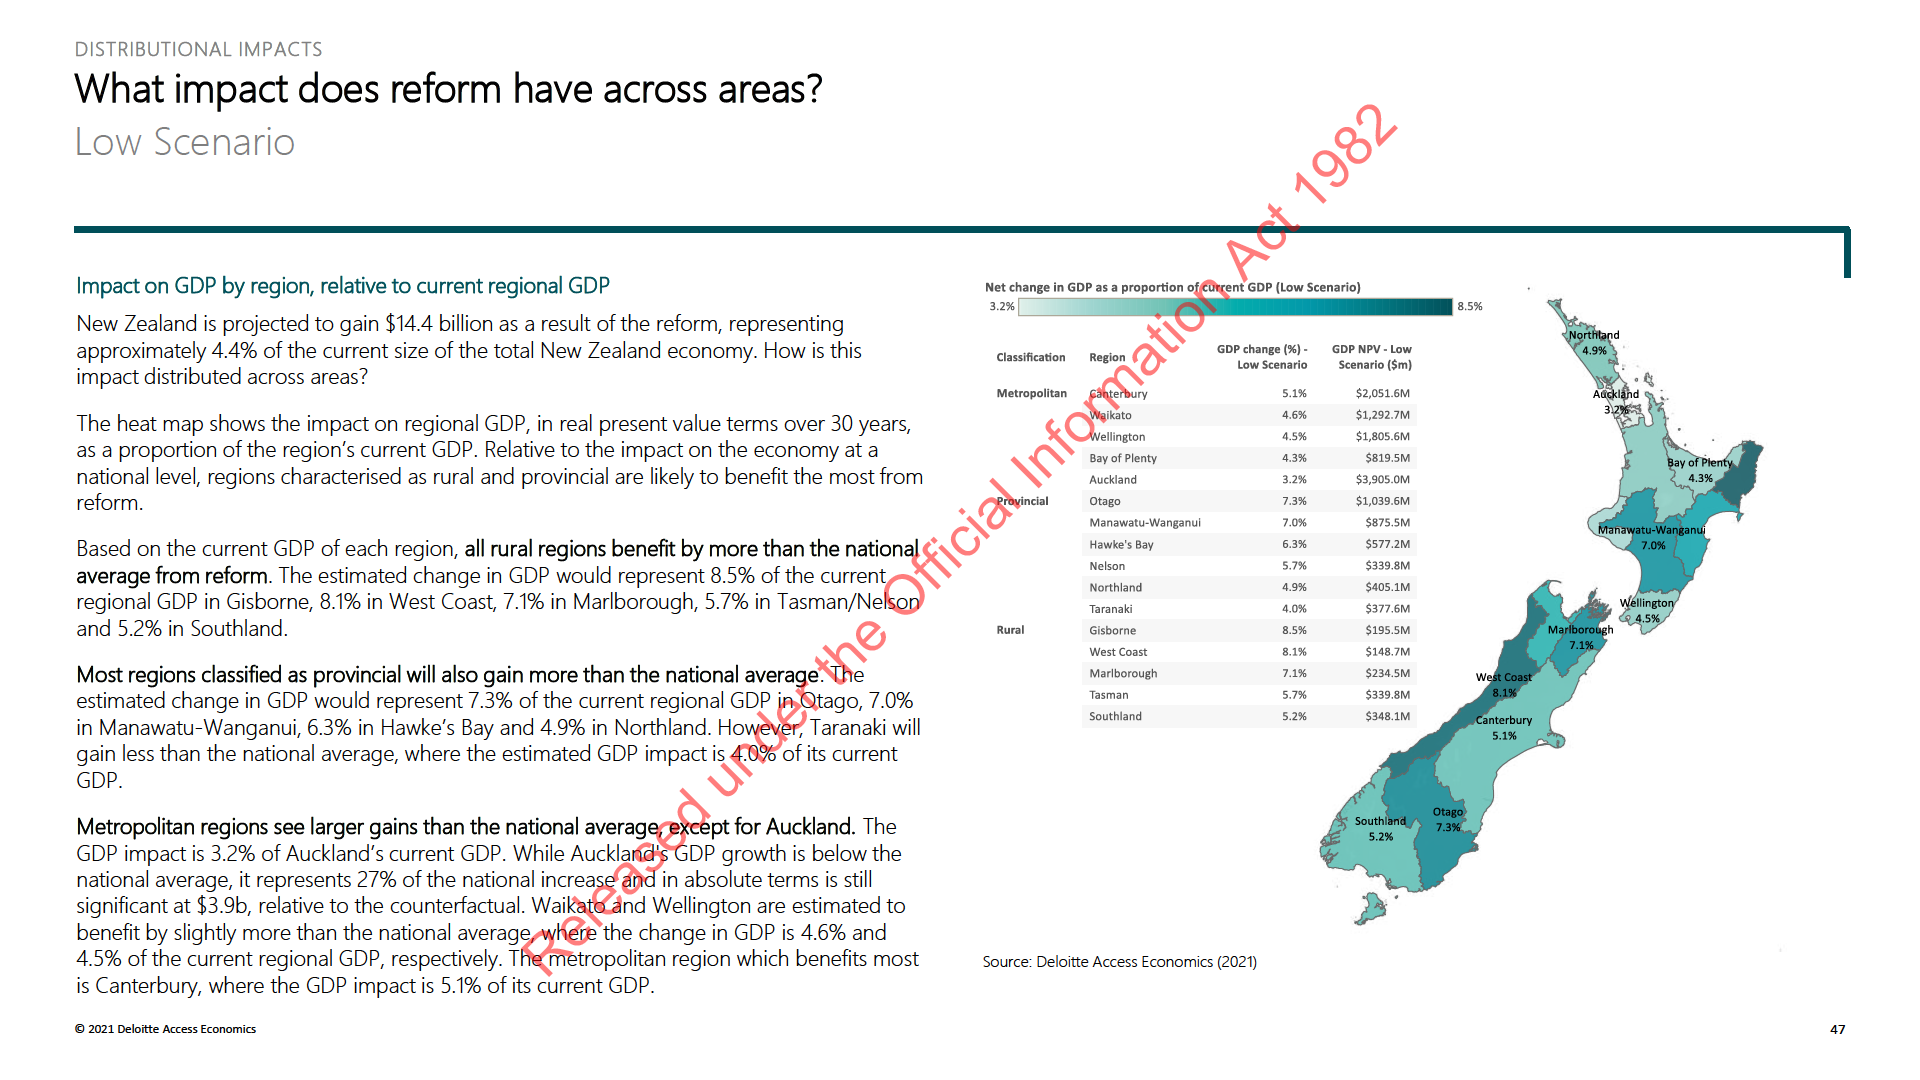
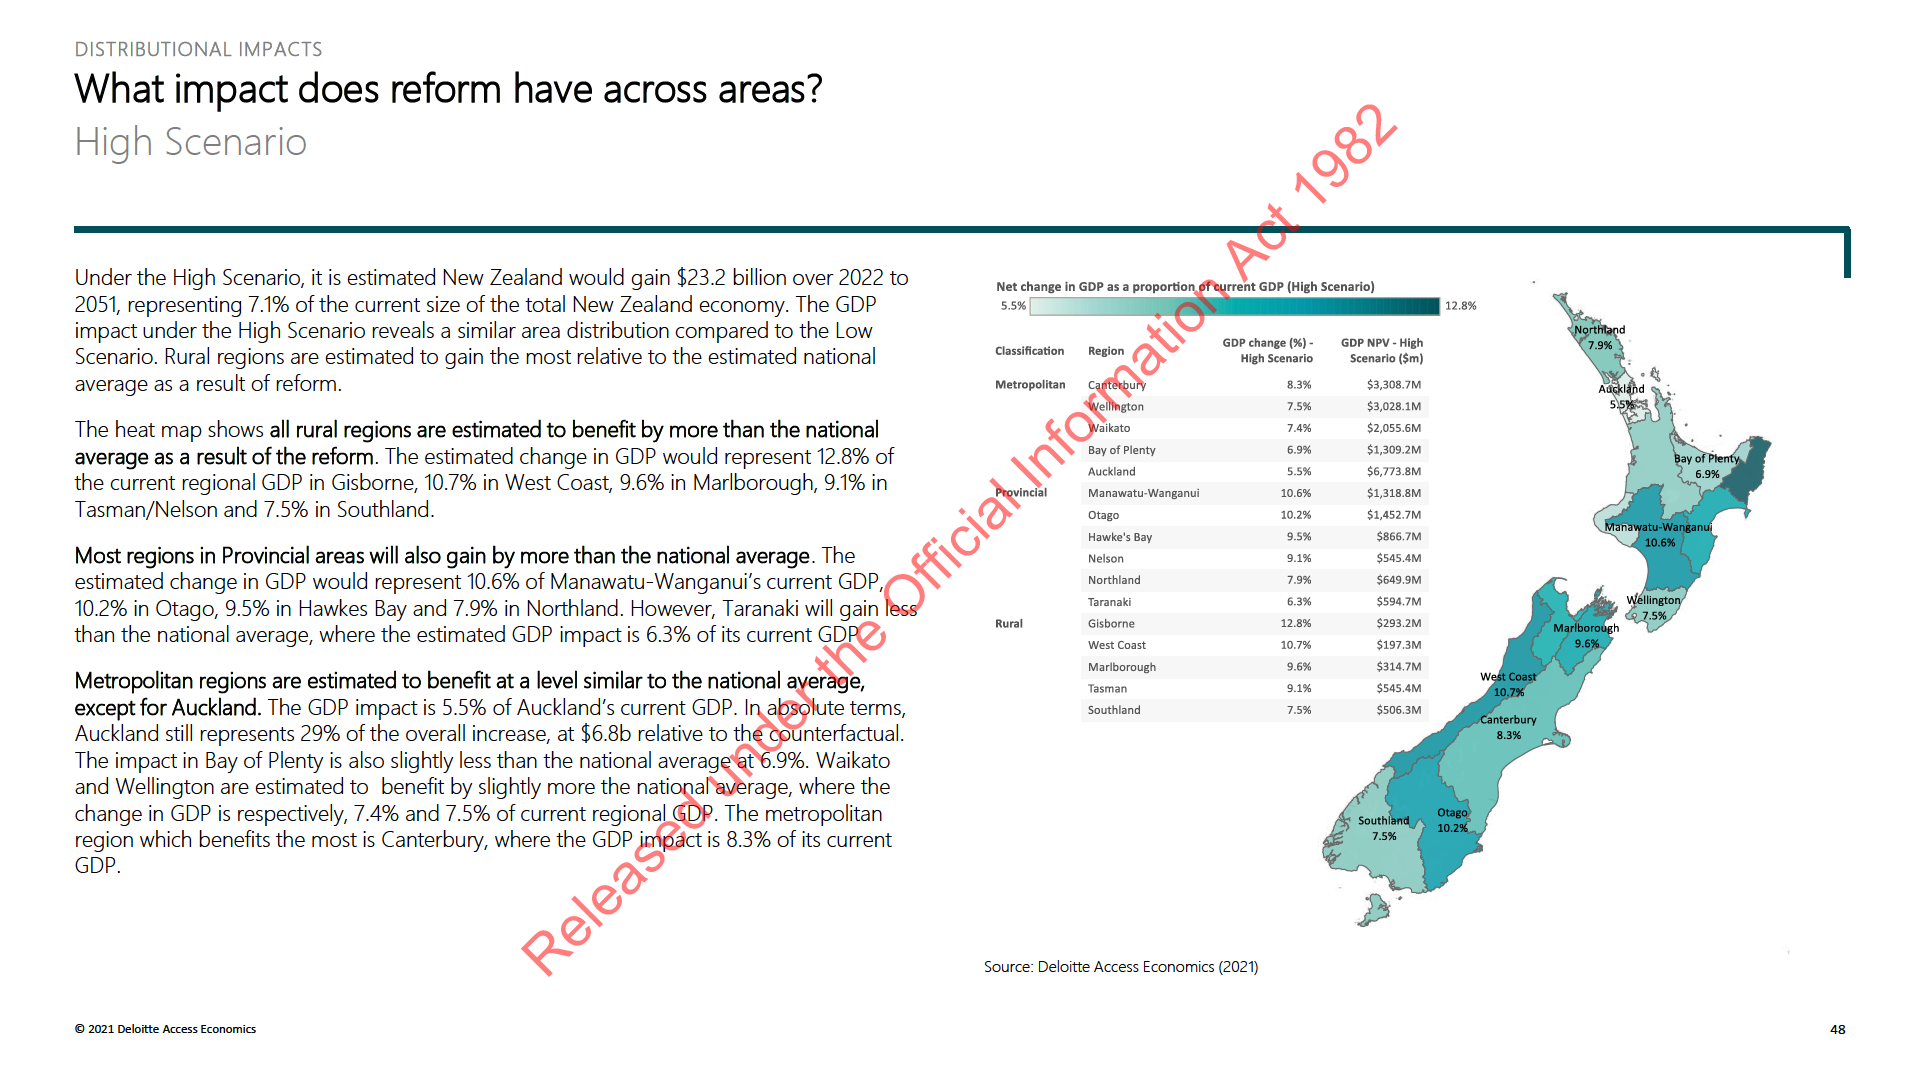
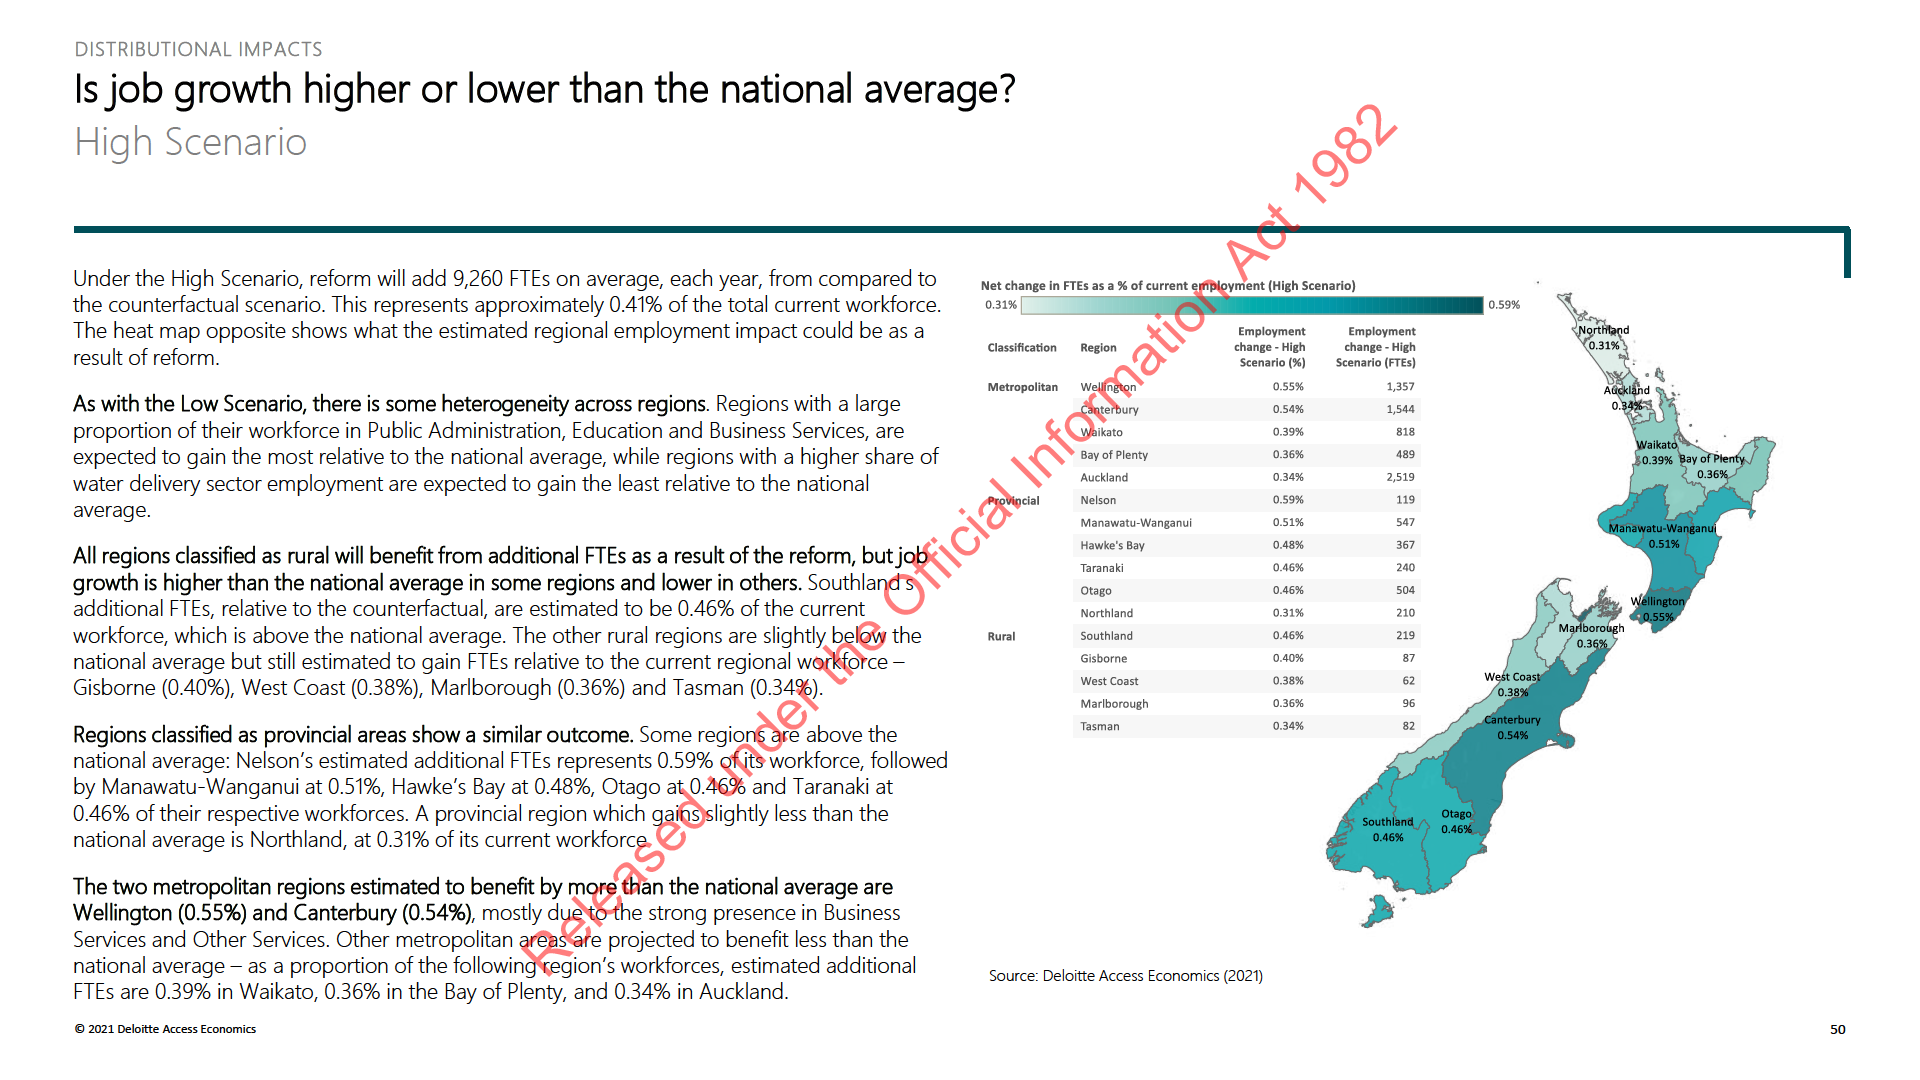
Every region in New Zealand is positively affected by the economic impacts of the reform, but not all
regions are impacted equally.
The previous section of the report explored the national economic impact of the reform –
Regions classified as metropolitan
Regions classified as rural
but that’s only part of the story. Every region is positively affected by the economic impact of
reform, with increases in GDP, production, employment, taxes and average wages are
Auckland
Gisborne
expected. However, not all regions are impacted equally – the magnitude of the increase in
Wellington
Tasman
GDP and employment differs considerably across regions, and when considered in terms of
metropolitan, rural and provincial areas. Rural and provincial areas (per the classifications
Bay of Plenty
Marlborough
opposite, based on population density) have the most to gain from reform, as these areas
Waikato
West Coast
currently face large infrastructure deficits.
Canterbury
Southland
Heterogeneous impacts across regions are the result of differing structures and dynamics of
each region’s economy. Import-oriented regions (that is, inter-regional importing, as well as
Regions classified as provincial
imports from overseas), benefit more than areas which are more exposed to domestic
Northland
demand (spending and production within that area). As a result, smaller, import-oriented
regions such as the West Coast, Gisborne, Marlborough and Southland see larger relative
Hawke's Bay
benefits.
Taranaki
We classified the 16 main regions into metropolitan, provincial and rural areas, based on
Manawatu-Wanganui
population density and regional characteristics to consider local impacts of reform. Opposite
Nelson
is a summary of the classification we used:
Otago
Source: Deloitte Access Economics (2021)
under the Official Information Act 1982
Released
© 2021 Deloitte Access Economics
46

10. Overview of Affected Industries
under the Official Information Act 1982
Released
© 2021 Deloitte Access Economics
51
OVERVIEW OF AFFECTED INDUSTRIES
Introduction & Reform Objectives
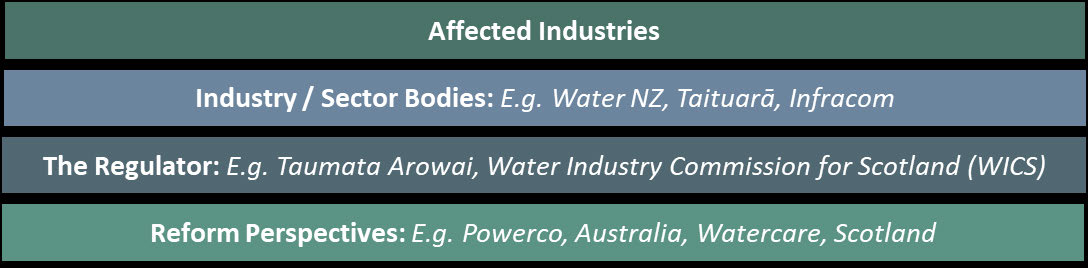
Targeted stakeholder interviews were undertaken to understand the implications of reform on a number
of industries.
We engaged with a cross section of service providers through an interview process. The
• Moving the supply of Three Waters services to a more financially sustainable footing, and
purpose of these interviews was to understand providers’ current role in the sector and
addressing the affordability and capability challenges faced by small suppliers and
how the industry in which they operate (the “Affected Industry”) might evolve under
Councils;
reform. While the information and insight gained through the interview process has been
anonymised, all statements and sentiments reflected in this report can be referenced back to
• Improving transparency about, and accountability for, the delivery and costs of Three
documented interview notes.
Waters services, including the ability to benchmark the performance of service providers;
and
In undertaking the interview process, we have been mindful of the structural proposals and
• Undertaking the reform in a manner that enables local government to further enhance
aim of Government with respect to the reform. This provides critical context for the industry
the way in which it can deliver on its broader “wellbeing mandates” as set out in the Local
engagement process. In particular, the Three Waters reforms are expected to culminate in
Government Act 2002.
the establishment of a small number of WSEs in 2023 and to drive a material step up in
investment in the sector.
By creating a small number of WSEs, the reforms intend to ensure:
The aims of reform expected to have implications for Affected Industries include:
• Entities are of significant scale to deliver benefits from aggregation over the medium to
long-run;
• Significantly improving the safety and quality of drinking water services, and the
environmental performance of drinking water and wastewater systems (which are crucial
• Entities have independent balance sheets to enhance access to capital and alternative
to good public health and wellbeing, and achieving good environmental outcomes);
funding instruments, driven by increased balance sheet strength; and
• Ensuring all New Zealanders have equitable access to affordable Three Waters services;
• Entities are specialist providers with a core focus on delivering drinking and wastewater
services as a priority.
• Improving the coordination of resources, planning, and unlocking strategic opportunities
under the Official Information Act 1982
to consider New Zealand’s infrastructure and environmental needs at a larger scale;
We note that Affected Industries include suppliers to water providers. While they form a
critical part of the supply chain, they are broader than the water sector as defined for the
• Increasing the resilience of Three Waters service provision to both short and long-term
risks and events, particularly climate change and natural hazards;
purposes of our CGE modelling.
Released
© 2021 Deloitte Access Economics
52
OVERVIEW OF AFFECTED INDUSTRIES
Affected Industries Stakeholder Engagement Process
Targeted stakeholder interviews were undertaken to understand the implications of the reform on a
number of different industries.
There was generally a very good level of awareness of the proposed reform and
A schematic of the interview coverage is set out below:
stakeholders were highly engaged. Significant thought had been given by the industry
participants interviewed as to how they would respond and the wider implications for their
industry. Further, there was significant acknowledgement of the role DIA had played in
ensuring a high level of engagement with industry.
A large share of the step-up in investment initiated by the reforms will be capital in nature
i.e. investing in upgrading/enhancing the existing network and in new infrastructure. As such,
this formed a significant part of our focus for the interview process. In line with this, we note
that it is the “shock” created by a material step up in investment that is the focus of our CGE
modelling. The Affected Industries workstream explored how capital programmes are
delivered currently – with reference to the asset lifecycle. We then explored how delivery
In addition to the discussions held with industry participants, we interviewed representatives
might change under a scenario which combines an industry restructure expected to enable
from industry bodies and those with perspectives of the experience in New Zealand both in
clear market signalling of the medium to longer-term investment pipelines, and more
Water and Electricity distribution, and in Water in other jurisdictions. This provided further
sophisticated procurement alongside a significant increase in investment.
evidence/insight as to how the combination of structural and regulatory reform could
enhance the performance of the sector.
The other major area that we focussed on was the labour market impact from reform,
including the capacity constraints, skill shortages and possible solutions to help meet the
We also interviewed the New Zealand regulator (Taumata Arowai) and the Scottish regulator
significant increase in workforce required. Labour represents the key factor input into the
WICS, to understand perspectives on the anticipated process for New Zealand, and the
investment process, so access to a workforce at scale and with the skills necessary to deliver
actual experience in a jurisdiction that had undergone substantive reform.
the investment programme is critical.
under the Official Information Act 1982
Released
© 2021 Deloitte Access Economics
53
OVERVIEW OF AFFECTED INDUSTRIES
Methodology
Targeted stakeholder interviews were validated against case studies, and four criteria: supply chain, labour
market, access to capital, and innovation and productivity.
Targeted stakeholder interviews
Validate against case studies and criteria
Implications and considerations
Targeted stakeholder interviews
Testing and validating stakeholder information
Implications and considerations
Targeted interviews were undertaken to assist with
We tested and validated the information collected
Information from stakeholder interviews was
developing an understanding of the impact of
through stakeholder interviews against local and
synthesised to develop a narrative of the
reform on industries, and potential policy
international case studies, and criteria.
consequences of reform.
implications.
International case studies included water reforms in
The following slides discuss the implications of the
Interview questions were directed at assessing how
Australia and Scotland.
reform on each criteria, and highlight key
stakeholders participate in the sector currently and
Local case studies included the New Zealand
constraints and risks.
how they are responding, or planning to respond,
electricity sector reform, and the experience of
The narrative provided through the interviews has
to the reforms. We also tested perspectives on
Watercare in Auckland.
been developed to complement the economic
potential efficiencies or opportunities that could
impact assessment and highlight consequences for
arise, and challenges or constraints they envisage as
Taumata Arowai provided perspectives as to how it
specific sectors.
a result of the reform.
saw the role would impact investment priorities and,
in particular, drinking and wastewater.
We shared questions with participants in advance of
the interviews to ensure a more informative and
We considered the following criteria for each:
under the Official Information Act 1982
targeted conversation.
• Supply chain
• Labour market
• Access to capital
• Innovation and productivity
Released
© 2021 Deloitte Access Economics
54
11. Industry Structure
under the Official Information Act 1982
Released
© 2021 Deloitte Access Economics
55
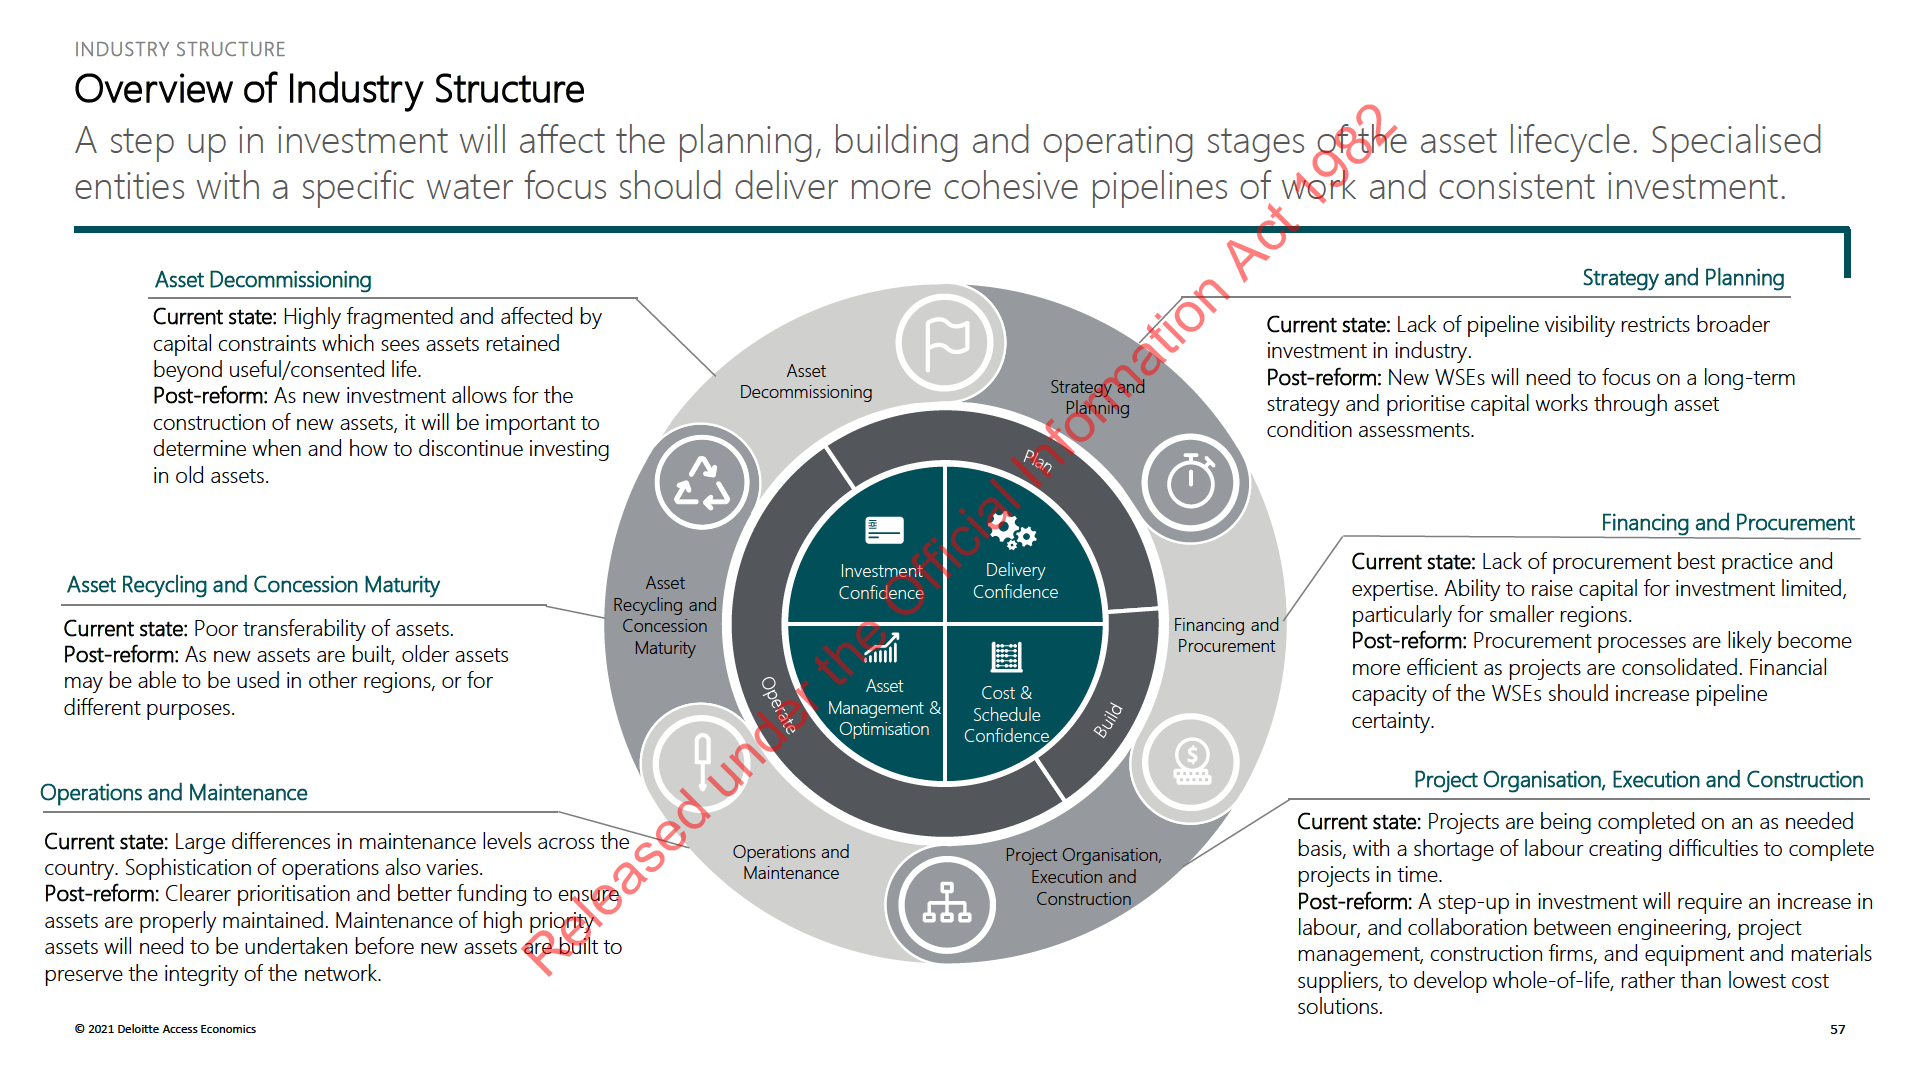
INDUSTRY STRUCTURE
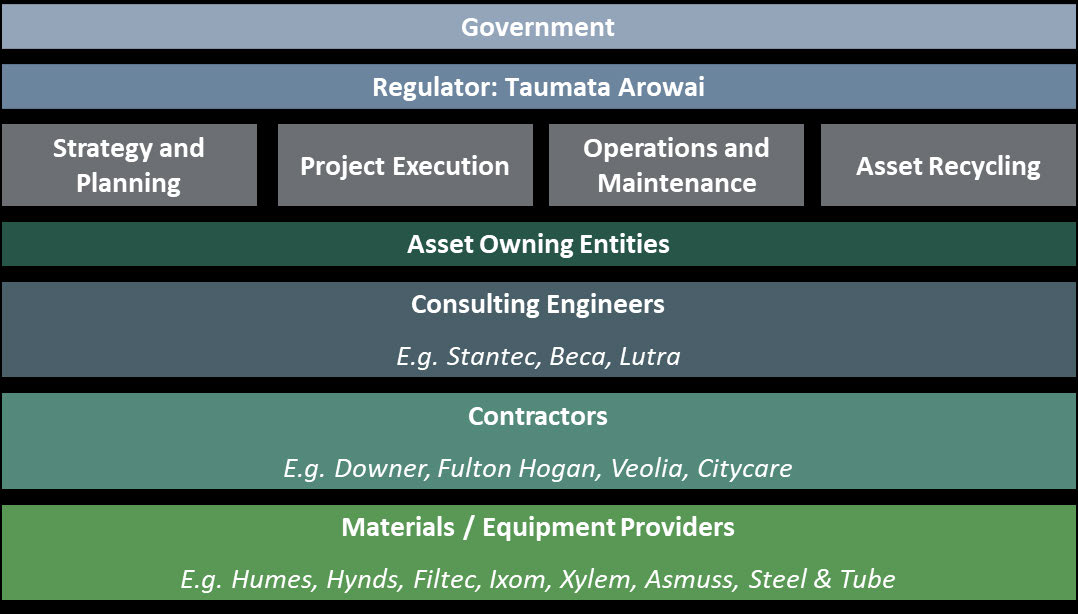
Overview of Post-reform Industry Structure
The water industry is comprised of many different participants, spanning multiple sectors.
Water industry structure
How will things change post-reform?
• Councils who participate in the reforms will no longer control water assets for their
regions. For some, this will mean a significant change in their operating roles and
reduction in workforce, and a risk that valuable water sector capability could be lost
through the transition process. The local and regional impact of this is expected to be
more than offset by the investment in regions by the new entities.
• Engineering firms will scale up the number of employees operating in the water sector,
although there are issues with finding skilled labour (discussed further below). Clearer
pipelines of work should allow these firms to have confidence investing in on-the-ground
capabilities. There is some concern that fewer water entities could see more work overall
but for a reduced number of consultancies. There is also some apprehension about
the transition-period.
• Contracting firms expect to see a bigger workforce and a greater focus on compliance
areas, given the new regulatory environment. Improved procurement processes will
smoothe operations for these firms and allow work to get underway faster. International
firms expect to draw on offshore expertise and technology, but will still need to deploy
large numbers of people on the ground where the assets are.
• Material and equipment providers are already scaling up in some cases in preparation for
under the Official Information Act 1982
reform, but are nervous about the transition process. There will be potential for better
integration of the materials and equipment supply chain into the design process, aligned
with more integrated contracting processes. This is likely to be particularly the case in
relation to the more effective use of specialist equipment – for example the use of
advanced telemetry equipment to detect network issues, and to facilitate the most
efficient use of water.
Released
© 2021 Deloitte Access Economics
56
INDUSTRY STRUCTURE
Overview of Industry Structure
Below is a list of companies and sector bodies we interviewed as part of the engagement process.
#
# Employees
# Employees in
Entity
Profile
Employees
New
Water Services
Globally
Zealand
New Zealand
Asmuss
Specialises in polyethylene and steel piping, fittings and valves.
N/A
230
N/A
Beca
Focused on long-term, sustainable solutions for Three Waters.
N/A
N/A
N/A
Citycare Water
Provider of construction, maintenance and management services across New Zealand.
N/A
1,450
N/A
Downer
Has a presence in the design, build and operation phases for the water sector.
N/A
13,000
450
Filtration Technology
Design advanced engineering systems and cost-effective solutions to water and wastewater problems.
70
60
60
Humes
Deliver smart, sustainable solutions for water by providing innovations in pipe manufacturing.
640
270
245
Ixom New Zealand
Chemical supplier predominately based in Australia and New Zealand.
1,000
300
75
Lutra
Suppliers for containerised treatment plants, and compliance reporting and monitoring tools.
N/A
30
30
Stantec
International professional services firm in the engineering design and consulting industry.
22,000
600
200
Steel and Tube
Providers of steel products.
N/A
1,000
N/A
under the Official Information Act 1982
Taituarā
National membership organisation for Local Government professionals.
N/A
N/A
N/A
Veolia
A mixed business mainly involved in the operation of plants, with a small focus on construction.
179,000
300
N/A
Water New Zealand
The industry body for the Three Waters sector.
N/A
N/A
N/A
Watercare
New Zealand’s largest water supplier.
N/A
984
N/A
Released
Xylem Water Solutions
Technology-based water solutions business providing UV disinfectant and biological water treatment solutions.
15,000
22
22
© 2021 Deloitte Access Economics
58
INDUSTRY STRUCTURE
Overview of Industry Structure
The water industry is comprised of many different participants, spanning multiple sectors.
We have looked to map the participants interviewed to the ANZSIC classifications referred to in our economic modelling. The economic modelling aggregates the following classifications up to
the sector level to determine gains/losses in each sector and region. We note that the activities of some participants – in particular, consulting engineers – will span a range of activities. The
ANZSIC classifications align with those in our CGE model.
Stage of life cycle
ANZSIC classification
# of employees
per classification
Sector level
Players
Strategy and planning
• WaterNZ, Taumata Arowai.
• Professional, Scientific & Technical services
• 189,000
• Professional
services
Watercare, Wellington Water
Financing and
• Local Councils, Watercare,
procurement
• Professional, Scientific & Technical services
• 189,000
• Professional
services
Wellington Water
• Primary Metal and Metal Product Manufacturing
• 4,100
• Machinery and Equipment Manufacturing
• 29,300
• Heavy
Project organisation,
• Veolia, Ixom, Humes, Hynds,
• Water Supply, Sewerage and Drainage Services
• 2,150
manufacturing
execution and construction
Xylem, Filtration Systems, Beca,
• Waste Collection, Treatment and Disposal Services
• 7,100
• Water
Stantec, Lutra
• Construction Services
• 101,600
• Construction
• Heavy and Civil Engineering Construction
• 37,800
Operations and
under the Official Information Act 1982
• Water Supply, Sewerage and Drainage Services
• 2,150
• Water
• Citycare, Fulton Hogan,
maintenance
• Waste Collection, Treatment and Disposal Services
• 7,100
• Electricity
Downer, Stantec
Asset recycling and
• Waste Collection, Treatment and Disposal Services
• 7,100
• Water
concession maturity
• Heavy and Civil Engineering Construction
• 37,800
• Electricity
• Local Councils
Released
Asset decommissioning
• Local Councils, Watercare,
Wellington Water
© 2021 Deloitte Access Economics
59
12. Supply Chain
under the Official Information Act 1982
Released
© 2021 Deloitte Access Economics
60
SUPPLY CHAIN
Supply Chain
The water supply chain comprises a mix of materials, plant and equipment and labour.
Water Sector Supply Chain Breakdown by % of Cost
Project Pipeline typically
involves a mix of:
Labour
Materials
• Simple renewals
Consultants / Managers
Contractors
Materials / Plant / Equipment
• Complex renewals
@ 50%
@ 50%
• Pump stations / Treatment
station upgrades
• Reservoir upgrades
• Major projects
Water Entity / Consultants
Contractors
Materials / Plant /
Percentage
Makeup of workforce
Makeup of workforce
Equipment
of
cost
Graduate Engineer
Construction Manager
Materials
50%
Engineers
Construction Supervisor
Plant and Equipment
50%
Senior Engineers
Technicians
Principal Engineers / Senior /
Advanced Specialists
Heavy Vehicle Drivers
under the Official Information Act 1982
Programme Leads / Project
Skilled Labourers
Managers
Labourers
Project Directors / Senior Project
Managers
Trainee/Apprentices
Released
30% to 40% of FTEs1
60% to 70% of FTEs2
© 2021 Deloitte Access Economics
1 Excludes procurement and wider back office admin and support FTEs.
61
2 It is estimated that @35% to 40% of the workforce wil comprise labourers/skil ed labourers/trainees and apprentices
SUPPLY CHAIN
Supply Chain
Improved visibility of the work pipeline will lead to a scaling up of operations with associated benefits.
There is an expectation that the increased scale and related funding capability of the
• Scale benefits – higher spend across fewer/more standardised requirements;
proposed new WSEs will change supply chain arrangements. We tested with industry
participants the benefits of greater visibility to the pipeline of work, and the extent to which
• Standardisation of parts and materials used to improve purchasing power;
that would drive changes/encourage suppliers to scale up or innovate. We also discussed
• Greater specialisation of procurement services; and
industry structure and the extent to which changes to the sector would encourage new
• The potential for smaller scale operators to be squeezed out as a result of the
entrants/overseas participants with a small footprint currently to scale up. We also canvassed
procurement processes that the WSEs might adopt, reducing diversity in the supply chain.
issues of capacity constraints in the supply chain and the flow-on implications for costs and
efficient planning.
Short-term Covid-19 disruption
As the industry model and procurement practices mature post the transition period, it is
Some participants noted the supply chain disruption caused by Covid-19. These issues
expected the following will occur:
include extended lead times for materials; ports, freight and shipping issues; and increased
prices for materials. While some of disruption is expected to be relatively short term, it has
• Industry consolidation is likely to happen through parts of the supply chain as the new
exposed a vulnerability in the supply chain for certain materials (e.g. it is difficult to get some
WSEs increase the scale at which they procure and move to refine their supply chain
chemicals involved in water purification). This could drive a preference to reduce reliance on
arrangements;
offshore inputs. Consolidation of suppliers post-reform may increase vulnerabilities
• New entrants are likely, particularly major organisations which have a significant presence
where reliance remains on, or shifts to offshore inputs.
in Australia but who are not currently present in New Zealand ;
• The scaling up of local operations by participants with an existing presence in New
Zealand – a number of major industry participants (Suez, Veolia etc) and international
consultancies and service providers, have some footprint in New Zealand currently and all
under the Official Information Act 1982
are well-informed as to the reform programme and the
related implications/opportunities;
• While new/scaled up entities may bring new capability, it is likely scaling up could involve
the acquisition of local entities or capability;
• New business models, particularly between the water entities and service providers;
Released
© 2021 Deloitte Access Economics
62
SUPPLY CHAIN
Supply Chain
Changing procurement processes should help reduce 'lumpy' supply chains.
Opportunity to learn from the past
Contractors don't want to be carrying/funding large stores of materials. However,
There are significant concerns with current government procurement processes in the water
they cannot afford to have parts of their workforce standing idle, because required materials or
sector. The expectation is that current practices will not roll over into the new entities;
equipment is not to hand. The more certainty they have as to the timing and nature of the capital
otherwise gains anticipated from the establishment of the WSEs may be much harder to
programme, the better they are able to coordinate their logistics, and in turn generate cost
achieve.
efficiencies and reduced capital requirements.
Interviewees were not concerned as to the ability of the supply chain to scale up from a materials
Current procurement practices – with the heavy emphasis on cost as opposed to
and equipment perspective. Domestic capacity was not generally identified as an issue. However,
whole of life value – create significant risk. Similarly, the lumpy nature of the work
a concern was raised as to the risk that some aspects of the domestic supply chain depend on a
programme makes it difficult for small to medium size organisations to maintain
limited number of mid-scale providers, and if these entities exited the market there would be no
viability, notwithstanding the fact that some are considered critical to the overall supply
domestic capability to fill the gap. However, lumpiness or uncertainty associated with the project
chain.
pipeline was identified as a more significant issue, and a factor contributing to the potential loss of
mid-sized domestic capability.
As part of the interview process, reference was made to the ability of industry generally to
respond to a material increase in demand. The response to the Christchurch earthquakes
The water industry internationally is relatively homogenous from a materials and equipment
was cited as an example of a step-up in investment of a comparable scale to that envisaged
perspective – there is nothing particularly unique that sets New Zealand's needs apart from that
by the water reform process. In this context, it was noted that given the urgency of the
of other jurisdictions. Further, providers of materials and equipment have sophisticated inventory
response, contractual arrangements/procurement practices were not always optimal.
management and logistics arrangements in place, which should mean an ability to respond
Lessons from this experience that can be applied to water reform, given its planned nature
relatively easily to any step-up in demand.
and longer timeframe.
New Zealand is a small market by international standards. A significant increase in investment in
this market is unlikely to have any major impact on the ability to access materials and equipment,
under the Official Information Act 1982
Increased visibility of pipeline is the key driver of procurement improvements
over and above the more generic challenges the country faces by virtue of its scale and location.
A key expected benefit of reform from a supply chain perspective will be
We note that the supply chain both domestically and globally will continue to evolve. For
improved procurement and pipeline management processes, which the WSEs are expected
example, Veolia is currently seeking to acquire Suez. That transaction, if successful, would create a
to implement. The ability to contract at scale with certainty and over a longer timeframe
global entity comprising circa 250,000 people.
has potential benefits in the form of inventory and working capital management, which in
turn flows through to the efficiency of workforce management and project delivery.
Similarly, as the industry works through near term issues with the transition and immediate capital
Released
priorities, there will be an increased focus on the more consistent adoption of new technologies
and related equipment. This change in demand will flow through to the supply chain.
© 2021 Deloitte Access Economics
63
13. Workforce
under the Official Information Act 1982
Released
© 2021 Deloitte Access Economics
64
WORKFORCE
Workforce characteristics
Reform provides an opportunity to address current workforce issues and to reposition the water sector as
a strong career opportunity – but this will take time and there will be near term challenges
The delivery of water services and the related capital expenditure required to sustain and
Labour and related direct costs – in their various forms – is the largest cost input into capital
expand water infrastructure is labour intensive. The material rise in capital
works by a substantial margin, representing an estimated 50% of total costs currently
expenditure anticipated from reform is expected to have implications for both employment
(excluding the labour content of the materials and equipment component of the supply
and the structure of the labour market.
chain, which is also significant).
As part of our interview process, we explored expectations around employment and the
A typical investment process involves the following four elements: investigation, concept,
need for increased skills development and specialisation. We also discussed expectations and
design, and build
concerns in relation to capacity and capability constraints, productivity concerns, and the
It is only in the “build” phase that materials and equipment are a major input, although these
importance of being able to access offshore talent.
represent a large cost component at that stage.
Workforce
However, even in the build phase, the labour component is still likely to represent roughly
20% to 30% of the total cost, though this will vary significantly depending on the nature of
The water sector workforce is complex, and spans multiple industries and disciplines, each
the asset being created. Renewals and minor capital works – which comprise a large
with their own dynamic. Further, different structures currently apply across local authorities.
component of the immediate investment requirements of the sector are considerably more
In particular, all Councils use a combination of in-sourced and out-sourced provision, but the
labour intensive than major capital projects. As such, a relatively greater proportion of that
nature of those arrangements varies widely.
labour component is delivered on location.
A significant part of local authorities’ workforces and third-party contractors are deployed to
A number of interviewees noted that even with the most efficient and innovative processes
support the sector currently. Estimates of the total workforce employed by Councils in the
the need for a significant workforce on hand is unavoidable. Therefore, any significant step-
sector are in the range of 4,000 – 5,000. The Water New Zealand National Performance
up in investment will also require an increase in the size of a workforce that is already under
Review 2019-20 (the Review) provides the following analysis of the Council workforce
pressure.
under the Official Information Act 1982
dedicated to the provision of water services. Most, but not all, Councils participate in the
The sector is experiencing a workforce shortage, which is likely to be exacerbated given
Review. All the large Councils and specialist council-owned providers such as Watercare and
increasing regulatory pressures and community expectations, that will drive an uplift in
Wellington Water participate.
Council expenditure.
Workforce Participant
Number
The number of qualified staff needed to deliver capital works is already under stress due to a
lack of overseas resources, increasing remuneration expectations and other opportunities in
Full-time employees
2,745
the wider construction sector. The contractor market is currently sized to reflect historic
Contractors
1,196
Released
delivery requirements. The workforce is expected to be squeezed further as spending on
Total
3,941
Three Waters projects, shovel ready infrastructure projects, climate change and RMA reforms
65
Source: Water New Zealand
increase nationally.
WORKFORCE
Workforce composition and substitution
The change in the workforce required to deliver the investment envisaged under the modelled scenarios.
Information as to the composition of the current workforce is limited – complicated by the
One opportunity cited related to the Oil and Gas sector. While this sector has scaled back,
fact that the water sector supply chain comprises multiple industries. We understand there
there are several providers in areas such as Taranaki that have specialist piping skills and
are projects underway that are expected to improve this understanding. This makes it difficult
solutions that would be transferable to the Three Waters sector. However, there is a risk this
to accurately estimate the nature and scale of the expansion in the workforce required to
capability could be lost if the step-up in Three Waters activity doesn't coincide with the
deliver the capital investment programme envisaged by reform, and develop an appropriate
scaling down of activity in traditional areas of focus.
response.
We have attempted to estimate the increase in the workforce required to deliver the
Our Australian colleagues also noted that they have seen some success with shared
projected investment under the core scenarios modelled. This estimate is illustrative only and
services models across similar industries, for example sharing a workforce across electricity or
intended to provide an indication of the scale of change.
fibre providers where sensible.
Based on data and analysis derived from other water sector projects we have calculated a
high level estimate that it takes approximately 800 FTEs to deliver $300 million of capital
Efficiency/substitution
projects. On this basis and assuming an increase in annual investment by @ $1.4 billion to
100%
90%
80%
70%
60%
50%
$2.9 billion – being the estimated annual average difference spend under the system
FTE al ocation by discipline/skill
transformation scenario versus the counterfactual – this could see the need for an additional
2,900 to 5,700 FTEs, on average, each year. This includes the water sector and the wider
Planners / Consultants
30%
1,720
1548
1376
1204
1032
860
water supply chain. This assumes an average annual investment differential of $2.15 billion to
Managers / Contractors 70%
4,013
3612
3211
2809
2408
2007
deliver the capex envisaged, as set out in the table to the right.
Total
5,733
5,160
4,587
4,013
3,440
2,867
It is important to note this is not the potential total increase in FTEs, but rather the difference
under the Official Information Act 1982
between the system transformation and counterfactual scenarios (i e. the average change in
FTEs). Further, this is related to the estimated number of FTEs needed to deliver the
increased investment programme, not to any flow-on employment impacts of reform.
The efficiency/substitution factor included in the table reflects an assumption that a
combination of better workforce practices and substitution – i.e. workers moving to the
sector from adjacent roles will partially offset the expansion in the workforce required.
Released
© 2021 Deloitte Access Economics
66
WORKFORCE
Workforce risks
The increase in the required workforce estimated in the previous slide does not fully reflect the scale of
change that will occur, or the risks that need to be recognised and mitigated, through the transition.
While the skills of the current workforce will be needed, not all current roles will map neatly
There are concerns as to the capacity of the workforce to meet the demand
to those available in the new WSEs or industry. There may be a need for some in the sector
signalled through the current Council LTP process. Further, providers have indicated a
to take up alternative roles and possibly shift locations. This factor, combined with the
wariness about resourcing to meet that demand due to a concern as to the potential for a
relatively older age profile of the Council workforce, creates a significant risk that capability
“boom/bust” cycle of investment, whereby following a burst of spending by Councils there is
could be lost through the transition process. In some regions, it is likely that considerable
something of a hiatus as the new water entities work through their planning and
information on matters such as the location and condition of assets is held through the
prioritisation processes.
institutional knowledge of the existing workforce. There is a risk that knowledge will be lost
through the transition process as the current workforce retires.
The most immediate pressure points are likely to be specialist water consultancy expertise,
which is seen as scarce and “boots on the ground” labour. Several interviewees noted
Further, there are other wider risks to smaller Councils that will need to be managed. For
that migration policies (once borders re-open) could help mitigate skill shortages in the near-
example, some technical and leadership roles are shared positions that cover a range of
term, but 'growing our own' was viewed as preferential. Again, reference was made to
Council activities, rather than just water. A move to WSEs could see that capability lost either
the Christchurch experience and the significant reliance placed on imported labour.
to the WSEs, Councils, or industry. Further, the supply chain that Councils engage with on
water related matters brings innovation and capability that can have wider applicability
across Council operations.
Based on experience in other sectors and jurisdictions it is expected the composition of the
workforce will change. There is likely to be proportionally less employment in the WSEs, due
to a combination of efficiencies that can be expected over time from the consolidation of
under the Official Information Act 1982
management structures, and systems and processes, combined with efficiencies that will be
expected from improvement in the performance of the underlying asset base as this is
replenished/enhanced. On the other hand, it is expected that there would be a step-up, both
proportionately and in absolute terms, through the supply chain in response to the increased
level of investment anticipated.
Released
© 2021 Deloitte Access Economics
67
WORKFORCE
Workforce: Career pathways
Industry participants and sector bodies consider that there is a relatively low awareness of career
opportunities and little in the way of sector driven training and development.
Industry participants and sector bodies consider that there is a relatively low awareness of
Given the feedback from stakeholders around skilled labour shortages, we expect that the
career opportunities and little in the way of sector driven training and development. This
labour profile will be lumpier and less predictable than our core scenarios imply. There are
situation is compounded by the current industry structure and its fragmented approach to
clearly existing challenges in filling roles and meeting current demand in the workforce.
procurement. This restricts the ability to develop the industry standard competencies that
However, we note that access to labour was not identified as a long-term constraint in any of
various organisations such as Water New Zealand and Engineering New Zealand are
the case studies referred to below.
currently working on.
Growth in the labour force is likely to take a number of years (Taituara estimates five to 10
While articulating career opportunities supported by a focus on training pathways could
years given the training pathways involved) to respond to increased demand, and absorb
mitigate some labour supply challenges, there are significant risks in the near term that could
current skill shortages, in order to start seeing a meaningful step-change in employee
dilute the benefit of these initiatives. In particular, as borders open – particularly with
numbers. This means that efficiency gains in the labour market may take some time to be
Australia – there is a risk parts of the trained/skilled workforce may move offshore to better
realised fully.
remunerated opportunities. This situation could be compounded as borders with Australia
Pressure on the water workforce is not just a challenge for New Zealand. There is evidence
have re-opened before those with other countries such as South Africa, the UK and Ireland,
from other jurisdictions such as the US that there are critical staff shortages in the workforce
which have previously been large sources of both skilled and semi-skilled labour.
that provides drinking water and wastewater services – a situation likely to be compounded
“In Victoria the creation of regional water entities created much better
as a relatively older workforce starts to retire. Initiatives are underway to address this issue
career paths for workers in the industry. It enabled them to specialise in
which could be referenced as part of any process for developing a workforce plan for New
Zealand. For example, America's Water Workforce Initiative is a combined initiative involving
the water industry (rather than being a Council employee and having to
the Environmental Protection Agency and other federal agencies working with states, utilities,
do to a bunch of other things) plus it meant that rather than having to
tribes, local government and other stakeholders to address workforce issues.
under the Official Information Act 1982
move from one small Council to another to progress their career (which
Reform provides an opportunity to take a more proactive and longer-term approach to
often meant relocating) career path opportunities within in new (larger)
addressing workforce challenges. A combination of a better articulation of career
organisation became much more available.”
opportunities, the changing nature and increased sophistication of the roles/emerging roles
available and the scale of the investment going in to the water sector creates the prospect of
A further issue is the changing nature of the skills required of the workforce. This is driven in
elevating the status of a career in the water sector. This would see a flow through to the
part by the changing nature of the technologies required to run water utilities – including
ability to attract both domestic and international talent in both the core water sector and the
advanced monitoring and treatment technologies and information management systems.
associated supply chain.
Released
© 2021 Deloitte Access Economics
68
14. Capital Requirements
under the Official Information Act 1982
Released
© 2021 Deloitte Access Economics
69
CAPITAL REQUIREMENTS
Capital Requirements – New water entities
Access to capital is critical for funding the new entities. reforms should make it easier to fund water
infrastructure in New Zealand.
Through the interview process we looked to assess the importance of improved access to
This increased certainty can facilitate the building of the strategic partnering arrangements
capital as a mechanism for driving improved performance in the sector. Topics tested
which characterise sophisticated infrastructure providers – where partners are sufficiently
included the benefits of lower borrowing costs and increased balance sheet capacity, and
invested in the relationship that they are willing to work with WSEs to develop optimised
the impact of this on stakeholders.
solutions.
The interview process validated the premise that there is a critical interplay between funding
Such relationships bring a multiplier effect in terms of the problem-solving ability and
certainty, and the ability to plan and execute at scale over time. That certainty creates the
innovation available to the organisation. This can flow into related contracting and supplier
ability to build the commercial relationships that drive innovation and efficiency.
arrangements, which can be streamlined to facilitate prompt activation.
Funding certainty and scale were seen by industry as being critical to the WSEs’ ability
Infrastructure providers operate in a complex ecosystem that integrates internal and external
to develop strategic procurement practices and related supplier arrangements. Clarity
capability. That external capability includes consultants (engineers, suppliers), contractors
around the level of expected investment, breakdown of spending, and processes for
(construction companies), and service providers (companies providing operations and
allocating work were all raised by stakeholders as key areas.
maintenance and facilities management services). These in turn have their own
ecosystem (sub-contractors, plant and labour-hire etc).
Long-term funding certainty for major infrastructure providers of water infrastructure, such
as Councils currently or WSEs, is pivotal to achieving gains in the sector, and provides a
By way of illustration, we note that contracts awarded by Watercare for the period
range of benefits. The certainty provided enables an entity to take a long-term view of its
February 2020 to July 2020 involved 29 different organisations providing services including
investment programme. This allows it to develop a construction pipeline that can be funded
engineering design, planning and feasibility, specialised equipment and
through the economic cycle.
spares, and construction services. Suppliers ranged from local providers to major
international organisations.
under the Official Information Act 1982
The certainty provided by a long-term pipeline of work enables the ecosystem to
work effectively, and drive innovation and efficiency. Parties can invest with confidence
leading to efficiencies which can be shared.
Released
© 2021 Deloitte Access Economics
70
CAPITAL REQUIREMENTS
Capital Requirements – Service providers and contractors
Access to capital is critical for funding the new entities. reforms should make it easier to fund water
infrastructure in New Zealand.
The contracting and consulting firms we interviewed conveyed that once these areas above
Therefore, the large domestic entities in the supply chain – particularly those with access
were addressed, they did not foresee capital constraints as an issue for them in scaling up in
to public capital markets – and consultancies and contractors that are offshoots of
response to the reforms. The main hurdles discussed were labour supply and certainty of
major regional or international entities are unlikely to face challenges in terms of accessing
water entity investment.
capital. Further, established operators are likely to be able to access capital at competitive
rates. There is a possibility that smaller domestic operators with less access to capital could
The financial capacity of the WSEs should enable the enhanced planning and procurement
be acquired as part of any industry consolidation process.
processes that then flow through to the financial capacity of the Affected Industries. The
ability to contract at scale and over extended time periods with organisations possessing
The more sizeable and certain cash flows associated with the step up in investment in the
suitable financial capacity/creditworthiness will enable industry to scale up and access the
sector (backed by the scale and financial capacity of the WSEs) is likely to put downward
capital necessary to do so.
pressure on the cost of capital across the sector – noting that many of the larger entities that
form part of the supply chain will already have the scale and financial strength necessary to
We note that much of the supply chain is not particularly capital intensive. The real capital
command a competitive cost of capital.
intensity in the sector sits with the WSEs who will own the water infrastructure. Much of the
capital deployed through the supply chain funds working capital. More efficient procurement
Smaller and mid-sized entities with more limited access to capital may be challenged if
processes deployed by the WSEs should mean that the investment in working capital does
aspects of the supply chain start to consolidate. This situation could be exacerbated if
not need to increase in proportion to the greater scale of investment.
lumpiness or uncertainty associated with the forward investment programme through the
transition phase impacts cash flows, and the ability to invest or retain/attract key staff.
Further, to the extent that an increase in funding is needed, the expectation is that this will be
off the back of a secured programme of work underwritten by the credit worthiness of the
The structural changes proposed, combined with the scale of the anticipated investment into
WSEs, and commercial contracts ensuring suppliers do not wear an undue share of project
the sector over a long timeframe, will create an appetite for investment from the financial
risk or the cost of financing major works programmes (i.e. milestone payments based on
services sector. We would expect that private equity, sovereign wealth funds and other
under the Official Information Act 1982
progress will support cash flows).
international investors would welcome the additional ability to invest in New Zealand
infrastructure and are aware of parties who are already at an early stage of investigating that
opportunity.
Released
© 2021 Deloitte Access Economics
71
15. Innovation and Productivity
under the Official Information Act 1982
Released
© 2021 Deloitte Access Economics
72
INNOVATION AND PRODUCTIVITY
Innovation and Productivity
Significant productivity gains are achievable but come with risk.
Evidence in other jurisdictions indicates significant productivity gains are achievable over
• Increased use of intelligent componentry to reduce cost/improve performance;
time with changed industry structure, and other parallel developments such as an enhanced
regulatory regime. We tested with participants whether they saw reform driving increased
• Reduction in overheads and administration costs as duplication is removed, economies of
research and development of new technology, or the wider development of current
scale achieved, single IT systems can replicate multiple ones.
technology.
• A better appreciation of/willingness to use international best practice/assets rather than a
“do it yourself” approach;
We also tested whether the reform process would likely enhance international partnerships
and connections, and in that context, whether the small scale of the New Zealand industry
• The ability to attract specialist global capability. Watercare has done this with its Central
would be an inhibitor.
interceptor project through its engagement of the Ghella-Abergeldie Harker joint venture
(following a tender process in which three of the four short-listed parties were
There is considerable evidence from both the New Zealand and international experience that
international consortium reflecting the benefit of scale);
significant productivity gains are achievable in a sector with the right settings. In particular,
• The ability to outsource work. It is important to note that Councils have already
the combination of scale and financial certainty allows organisations to take a strategic
outsourced a very significant amount of activity to the private sector. Gains have been
approach to procurement which can result in a range of outcomes that drive both
achieved through this process, but those gains have been diluted by a lack of scale and
productivity improvement and innovation.
current procurement practices;
Opportunities for productivity gains include:
• The ability to construct provider panels that are prepared to invest in capability, bring
innovation and offer cost efficiencies off the back of long-run, confirmed, and large-scale
• An immediate gain in developing an improved understanding of the asset base and its
condition, which should inform better planning processes, and ensure the right
work programmes;
investment decisions are being made and wasteful spending reduced;
• The ability to build high calibre, internal capability in areas such as strategic planning and
under the Official Information Act 1982
procurement; asset management; and contract and treasury management;
• Making efficient investment decisions – for example, settling on the most efficient regional
or cross regional waste-water plant networks;
• A strongly held view that the combination of scale, financial capacity and long-term
planning will drive efficiency and contribute to a significant upskilling of the workforce.
• The ability to move away from current Council procurement practices which are seen as
being fragmented, risk averse and too focussed on pr ce as opposed to whole of life
Several stakeholders provided examples where such gains have been previously achieved;
value in the tender evaluation process;
and
• Increased standardisation of componentry, which drives cost efficiency, specialisation and
• Efficiency can be achieved when capital spend is aggregated into a programme of work
Released
inventory management benefits;
that has the necessary scale to allow providers the flexibility to sequence delivery in the
way that best deploys their capability, provided objectives are met.
© 2021 Deloitte Access Economics
73
INNOVATION AND PRODUCTIVITY
Innovation and Productivity
Significant productivity gains are achievable but come with risk.
There is already a significant representation of major regional and global specialist water
• Productivity gains will take time to accrue. It will only be after WSEs are through the early
service providers in New Zealand. These providers draw on their global capability when
transition phase and have aggregated, interrogated and enhanced key asset information
serving the New Zealand market including specialist knowhow, and R&D capability. However,
that the longer-term planning processes key to driving a improvement in sector
the ability to fully deploy that capability is affected by the challenges of scale, procurement
performance will begin to emerge. Further, the WSEs will all inherit a myriad of
practices and certainty of opportunity referenced above.
commitments and contractual arrangements that will limit their freedom of operation in
Despite the optimism around potential productivity gains, parties interviewed did express
the near-to-medium-term.
some concerns including:
• There were mixed views expressed around the gains available in the water sector from
advancements in technology enabled asset management practices. There was a good
• Not all of the gains evidenced in other jurisdictions will be as readily achievable/deliver
gains to the same scale in New Zealand given the country’s relative isolation from major
level of awareness of the potential impact that, for example, the advance of digital
centres of capability;
technologies can make in the utilities sector more generally, with some of these
technologies being adopted in the water sector. For example Scottish Water references
• While significant benefits ought to be achievable as a result of the consolidation of the
success it has achieved in terms of customer service by integrating the capability offered
sector into a limited number of specialised entities, gains could be lost if there is not a
by social media, mobile, data analytics and cloud computing.
high degree of collaboration between the entities, particularly in relation to cross-
boundary investment decisions; sharing of resource and intellectual property;
• Some survey participants questioned whether access to new technologies/capabilities
standardisation (plant, equipment, asset definition/management); and workforce
would have a material impact in the near-to-medium-term – in particular given the start
development;
point for WSEs in terms of asset information and quality, and the likely near-to-medium-
term investment priorities.
• The risk that WSEs will place an early emphasis on the development of back-office
systems and processes rather than adopting a “lift and shift” approach, using the best of
under the Official Information Act 1982
what is currently available at least as an interim step;
• The risk that workflow for the industry slows through the transition period and struggles
to get hit the ground running due to a lack of interim work; and
Released
© 2021 Deloitte Access Economics
74
16. Transition, Risks and Challenges
under the Official Information Act 1982
Released
© 2021 Deloitte Access Economics
75
TRANSITION, RISKS AND CHALLENGES
Constraints and Risks
Constraints and risks may hinder the realisation of efficiencies.
There are currently significant constraints in the system that will need to be addressed if
The parties interviewed included a number who have been associated with major sector
industry is to be able to deliver the capacity, innovation and productivity gains anticipated
reform in New Zealand and overseas.
through reform. These include:
One of the main risks that stakeholders foresee is around the transition process. In
• A coherent approach to workforce development including alignment between key
particular:
government agencies (e.g. immigration, education sector), the water entities and
industry/industry representative bodies;
• There is a relatively older workforce with significant institutional capability that is critical to
the delivery of services currently. A disruptive sector transformation creates the risk of a
• The financial capacity to fund long-term investment programmes – including the ability to
loss of capability needed for the ongoing operation of water networks in the near-to-
access appropriate capital markets;
medium-term;
• Freedom to instigate and develop the skills necessary to execute a strategic approach to
• New entities taking a disparate approach to the establishment process which sees wasted
procurement;
effort and resources;
• The ability to access the calibre of governance and executive leadership able to set up
• The need to avoid the situation that (as happened in some cases in Victoria) Councils
and then run large, complex organisations with a challenging mandate;
took the opportunity to transfer ageing or lower performing staff to the newly created
water business, and retained higher performing staff.
• The ability to unwind existing contractual and other arrangements that, if these were to
endure, could impose a significant handbrake on the ability to progress the new sector
• New entities taking a competitive, rather than collaborative, approach resulting in
model; and
duplication of effort and potentially raising prices;
under the Official Information Act 1982
• Most of the embedded asset base/networks will not represent an optimal configuration
• Concern around the potential for an investment hiatus through any transition process
from a systems performance perspective, so it will only be as the network is
and disruption to current relationships (e.g. current panel arrangements), with suppliers
replaced/upgraded progressively over time that the full extent of potential gains can be
nervous about overinvesting in capacity given that uncertainty; and
captured.
• One of the additional risks raised was that some Councils may choose not to participate
which will dilute the impact of efficiency gains that the reforms are trying to achieve.
Released
© 2021 Deloitte Access Economics
76
TRANSITION, RISKS AND CHALLENGES
Transition Period
Care and planning needed to manage the transition impact on industry
Many of the stakeholders we interviewed expressed concern about the transition period over
Possible mitigating actions:
the next couple of years.
• Regulation requirements around water safety standards may force Councils to invest
Key issues:
in the interim. Several stakeholders mentioned the positive impact from Government
investment post-Covid. Additional grants could help support the industry through
• A possible reluctance by Councils to spend money on assets that they then are going
the transition.
to hand over in a couple of years anyway, creating a high risk of deferred maintenance in
the meantime.
• Mandate for action for new entities and structuring organisations to enable them to
get up to speed quickly. Handover processes need to be thought through carefully
• Increased uncertainty of work pipeline for contractors and suppliers.
to ensure a smooth transition.
• Concern that transition period will drag on for up to five years as entities are slow to
• Signalling of the expected pipeline of work so firms can invest in current talent and
establish and then new leadership needs to 'find their feet'. This could mean a lack of
keep people on the ground. May need to look at importing labour once borders
material investment for a longer time.
open to offset any 'brain-drain'. Could see wage pressure in the sector in response
to skill shortages.
• Risk of borders fully re-opening in the near-term and workforce heading overseas,
exacerbating labour shortages.
• The mandate, resourcing and associated powers of any transitional agency will be
important – particularly in relation to the design and execution of any industry
transformation plan including workforce strategy (with its likely key focus on
managing workforce risk).
under the Official Information Act 1982
Released
© 2021 Deloitte Access Economics
77
TRANSITION, RISKS AND CHALLENGES
Current Challenges and Impact of reform
Engineers, suppliers, local Councils, and service deliverers will all be affected by the reform.
The table below summarises issues associated with the sector currently by industry segment and the likely response as structural reforms are implemented and investment steps up.
Industry segment
Current challenges
Impact of step up in investment
Peak bodies e.g. Water New Zealand
• Large numbers of job vacancies
• Increased number of job vacancies
• Lack of new entrants to the sector
• Smaller players may be crowded out
Local Councils
• Uncertainty around long-term pipeline
• Will be a sense or urgency to get projects underway
• Inability to determine priority assets
• Scaled-up projects
• Ability to grow engineering firms to plan for the increased capability
• Unsure whether to up-resource given the reform may result
need
Consulting engineers
in a hiatus
• Potential for a hiatus while the new entities establish themselves
• Lack of local expertise (currently recruiting from South Africa
and the UK)
• Competition for existing capability rather than a focus on adding
capability
• Increase in supplies required
• Import supply chain not operating well due to COVID
Material suppliers
disruption
• Requirement for supply changes to facilitate upgrades to meet new
standards
• Convincing Councils to invest in maintenance now
• Greater involvement in planning/design
• Councils do not understand the extent of technologies
under the Official Information Act 1982
• More consistent adoption of new technology
Equipment suppliers
available
• Better pipeline visibility facilitates better supply chain management
• Councils are worried about relinquishing control over assets
if technology makes some functions automatic
• Greater involvement in planning/design
• Implementation of new technology requires higher skilled
• Increased pressure to comply with new regulations which is going to
Service delivery
workers
require the industry to upskill workers
• Local faults are always going to require local workers on the
• Significant step up in workforce required – competition for existing
Released
ground
workforce
© 2021 Deloitte Access Economics
78
TRANSITION, RISKS AND CHALLENGES
Current Challenges and Impact of reform
Engineers, suppliers, local Councils, and service deliverers will all be affected by the reform.
The table below summarises mitigations the sector can take to reduce the risk of issues arising as investment expands.
Industry segment
Mitigation
Peak bodies e.g. Water New Zealand
• Raise awareness of roles available for school leavers
• Roll out national competency framework
Local Councils
• Prioritise asset condition assessments
• Provide long term contracts to increase future certainty
Consulting engineers
• Roll similar projects into one procurement process to allow contractors to plan their pipeline
• Give adequate time to the new entities to focus on understanding the legislation and educating the sector
Material suppliers
• Begin conversations about reform with Councils early
under the Official Information Act 1982
• Education will be key – Councils and businesses need to understand that technology is able to be adapted to suit different needs. Primary
Equipment suppliers
focus should not be on original innovation, but rather on adapting what is already available.
• Equipment suppliers should have input into the planning process.
Service delivery
• Increase training for current employees
Released
© 2021 Deloitte Access Economics
79
17. Case Studies
under the Official Information Act 1982
Released
© 2021 Deloitte Access Economics
80
CASE STUDIES
Case Studies
Local case studies include Powerco
PowerCo
Key takeaways
History
For 20 years, the electricity sector has been warned of a shortage of skilled workers, yet
Over the past two decades, New Zealand’s electricity industry has undergone considerable
labour supply has never been a real issue. This is in part due to the proportion of the
structural change as the Government has worked to promote competition, reliability and fair
workforce who are in ‘swing roles’ and have skills non-specific to a single sector, and partly
prices for consumers. In 1985, the distribution and supply of electricity were the responsibility
because it has proved possible to adjust the workforce for jobs that do not require the same
of 61 electricity supply authorities comprising 21 local government-controlled Municipal
level of expertise.
Electricity Departments, 38 local Electric Power Boards and two government owned
A key takeaway is the need to balance stringent regulation with a level of freedom to allow
authorities. The Electricity Industry reform Act of 1998 consolidated these entities into 29 line
the sector to evolve. The includes the ability to develop procurement practices that work for
distribution companies, with PowerCo as the market leader.
the entity and the supply chain, with fair allocation of risk between the entity and supplier
Efficiencies
being key.
The sector has realised significant efficiencies since reform. Amalgamation has allowed new
There are challenging trade-offs between the costs/benefits of extracting, transferring and
entities with bigger balance sheets to access debt markets more easily. A number of
loading of asset management data from legacy entities and systems into new Enterprise
synergies have reduced costs, including the ability to consolidate separate back office
Resource Planning or Enterprise Asset Management systems. While the data from legacy
systems into one system, and the ability to standardise the supply chain to allow for better
systems was useful to provide a very basic connection/trace to asset data – overall the asset
scheduling. The interplay between the regulator and the entity is a critical element in
data was of limited value. It is arguable that there would have been better value (both in
determining appropriate capital investment plans.
terms of the quality of the data and the compared to the cost of extracting/transferring and
loading of legacy data) to recollect all the data from by new field inspections creating a
In addition to savings from better scheduling of the programme there were significant field
clean, fit for purpose set of base data.
work savings from being able to go to market with a large package / volume of work. For
under the Official Information Act 1982
example, such an approach has resulted in significant reductions in the prices offered for
opex maintenance activities.
Released
© 2021 Deloitte Access Economics
81
CASE STUDIES
Case Studies
Local case studies include Watercare
Watercare
Key takeaways
History
There are instances where a collaborative, cross-regional boundary approach to investment
During the Auckland water industry amalgamation in 2010, Watercare was confirmed as
could see different capital decisions made with net gains through a lower total capital cost
the organisation to manage the drinking water, wastewater and water infrastructure for
and a better technical solution.
Auckland. Auckland Council was given responsibility for the public stormwater network
Watercare has also learned that an increase in the scale of projects attracts international
and water quality. The goal of amalgamation was to combine the water service functions
interest such as the three international consortia that tendered for the Central Interceptor
from eight different Councils to provide a better service to customers, achieve efficiency
Project.
gains through economies of scale and enable integrated regional planning.
A Case Study undertaken by Watercare in relation to community outcomes achieved since
Efficiencies
amalgamation for the Rodney and Franklin districts identified significant gains from
Watercare has achieved significant ongoing savings for customers through scale and
economic/investment, value for money and health perspectives. Economic gains included
increased capability. The combined entity has enabled Watercare to plan more effectively
significant capital investment/upgrading programmes, increased training, and job
for the long term and simplify the procurement process through 10-year partnerships with
opportunities/job creation. Value for money gains included reduced volumetric charges, a
key suppliers. Spending ‘development capital’ to train multiple groups at a time can also
move to equitable/region wide water pricing and a lower cost to serve. Health gains include
bring efficiencies e.g. having a central maintenance team set up mock street to train field
significant improvements in drinking water quality and improved monitoring/water testing.
crews.
Watercare has invested heavily in the back-office systems and processes necessary to
operate at scale and develop the information and capability to develop asset management
and related investment plans.
under the Official Information Act 1982
Released
© 2021 Deloitte Access Economics
82
CASE STUDIES
Case Studies
International case studies include Tasmania and Victoria, Australia.
Tasmania, Australia
Victoria, Australia
History
History
Australia’s water reform commenced in the 1980s, and has varied state-by-state. In Tasmania
Historically, there were ~300 water authorities in Victoria. Consolidation took place in the
prior to 2008, water and sewage infrastructure was owned by 29 local Councils and three
mid-1990s, and eventually a single bulk provider, Melbourne Water, was established to
bulk water authorities. In 2008, a new Act transferred all council-owned water and sewage
provide services to the greater Melbourne region. Three metropolitan providers sit below
assets to three new entities, which consolidated to become one entity, TasWater, in 2013.
Melbourne Water as water retailers for Melbourne. 13 regional water corporations provide
TasWater is owned collectively by Tasmania’s 29 local governments.
urban water services outside Melbourne and four rural water service corporations provide
Efficiencies
rural water services.
Tasmania is the one state in Australia where a formal review of the water reform has been
Efficiencies
undertaken. In the Auditor-General’s review of water industry reform in 2017, it was
When the new Melbourne structure was first established, the city saw large initial gains.
determined that the reform had improved public health benefits, but not environmental
These were primarily through contracting out maintenance and operations to the private
benefits. This was due to the regulated entities’ focus on improving water quality over
sector, as opposed to a local council-based workforce. As the cost of administering large
wastewater compliance and performance.
contracts increased, the size of the gains dissipated, but efficiencies were still realised.
In terms of financial performance, the consolidation has achieved the expected benefits.
Regional Victorian water businesses first realised benefits through the consolidation of back-
Tasmania introduced a two-part pricing model, resulting in appropriate water charging for
office functions. There was a focus on standardising systems in the first year of
customers. The revenue TasWater receives has also increased, allowing better handling of
establishment, knowing this would be a critical step. From there, the focus turned to
the capital expenditure programme, and access to higher levels of debt funding.
creating operational efficiencies through the optimisation of treatment plants, shared
Strategic asset planning has also been a large focus, and as a result, there has been an
procurement processes and improved benchmarking, and “competition by comparison”.
under the Official Information Act 1982
increased maturity in asset planning and improved knowledge over the condition of water
While there was a step-up in capital investment in regional areas, this took some time to
assets, enabling prioritisation. In 2018, TasWater announced that 100% of its customers were
eventuate. This was due to the need to review the existing state of assets, identify regional
able to access water they can drink from a tap with the removal of all boil water notices. This
priorities, prepare capital investment plans and then move to the design and procurement
was of particular benefit to rural communities.
phase.
Key takeaways
Key takeaways
Although drinking water is prioritised by customers, delaying wastewater improvements may
It is crucial to focus on establishment of the new entities and administration systems prior to
Released
increase controversy and result in fewer benefits overall.
looking at operational and capital efficiencies. These savings will only be realised in the
long-term, once the initial consolidation is successful.
© 2021 Deloitte Access Economics
83
CASE STUDIES
Case Studies
International case studies also include Scotland, UK.
Water Industry Commission of Scotland (WICS)/ Scottish Water
History
• Delivered a massive investment programme
In 1996 Scotland’s water industry underwent a radical restructuring process, where the
• Increased customer satisfaction from 63% to 90%
responsibility for delivering water and sewerage services was transferred from the v12
• Reduced water leakage by 50%
Regional Authorities to three new Public Works Authorities. A new economic regulator was
established to protect the interests of consumers. A review two years after the restructure
• Reduced health and safety incidents by 90%
identified the following:
• Significantly reduced environmental pollution incidents.
• Financial savings from exploiting economies of scale, reducing cost bases and making
Separating water service delivery from governance functions has also provided a new focus
use of improved bulk purchasing power
on strategy and lifting levels of service. Finally, Scotland now has improved transparency
• A lift in capital investment
and benchmarking, and asset management.
• Increased transparency in decision making
International regard for Scottish Waters’ success has resulted in the establishment of an
advisory arm to advise other countries.
• Employee impacts managed through early retirement, natural movements and voluntary
redundancy packages.
Key takeaways
In 2002 further reforms saw Scotland’s water industry merged from the three regional
• Similarly to New Zealand, Scotland faced political concerns over the merger. Keeping
water suppliers into one supplier, Scottish Water. WICS is the non-departmental regulatory
ownership public while transitioning to a more corporate approach to water delivery
body with responsibility for managing the regulatory framework designed to encourage the
alleviated these concerns.
provision of high quality/value for money water services. The Scottish experience is
• Employment in the sector as increased significantly with much of that workforce
under the Official Information Act 1982
comparable to New Zealand because of the similar population size of >five million
distributed through the regions. Scotland also struggles to attract and retain staff. A key
customers, and given New Zealand is in a similar position today as Scotland was prior to
focus at the moment is on recruitment processes and the value provided to new
amalgamation.
graduates.
Efficiencies
• While the absolute scale of the workforce has increased, the mix has changed
Since the merger, Scottish Water has:
significantly. While Scottish Water’s direct workforce has reduced, the overall workforce
in the Three Waters supply chain has increased significantly.
• Reduced operating costs by 40% (the second lowest in the UK)
Released
• Despite sharing similarities with Scotland, the remoteness of New Zealand may provide
challenges in the labour and supply chains, resulting in a slower realisation of efficiencies.
© 2021 Deloitte Access Economics
84
18. Appendices
under the Official Information Act 1982
Released
© 2021 Deloitte Access Economics
85
APPENDICES
Appendix A: CGE modelling
This appendix provides technical background to our in-house CGE model, DAE-RGEM.
We used our in-house model to estimate the economic impact of reform. The Deloitte
• Household consumption for composite goods is determined by minimising
Access Economics – Regional General Equilibrium Model (DAE-RGEM) is a large scale,
expenditure via a CDE (Constant Differences of Elasticities) expenditure function. For
dynamic, multi-region, multi-commodity computable general equilibrium model of the world
most regions, households can source consumption goods only from domestic and
economy with bottom up modelling of New Zealand regions. The model allows policy
imported sources. In the New Zealand regions, households can also source goods
analysis in a single, robust, integrated economic framework. This model projects changes in
from interregional. In all cases, the choice of commodities by source is determined by
macroeconomic aggregates such as GDP, employment, export volumes, investment and
a CRESH (Constant Ratios of Elasticities Substitution, Homothetic) utility function.
private consumption. At the sectoral level, detailed results such as output, exports, imports
and employment can also be produced.
• Government consumption for composite goods, and goods from different sources
(domestic, imported and interregional), is determined by maximising utility via a C-D
The model is based upon a set of key underlying relationships between the various
utility function.
components of the model, each which represent a different group of agents in the economy.
• All savings generated in each region are used to purchase bonds whose price
These relationships are solved simultaneously, and so there is no logical start or end point for
movements reflect movements in the price of creating capital.
describing how the model actually works. However, they can be viewed as a system of
interconnected markets with appropriate specifications of demand, supply and the market
• Producers supply goods by combining aggregate intermediate inputs and primary
clearing conditions that determine the equilibrium prices and quantity produced, consumed
factors in fixed proportions (the Leontief assumption). Composite intermediate inputs
and traded.
are also combined in fixed proportions, whereas individual primary factors are
combined using a CES production function.
Key Modelling Assumptions
• Producers are cost minimisers, and in doing so, choose between domestic, imported
DAE-RGEM is based on a substantial body of accepted microeconomic theory. Key
and interregional intermediate inputs via a CRESH production function.
assumptions underpinning the model are:
• The supply of labour is positively influenced
under the Official Information Act 1982 by movements in the real wage rate
• The model contains a ‘regional consumer’ that receives all income from factor payments
governed by an elasticity of supply.
(labour, capital, land and natural resources), taxes and net foreign income from
borrowing (lending).
• Income is allocated across household consumption, government consumption and
savings so as to maximise a Cobb-Douglas (C-D) utility function.
Released
© 2021 Deloitte Access Economics
86
APPENDICES
Appendix A: CGE modelling
This appendix provides technical background to our in-house CGE model, DAE-RGEM.
• Investment takes place in a global market and allows for different regions to have
• The model accounts for greenhouse gas emissions from fossil fuel combustion. Taxes
different rates of return that reflect different risk profiles and policy impediments to
can be applied to emissions, which are converted to good-specific sales taxes that
investment. A global investor ranks countries as investment destinations based on two
impact on demand. Emission quotas can be set by region and these can be traded, at
factors: global investment and rates of return in a given region compared with global
a value equal to the carbon tax avoided, where a region’s emissions fall below or
rates of return. Once the aggregate investment has been determined for New
exceed their quota.
Zealand, aggregate investment in each New Zealand sub-region is determined by a
New Zealand investor based on: New Zealand investment and rates of return in a
Below is a description of each component of the model and key linkages between
given sub-region compared with the national rate of return.
components.
• Once aggregate investment is determined in each region, the regional investor
Households
constructs capital goods by combining composite investment goods in fixed
proportions, and minimises costs by choosing between domestic, imported and
Each region in the model has a so-called representative household that receives and
interregional sources for these goods via a CRESH production function.
spends all income. The representative household allocates income across three different
expenditure areas: private household consumption; government consumption; and
• Prices are determined via market-clearing conditions that require sectoral output
savings.
(supply) to equal the amount sold (demand) to final users (households and
government), intermediate users (firms and investors), foreigners (international
The representative household interacts with producers in two ways. First, in allocating
exports), and other New Zealand regions (interregional exports).
expenditure across household and government consumption, this sustains demand for
production. Second, the representative household owns and receives all income from
• For internationally-traded goods (imports and exports), the Armington assumption is
factor payments (labour, capital, land and natural resources) as well as net taxes. Factors
applied whereby the same goods produced in different countries are treated as
of production are used by producers as inputs into production along with intermediate
imperfect substitutes. But, in relative terms, imported goods from different regions are
under the Official Information Act 1982
inputs. The level of production, as well as supply of factors, determines the amount of
treated as closer substitutes than domestically-produced goods and imported
income generated in each region.
composites. Goods traded interregional within the New Zealand regions are assumed
to be closer substitutes again.
The representative household’s relationship with investors is through the supply of
investable funds – savings. The relationship between the representative household and
the international sector is twofold. First, importers compete with domestic producers in
consumption markets. Second, other regions in the model can lend (borrow) money from
Released
each other.
© 2021 Deloitte Access Economics
87
APPENDICES
Appendix A: CGE modelling
This appendix provides technical background to our in-house CGE model, DAE-RGEM.
• The representative household allocates income across three different expenditure
Producers interact with international markets in two main ways. First, they compete with
areas – private household consumption; government consumption; and savings – to
producers in overseas regions for export markets, as well as in their own region. Second,
maximise a Cobb-Douglas utility function.
they use inputs from overseas in their production.
• Private household consumption on composite goods is determined by minimising a
Sectoral output equals the amount demanded by consumers (households and
CDE (Constant Differences of Elasticities) expenditure function. Private household
government) and intermediate users (firms and investors) as well as exports.
consumption on composite goods from different sources is determined is determined
by a CRESH (Constant Ratios of Elasticities Substitution, Homothetic) utility function.
Intermediate inputs are assumed to be combined in fixed proportions at the composite
• Government consumption on composite goods, and composite goods from different
level. As mentioned above, the exception to this is the electricity sector that is able to
sources, is determined by maximising a Cobb-Douglas utility function.
substitute different technologies (brown coal, black coal, oil, gas, hydropower and other
renewables) using the ‘technology bundle’ approach developed by ABARE (1996).
• All savings generated in each region is used to purchase bonds whose price
movements reflect movements in the price of generating capital.
To minimise costs, producers substitute between domestic and imported intermediate
Producers
inputs is governed by the Armington assumption as well as between primary factors of
production (through a CES aggregator). Substitution between skilled and unskilled labour
Apart from selling goods and services to households and government, producers sell
is also allowed (again via a CES function).
products to each other (intermediate usage) and to investors. Intermediate usage is
where one producer supplies inputs to another’s production. For example milk producers
The supply of labour is positively influenced by movements in the wage rate governed by
supply inputs to the dairy sector.
an elasticity of supply is (assumed to be 0.2). This implies that changes influencing the
demand for labour, positively or negatively, will impact both the level of employment and
Capital is an input into production. Investors react to the conditions facing producers in a
the wage rate. This is a typical labour market specification for a dynamic model such as
under the Official Information Act 1982
region to determine the amount of investment. Generally, increases in production are
DAE-RGEM. There are other labour market ‘settings’ that can be used. First, the labour
accompanied by increased investment. In addition, the production of machinery,
market could take on long-run characteristics with aggregate employment being fixed
construction of buildings and the like that forms the basis of a region’s capital stock, is
and any changes to labour demand changes being absorbed through movements in the
undertaken by producers. In other words, investment demand adds to household and
wage rate. Second, the labour market could take on short-run characteristics with fixed
government expenditure from the representative household, to determine the demand
wages and flexible employment levels.
for goods and services in a region.
Released
© 2021 Deloitte Access Economics
88
APPENDICES
Appendix A: CGE modelling
This appendix provides technical background to our in-house CGE model, DAE-RGEM.
Investors
Investment takes place in a global market and allows for different regions to have
different rates of return that reflect different risk profiles and policy impediments to
investment. The global investor ranks countries as investment destination based on two
factors: current economic growth and rates of return in a given region compared with
global rates of return.
Once aggregate investment is determined in each region, the regional investor constructs
capital goods by combining composite investment goods in fixed proportions, and
minimises costs by choosing between domestic, imported and interregional sources for
these goods via a CRESH production function.
International
Each of the components outlined above operate, simultaneously, in each region of the
model. That is, for any simulation the model forecasts changes to trade and investment
flows within, and between, regions subject to optimising behaviour by producers,
consumers and investors. Of course, this implies some global conditions that must be
met, such as global exports and global imports, are the same and that global debt
repayment equals global debt receipts each year.
under the Official Information Act 1982
Released
© 2021 Deloitte Access Economics
89
APPENDICES
Appendix B: Sectors and regions included in CGE model
We modelled 14 aggregated sectors and New Zealand’s 16 main regions.
Sectors
Regions
Classification based on population density
Crops, livestock, Forestry and Fishing
Northland
Provincial
Coal, oil, gas, and other mining
Auckland
Metropolitan
Food processing
Waikato
Metropolitan
Light manufacturing
Bay of Plenty
Metropolitan
Heavy manufacturing
Gisborne
Rural
Trade
Hawke's Bay
Provincial
Transport
Taranaki
Provincial
Electricity
Manawatu-Wanganui
Provincial
Water
Wellington
Metropolitan
Construction
Tasman
Rural
Financial services
Nelson
Provincial
Business services
Marlborough
Rural
Recreation services
West Coast
Rural
under the Official Information Act 1982
Other services
Canterbury
Metropolitan
Otago
Provincial
Southland
Rural
Released
© 2021 Deloitte Access Economics
90
APPENDICES
Appendix C
Stakeholder interviews.
Organsiation
# Employees in
Organsiation
# Employees in
Water
Water
Asmsus
N/A
PowerCo
N/A
Beca
150
Stantec
200
City Care Water
600
Steel and Tube
N/A
Deloitte Access Economics
Taituarā
N/A
Australia
N/A
Taumata Arowai
N/A
Downer
450
Veolia
300
Filtration Technology
60
Water Industry Commission
Humes
245
for Scotland (WICS)
N/A
Infrastructure Commission
N/A
Water New Zealand
N/A
Ixom New Zealand
75
Watercare
N/A
under the Official Information Act 1982
Lutra
30
Xylem Water Solutions
22
Released
© 2021 Deloitte Access Economics
91
APPENDICES
Appendix D
General use restriction
This report is prepared solely for the internal use of the Department of Internal Affairs. This report is not intended to and should not be used or relied upon by anyone else and Deloitte
accepts no duty of care to any other person or entity. The report has been prepared for the purpose of set out in our terms of engagement dated 24 February 2021. You should not refer to
or use our name or the advice for any other purpose.
under the Official Information Act 1982
Released
© 2021 Deloitte Access Economics
92
From:
Tan, John
To:
Sam Ponniah
Cc:
Nick Davis; Dent, Alan; 9(2)(a)
Subject:
Draft Economic Impact & Affected Industries A3
Date:
Friday, 21 May 2021 9:30:21 am
Attachments:
Draft Economic Impact & Affected Industries A3 v4.pdf
Hi Sam
Please find attached a draft A3. Feel free to drop any comments back by email and I will respond
when I can – otherwise I am in Auckland on Mon and Tues if its easier to scribble on it
John
*Disclaimer:*
CAUTION: This email message and attachments are confidential to Deloitte and may be
subject to legal privilege or copyright. If you have received this email in error, please
advise the sender immediately and destroy the message and any attachments. If you are not
the intended recipient you are notified that any use, distribution, amendment, copying or
any action taken or omitted to be taken in reliance of this message or attachments is strictly
prohibited. If you are an existing client, this email is provided in accordance with the latest
terms of engagement which we have agreed with you. Email is inherently subject to delay
or fault in transmission, interception, alteration and computer viruses. While Deloitte does
employ anti-virus measures, no assurance or guarantee is implied or should be construed
that this email message or its attachments are free from computer viruses. Deloitte assumes
no responsibility for any such virus or any effects of such a virus on the recipient's systems
or data.
Deloitte refers to one or more of Deloitte Touche Tohmatsu Limited ("DTTL"), its global
network of member firms, and their related entities. DTTL (also referred to as "Deloitte
Global") and each of its member firms and their affiliated entities are legally separate and
independent entities. DTTL does not provide services to clients. Please see
www.deloitte.com/about to learn more. Deloitte Asia Pacific Limited is a company limited
by guarantee and a member firm of DTTL. Members of Deloitte Asia Pacific Limited and
their related entities, each of which are separate and independent legal entities, provide
services from more than 100 cities across the region, including Auckland, Bangkok,
Beijing, Hanoi, Hong Kong, Jakarta, Kuala Lumpur, Manila, Melbourne, Osaka, Shanghai,
Singapore, Sydney, Taipei and Tokyo.
under the Official Information Act 1982
Released
From:
Tan, John
To:
Sam Ponniah
Cc:
9(2)(a)
Subject:
RE:GDP and employment figures
Date:
Wednesday, 26 May 2021 10:12:24 pm
Hi Sam
9(2)(a)
will send this to you tomorrow
John
From: Sam Ponniah <9(2)(a)
@martinjenkins.co.nz>
Sent: Wednesday, 26 May 2021 4:41 PM
To: Tan, John 9(2)(a)
@deloitte.co.nz>
Cc: 9(2)(a)
@deloitte.co.nz>
Subject: [EXT] RE: GDP and employment figures
Hi John
Sorry a couple more data series that we are after – could we have the time-series data for GDP and
employment at a national level over 30 years? (i.e. the annual data for GDP and employment in the
charts on pages 36 and 41)
Cheers
Sam
Sam Ponniah | Senior Consultant
MartinJenkins
M 9(2)(a)
T 9(2)(a)
From: Sam Ponniah
Sent: Wednesday, 26 May 2021 3:25 PM
To: 'Tan, John' 9(2)(a)
@deloitte.co.nz>
Cc: 9(2)(a)
@deloitte.co.nz>
Subject: GDP and employment figures
Hi John
Was good to catch up yesterday and am looking forward to seeing the next draft of the A3.
On a related note, we are preparing material to support cabinet and need to lift some of the figures
from your report. Would you be able to send me the GDP and employment figures for each of the low
and high scenarios of the economic modelling by each region (i.e. the data in the tables on pages 47
to 50 of the report)?
I’m hoping that you’ll have an editable version of the table or excel sheet to hand that has these
figures so that we don t have to manually transpose them.
under the Official Information Act 1982
Cheers
Sam
*Disclaimer:*
CAUTION: This email message and attachments are confidential to Deloitte and may be
subject to legal privilege or copyright. If you have received this email in error, please
advise the sender immediately and destroy the message and any attachments. If you are not
the intended recipient you are notified that any use, distribution, amendment, copying or
Released
any action taken or omitted to be taken in reliance of this message or attachments is strictly
prohibited. If you are an existing client, this email is provided in accordance with the latest
terms of engagement which we have agreed with you. Email is inherently subject to delay
or fault in transmission, interception, alteration and computer viruses. While Deloitte does
employ anti-virus measures, no assurance or guarantee is implied or should be construed
that this email message or its attachments are free from computer viruses. Deloitte assumes
no responsibility for any such virus or any effects of such a virus on the recipient's systems
or data.
Deloitte refers to one or more of Deloitte Touche Tohmatsu Limited ("DTTL"), its global
network of member firms, and their related entities. DTTL (also referred to as "Deloitte
Global") and each of its member firms and their affiliated entities are legally separate and
independent entities. DTTL does not provide services to clients. Please see
www.deloitte.com/about to learn more. Deloitte Asia Pacific Limited is a company limited
by guarantee and a member firm of DTTL. Members of Deloitte Asia Pacific Limited and
their related entities, each of which are separate and independent legal entities, provide
services from more than 100 cities across the region, including Auckland, Bangkok,
Beijing, Hanoi, Hong Kong, Jakarta, Kuala Lumpur, Manila, Melbourne, Osaka, Shanghai,
Singapore, Sydney, Taipei and Tokyo.
under the Official Information Act 1982
Released


 From:
From:
Tan, John
To:
Sam Ponniah
Cc:
Allan, Liana; 9(2)(a)
Dent, Alan
Subject:
Updated A3
Date:
Wednesday, 26 May 2021 11:12:10 pm
Attachments:
image001.png
image002.png
image003.png
image004.png
image005.png
image006.png
Draft Economic Impact Affected Industries A3 v7.pdf
Hi Sam
Attached is the updated A3 if you havent already received this
John
John Tan
Partner | Corporate Finance
Deloitte
Level 12, 20 Customhouse Quay, PO Box 1990, Wellington 6140, New Zealand
9(2)(a)
9(2)(a)
9(2)(a)
9(2)(a)
Act 1982
D:
| M:
| O:
| F:
9(2)(a)
@deloitte.co.nz | www.deloitte.co.nz
Deloitte means Deloitte Limited (in its own capacity for assurance services, otherwise as trustee
for the Deloitte Trading Trust)
Navigating COVID-19: read the latest updates from our experts
Deloitte 175
under the Official Informa
Please consider the environment before printing.
*Disclaimer:*
CAUTION: This email message and attachments are confidential to Deloitte and may be
subject to legal privilege or copyright. If you have received this email in error, please
advise the sender immediately and destroy the message and any attachments. If you are not
Released
the intended recipient you are notified that any use, distribution, amendment, copying or
any action taken or omitted to be taken in reliance of this message or attachments is strictly
prohibited. If you are an existing client, this email is provided in accordance with the latest
terms of engagement which we have agreed with you. Email is inherently subject to delay
or fault in transmission, interception, alteration and computer viruses. While Deloitte does
employ anti-virus measures, no assurance or guarantee is implied or should be construed
that this email message or its attachments are free from computer viruses. Deloitte assumes
no responsibility for any such virus or any effects of such a virus on the recipient's systems
or data.
Deloitte refers to one or more of Deloitte Touche Tohmatsu Limited ("DTTL"), its global
network of member firms, and their related entities. DTTL (also referred to as "Deloitte
Global") and each of its member firms and their affiliated entities are legally separate and
independent entities. DTTL does not provide services to clients. Please see
www.deloitte.com/about to learn more. Deloitte Asia Pacific Limited is a company limited
by guarantee and a member firm of DTTL. Members of Deloitte Asia Pacific Limited and
their related entities, each of which are separate and independent legal entities, provide
services from more than 100 cities across the region, including Auckland, Bangkok,
Beijing, Hanoi, Hong Kong, Jakarta, Kuala Lumpur, Manila, Melbourne, Osaka, Shanghai,
Singapore, Sydney, Taipei and Tokyo.
under the Official Information Act 1982
Released
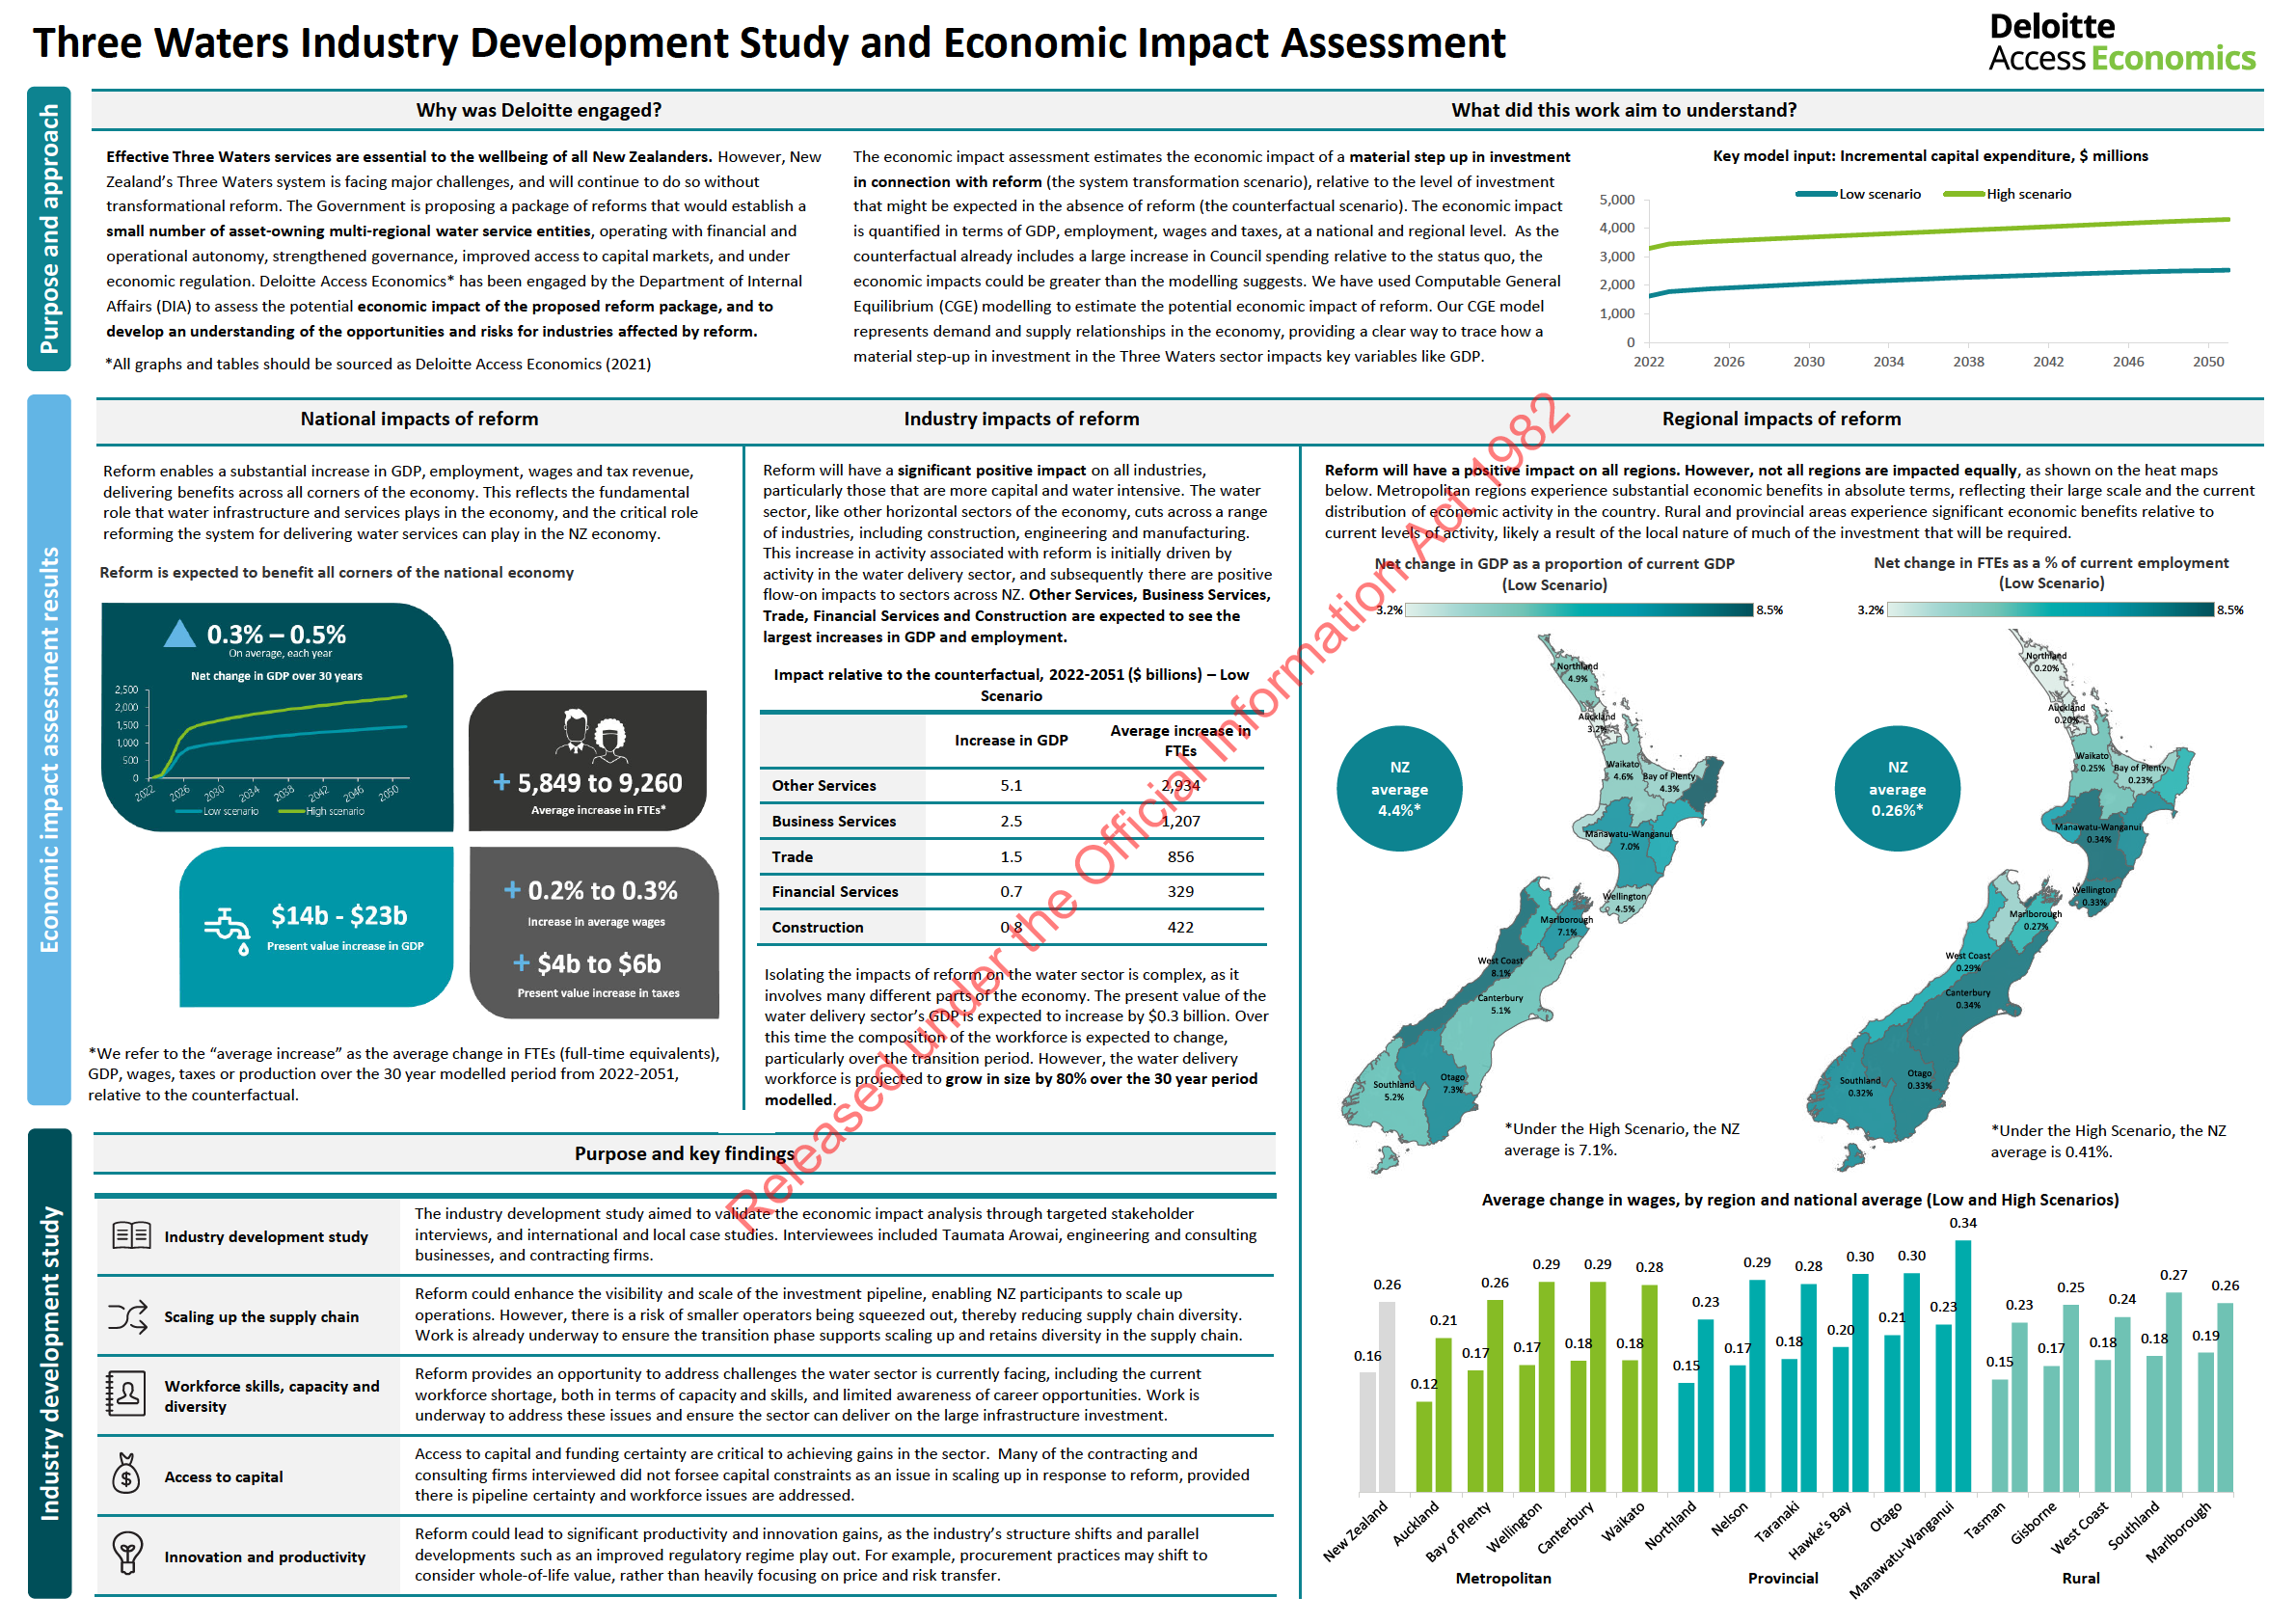

 From:
From:
Tan, John
To:
Sam Ponniah; Dent, Alan
Cc:
Nick Davis; 9(2)(a)
Subject:
RE:Upcoming release of reports
Date:
Thursday, 27 May 2021 10:31:54 pm
Attachments:
image001.png
image002.png
image003.png
image004.png
image005.png
Sam
Thanks for the update and that’s fine
John
From: Sam Ponniah <9(2)(a)
@martinjenkins.co.nz>
Sent: Thursday, 27 May 2021 10:20 AM
To: Tan, John 9(2)(a)
@deloitte.co.nz>; Dent, Alan 9(2)(a) @deloitte.co.nz>
Cc: Nick Davis 9(2)(a)
@dia.govt.nz>
Subject: [EXT] Upcoming release of reports
Kia ora John, Alan
By way of an update, we are planning for public release of your report (along with WICS’ report and
the two reviews of WICS’ method/assumptions by Farrierswier and Beca) on late next Wednesday, 2
June. At this stage we are anticipating DIA will front/lead the initial engagements but if needed we
would look to agree any further engagement on a time and materials basis as per previous
discussions.
If you are approached for comment on your work or any aspect of the reform programme can you
please direct them to DIA ([email address]) in the first instance.
Thanks also for sending through the updated A3 John. I will get you our final comments on this in the
next day or so.
Ngā mihi
Sam
Sam Ponniah | Senior Consultant
MartinJenkins
M 9(2)(a)
T 9(2)(a)
he Official Information Act 1982
Level 16, AIG Building, 41 Shortland St,
Auckland
Level 1, City Chambers, Cnr Johnston & Featherston Sts,
Wellington
unde
PLEASE NOTE: The information contained in this email message and any attached files may be confidential and subject to privilege. The views
expressed may not necessarily be the official view of Martin, Jenkins and Associates Limited. If you are not the intended recipient, you are notified
that any use, disclosure or copying of this email is unauthorised. If you have received this email in error, please notify us immediately by reply
email and delete the original. Thank you.
*Disclaimer:*
CAUTION: This email message and attachments are confidential to Deloitte and may be
subject to legal privilege or copyright. If you have received this email in error, please
Released
advise the sender immediately and destroy the message and any attachments. If you are not
the intended recipient you are notified that any use, distribution, amendment, copying or
any action taken or omitted to be taken in reliance of this message or attachments is strictly
prohibited. If you are an existing client, this email is provided in accordance with the latest
terms of engagement which we have agreed with you. Email is inherently subject to delay
or fault in transmission, interception, alteration and computer viruses. While Deloitte does
employ anti-virus measures, no assurance or guarantee is implied or should be construed
that this email message or its attachments are free from computer viruses. Deloitte assumes
no responsibility for any such virus or any effects of such a virus on the recipient's systems
or data.
Deloitte refers to one or more of Deloitte Touche Tohmatsu Limited ("DTTL"), its global
network of member firms, and their related entities. DTTL (also referred to as "Deloitte
Global") and each of its member firms and their affiliated entities are legally separate and
independent entities. DTTL does not provide services to clients. Please see
www.deloitte.com/about to learn more. Deloitte Asia Pacific Limited is a company limited
by guarantee and a member firm of DTTL. Members of Deloitte Asia Pacific Limited and
their related entities, each of which are separate and independent legal entities, provide
services from more than 100 cities across the region, including Auckland, Bangkok,
Beijing, Hanoi, Hong Kong, Jakarta, Kuala Lumpur, Manila, Melbourne, Osaka, Shanghai,
Singapore, Sydney, Taipei and Tokyo.
under the Official Information Act 1982
Released