
16 March 2022
Jasmine Lock
By email:
[FYI request #18576 email]
Dear Jasmine
I refer to your information request dated 16 February 2022 made under the Official Information Act
1982 (Act). You requested information regarding the average time for PhD completions and deferrals
in the Division of Health Sciences and Division of Sciences, broken down by year since 2010.
We note we contacted you 1 March 2022 to advise that the University did not have readily to hand
all of the information you have requested, and asked whether you would be willing to accept the
data we held for the years 2000 – 2010 plus information we held on the medians for time to
completion for the years 2015 – 2019. At the time we advised that it would take extensive staff time
and research to collate the remaining information you had requested.
Your email of 9 March 2022 confirmed that you were happy to receive the information that the
University had readily to hand.
Subject to the following comment, please see below the information the University currently holds
that is within the agreed revised scope of your request.
• Please note that all tables in our response are based on EFTS consumed, which is a measure
of a student’s period of active enrolment as an equivalent full-time student. For example, if a
student studies part-time for a year, they will consume 0.5 EFTS over the course of a
calendar year. A student undertaking a typical full-time year’s study will consume 1.0 EFTS.
Completion time
Please see the below a table which shows the number of PhD students, the median time to
submission of a PhD, and the average PhD completion time for the Division of Health Sciences and
the Division of Sciences, broken down by year from 2000 – 2010 and 2015 – 2020. As noted to you in
our email of 1 March 2022, for some years the University does not currently have the full set of data
readily to hand.
Division of Health Sciences
Division of Sciences
Median time to Average PhD
Median time to Average PhD
Year
Headcount
PhD submission
completion
Headcount PhD submission
completion
(EFTS)
time (EFTS)
(EFTS)
time (EFTS)
2000
4.85
50
3.89
2001
4.16
26
4.12
2002
4.70
56
3.58
2003
4.08
47
3.62
2004
3.97
57
3.57
2005
4.06
44
3.66
2006
3.77
84
3.82
2007
3.80
74
3.83
2008
3.80
68
3.87
2009
3.40
103
3.40
2010
3.37
76
3.19
2015
95
3.50
3.50
87
3.50
3.80
2016
101
3.40
3.50
63
3.80
4.20
2017
92
3.50
3.50
82
3.60
3.60
2018
110
3.40
3.50
70
3.30
3.70
2019
86
3.40
3.60
90
3.30
3.60
2020
91
3.30
3.50
79
3.10
3.30
Deferrals
Please below a table which shows the average length of deferrals for PhDs in the Division of Health
Sciences and the Division of Sciences, broken down by year from 2000 – 2010.
Average length of deferral in days
Year
Division of Health Sciences
Division of Sciences
2000
114
123
2001
66
155
2002
107
147
2003
55
130
2004
95
67
2005
112
155
2006
66
122
2007
50
170
2008
56
77
2009
89
91
2010
44
70

Please also see the additional table below that shows the median deferral time and number of
deferrals taken for PhDs in all Academic Divisions (Health Sciences, Sciences, Humanities,
Commerce), broken down by year from 2000 – 2011.
Number of
Number of
Number of
Number of
Total number
Median time
Total
deferrals in
deferrals in
deferrals in
deferrals
Year
of PhD
deferral
deferrals
first year of second year
third year
above third
candidates
taken (EFTS)
taken
PhD
of PhD
of PhD
year of PhD
2000
725
2.84
1
3
7
8
19
2001
743
2.7
4
4
3
6
17
2002
759
2.88
6
6
8
16
36
2003
766
2.465
6
4
5
11
26
2004
811
1.975
10
7
6
11
34
2005
849
2.46
7
5
8
14
34
2006
976
1.69
10
11
7
8
36
2007
1048
2.285
7
15
4
18
44
2008
1103
1.57
11
6
5
6
28
2009
1206
1.58
14
16
7
6
43
2010
1257
1.24
13
11
1
3
28
2011
1257
0.665
5
10
5
2
22
In case it is helpful, we have also included a copy of a research paper that was completed by
University of Otago staff members. The paper discusses factors contributing to PhD completion rates
and explains University of Otago rates of submission and completion by Academic Division.
As noted in our email to you on 1 March 2022, the University is interested for its own purposes to
collate the information you have requested that the University does not currently hold. However,
our staff are very busy with tasks related to COVID-19 and other matters, which is having an impact
on the operations and focus of the University at this time. We hope to be able to undertake this
work when it is practically manageable.
We will endeavour to provide this information to you once it is practically manageable to do so. The
expected timeframe for this is unknown at this stage, however please feel free to get back in touch
with us if you have not heard from us. In the meantime, our Graduate Research School would be
happy to discuss with you any specific issues or concerns you may have.
Yours sincerely
Kelsey Kennard
Official Information and Compliance Coordinator
Office of the Registrar


 Assessment & Evaluation in Higher Education
ISSN: 0260-2938 (Print) 1469-297X (Online) Journal homepage: http://www.tandfonline.com/loi/caeh20
Factors contributing to high PhD completion rates:
a case study in a research-intensive university in
New Zealand
Rachel Spronken-Smith, Claire Cameron & Robin Quigg
To cite this article:
Assessment & Evaluation in Higher Education
ISSN: 0260-2938 (Print) 1469-297X (Online) Journal homepage: http://www.tandfonline.com/loi/caeh20
Factors contributing to high PhD completion rates:
a case study in a research-intensive university in
New Zealand
Rachel Spronken-Smith, Claire Cameron & Robin Quigg
To cite this article: Rachel Spronken-Smith, Claire Cameron & Robin Quigg (2018)
Factors contributing to high PhD completion rates: a case study in a research-intensive
university in New Zealand, Assessment & Evaluation in Higher Education, 43:1, 94-109, DOI:
10.1080/02602938.2017.1298717
To link to this article: https://doi.org/10.1080/02602938.2017.1298717
Published online: 05 Mar 2017.
Submit your article to this journal
Article views: 508
View related articles
View Crossmark data
Full Terms & Conditions of access and use can be found at
http://www.tandfonline.com/action/journalInformation?journalCode=caeh20
Download by: [University of Otago]
Date: 28 November 2017, At: 19:10
link to page 5 link to page 5 link to page 5 link to page 20 link to page 20 link to page 6 link to page 20

Assessment & evAluAtion in HigHer educAtion, 2018
vol. 43, no. 1, 94–109
https://doi.org/10.1080/02602938.2017.1298717
Factors contributing to high PhD completion rates: a case study in
a research-intensive university in New Zealand
Rachel Spr
onken-Smitha, Claire Cameron
b and Robin Q
uiggc
agraduate research school, university of otago, dunedin, new Zealand; bdepartment of Preventive and social
medicine, university of otago, dunedin, new Zealand; cdivision of external engagement, university of otago,
dunedin, new Zealand
ABSTRACT
KEYWORDS
This exploratory study determined PhD completions at a research-intensive
doctoral education; Phd;
university in New Zealand and considered factors affecting PhD completions.
completion; duration;
Completion data were calculated for PhD cohorts at the University of Otago
survival methods
from 2000 to 2012 (
n = 2770) and survival models determined whether
gender, enrolment status, age at admission, citizenship, scholarship status
and academic field influenced completion. The impact of the doctoral
programme and the research environment was also considered. Across
all cohorts, 83% submitted their thesis for examination (17% withdrawal).
The median submission time was 3.4 years for full-timers, with a median
completion time (to award of degree) of 4.1 years. Survival modelling showed
that completion can be enhanced by having mainly full-time candidates, but
also allowing periods of part-time enrolment near submission, recruiting a
large international cohort, and providing three year scholarships. Health
science candidates had the highest submission percentages, while
commerce candidates submitted in the fastest times. There were only
minor or negligible effects of gender and age at admission. Other factors
contributing to high submission rates included recruiting quality candidates,
close monitoring during candidature, provision of research training, a vibrant
research culture, a personal performance coach, high-quality supervision
and funding incentives for candidates who submit in under four years.
Introduction
Downloaded by [University of Otago] at 19:10 28 November 2017
Attrition rates and time to completion of PhD candidates has internationally become a concern of government,
universities and the candidates themselves. (Bourke et al.
2004, 1)
Many stakeholders have a vested interest in high PhD completions and fast completion times, as Bourke
et al.
(2004) have noted. In order for stakeholders – particularly governments and universities – to make
informed decisions regarding doctoral education policy and practice, it is important to have good base-
line completion data, as well as a knowledge of factors influencing completion. Doctoral candidates
are also concerned about completion rates, and, as many have to fully or partially fund their study, they
want to ensure they are investing wisely.
Before continuing, it is important to provide definitions (T
able 1) and to recognise that these are
not always given in reports on completion statistics, which makes interpretation and cross-institution
comparisons difficult. Palmer (
2015) provides an excellent synthesis of the different methods to cal-
culate completion statistics. The term ‘completion rate’ is typically used to define the percentage of
CONTACT rachel spronken-smith
[email address]
© 2017 informa uK limited, trading as taylor & Francis group
link to page 20 link to page 20 link to page 20 link to page 20 link to page 20 link to page 20 link to page 20 link to page 20
ASSESSMENT & EVALUATION IN HIGHER EDUCATION
95
Table 1. definitions of key terms used in analysis of completion data.
Term
Definition
submission percentage
Percentage of the commencing cohort who submitted their
thesis for examination
completion percentage
Percentage of the commencing cohort who completed
their Phd (i.e. passed the examination, made any required
amendments and were awarded the degree)
submission or completion rate
Percentage who submitted or completed over a specified time
period e.g. 4 years
Attrition
Percentage of the commencing cohort who withdrew from
study
candidacy time (or time to submission)
number of years from enrolment to submission of the thesis
for examination, excluding any time away from study
completion time (or total completion time or time-to-degree)
number of years from enrolment to award of the degree,
including any time away from study (e.g. holidays or defer-
rals), as well as the time for examination, but not including
time to graduation
candidates from a particular cohort who have submitted their thesis for examination. However, this
term can be misleading because these candidates have not yet completed, and this is not a rate unless
a time period is specified. Therefore, we make a distinction between submission and completion – both
for percentages and times. Additionally, although doctoral and PhD are often used interchangeably in
the literature, in this article we are focusing on PhD candidates.
The scant reports in the literature indicate problems with attrition and completion times for PhD
candidates. However, many articles are very dated, especially given changes in recent years in PhD edu-
cation. For example, a seminal report for US universities analysed completion data across 30 institutions
for cohorts from 1992 to 1993 and 1994 to 1995 (Council of Graduate S
chools 2008). The authors found
completion rates of just 46% after seven years and 57% after ten years. Even taking into account the US
PhD education system, which usually involves two years of coursework before supervised research, these
data are worrying. Elgar (
2003) collated completion data for PhD candidates in Canadian universities.
For 14,402 PhD candidates in cohorts from 1985 to 1988 across a range of disciplines, he found that
the percentage completing varied from 40% in English to 83% in biochemistry. The completion times
were estimated as about 4 to 5 years.
The completion statistics from the UK and Australia show a brighter picture, but some of the data are
more recent, which may reflect improvements that have occurred in PhD education, and some are from
only one institution. In these systems, PhD study is focused on a research project, although research
training may occur particularly in the first year. The expectation for candidates is to complete within
3–4 years. F
uller (2015) reported that 70–87% of full-time PhD candidates across 30 institutions in the
Downloaded by [University of Otago] at 19:10 28 November 2017
UK completed in 7 years. In Australia, for 2647 candidates commencing a PhD in early 1992, by the end
of 1999 an average of 53% completed (Martin, Maclachan, and Kar
mel 1999). Better completion rates
were found by Bourke et al
. (2004), with one study of 1988–1999 cohorts at an Australian university
showing 51% submitted their thesis in 4 years, with 70% in 6 years. More recently, Palmer (
2015) pre-
sented a range of completion statistics for the top 10 universities in Australia, with completion ratios
(proportion of annual completions relative to commencements) of 62–72%.
The PhD training system in Europe varies according to the country, since in some countries PhD
candidates are employed as staff, teaching while researching. Consequently, the average length of study
tends to be longer. When analysing European country reports for the status of PhD education, Kehm
(
2004) noted that all countries were concerned about duration of study, which tended to be 4–6 years.
She also found that attrition was an issue, although not many statistics were reported.
Many researchers have explored factors influencing both completion and attrition of PhD candidates.
In an analysis of improved PhD completion rates in Norway, Ky
vik and Olsen (2014, 1670) categorised
the factors influencing completion rates into: the doctoral training system; the doctoral programme
link to page 20
96
R. SPRONKEN-SMITH ET AL.
and the research environment; the doctoral candidates; the cultural and social context; and differences
between academic fields. We draw on similar categories in this article.
New Zealand context
New Zealand has eight universities (all publicly funded) and all award PhD degrees. Given the similarity
in structure and funding between the universities, the ‘New Zealand PhD’ consists of about 3–4 years
of supervised research, and coursework is seldom required (the exceptions are research methods or
statistical courses). Entry to the PhD is typically via completion of an undergraduate degree and either
an Honours degree (one year of postgraduate coursework including a research dissertation) or a Master’s
degree including a substantive research component.
The government funding for PhD candidates is geared towards completion in 4 years. Annual
enrolment funding accounts for about 65% of total funding and is normally for up to 4 years. Upon
completion, the university receives further significant funding (about 35%), from the nationally-run
Performance-based Research Fund (PBRF). That PhD candidates have to pay fees at NZ universities likely
provides a strong imperative for timely completion – both for candidates who self-fund and for those
on scholarship funding (e.g. if the scholarship does not cover fees or if their scholarship expires before
they have submitted their thesis). All universities offer scholarship support from internal funding; there
is only minimal scholarship funding from government for specific groups. In 2006, the government
introduced a new policy to attract more international PhD candidates: international PhD candidates
resident in NZ would only pay domestic fees (typically NZ$5–10,000 a year).
In New Zealand, the only published research on completion rates occurred as part of a study on the
impact of the PBRF on retention of PhD candidates. This study reported an average 60% of PhD can-
didates for the 1995–1997 cohorts across the universities completed in 9 years (Ministry of Education
2007). Given the paucity of research on PhD completions in New Zealand universities, this study aimed
to analyse PhD completions at a research-intensive university and to consider factors influencing
completion.
Methods
Case study setting
To address the aims, a case study was undertaken at the University of Otago (Otago), a research-intensive
university in NZ. Otago is the oldest in the country, with a QS rating of five stars plus
(http://www.
topuniversities.com/university-rankings). In 2015, there were about 21,000 students enrolled, including
approximately 1300 PhD candidates across four broad academic fields (or divisions): health science,
Downloaded by [University of Otago] at 19:10 28 November 2017
science, humanities and commerce. The University expects submission of PhD theses in 3 years, but
candidates can have a maximum of 8 calendar years. Candidates can enrol continuously throughout the
year, and may enrol either full-time (1 EFT – equivalent full-time), or part-time (0.5 EFT). Candidates can
take a deferral during their study; they are not charged fees and the time clock for their PhD duration is
paused. Otago has increased the number of doctoral scholarships available each year from 80 in 2000
to about 180 in 2012. Importantly, these scholarships are available to both domestic and, since 2006,
international candidates and include an annual stipend (NZ$25,000 in 2012, which should be sufficient
to cover living expenses for a year), as well as tuition fees, but the tenure is only 3 years. After this time
PhD candidates normally self-fund to completion, although some departments may offer financial
support. A small proportion of international PhD candidates will study with scholarship support from
their home country, while others – both domestic and international – will self-fund their entire study.
If candidates submit their thesis for examination within 4 EFT years, they normally get a ‘Postgraduate
Publishing Bursary’, which provides up to 3 months’ funding at scholarship rate to enable publishing
of their research while their thesis is examined.
link to page 20
ASSESSMENT & EVALUATION IN HIGHER EDUCATION
97
Administration of PhD candidates is done centrally by the Graduate Research School, who have an
extensive database including details of their characteristics, progress and completion. The Graduate
Research School is responsible for promoting best practice in doctoral education, and helps ensure
consistency of PhD administrative practices.
At Otago, candidates are only accepted into the PhD programme if they have a strong academic
record and can demonstrate capacity for research. This means that Otago candidates should be well
equipped for PhD study. Following enrolment, candidates complete a student-supervisor agreement,
which, although only made compulsory in 2012, was commonplace for earlier cohorts. The university
closely monitors progress during candidature. All PhD candidates have an initial period of provisional
enrolment (6–12 months), during which candidates are set targets to achieve and their progress is for-
mally monitored. Once confirmed, formal progress meetings occur every year. There is an expectation
of submission in 3 years, with this target submission date reinforced through the University’s student
management system.
The Graduate Research School encourages vibrant graduate research cultures in departments
through workshops for heads of departments in Otago’s leadership programme, as well as sessions
for supervisors and postgraduate coordinators. Recently an annual award has been introduced to rec-
ognise departments providing the best graduate research culture. The School also oversees research
and transferable skills training through optional workshops and short courses. This professional devel-
opment programme is much smaller than those found in the UK, since it relies on internal funding. A
dedicated personal coaching service for graduate research candidates assists them with goal setting,
keeping on track and avoiding procrastination.
The University promotes team supervision and solo supervision is only allowed when the candidate
is supported by a committee. Candidates at Otago are experiencing high-quality supervision, evi-
denced by exit survey data (unpublished), as well as graduate opinion data. For example, in the 2012
exit survey, of the 114 PhD graduates who responded (response rate of 59%), 94% were ‘very satisfied’
or ‘satisfied’ with their quality of supervision. Although mandatory training has just been introduced
for new supervisors, Otago has provided a comprehensive programme of support for supervisors for
many years, and this is well attended and highly regarded. Excellent supervision is recognised through
university-wide annual awards.
Data collection
Data were collected from a range of sources. First, the submission and completion percentages and
times were extracted from the Graduate Research School database for PhD cohorts for the time period
2000–2012 (
n = 2770), with data extracted on 31 January 2015. At this time 520 (19%) had not yet
submitted or completed. Second, using the categories of Kyvik and Olsen (
2014), other factors were
Downloaded by [University of Otago] at 19:10 28 November 2017
extracted from the database to determine possible influences on completion rates. For factors relating
to ‘doctoral candidates’, data extracted included gender, age at admission, citizenship (i.e. domestic
or international) and enrolment status (full-time, part-time, or variable with periods of full-time and
part-time enrolment). One measurable factor in the ‘doctoral training system’ is funding, so data were
extracted regarding whether the candidate received an Otago scholarship. For ‘differences between
academic field’, the disciplinary area was extracted for each candidate. Finally, regarding the ‘doctoral
programme and the research environment’, the wider university environment was considered.
Data analyses
We used survival methods as a novel approach for analysis of the PhD completion data (
n = 2770). This
is an appropriate method to use for data extracted on a particular date (the census), where all data can
be used for inference including data for those who have not yet submitted or completed their PhD. The
influence of variables on submission times can also be statistically assessed. Finally, the use of models
with multiple variables means that the observed effects of each characteristic are all adjusted for the
link to page 9 link to page 10 link to page 10 link to page 10 link to page 10
98
R. SPRONKEN-SMITH ET AL.
others. Survival methods using Cox regression allowed analysis of the probability of PhD submission
and completion, and whether various factors relating to PhD candidates and the academic field had
an influence. Descriptive statistics (excluding the 520 candidates still continuing,
n = 2250) were also
produced for completion data including submission percentages, 4 year submission rates, median
candidacy and completion times, and interquartile ranges.
Estimates produced from the survival method are hazard rate ratios which compare submission or
completion rates (i.e. the speed of submitting or completing within the time of the study). The two
Cox regression models (submission and completion) included terms for gender of the candidate, age
at admission, citizenship, enrolment status, scholarship and academic field. Stata v13 (StataCorp, Stata
Statistical Software: Release 13. College Station, TX: StataCorp LP2013) was used for all analyses.
Results
In this section we first report the enrolment numbers and characteristics of the cohorts and then con-
sider the completion statistics, focusing on submission percentages and candidacy times for brevity.
We then present the findings of the survival analysis regarding factors influencing submission rates.
Enrolment numbers and characteristics of the cohorts
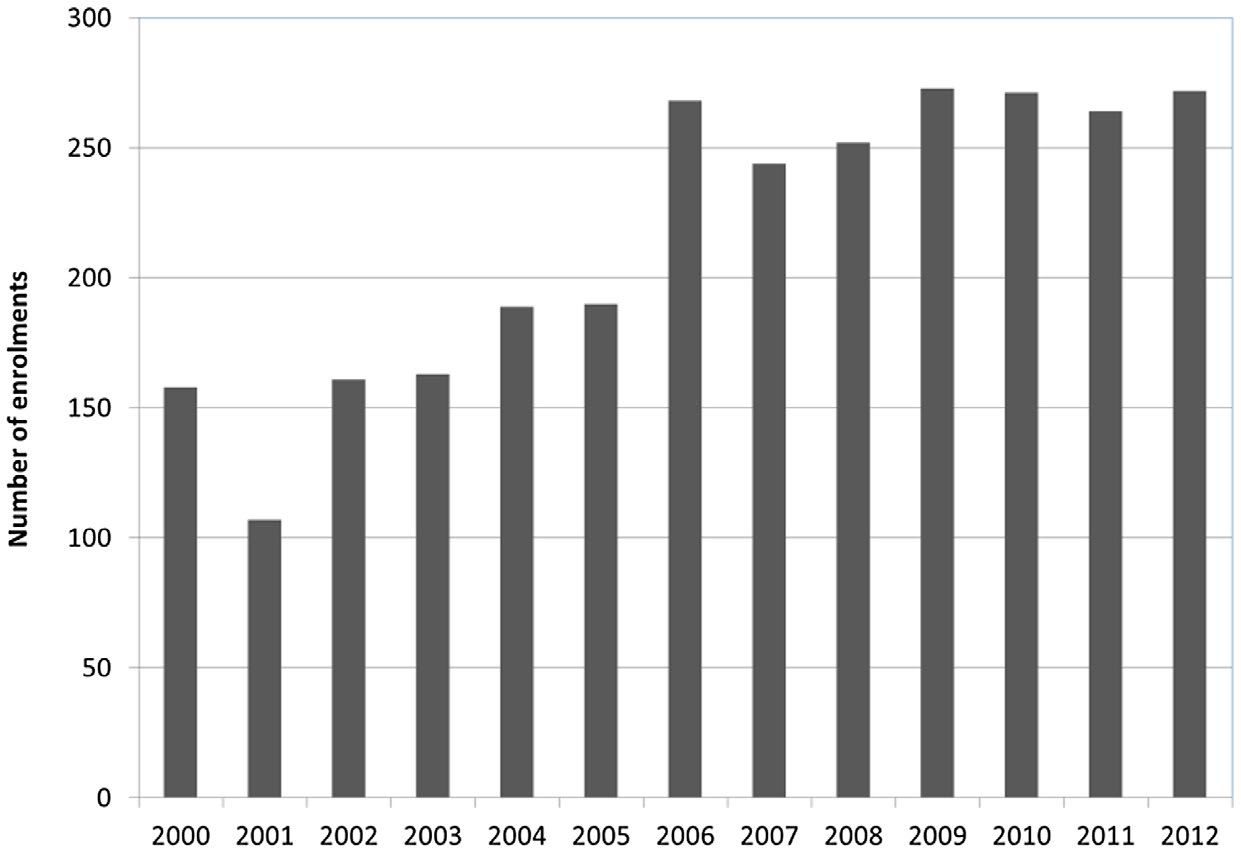
For the period 2000–2012, the number of candidates enrolling for their first year in a PhD at Otago
climbed from 158 to 272 (Figure
1). There were roughly even numbers of men and women enrolled in
the PhD (Figure
2(a)), and most PhD candidates were full-time, although a number of candidates had
variable enrolment (i.e. periods of full-time and part-time study), and a smaller fraction (about 10%)
were purely part-time (i.e. 0.5 EFT) (Figur
e 2(b)). It is notable that, while most candidates began study
full-time, many switched to part-time once their scholarship ran out or employment opportunities
arose. This is why we see higher variable enrolment for earlier cohorts; candidates in later cohorts
nearer to the census date are more likely to be full-time. Figure
2(c) reveals a considerable growth in
international candidates, particularly since 2006, which is when the government introduced domestic
fees for international PhD candidates. Most PhD candidates were enrolled in the health science and
science academic fields, followed by humanities and then commerce (Figur
e 2(d)).
Downloaded by [University of Otago] at 19:10 28 November 2017
Figure 1. enrolment numbers of new Phd candidates for cohorts from 2000 to 2012.
link to page 10
ASSESSMENT & EVALUATION IN HIGHER EDUCATION
99
Figure 2. characteristics of Phd cohorts: (a) gender; (b) enrolment status; (c) citizenship and (d) academic field.
Downloaded by [University of Otago] at 19:10 28 November 2017
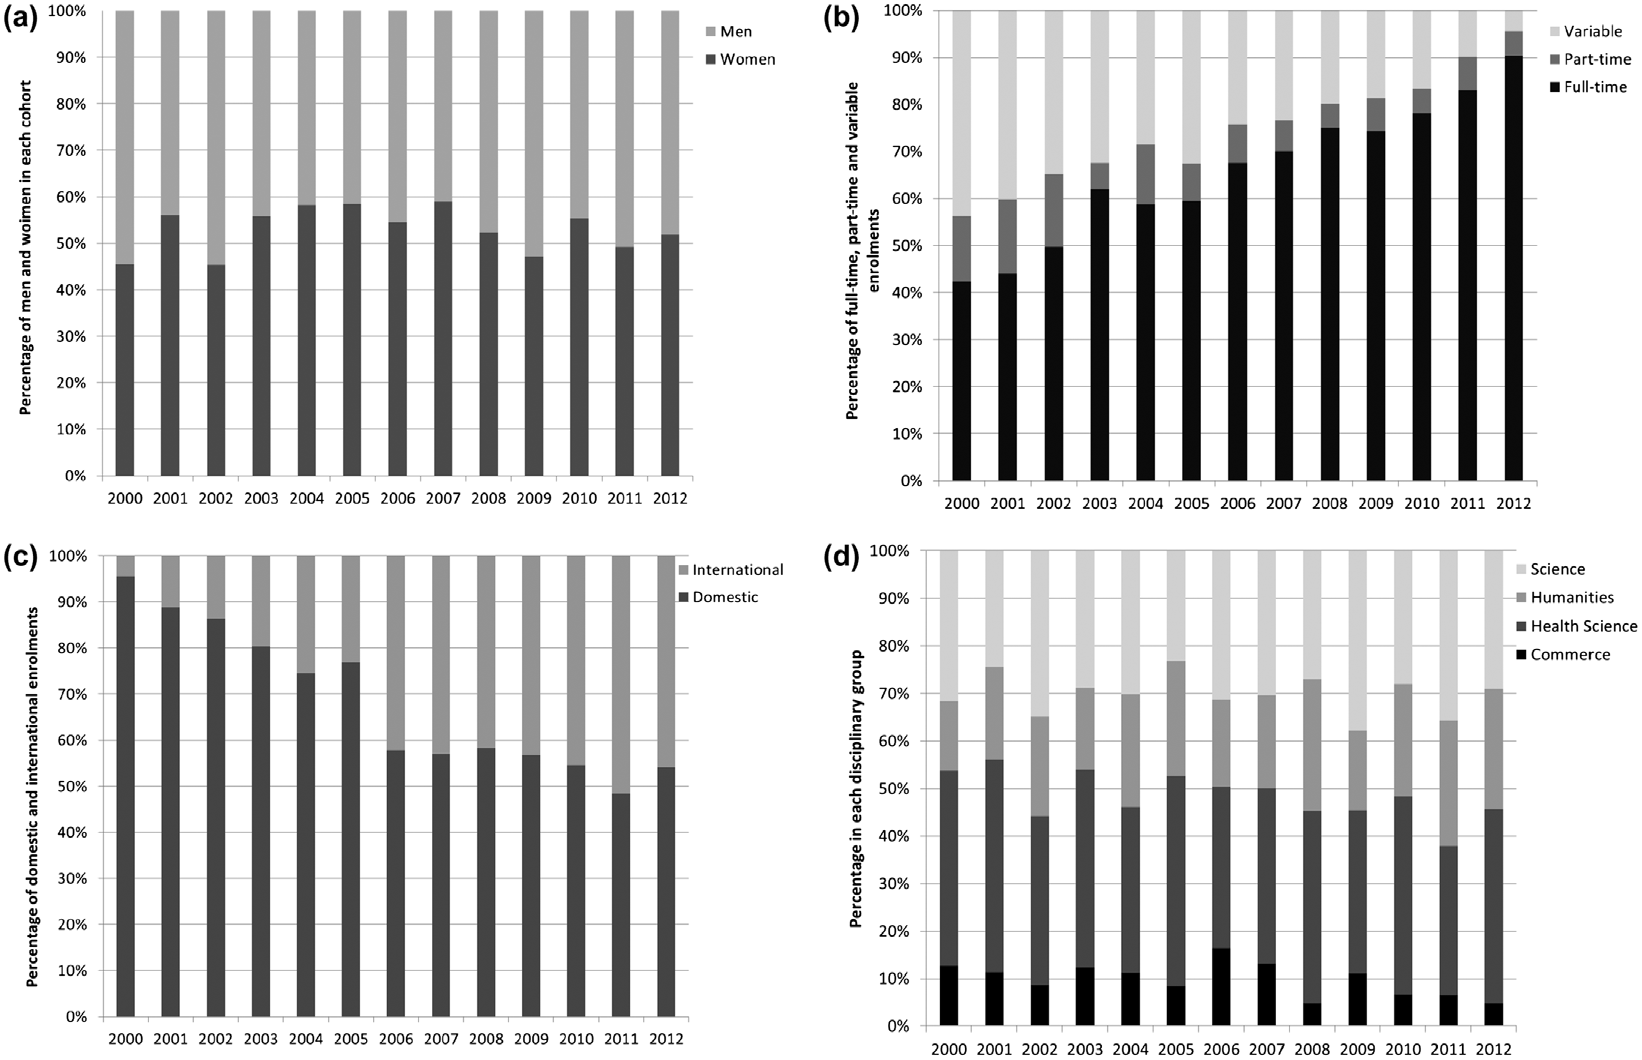
Figure 3. Age (in years) at admission of new Phd candidates for cohorts from 2000 to 2012.
As Figure
3 shows, about a third of new PhD candidates were aged 18–25 years, with another
25–30% in the 26–30 year bracket. A fairly consistent 15% were aged 31–35 years, with about 10%
aged 36–40 years and 12% 41–50 years. Only 5% were over 50 years old.
link to page 11 link to page 12 link to page 11 link to page 12
100
R. SPRONKEN-SMITH ET AL.
Submission and completion statistics
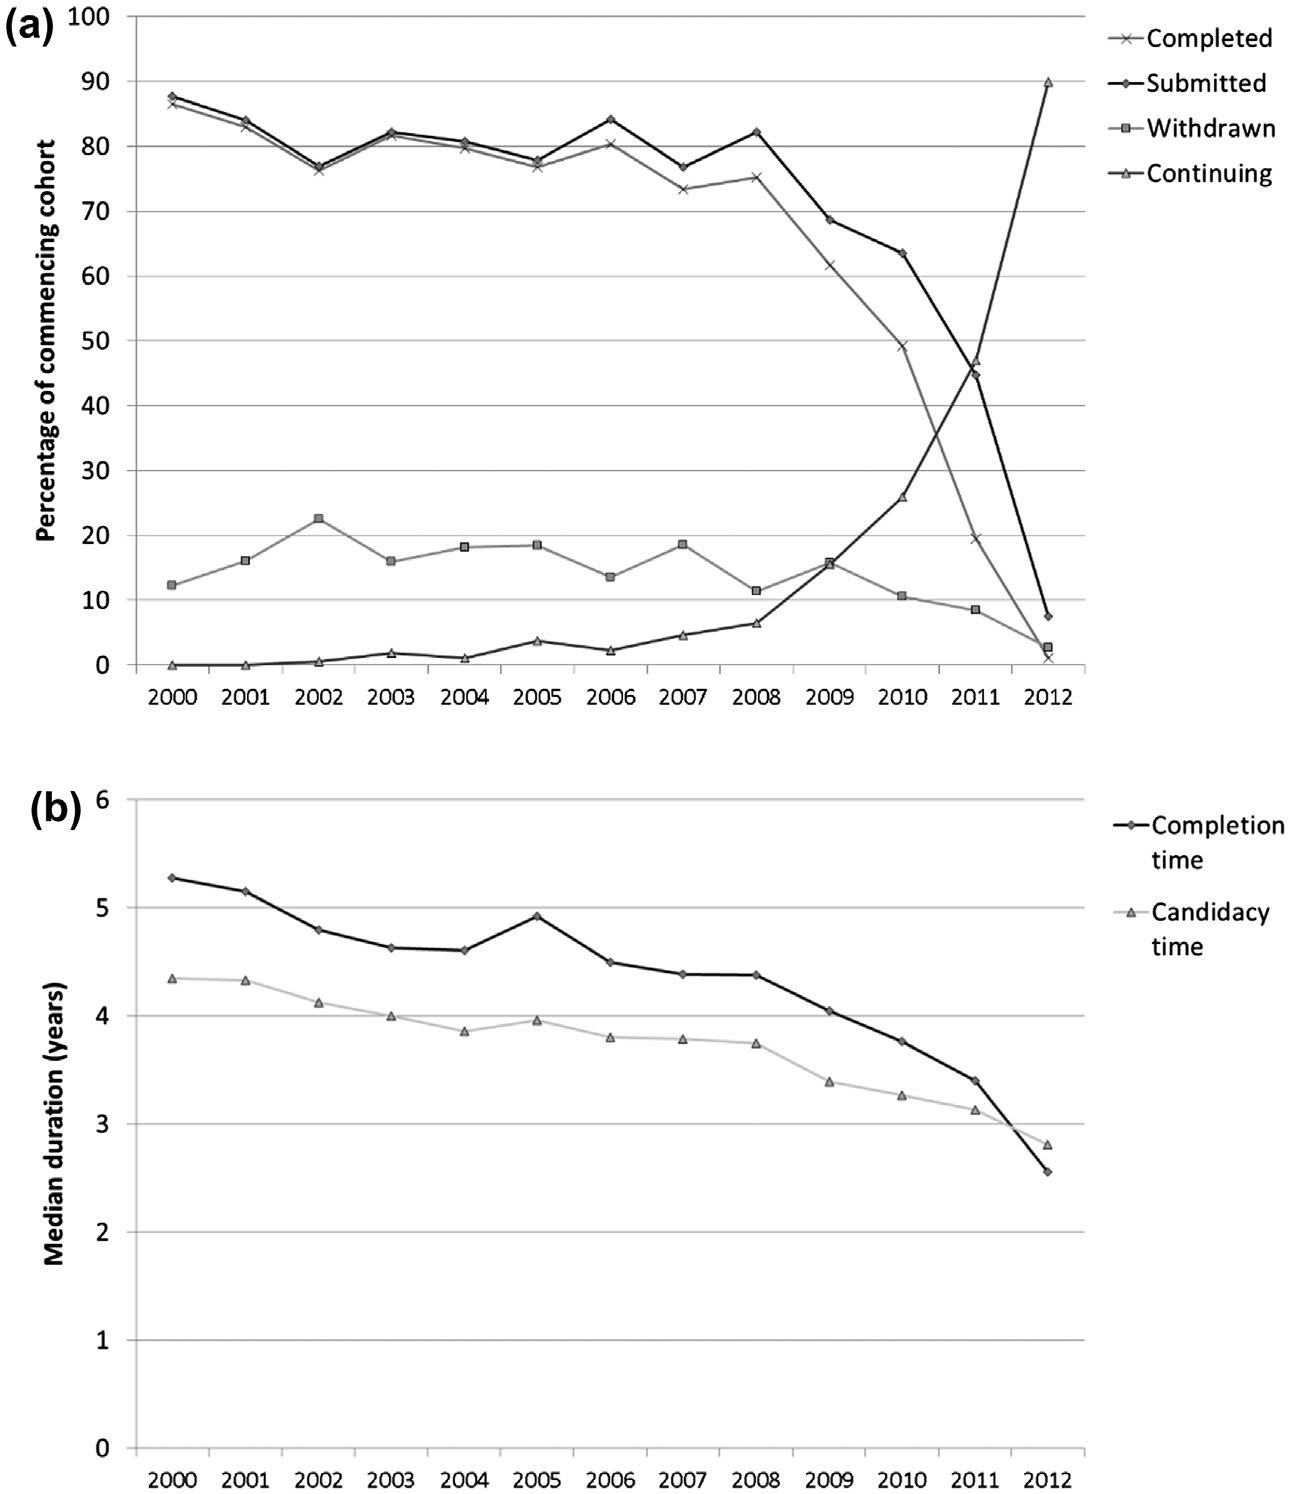
Figure
4(a) shows high submission percentages for PhD cohorts from 2000 to 2008. For these cohorts,
77–88% submitted their theses, 73–86% completed their degree and only 11–23% withdrew. For the
2000–2008 cohorts, the average submission percentage was 81%, with 79% completing, 16% withdraw-
ing and an average 2% still studying. From 2009 on the submission percentages fall as some candidates
(particularly part-timers) are still continuing. As T
able 2 shows, for the 2250 candidates from the 2000
to 2012 cohorts who had either completed or withdrawn, the submission percentage was 83% (17%
withdrew). The most common reasons for withdrawing were personal circumstances (17%), transfer to
Master’s degree (10%), loss of contact with the candidate which meant the University withdrew them
(8%), and 7% for each of lost interest/motivation, medical reasons and work commitments. Figure
4(b)
shows the median completion time for the whole cohort (i.e. including all enrolment types) is 4.4 years
(i.e. 4 years 5 months), about six months longer than the median candidacy time (3.7 years) (Table
3).
The completion time is longer because it includes periods of deferral, and the examination period,
including time for corrections. The median candidacy time has been decreasing steadily from 4.4 years
for the 2000 cohort to 3.3 years for those beginning in 2009.
Downloaded by [University of Otago] at 19:10 28 November 2017
Figure 4. (a) Percentages completing, submitting, withdrawn and continuing and (b) median candidacy and completion times, for
Phd cohorts from 2000 to 2012 as of January 2015.
link to page 20 link to page 20 link to page 20
ASSESSMENT & EVALUATION IN HIGHER EDUCATION
101
Table 2. Average submission and withdrawal percentages for the 2000–2012 cohorts (excluding the 520 candidates still continuing
in January 2015).
Characteristic
Variable (
n)
Percentage submitting (withdrawing)
enrolment
All candidates (
n = 2250)
83 (17)
Full-time (
n = 1544)
83 (17)
Part-time (
n = 164)
67 (34)
variable (
n = 542)
88 (12)
gender
men (
n = 1053)
82 (18)
Women (
n = 1197)
85 (15)
citizenship
domestic (
n = 1468)
83 (17)
international (
n = 782)
84 (16)
scholarship status
otago scholarship (
n = 1245)
86 (14)
no otago scholarship (
n = 1005)
80 (20)
Academic field
Health science: science: Humanities: commerce (
n = 871:
88: 84: 79: 74 (12: 16: 21: 27)
695: 450: 234)
Table 3. median candidacy and completion times for Phd cohorts from 2000 to 2012 (excluding the 520 candidates still continuing
in January 2015).
Median candidacy time in
Median completion time in
Characteristic
Variable (
n)
years (interquartile range)
years (interquartile range)
enrolment
All candidates (
n = 2250)
3.7 (3.2, 4.5)
4.4 (3.7, 5.4)
Full-time (
n = 1544)
3.4 (3.0, 4.0)
4.1 (3.6, 4.7)
Part-time (
n = 164)
5.6 (4.2, 6.7) = 2.8 eFt
6.1 (4.7, 7.8) = 3.0 eFt
variable (
n = 542)
4.5 (3.8, 5.5)
5.5 (4.5, 6.7)
gender
men (
n = 1053)
3.7 (3.1, 4.4)
4.4 (3.7, 5.4)
Women (
n = 1197)
3.7 (3.2, 4.5)
4.4 (3.8, 5.4)
citizenship
domestic (
n = 1468)
3.9 (3.3, 4.9)
4.6 (3.9, 5.7)
international (
n = 782)
3.4 (3.0, 3.9)
4.1 (3.6, 4.7)
scholarship status
otago scholarship (
n = 1245)
3.5 (3.1, 4.2)
4.2 (3.7, 5.1)
no otago scholarship (
n = 1005)
4.0 (3.3, 5.0)
4.7 (3.9, 5.9)
Academic field
Health sci. (
n = 871)
3.8 (3.2, 4.6)
4.4 (3.8, 5.4)
science (
n = 695)
3.6 (3.1, 4.3)
4.2 (3.7, 5.1)
Humanities (
n = 450)
3.7 (3.2, 4.7)
4.6 (3.9, 5.9)
commerce (
n = 234)
3.5 (3.0, 5.2)
4.4 (3.7, 5.7)
Some researchers (e.g. Bourke et al
. 2004) assume that the completion percentage is the same as the
submission percentage, but in our case there is a small 2% difference. Although very few candidates at
Otago who submit their thesis for examination fail (less than 0.05%), about 5–6% receive a revise and
resubmit result; 94–95% typically pass with either minor or major corrections. The revise and resubmit
result necessitates major revisions that can take 6–12 months, and many will never resubmit their thesis.
Downloaded by [University of Otago] at 19:10 28 November 2017
Thus, like Green and Pow
ell (2005), we urge caution with assuming that the completion percentage is
the same as the submission percentage.
The completion statistics from Otago are much better than those reported by the Ministry of
Educa
tion (2007) for earlier cohorts across NZ universities, who estimated that only 60% of PhD candi-
dates completed in 9 years. However, their average hides significant differences between the universities.
For example, some universities have much larger cohorts of part-timers and distance students, which
could lead to lower completion rates. Otago’s completion rates also compare very favourably to overseas
data, with lower attrition than most reported studies from North America, Europe, the UK and Australia.
Factors influencing submission rates
Here we present the results from survival modelling, with the influence of the funding regime on sub-
mission first reported, then candidate characteristics, and finally academic field.
link to page 12 link to page 13 link to page 12 link to page 20 link to page 20 link to page 20 link to page 14
102
R. SPRONKEN-SMITH ET AL.
Table 4. estimates from the cox regression model for the influence of characteristics of the candidates on the rate of submission
and completion.
Submission
Completion
95% confidence
95% confidence
Characteristic
Levels
Hazard Ratio
interval
Hazard Ratio
interval
enrolment
Part-time
1
1.000
Full-time
3.712
(2.97, 4.64)*
3.120
(2.47, 3.94)*
varied
1.482
(1.19, 1.845)*
1.207
(0.957, 1.522)
gender
men
1
1
Women
1.104
(1.007, 1.21)*
1.086
(0.986, 1.196)
Age at admission
1.000
(0.994, 1.006)
0.996
(0.99, 1.002)
citizenship
domestic
1
1
international
1.407
(1.263, 1.568)*
1.232
(1.1, 1.379)*
scholarship
no otago
1
1
scholarship
otago scholarship
1.154
(1.045, 1.274)*
1.189
(1.071, 1.32)*
Academic field
Humanities
1
1
commerce
1.525
(1.266, 1.838)*
1.373
(1.128, 1.671)*
Health science
1.199
(1.048, 1.372)*
1.330
(1.154, 1.533)*
sciences
1.169
(1.017, 1.343)*
1.339
(1.156, 1.551)*
*indicates 95% confidence intervals that do not include 1 (
p < 0.05). selected
p-values are reported in the text.
Funding regime
Several factors combine uniquely at Otago to provide a ‘carrot and stick’ approach. Most New Zealand
universities offer scholarships, and at Otago these include tuition fees, but importantly the scholarship
is available for 3 years. The University scholarship scheme is very competitive meaning only candidates
achieving a high first class average (A or A+) in their Honours or Master’s degrees are likely to be success-
ful. Thus, we believe that candidates on scholarships are of a very high calibre, and across all cohorts,
57% were on a university scholarship during at least some of their candidature.
Candidates with an Otago scholarship have a submission percentage of 86% compared to 80% for
those not on these scholarships (T
able 2). When allowing for enrolment type, gender, age at admission,
citizenship and academic field, survival modelling showed that candidates on a scholarship generally
submitted at a rate 15% higher than those without a scholarship (
p < 0.001) (Table
4). The median can-
didacy time for those on an Otago scholarship was 3.5 years, with 4.0 years for those without (Table
3).
Our findings regarding the importance of funding contrast those of Plato
w (2012), but are similar to
Ehrenberg and Mavros
(1995), and Sheridan and Pyke
(1994), although the latter study found that
increased funding for PhD candidates almost tripled the odds of completing.
Notably, the average percentage of candidates on a University scholarship increased from 43%
(2000–2005) to 64% (2006–2012), with this shift likely contributing to higher submission percentages
Downloaded by [University of Otago] at 19:10 28 November 2017
and faster candidacy times in more recent years. The limitation of scholarship support to only 3 years
provides strong motivation for completion in this time. This is especially the case for international
candidates who also have visa restrictions, with 3.5 years for PhD study.
Alongside the ‘stick’ of the 3 year maximum on scholarship funding, a unique aspect of Otago is
providing a ‘carrot’ with a Postgraduate Publishing Bursary to encourage and reward submission in
less than 4 years EFT. The Bursary provides up to 3 months of funding at the scholarship rate for the
publishing of research outputs.
Enrolment status
Figure
5 shows the influence of enrolment status on submission percentages and candidacy times for
the cohorts. For full-time PhD candidates who have submitted their thesis, 78% did so within 4 years.
However, the 4 year submission rate improves for cohorts post-2005, with an average of 85% full-
time candidates submitting their thesis in 4 years or under. The highest submission percentage is for
candidates on variable enrolment (88%), followed by full-time candidates (83%), with part-timers the
link to page 12 link to page 12 link to page 13 link to page 20 link to page 13
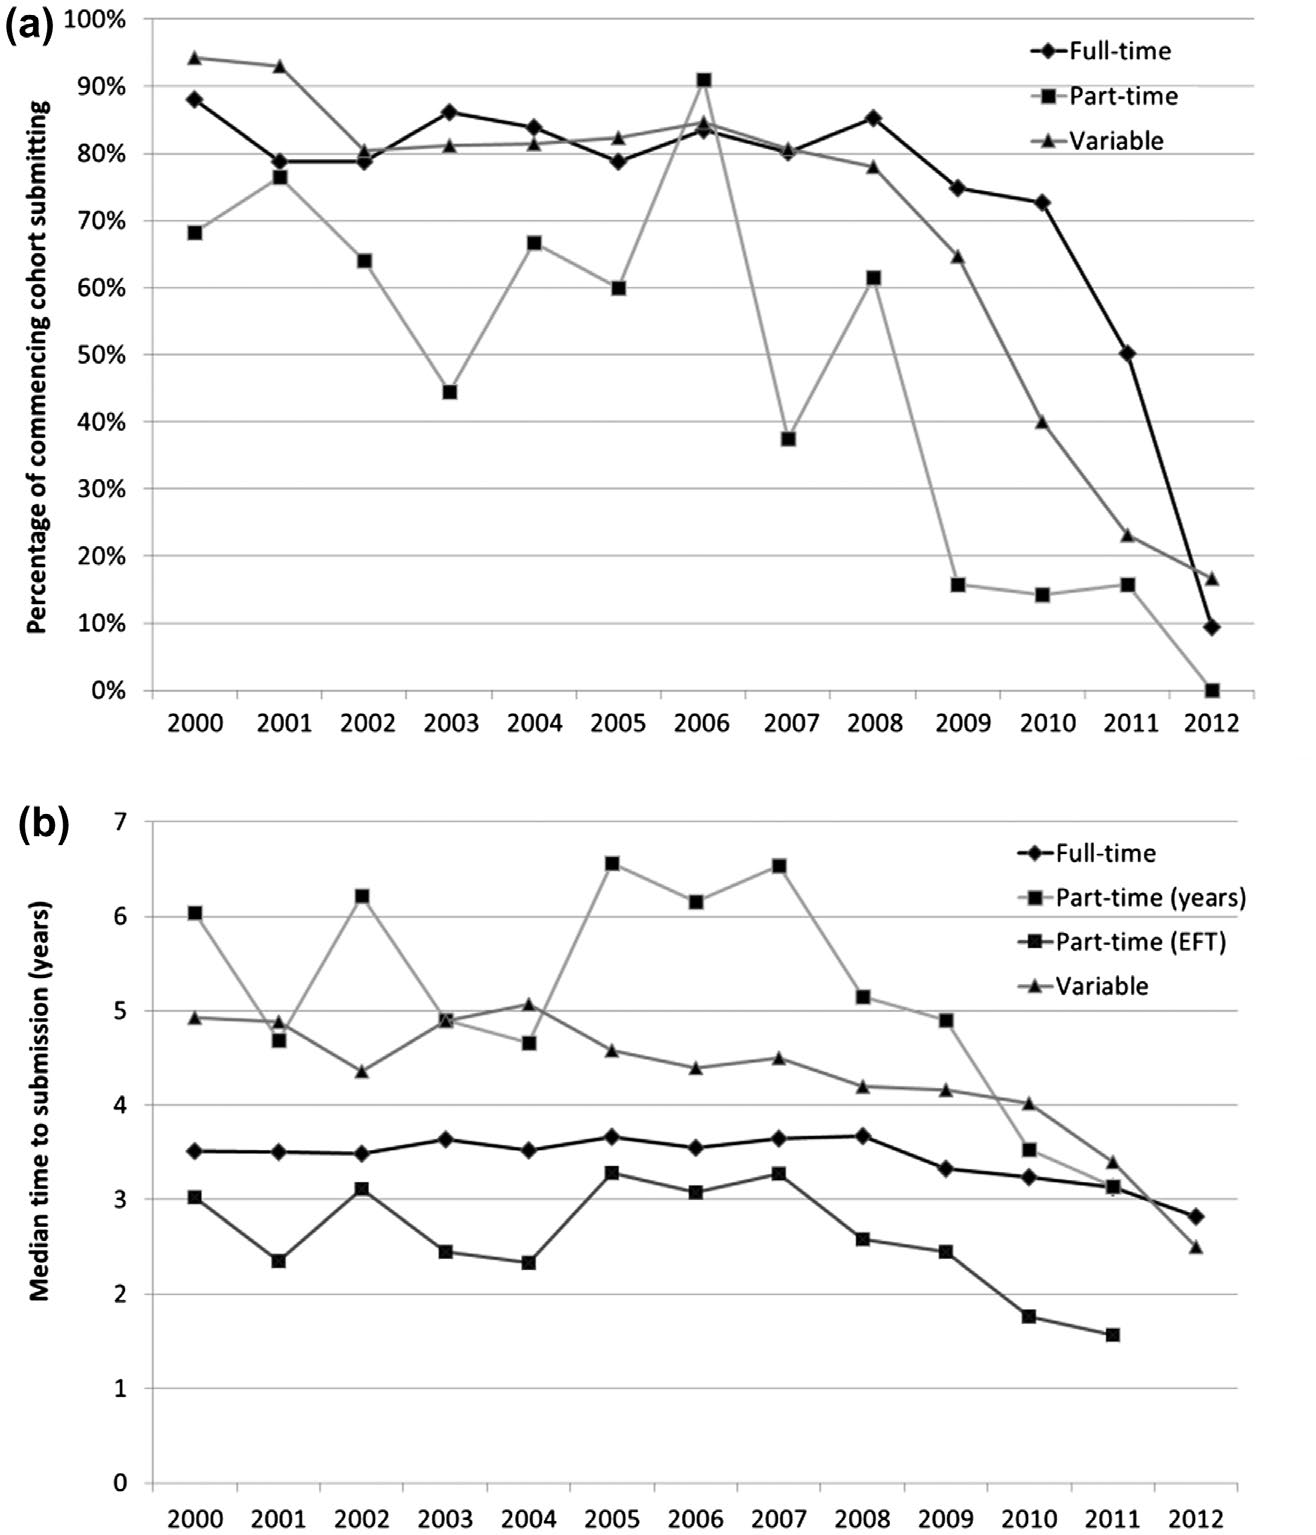
ASSESSMENT & EVALUATION IN HIGHER EDUCATION
103
Figure 5. submission percentages (a) and median candidacy times (b) according to enrolment status.
lowest (67%) (Table
2). Allowing part-time candidature throughout enrolment poses a considerable
risk to completion. As expected, full-time candidates have the fastest candidacy times (median of
Downloaded by [University of Otago] at 19:10 28 November 2017
3.4 years), although in terms of equivalent full time study (EFT), part-time candidates actually submit in
the fastest time (2.8 years) (T
able 3). Estimates from the Cox regression (Table
4) indicate that, on average
(and adjusting for the other variables), full-time candidates submit much faster than part-timers (at a 270%
higher rate), and those on variable enrolment submit at a rate 48% higher than part-timers (
p < 0.001).
Our observation of comparatively fast EFTS candidacy time for part-timers was also noted by Bourke
et al. (
2004), who suggested this may be due to part-time candidates working more than half-time
on their theses. Another possibility is that part-timers are more efficient in their PhD study, due to
competing demands on their time.
Age at admission and gender
When adjusting for gender, citizenship, academic field, enrolment status and whether or not they had
a scholarship, age at admission is not related to submission (
p = 0.932) (T
able 4). Gender has an impact
on the rate of submission with modelling showing that women submit at a 10% higher rate than men
(
p = 0.035). The descriptive data do not reflect this difference, with women and men having a very
link to page 12 link to page 12 link to page 20 link to page 20 link to page 20 link to page 19 link to page 20 link to page 20 link to page 20 link to page 12 link to page 13 link to page 12 link to page 20 link to page 20 link to page 20 link to page 16 link to page 12 link to page 12 link to page 13 link to page 20 link to page 20 link to page 20 link to page 20 link to page 20 link to page 20
104
R. SPRONKEN-SMITH ET AL.
similar candidacy time of 3.7 years (Table
3), but the average submission percentages are higher for
women (85% compared to 82% for men – see Table
2).
Past research on the influence of gender has shown mixed results, with some studies indicating no
influence (e.g. Seagram, Gould, and Pyke
1998; Wao and Onwuegbuzie
2011; Wright and Cochrane
2000), while others have found that women have lower completion percentages (e.g
. Baker 1998), as well as
longer candidacy times (e.g. Jiranek
2010), at least in the science disciplines. Our finding that age at
admission did not have a significant influence on PhD submission, agrees with Wao and Onwuegbuzie
(
2011), and Wright and Cochr
ane (2000), who noted this in 4 year submission rates (younger candidates
were more successful for 10 year rates).
Citizenship (domestic/international)
As shown in Tab
le 2, international candidates have a slightly higher submission percentage than domes-
tic candidates (84 and 83%, respectively). Modelling shows that citizenship has an impact on the sub-
mission rate when all other factors are considered (T
able 4), with international candidates submitting
at a 41% higher rate than domestic candidates (
p < 0.001). The descriptive statistics illustrate this with
a median candidacy time of 3.4 years for international candidates compared to 3.9 years for domestic
candidates (T
able 3). Our findings that citizenship significantly influences PhD completion are in accord
with past research (e.g. Council of Graduate Schools
2008; Jiranek
2010; Platow
2012). Like Jiranek, we
found that international candidates submit their thesis for examination about 6 months faster than
domestic candidates.
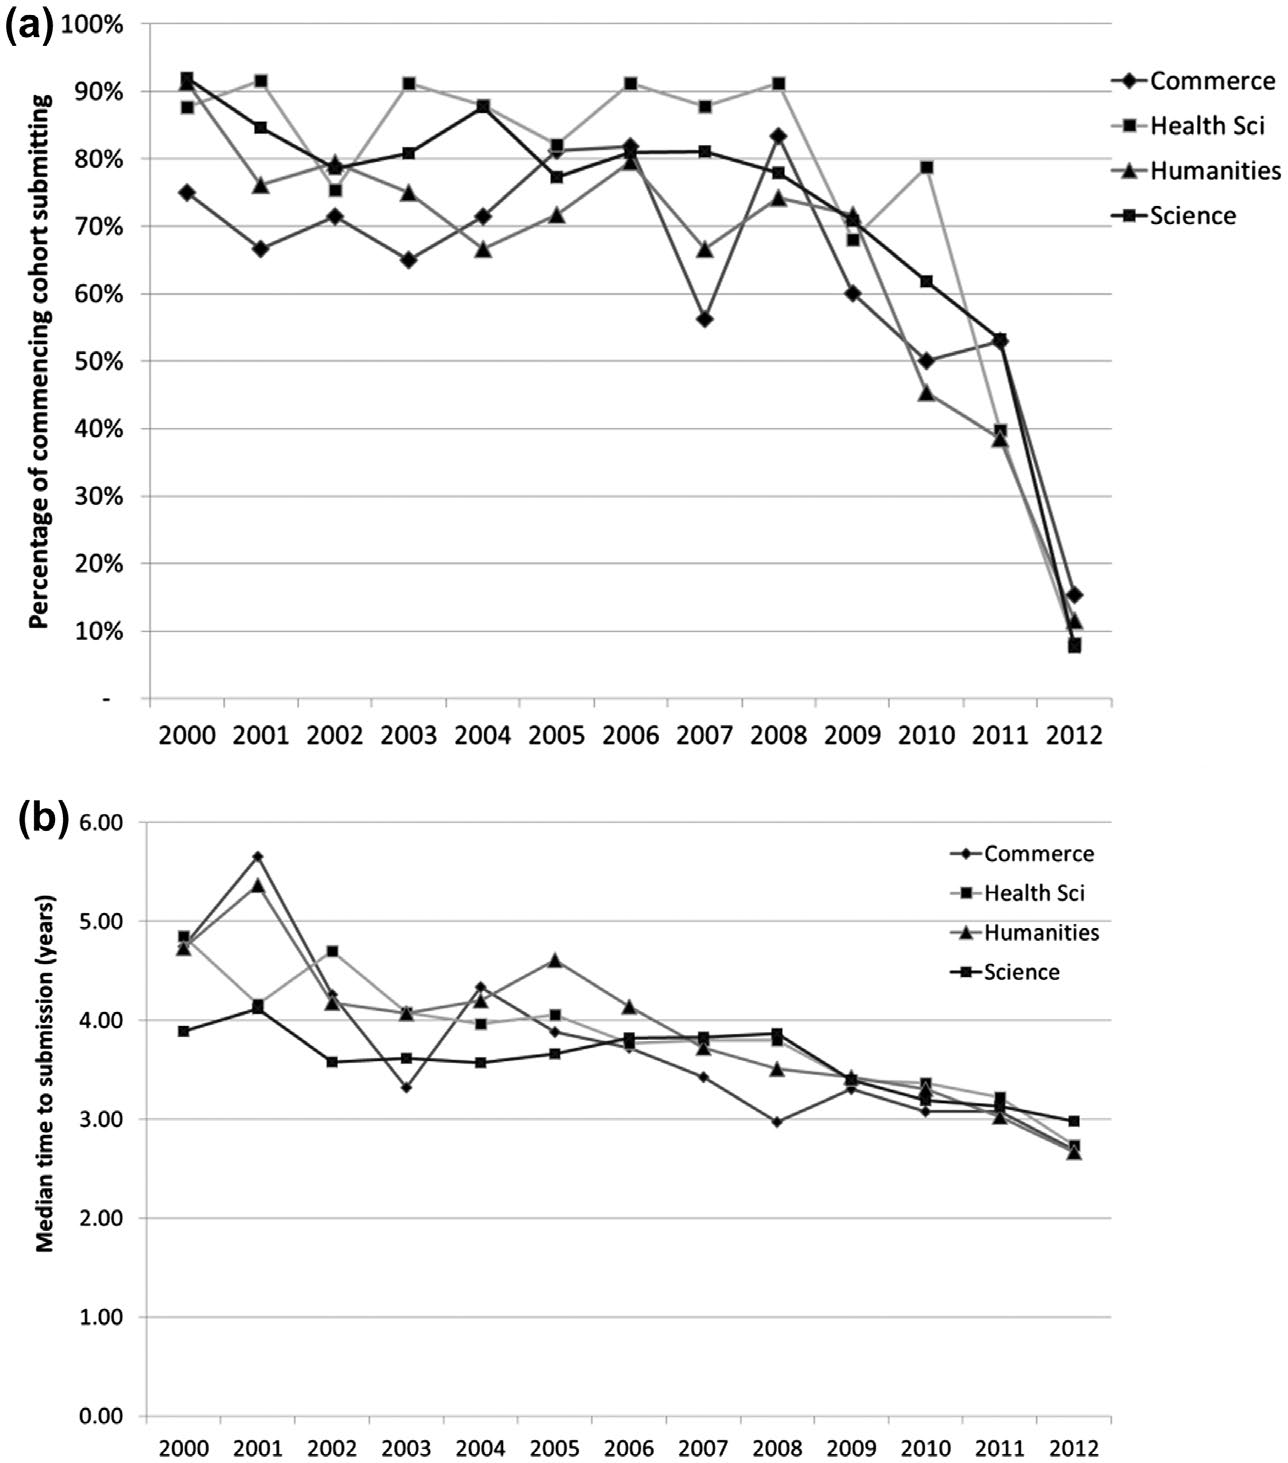
Academic field
The highest submission percentages occur in health science (88%) and science (84%), followed by
humanities (79%) and commerce (74%) (Figure
6(a), Table
2). However, as shown in T
able 3, there is a
different pattern for median candidacy times, with candidates in commerce the fastest, followed by
science, humanities and health science. Modelling results show that, compared to humanities, all other
academic fields submit their PhDs at a higher rate when adjusting for all variables (Table
4). Commerce
is 53% higher than humanities (1.53 (1.27, 1.84),
p < 0.001), health sciences 20% higher (1.20 (1.05,
1.37),
p < 0.008), and sciences is 17% higher (1.17 (1.02, 1.34),
p < 0.028); and, moreover, commerce
submission rates are significantly higher than health science and science. The significant influence of
academic field on submission and completion rates is similar to past research (e.g. Bourke et al.
2004;
Council of Graduate Schools
2008;
Elgar 2003; Golde
2005; Seagram, Gould, and Pyke
1998; Wright and
Cochr
ane 2000), which tends to show better submission or completion percentages for PhD candidates
in the sciences and natural sciences compared to those in arts and humanities.
Downloaded by [University of Otago] at 19:10 28 November 2017
Discussion and implications
Analysis of PhD cohorts at the University of Otago from 2000 to 2012 has revealed high submission
percentages, and fast candidacy and completion times. For the 2250 candidates who had finished at the
time of the census, 83% submitted, with an attrition of 17%. The median candidacy time for full-timers
was 3.4 years. In comparison with published data, these statistics – particularly the candidacy time –
are amongst the best globally. However, as noted earlier, published reports on PhD completions are
rather sparse, different reporting may be used, and many comparative studies are rather dated, making
it difficult to draw definitive conclusions. We continue by discussing the main factors contributing to
high submission rates, provide a cautionary note, and then study limitations.
Factors contributing to high submission rates
Survival modelling showed the most significant factors influencing submission and completion rates
were enrolment status, citizenship, academic field and scholarship funding; gender and age at admis-
sion had a more minor or negligible influence. Regarding enrolment status, the main risk factor was
ASSESSMENT & EVALUATION IN HIGHER EDUCATION
105
Figure 6. submission percentages (a) and median candidacy times (b) according to academic field.
part-time enrolment for the
duration of study; only 67% of part-time candidates submitted compared
to 83% full-time. However, it was notable that the highest submission percentages (88%) occurred for
candidates with variable enrolment. Most of these candidates started their candidacy studying full-
Downloaded by [University of Otago] at 19:10 28 November 2017
time, but later switched to part-time, often once their scholarship ran out or employment opportunities
arose. Having mainly full-time candidates and allowing
periods of part-time enrolment appear to be
good strategies for improving submission percentages.
International candidates had higher submission rates than domestic candidates. Although the sub-
mission percentages for international and domestic candidates were similar (84 and 83%, respectively),
the international candidates were much faster to submit (3.4 years compared to 3.9 years). The per-
centage of international candidates increased significantly following the government policy change in
2006, so by 2012 about 45% of the cohort were international. Two factors are likely leading to higher
completion by internationals: better funding and visa restrictions. International candidates are more
likely to pursue a PhD if they secure scholarship funding, and, indeed, for our cohorts at least 70% had
scholarships, compared to 54% for domestic candidates. In NZ, the standard student visa for interna-
tional candidates is 3.5 years, meaning that most candidates will aim to complete within this time to
avoid having to extend their visa. If seeking to improve completion statistics, allowing a large cohort of
international candidates could be one strategy, although this would need to be coupled with scholarship
support. However, the desirability of this strategy will depend on government and university policies.
link to page 20 link to page 20 link to page 20 link to page 20 link to page 20 link to page 20 link to page 20 link to page 20 link to page 20 link to page 20 link to page 20 link to page 19 link to page 20 link to page 20 link to page 19
106
R. SPRONKEN-SMITH ET AL.
The New Zealand government seeks more skilled migrants, so, in 2006, they introduced a policy to allow
international PhD candidates to pay domestic fees, and this led to substantial and continuing growth
in international enrolments. The flow of students is not one way: completing a qualification or postdoc
overseas is almost a rite of passage into academia for New Zealand students. Indeed, NZ universities
have some of the highest rates of foreign-educated or foreign-born academics – over 70% at Otago.
The academic field significantly influenced submission rates, again in keeping with past research
(e.g. Bourke et al.
2004; Council of Graduate Schools
2008; Elgar
2003; Golde
2005; Seagram, Gould, and
Pyk
e1998; Wright and Cochrane
2000). The highest submission percentages were in health science, then
science, humanities and commerce. However, the fastest candidacy times were in commerce (3.5 years),
followed by science, humanities and then health sciences (3.8 years). Past research had revealed strong
disciplinary differences in terms of enrolment status, getting an early start on research, frequency of
supervision meetings, peer support and funding. Regarding enrolment status, in our study only 2% of
candidates were part-time in sciences, 8% in health science, 9% in commerce and 12% in humanities.
Part-time enrolment poses a significant risk to completion and obviously increases candidacy time in
terms of calendar years.
Generally, researchers have noted better funding for PhD candidates in sciences and health sciences,
but in our case only 46% of health science and 67% of science candidates received a scholarship (but
some others will be on research grant funding), with commerce 67%, and humanities 71%. We did note
strong disciplinary differences in the percentage of international candidates, and, because citizenship
effects both submission percentages and times, this is having a significant influence. The PhD cohorts
in commerce had far more international candidates (57%) than any other academic field (science is
43%, humanities 31% and health science 28%), and our analysis has shown faster submission times for
international candidates. The finding of commerce being the fastest discipline to submit echoes the
results of Bourke et al
. (2004) research for an Australian university, where they observed that candidacy
times for full-time candidates in commerce were among the fastest of the academic fields at 3.3 years.
Funding also contributed to high submission rates. Past research has shown mixed results, with
Platow
(2012) noting that having a scholarship did not lead to faster submission amongst 1258 PhD
graduates from the top eight Australian universities, but Ehrenberg and Mavros (
1995) and Sheridan
and Pyke (
1994) finding scholarships did improve completion rates. It may be that the
duration of
the scholarship is an important factor to consider. Survival modelling showed that candidates with a
scholarship submitted at a higher rate (86% compared to 80%), and were faster to submit (3.5 years
compared to 4 years). That the duration of the scholarship is aligned with the target submission period
is a powerful driver for timely submission. However, since the scholarship provides 3 years funding and
the median time to completion at Otago is 3.4 years for full-timers, there is still a shortfall of funding for
many candidates until they submit and can obtain the Postgraduate Publishing Bursary. This can lead
to financial stress, as noted in our population by Cornwall et al. (
2017), and a similar problem occurs in
Downloaded by [University of Otago] at 19:10 28 November 2017
Australia, with scholarship support falling short of time to submission (ACOLA
2016).
There are two other funding-related factors to consider: reward for timely completion and the
broader funding environment. The University encourages timely submission with the Postgraduate
Publishing Bursary providing up to 3 months funding at a scholarship rate for al candidates submitting
in under 4 EFT years. It is also likely that the broader funding environment is driving higher completion
rates. In NZ, the combination of 4 years for submission and candidates paying fees are likely important
drivers for timely completions. In the UK, where some universities have comparable completion rates,
the funding environment is also encouraging submission within 4 years, by providing sanctions to the
university if target submission rates, such as 60 or 70%, are not met (Humphrey, Marshall, and Leonardo
2012). In Australia, partly in response to poor completion rates, the funding regime changed from 5
to 4 EFT years, with 70% of funding weighted to completion (Cuthbert and Molla
2015). Although
domestic PhD candidates have been exempt from tuition fees in Australia, recent funding changes by
government now allow for universities to introduce fees (ACOLA
2016).
Alongside the candidate characteristics, academic field and funding influencing PhD completion
rates, the wider university environment is also considered. As described in the case study setting, there
link to page 19 link to page 20 link to page 20 link to page 20 link to page 20 link to page 19 link to page 20
ASSESSMENT & EVALUATION IN HIGHER EDUCATION
107
is central oversight of PhD candidature by a Graduate Research School. The School ensures high entry
standards are maintained. Internationally, there has been a great deal of concern over entry criteria for
PhD programmes, leading to new pathways into the PhD (e.g. ACOLA
2016). The School also ensures
close monitoring during candidature. One key aspect is requiring a student-supervisor agreement,
and Kehm
(2004) has noted that having contractual relationships between candidates and supervisors
seems to improve submission times and reduce attrition. Another aspect at Otago is having submission
of a research proposal as a common target during the provisional period of enrolment, and Humphrey,
Marshall, and Leonardo
(2012) showed that this action can increase the probability of submitting a
thesis. Annual progress meetings occur every year, and the reports are read by heads of department
and relevant deans, to ensure that any issues such as supervision, resourcing or progress are followed
up. This centralised monitoring is likely assisting the university to achieve overall high submission per-
centages, with a relatively narrow gap between the academic fields (74% in commerce to 88% in health
sciences). If supervisors have ongoing concerns about progress, the candidate is placed ‘under review’,
which involves close monitoring for 3 months, after which, if progress is satisfactory, they continue, or
if not they exit the programme.
The University also provides a range of support for candidates including research and transfera-
ble skills training. Humphrey, Marshall, and Leonar
do (2012) found engagement in research training
increased completion rates, but we did not have the necessary data to establish such a link. Additionally,
the presence of a personal performance coach is a unique aspect of support for PhD candidates at Otago.
The service has proved successful in assisting candidates through difficult times, with an unpublished
internal report showing an associated increase in completion rates.
A cautionary note
It is important to question the assumption that excellent completion rates are indeed desirable.
Although Otago takes pride in the high completion rates, there is a downside to having fast candidacy
times. Recent research by Cornwall et al. (
2017) has found that the pressure to submit may be causing
undue stress in PhD candidates. Even within the first year of study, candidates are aware that they
must try and complete within 3 years, particularly if on scholarship funding. There is also a concern
by some supervisors that 3 years is unrealistic, particularly for experimental work, and that candidates
may submit prematurely (e.g. ACOLA
2016). However, as noted earlier, the examination outcomes have
been very good for Otago over the last decade, with a fairly consistent 95% passing and only 5% failing
their first examination. These examination outcomes seem to negate the conjecture that candidates
are submitting too soon.
The desire for faster completions also goes against the grain of ‘slow scholarship’, a movement argu-
ing that time, unpressured by other demands, is important for scholarly endeavour (Hartman and Darab
Downloaded by [University of Otago] at 19:10 28 November 2017
2012, 49). Yet perhaps PhD study is one of the few places in academia where slow scholarship can occur,
since, at least in the New Zealand and Australian models, the candidate is expected to concentrate
almost solely on their research for about 3 years. However, with PhD curricula becomingly more struc-
tured with research training and with increasing expectations of engagement in teaching, publishing
and outreach activities, the space for slow scholarship may be under threat.
Limitations of the study
A limitation of this study is that data from only one New Zealand university were analysed. However,
while not necessarily representing New Zealand universities, we suspect that the statistics presented
here may be reflective of other research-intensive universities, since these universities share similar
philosophies, funding and approaches towards PhD education. However, future research is required to
investigate this assertion. Additionally, as the literature shows, there are few studies undertaken in this
field, and, with various definitions used, it is difficult to compare findings. We believe that our focus on
link to page 17 link to page 15
108
R. SPRONKEN-SMITH ET AL.
specific rates and the use of survival models means that our study is reliable and provides transparency.
Whilst the quantitative findings reported here are robust, there are limitations to the qualitative findings.
Conclusion
This study aimed to analyse PhD submission and completion data at a research-intensive university
in New Zealand. A strength of the study was the use of survival analysis to provide a rigorous inves-
tigation into factors influencing submission and completion rates. High submission percentages
were observed across the University, with 83% submitting and only 17% withdrawing. Moreover,
candidacy times were fast, with a median of 3.7 years for all cohorts and 3.4 years for full-time
candidates. The findings suggest that PhD completion statistics can be enhanced through factors
such as having mainly full-timers but allowing periods of part-time enrolment near submission,
recruiting a large international cohort, and having a scholarship scheme with a maximum fund-
ing period aligned with the target submission period. There were only minor or negligible effects
of gender and age at admission. Other factors contributing to high completions likely include
recruiting quality candidates, close monitoring during candidature, provision of research training
and a vibrant research culture, a personal performance coach for PhD candidates, high-quality
supervision, and funding incentives for candidates who submit in under 4 years.
Future research should explore completion data for other New Zealand universities, to see if they also
experience high completion rates. Also, it would be helpful to interview PhD graduates and supervisors
to ascertain their views on whether aiming for completion in 3–4 years is appropriate, and, if so, what
factors aid timely completion. Finally, we suggest that PhD programme models that focus on super-
vised research may be the only bastion in academia for slow scholarship, but this assertion should be
explored, particularly in the context of recent changes in research training.
Acknowledgements
Thanks to Gregory Scott (who died during this research) for creating and maintaining the database for PhD candidates,
as well as extracting data for this analysis. Thanks also to Karen Nairn and Sarah Stein and anonymous reviewers for their
feedback on the manuscript.
Disclosure statement
No potential conflict of interest was reported by the authors.
Notes on contributors
Downloaded by [University of Otago] at 19:10 28 November 2017
Rachel Spronken-Smith is a professor of Higher Education and Geography, and is the dean of the Graduate Research School
at the University of Otago. She provides leadership for doctoral education and facilitates the professional development of
students and supervisors. Her current research in higher education includes doctoral education, learning through inquiry,
graduate outcomes and curriculum change.
Claire Cameron has a PhD in Statistics and is a senior research fellow and Biostatistician in the Health Sciences Division
at the University of Otago. She provides biostatistical advice, collaboration and student supervision largely within the
health-related research. This results in a broad range of research interests and collaborations based on the statistical
needs of the projects.
Robin Quigg has a PhD in Epidemiology and is a manager in the Division of External Engagement at the University of Otago.
She maintains research links with the Department of Preventive and Social Medicine, Human Nutrition and Geography.
References
ACOLA (Australian Council of Learned Academies).
2016.
Review of Australia’s Research Training System. Melbourne: ACOLA.
Baker, J
. G. 1998. “Gender, Race and Ph.D. completion in Natural Science and Engineering.”
Economics of Education Review
17: 179–188.
link to page 5 link to page 17 link to page 6 link to page 17 link to page 13 link to page 6 link to page 6 link to page 15 link to page 12 link to page 18 link to page 17 link to page 15 link to page 6 link to page 6 link to page 6 link to page 7 link to page 5 link to page 13 link to page 15 link to page 13 link to page 15 link to page 15
ASSESSMENT & EVALUATION IN HIGHER EDUCATION
109
Bourke, S., A. Holbrook, T. Lovat, and P. Farley.
2004. “Attrition, Completion and Completion times of PhD Candidates.” Paper
Presented at the AARE Annual Conference, Melbourne, November 28–December 2.
Cornwall, J., B. Mayland, J. van der Meer, R. Spronken-Smith, C. Tustin, and P.
Blyth. 2017. “Stressors in Early-stage Doctoral
Students at a New Zealand University.”
Review of Higher Education (submitted).
Council of Graduate Schools.
2008. “PhD Completion and Attrition: Analysis of Baseline Data.” Presentation at NSF Workshop,
March 31. Accessed Apr
il 20, 2015. http://www.phdcompletion.org/resources/cgsnsf2008_sowell.pdf
Cuthbert, D., and T. Molla.
2015. “PhD Crisis Discourse: A Critical Approach to the Framing of the Problem and Some
Australian ‘Solutions’.”
Higher Education 69 (1): 33–53.
Ehrenberg, R. G., and P. Mavros.
1995. “Do Doctoral Students’ Financial Support Patterns Affect Their times-to-Degree and
Completion Probabilities?”
The Journal of Human Resources 30: 581–609.
Elgar, F. J
. 2003. PhD Degree Completion in Canadian Universities: Final Report. Dalhousie, CA: Graduate Students Association
of Canada.
Fuller,
M. 2015. “Doctoral Education in the UK: Ideal Models and the Stark Reality.” Presentation at the Australian DDOGS
Meeting, Sydney, April 19–20. Accessed May 18, 2015.
https://www.ukcge.ac.uk/documents/DDoGS%202015%20-%20
Fuller.pdf
Golde
, C. M. 2005. “The Role of the Department and Discipline in Doctoral Student Attrition: Lessons from Four Departments.”
The Journal of Higher Education 76 (6): 669–700.
Green, H., and S. Powell.
2005.
Doctoral Study in Contemporary Higher Education. New York: Society for Research into Higher
Education & Open University Press.
Hartman, Y., and S. Darab.
2012. “A Call for Slow Scholarship: A Case Study on the Intensification of Academic Life and Its
Implications for Pedagogy.”
Review of Education, Pedagogy, and Cultural Studies 34 (1–2): 49–60.
Humphrey, R., N. Marshall, and L. Leonardo
. 2012. “The Impact of Research Training and Research Codes of Practice on
Submission of Doctoral Degrees: An Exploratory Cohort Study.”
Higher Education Quarterly 66 (1): 47–64.
Jiranek, V.
2010. “Potential Predictors of Timely Completion among Dissertation Research Students at an Australian Faculty
of Sciences.”
International Journal of Doctoral Studies 5: 1–13.
Kehm, B.
2004. “Developing Doctoral Degrees and Qualifications in Europe: Good Practices and Issues of Concern – A
Comparative Analysis.” In
Doctoral Studies and Qualifications in Europe and the United States: Status and Prospects, edited
by J. Sadlak, 279–298. Bucharest: UNESCO-CEPES.
Kyvik, S., and T. B. Olsen.
2014. “Increasing Completion Rates in Norwegian Doctoral Training: Multiple Causes for Efficiency
Improvements.”
Studies in Higher Education 39 (9): 1668–1682.
Martin, Y. M., M. Maclachan, and T. Karmel.
1999.
Postgraduate Completion Rates. Occasional Paper Series, 2001D. Canberra:
Department of Education, Training and Youth Affairs.
Ministry of Educa
tion. 2007. Persistence in Doctoral Research. Analysing the Impact of the PBRF on the Retention of Doctoral
Students. Wellington: MOE.
Palmer, N.
2015.
Degree Completion as an Indication of Quality. Unpublished Report. Canberra: Australian National University.
Platow
, M. 2012. “PhD Experience and Subsequent Outcomes: A Look at Self-perceptions of Acquired Graduate Attributes
and Supervisor Support.”
Studies in Higher Education 37 (1): 103–118.
Seagram, B. C., J. Gould, and S. W. Pyke
. 1998. “An Investigation of Gender and Other Variables on Time to Completion of
Doctoral Degrees.”
Research in Higher Education 39 (3): 319–335.
Sheridan,P. M., and S. W. Pyke.
1994. “Predictors of Time to Completion of Graduate Degrees.”
Canadian Journal of Higher
Education XXIV-2: 68–87.
Wao, H. O., and A. J. Onwuegbuzie
. 2011. “A Mixed Research Investigation of Factors Related to Time to the Doctorate in
Education.”
International Journal of Doctoral Studies 6: 115–134.
Downloaded by [University of Otago] at 19:10 28 November 2017
Wright, T., and R. Cochrane.
2000. “Factors Influencing Successful Submission of PhD Theses.”
Studies in Higher Education
25: 181–195.
Document Outline